largest dedicated owner of medical office properties
TRANSCRIPT

Healthcare Trust of America, Inc.Largest Dedicated Owner of Medical Office Properties
Investor Presentation – February 2018

Leading owner of Medical Office Buildings2
www.htareit.comPAGE 2Investor Presentation | February 2018
FORWARD LOOKING STATEMENTS
This document contains both historical and forward‐looking statements. Forward‐looking statements are based on current expectations, plans, estimates,
assumptions and beliefs, including expectations, plans, estimates, assumptions and beliefs about our company, the real estate industry, pending
acquisitions, future medical office building performance and the debt and equity capital markets. All statements other than statements of historical fact
are, or may be deemed to be, forward‐looking statements within the meaning of Section 27A of the Securities Act of 1933, as amended, and Section 21E of
the Securities Exchange Act of 1934, as amended.
Forward‐looking statements include information concerning possible or assumed future results of operations of our Company. The forward‐looking
statements included in this document are subject to numerous risks and uncertainties that could cause actual results to differ materially from those
expressed or implied in the forward‐looking statements. Assumptions relating to the foregoing involve judgments with respect to, among other things,
future economic, competitive and market conditions and future business decisions, all of which are difficult or impossible to predict accurately and many of
which are beyond our control. Although we believe that the expectations reflected in such forward‐looking statements are based on reasonable
assumptions, our actual results and performance could differ materially from those set forth in the forward‐looking statements. Factors which could have a
material adverse effect on our operations and future prospects include, but are not limited to: changes in economic conditions affecting the healthcare
property sector, the commercial real estate market and the credit market; our ability to complete our pending acquisitions; competition for acquisition of
medical office buildings and other facilities that serve the healthcare industry; economic fluctuations in certain states in which our property investments
are geographically concentrated; retention of our senior management team; financial stability and solvency of our tenants; supply and demand for
operating properties in the market areas in which we operate; our ability to acquire properties, and to successfully operate those properties once acquired;
changes in property taxes; legislative and regulatory changes, including changes to laws governing the taxation of REITs and changes to laws governing the
healthcare industry; fluctuations in reimbursements from third party payors such as Medicare and Medicaid; changes in interest rates; the availability of
capital and financing; restrictive covenants in our credit facilities; changes in our credit ratings; our ability to remain qualified as a REIT; and the risk factors
set forth in our 2016 Annual Report on Form 10‐K filed on February 21, 2017.
Forward‐looking statements speak only as of the date made. Except as otherwise required by the federal securities laws, we undertake no obligation to
update any forward‐looking statements to reflect the events or circumstances arising after the date as of which they are made. As a result of these risks
and uncertainties, readers are cautioned not to place undue reliance on the forward looking statements included in this document or that may be made
elsewhere from time to time by, or on behalf of, us.
For definitions of terms and reconciliations for certain financial measures disclosed herein, including, but not limited to, funds from operations (FFO),
normalized funds from operations (Normalized FFO), annualized base rents (ABR), net operating income (NOI), and on‐campus/aligned, please see our
Company’s earnings press release issued on February 15, 2018 and our Company’s Supplemental Financial Package for the quarter ended December 31,
2017, each of which is available in the investor relations section of our Company’s website located at www.htareit.com.

Leading owner of Medical Office Buildings3
www.htareit.comPAGE 3Investor Presentation | February 2018
HTA: LARGEST DEDICATED OWNER OF MEDICAL OFFICE
20+
KEY MARKETSNATIONWIDE
24+
MILLION SQUARE FEET
STEADY FINANCIAL PERFORMANCE
High tenant retentionConsistent same store growth Limited capital requirement
Healthcare is growing and moving outpatient
Fragmented MOB sector provides opportunity for industry leadership
OUTPATIENT MEDICAL IS GROWING
Property Management, Engineering, Leasing & Development Drives Efficiencies & Consistent Growth
OPERATING PLATFORM WITH
SCALE
INVESTMENT GRADE BALANCE
SHEET
Strong Balance Sheet with Financial Flexibility
3.1%AVERAGE
SAME STORENOI GROWTH

Leading owner of Medical Office Buildings4
www.htareit.comPAGE 4Investor Presentation | February 2018
HIGH QUALITY PORTFOLIO IN KEY MARKETS
On-Campus / Adjacent17M SF(70%)
Community Core Outpatient
7M SF(30%)
CORE REAL ESTATE PORTFOLIO CRITICAL MASS IN KEY GATEWAY MARKETS
HTA PropertiesHTA Markets with ~1 Million+ SF PM Offices
Indianapolis, IN
Boston, MA
Pittsburgh, PA
Greenville, SC
Miami, FL
Atlanta, GA
Houston, TXDallas, TX
Phoenix, AZ
Our focus is in 20-25 gateway markets with superior macroeconomic trends that creates scale for efficient, profitable operations
HTA targets core, critical assets where healthcare is delivered on-campus and increasingly off-campus in community core and academic centered outpatient locations

Leading owner of Medical Office Buildings5
www.htareit.comPAGE 5Investor Presentation | February 2018
EXPERIENCED MANAGEMENT TEAM
HTA’s Executive Leadership Team Has Decades of Experience
Scott D. PetersFounder, Chairman, and CEO
HTA in 2006
CEO of Grubb & Ellis (NYSE), ‘07‐’08
CEO of NNN Realty Advisors, ‘06‐’08
EVP, CFO, Triple Net Properties, Inc., ‘04‐’06
Co‐Founder, CFO of Golf Trust of America, Inc. (AMEX), ’97‐’07
EVP, Pacific Holding Company/LSR, ‘92‐’96
EVP, CFO, Castle & Cooke Properties, Inc. (Dole Food Co.), ‘88‐’92
Robert Milligan, Chief Financial Officer (With HTA Since 2011)
EVP Capital Markets, HTA, ‘11 – ‘14
Vice President, Bank of America Merrill Lynch, ‘07–’11
Senior Analyst / Financial Management Program, General Electric, ‘03 –’07
Amanda Houghton, EVP – Asset Management (With HTA Since 2009)
Manager of Joint Ventures, Glenborough LLC, ‘06–’09
Senior Analyst, ING Clarion, ‘05 –’06
Senior Analyst, Weyerhauser Realty Investors, ‘04–’05
RSM EquiCo and Bernstein, Conklin, & Balcombe, ‘01‐’03
David Gershenson, Chief Accounting Officer(With HTA Since 2012)
SVP Finance / Director of FP&A, HTA, ’14 – ’17 Assistant Controller, HTA ‘12 – ‘14 Senior Manager, BDO USA LLP, ’03 – ’12 Certified Public Accountant – California
Ann Atkinson, SVP – Acquisitions(With HTA Since 2012)
Director of Acquisitions, HTA, ‘12 – ‘16
Real Estate Investment Specialist, JDM Partners, LLC, ’10 –’12
Medical Office Investment Broker, Cassidy Turley (f/k/a Grubb & Ellis), ‘04 –’10
Caroline Chiodo, SVP- Finance(With HTA Since 2018)
SVP Finance, HTA, 2018 Global Research Analyst, Duff&Phelps Investment Management Co. ‘15 – ‘17 Vice President, Sandler Capital Management, ’11 – ’14 Research Analyst, Wells Capital Management, ’04 – ’11

Leading owner of Medical Office Buildings6
www.htareit.comPAGE 6Investor Presentation | February 2018
2007 2008 2009 2010 2011 2012 2013 2014 2015 2016 2017
$413M2.2 MSF
$543M2.9 MSF
$456M2.3 MSF
$802M3.5 MSF
$68M0.3 MSF
$295M1.3 MSF
$398M1.5 MSF
$440M1.2 MSF
$272M0.8 MSF
$701M2.5 MSF
$2.7B 6.8 MSF
2.2 GLA 5.2 GLA 7.4 GLA 10.9 GLA 11.2 GLA 12.6 GLA 14.1 GLA 14.8 GLA 15.5 GLA 17.7 GLA 24.2 GLA
Identified and EstablishedPure Play MOB Strategy
2006–2011: Invested $2.3B, 11.2 MSF
• Cash Buyer During Great Recession• Grew Portfolio with Limited Competition• Attractive Cap Rates lead to Accretive Deals
• Strong Balance Sheet with Low Leverage• Investment Grade Ratings from S&P/Moody’s
Achieving Critical Mass in Key CitiesBuilding Operating Platform
2012–2016: Invested $2.1B, 7.2 MSF
• Shares Listed on NYSE – No Dilutive Equity• In-House Asset Mgmt & Leasing Platform• ~$1B Raised via Equity & Bond Offerings
• 1:2 Reverse Stock Split• ~3% Same-Store Growth
Industry LeaderPositioned For Growth
2017 : Invested $2.7B, 6.8 MSF
• Full Service Platform with Significant Relationships
• Significant Operating Capabilities for Continued Growth
• Significant Same Store Growth Potential• Strong , Conservative Balance Sheet
EntersMiami
Expands Presence in
North Carolina
Expands Presence in New York &
North Carolina
Invested ~>$1BBecomes Largest MOB Owner in New England
Acquires $2.7B MOBs Development
Platform
Expands Presence in
Texas & South Florida
52 PropertiesMidwest, Southeast,
Florida, Arizona,
Texas
Expands Presence in Boston &
Miami
Expands Presence in Boston,
Charleston, Indianapolis,
Raleigh
Enters BostonOpens Atlanta
Regional Office
Expands Presence in
Indianapolis, Dallas,
Houston & Florida
Enters Greenville Expands
Presence in Arizona
Cash Buyer During Downturn
Executes on In-House Platform
Lists Shares on NYSE
Significant SavingsIn-House Platform
Largest MOB Owner & Operator
$1B Capital Allocation1:2 Reverse Stock Split
TSR (1)
45%
TSR (1)
54%
TSR (1)
62%
TSR (1)
132%
TSR (1)
143%
TSR (1)
171%
TSR (1)
190%(12/31/17)
A DECADE OF VALUE CREATION
(1) TSR (total shareholder returns) represents stock appreciation plus the reinvestment of dividends.

Leading owner of Medical Office Buildings7
www.htareit.comPAGE 7Investor Presentation | February 2018
9.0% Annualized Average Total Returns Since First Distribution
Individuals who invested $1,000 with HTA at inception have an investment worth over $2,696 with reinvested dividends at 1/31/18
TRACK RECORD DELIVERING SHAREHOLDER VALUE
Leading owner of Medical Office Buildings8
www.htareit.comPAGE 8Investor Presentation | February 2018
MEDICAL OFFICE SECTOR

Leading owner of Medical Office Buildings9
www.htareit.comPAGE 9Investor Presentation | February 2018
MEDICAL OFFICE PROVIDES ATTRACTIVE RISK AND RETURNS
MOBs Hospitals
Skilled Nursing Sr. Housing

Leading owner of Medical Office Buildings10
www.htareit.comPAGE 10Investor Presentation | February 2018
MEDICAL OFFICE: HEALTHCARE TAILWINDS
Demographics Drive Increased Healthcare Utilization
Aging demographics boost healthcare spending
10,000 people turning 65 every day (4x as many physician visits as younger population)
Millennials are forming families, a key inflection point for healthcare volumes
Average lifespan will surpass 80 by 2020
Healthcare is Moving Outpatient
Focus on Cost-Effective Care – Private Insurers & Government Providers
Outpatient Procedures are Cost Effective - Visits are Increasing
Health Systems & Providers Focused on Convenience – Serving Patients Where They Are
Medical Office is Primary Beneficiary of this trend1,000
1,200
1,400
1,600
1,800
2,000
2,200
100
105
110
115
120
125
130
135
140
145
150
19
89
19
90
19
91
19
92
19
93
19
94
19
95
19
96
19
97
19
98
19
99
20
00
20
01
20
02
20
03
20
04
20
05
20
06
20
07
20
08
20
09
20
10
20
11
20
12
20
13
20
14
OUTPATIENT VISITS ARE INCREASING OVERTIME
Inpatient Admissions/1000 Persons Outpatient Visits/1000 Persons
INPATIENT OUTPATIENT
Source: U.S. Bureau of Labor Statistics
DEMOGRAPHICS SUPPORT INCREASED HEALTHCARE SPENDING(MILLENNIAL AND BOOMER LIFE MILESTONES WILL POSITIVELY IMPACT HEALTHCARE DEMAND)
Average Annual Healthcare Spending Per Person
Source: American Hospital Association

Leading owner of Medical Office Buildings11
www.htareit.comPAGE 11Investor Presentation | February 2018
MEDICAL OFFICE: HEALTHCARE TAILWINDS
Healthcare Spending Expected to Grow
US healthcare spending grew 4.3% in 2016; as a share of the nation’s GDP health spending accounted for 17.9%
Healthcare Expenditures Increasing to 20% of U.S. GDP
Healthcare is Fastest Growing Occupation of U.S. Economy
Healthcare employment is growing 2x faster than any other sector
Healthcare support occupations and practitioners are projected to be the two fastest growing occupational groups during the 2016-2026 decade
The groups are projected to contribute the most new jobs with a combined increase of 2.3 million new jobs
Source: U.S. Centers for Medicare & Medicaid Services
HEALTHCARE SPENDING CONTINUES TO INCREASE(National Healthcare Expenditures 2006 – 2025f)
Source: U.S. Bureau of Labor Statistics
1 IN 4 NEW JOBS CREATED ARE IN HEALTHCARE(Projected U.S. Employment Growth 2016- 2026f)

Leading owner of Medical Office Buildings12
www.htareit.comPAGE 12Investor Presentation | February 2018
HTA: THE LEADER IN THE MEDICAL OFFICE SECTOR
MOB Comparison- Listed by Size of GLA
HTA VTR HCP HCN HR MB RE1 DOC2
MOB GLA (MM SF) 22.8 19.2 18.7 16.1 13.7 13.0 12.3
MOB On-Campus GLA (MM SF) 16.8 13.7 16.4 N/A 10.8 9.0 N/A
Top - 75 MSA's (% of GLA) 94% 73% 89% 86% 89% 75% 65%
Avg SS Growth (since 2012) 3.1% 1.9% 2.2% 2.3% 3.3% N/A 2.3%
Annualized FFO Growth (since 2012) 4.9% 1.5% -5.7% 3.0% 2.7% N/A 11.2%3
Recurring Capex as % of NOI 2017 10.8% 15.5% 19.1% 6.8% 17.6% N/A 4.6%
Moody's / S&P Ratings Baa2 / BBB Baa1 / BBB+ Baa2 / BBB Baa1 / BBB+ Baa2 / BBB N/A Baa3 / BBB-1. M B Real Estate- a private real estate f irm. 2. As of 9/30/2017 3. Since 2014
Note: Competitor Data from Company Filings and HTA's property level analysis
16.813.7
16.4
0.0
10.89.0
0.0
HTA VTR HCP HCN HR MB RE1 DOC2
N/A
22.8
19.218.7
16.113.7
13.0 12.3
N/A

Leading owner of Medical Office Buildings13
www.htareit.comPAGE 13Investor Presentation | February 2018
HTA PORTFOLIO

Leading owner of Medical Office Buildings14
www.htareit.comPAGE 14Investor Presentation | February 2018
12.1%
6.2%
5.9%
5.0%
4.7%
4.0%
4.0%
3.8%
3.5%
3.5%
Dallas
Houston
Boston
Tampa
Atlanta
Indianapolis
Hartford
Phoenix
Denver
Los Angeles
HIGH QUALITYREAL ESTATE PORTFOLIO
Gross real estate investments ($ billions) $7.0
Total portfolio gross leasable area (GLA, millions) 24.1
Key Market and Top 75 MSA exposure (invested $) 94%
Leased rate (%) 92%
ASSET MGMT DRIVES PERFORMANCE
Properties managed by HTA’s in-house asset management 93%
Same-property tenant retention since listing (2012) 78%
Average same-store cash NOI growth since listing (2012) 3.1%
Average remaining lease term for all buildings (years) 5.4
STRONGPERFORMANCE
Annualized NFFO/share growth since 2012 (CAGR) 4.9%
Total Annual Shareholder Returns Since Inception 169%
INVESTMENT GRADE BALANCE SHEET
Credit ratings by Moody’s and Standard & Poor’s Baa2 / BBB
Total Liquidity ($billions) $1.2
Total Net Debt / Total Market Capitalization 29.9%
Total Net Debt / Adjusted EBITDAre 5.9X
70%
On-Campus/Adjacent
30%
PORTFOLIO SNAPSHOT (As of 12/31/17)
Core Community Outpatient
Core-Critical Real Estate Portfolio(% of GLA)
Premiere Gateway Cities – Top 10(% of Invested $)

Leading owner of Medical Office Buildings15
www.htareit.comPAGE 15Investor Presentation | February 2018
Duke Healthcare Portfolio$2.3B - 5.2M SF -– 2Q/3Q 2017
71 primarily on-campus MOBs with strong health
system affiliation Baylor Scott & White (A3) and
Ascension (Aa2). ~90% of the assets located in
HTA’s key markets including Dallas, Houston,
Indianapolis and Atlanta.
Mission Healthcare Portfolio$150M - 262k SF - 3Q 2016
4 fee-simple MOBs located on the campus of
Mission Hospital in Orange County, CA, part of
Providence St. Joseph Health (A1)
Banner Healthcare Portfolio$107M – 606k SF – Q4 2009
20 MOBs located on Banner Health (A2) campuses
in Phoenix, AZ. Have since sold 3 single tenant
MOB’s generating gains of over $40MM.
Dignity Health Portfolio $150M - 591k SF – April 2017
11 MOBs located primarily on Dignity Health (A3)
hospital campuses in Phoenix and Southern
California. Includes the 168k SF McAuley MOB
located on St. Joseph’s Phoenix campus, home to
the Barrow’s Neurological Institute.
Indiana Univ Health Portfolio$90M - 689k SF – Q4 2008
20+ MOB based portfolio primarily affiliated with
IU Health (Aa3) in Indianapolis. Used this market
concentration to establish HTA’s first property
management and leasing office in 2010, growing
occupancy by over 20pts during this period while
holding operating expenses below market
inflation.
Tenet – Miami – Palm Beach Portfolio$63M – 424k SF – Q3 20137 properties located on Tenet
Healthcare campuses in Miami –
Palm Beach, including the 133k SF
Victor Farris building attached to
the Good Samaritan Hospital in
West Palm Beach, FL.
Tampa Developer Portfolio$77M – 197k SF – Q2/Q3 20177 MOBs located primarily on HCA
and Bayfront campuses in Tampa,
FL.
Florida Developer Portfolio$127M – 364k SF – Q4 20137 MOBs located primarily on HCA
hospital campuses in Tampa and
Miami / Palm Beach Florida directly
from a local developer. Included the
150k SF Largo Medical Center MOB
located on HCA’s Largo Medical
Center campus.
Greenville Health Monetization$163M – 856k SF – Q3 2009Greenville Health System (A1) monetized their 16
MOB portfolio in 2009, selling 16 MOB’s to HTA at
a cap rate > 8%.
670 Albany $102M – 161k SF – Q2 2015On-campus research and medical education
building located on the Boston Medical Center
(Baa2)/ Boston University (A1) campus.
Tufts Medical Center MOBs $148M – 252k SF – Q2 2014Two MOB’s attached to the Tufts Medical Center
located in downtown Boston’s Chinatown and
theatre district, including the 154k SF Biewend
Building.
Steward Medical Portfolio $100M – 358k SF – Q2 2012Hospital monetization in which HTA acquired 13
MOB’s primarily located on Steward Healthcare’s
community hospital campuses throughout the
Boston area.
Albany Developer Portfolio$197M – 962k SF – Q4 2010
Acquired 9 MOB’s directly from a local developer
in Albany, NY, primarily affiliated with Albany
Medical Center and Community Care Physicians.
This includes 260k SF Capital Region Healthpark,
one of the first medical malls in the United States.
Yale New Haven Health / Connecticut Portfolio$252M – 891k SF – Q1/Q2 201628 MOBs affiliated with the Yale New Haven
Hospital and Hartford Healthcare. Issued over
$80M in OP unit equity.
KEY INVESTMENTS
Leading owner of Medical Office Buildings16
www.htareit.comPAGE 16Investor Presentation | February 2018
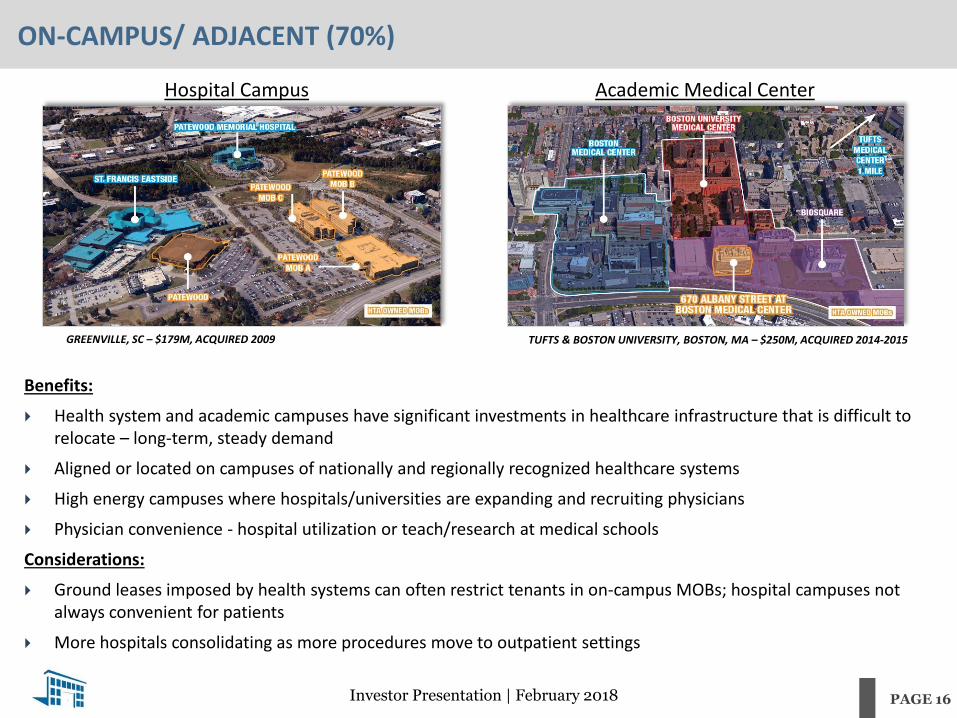
ON-CAMPUS/ ADJACENT (70%)
Benefits:
Health system and academic campuses have significant investments in healthcare infrastructure that is difficult to relocate – long-term, steady demand
Aligned or located on campuses of nationally and regionally recognized healthcare systems
High energy campuses where hospitals/universities are expanding and recruiting physicians
Physician convenience - hospital utilization or teach/research at medical schools
Considerations:
Ground leases imposed by health systems can often restrict tenants in on-campus MOBs; hospital campuses not always convenient for patients
More hospitals consolidating as more procedures move to outpatient settings
GREENVILLE, SC – $179M, ACQUIRED 2009 TUFTS & BOSTON UNIVERSITY, BOSTON, MA – $250M, ACQUIRED 2014-2015
Hospital Campus Academic Medical Center
Leading owner of Medical Office Buildings17
www.htareit.comPAGE 17Investor Presentation | February 2018
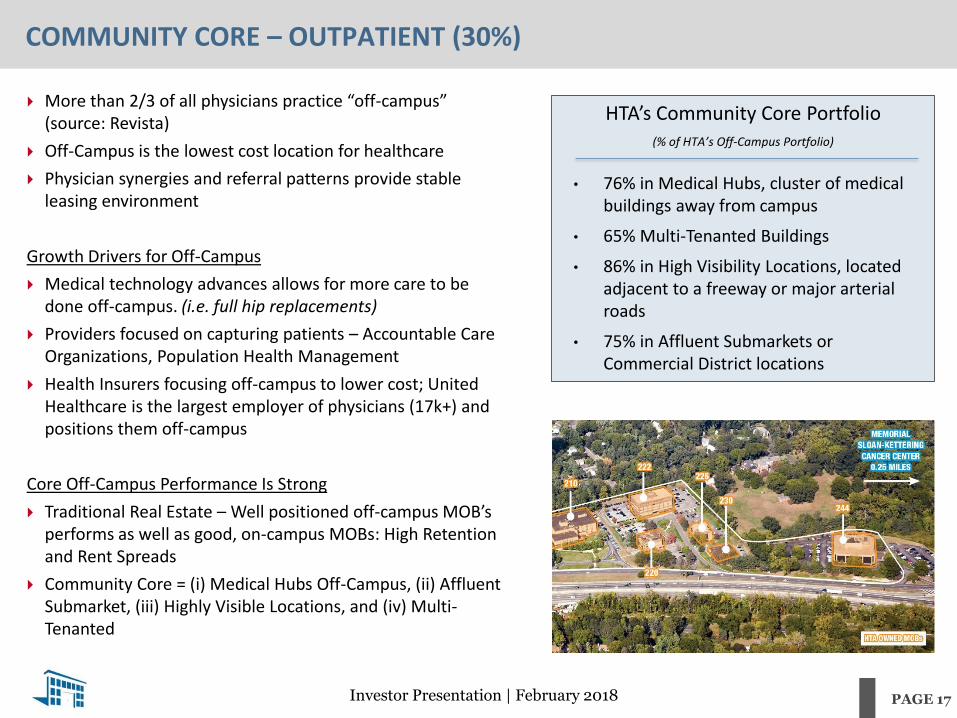
COMMUNITY CORE – OUTPATIENT (30%)
More than 2/3 of all physicians practice “off-campus”(source: Revista)
Off-Campus is the lowest cost location for healthcare
Physician synergies and referral patterns provide stable leasing environment
Growth Drivers for Off-Campus
Medical technology advances allows for more care to be done off-campus. (i.e. full hip replacements)
Providers focused on capturing patients – Accountable Care Organizations, Population Health Management
Health Insurers focusing off-campus to lower cost; United Healthcare is the largest employer of physicians (17k+) and positions them off-campus
Core Off-Campus Performance Is Strong
Traditional Real Estate – Well positioned off-campus MOB’s performs as well as good, on-campus MOBs: High Retention and Rent Spreads
Community Core = (i) Medical Hubs Off-Campus, (ii) Affluent Submarket, (iii) Highly Visible Locations, and (iv) Multi-Tenanted
HTA’s Community Core Portfolio(% of HTA’s Off-Campus Portfolio)
• 76% in Medical Hubs, cluster of medical buildings away from campus
• 65% Multi-Tenanted Buildings
• 86% in High Visibility Locations, located adjacent to a freeway or major arterial roads
• 75% in Affluent Submarkets or Commercial District locations

Leading owner of Medical Office Buildings18
www.htareit.comPAGE 18Investor Presentation | February 2018
HTAMARKETS
KEY MARKETS – STRONG MACRO ECONOMIC TRENDS
Median HHI Growth20bps
Higher Growth
Unemployment20bpsLower
Unemployment
Bachelor’s Degree100bps
More per Capita
Baby Boomer Population Growth
60bpsHigher Growth4.0%
Master’s Degree30bps
More per Capita
Real GDP Growth
3.6%
4.3%
19.4%
8.2%
17.2%80bps
Higher Growth
3.4%
3.4%
4.5%
18.4%
7.9%
16.4%
✓
✓
✓
✓
✓
✓
U.S. AVG
Key MarketMSA
Rank
GLA
(In Thousands)
Invested
($MM)
% of
Invested $
Dallas|Ft. Worth 4 2,053 $843 12.1%
Houston 5 1,484 $431 6.2%
Boston 10 1,037 $411 5.9%
Tampa 18 943 $348 5.0%
Atlanta 9 1,088 $325 4.7%
Indianapolis 33 1,396 $282 4.0%
Hartford | New Haven 47 / 64 969 $278 4.0%
Phoenix 12 1,315 $268 3.8%
Denver 21 538 $247 3.5%
Orange County | L.A. 2 513 $241 3.5%
Miami 8 996 $229 3.3%
Chicago 20 382 $191 2.7%
Raleigh, NC 46 608 $186 2.7%
Albany 61 881 $179 2.6%
Greenville 64 965 $179 2.6%
Austin 35 408 $164 2.4%
Orlando 14 511 $156 2.2%
Pittsburgh 22 1,094 $149 2.1%
New York MSA 1 333 $126 1.8%
Milwaukee 54 368 $116 1.7%
Top 20 MSA's 17,882 $5,348 76.7%
Other Top 75 MSA's 4,527 $1,199 17.2%
Top 75 MSA's 22,409 $6,547 93.9%

Leading owner of Medical Office Buildings19
www.htareit.comPAGE 19Investor Presentation | February 2018
OPERATING PLATFORM

Leading owner of Medical Office Buildings20
www.htareit.comPAGE 20Investor Presentation | February 2018
IN-HOUSE PROPERTY MANAGEMENT, BUILDING SERVICE AND LEASING
22M+SF UNDER
MANAGEMENT
HIGH LEVELS OF SERVICE AND ATTENTIONTO DETAIL
REGIONAL/LOCAL DEDICATION AND
KNOWLEDGE
200+IN-HOUSE
PROFESSIONALS DEDICATED TO ASSET MGMT AND LEASING

Leading owner of Medical Office Buildings21
www.htareit.comPAGE 21Investor Presentation | February 2018
IN-HOUSE PLATFORM DRIVES CONSISTENT GROWTH
In-House Property Management and Leasing Platform totaling 22.4 million square feet or 93% of the Total Portfolio
Existing Reputable Development Platform Enhances Growth Potential & Relationships with Key Tenants
Vertically integrated
Deep network of healthcare relationships
Track record of delivering projects on time and on budget
ASSET MANAGEMENT45+ PROPERTY MANAGERS
25+ ACCOUNTING PROFESSIONALS
▪ Vendor management and contract negotiation focused on operating expense reduction
▪ Operating expense benchmarking against HTA’s national portfolio
▪ Lease abstracting, receivables and collections management and forecasting
BUILDING SERVICES90+ BUILDING ENGINEERS
▪ Identification and coordination of all capital improvements and preventative maintenance
▪ Daily inspections and supervision of all contract maintenance
▪ Monitoring and reducing costly unexpected capital requirements
▪ Supervision of life safety systems and manage emergency on-call system
LEASING SERVICES20+ LEASING PROFESSIONALS
▪ Focus on building critical relationships directly with physicians and health systems
▪ Strategic leasing to maximize tenant synergy and retain tenants that are expanding practices
▪ Regional dedication and knowledge of surrounding medical office buildings leasing terms and tenancy

Leading owner of Medical Office Buildings22
www.htareit.comPAGE 22Investor Presentation | February 2018
STRATEGIC DEVELOPMENT CAPABILITIESPLATFORM ACQUIRED FROM DUKE HEALTHCARE IN 2017
4MSF HEALTHCARE
DEVELOPED
$1.3BHEALTHCARE
DEVELOPED OVER LAST 10 YEARS
MOB | Cancer Center | Outpatient Care
FLEXIBLEDEAL TERMS
FINANCING CAPABILITIES

Leading owner of Medical Office Buildings23
www.htareit.comPAGE 23Investor Presentation | February 2018
DEVELOPMENT CASE STUDY – FACEY MOB
System Relationship:
▪ Providence St. Joseph Health is the third largest nonprofit health system in the nation
▪ Providence St. Joseph Health’s first venture using 3rd party development
▪ Strategic outpatient location in Santa Clarita
▪ Providence St. Joseph Health Relationship:
▪ Both DRE/HTA have an established relationship with Providence St. Joseph Health
▪ HTA owns and manages more than 250K SF on the campus of Providence St. Joseph Mission Hospital in Mission Viejo
▪ Credit Rating: Aa2 (Moody’s)
Key Details:
▪ MOB Size: 37,000 SF
▪ Estimated Total Cost: $25M
▪ Build to Suit for Facey Medical Group
▪ 10 Year, 100% Lease
▪ Yields:
▪ Stabilized: 6.55%
▪ 10-Year: 7.19%
▪ Expected delivery in 2Q 2018

Leading owner of Medical Office Buildings24
www.htareit.comPAGE 24Investor Presentation | February 2018
2017 INVESTMENTS

Leading owner of Medical Office Buildings25
www.htareit.comPAGE 25Investor Presentation | February 2018
2017 INVESTMENTS
• High quality assets 70% on-campus• 90% overlap in key markets yields synergies in leasing, property management and
development• Eliminating 3rd party management fees as HTA’s in-house platform will generate 25 bps
yield by providing building services• New developments coming online in 2018 will yield an additional 25 bps• Limited capital expense due to average age of Duke assets – 8.8 Years
90%KEY STRATEGIC
MARKETS
55.5%CAPITALIZATION
RATE
$2.7BINVESTMENT
YEAR-TO-DATE

Leading owner of Medical Office Buildings26
www.htareit.comPAGE 26Investor Presentation | February 2018
2017 INVESTMENTS CREATES MEDICAL OFFICE LEADER
Acquisition MSA DateInvested
($MM)
GLA
(Thousand
SF)
Affiliation
Duke Healthcare Various Q2 / Q3 / Q4 17 $2,249.0 5,153 Various
Dignity AZ & CA Q2 17 $150.0 592 Dignity Health
Northwest Houston MOBs Houston, TX Q2 17 $137.6 370 North Cypress
Tampa MOBs Tampa, FL Q2 / Q3 17 $76.8 197 HCA/ Bayfront
Texas Health Resources Ft Worth, TX Q2 17 $38.5 78 Texas Health Resources
Tampa Medical Village Tampa, FL Q1 17 $21.1 55 Surgery Parntners
Northpoint Medical Arts Dallas, TX Q4 17 $19.8 119 Non-Aligned
Lake Norman MOB Charlotte, NC Q2 17 $16.6 143 Lake Norman Regional
MatureWell College Station, TX Q1 17 $13.6 23 St. Joseph
Total 2017 YTD $2,723.0 6,729

Leading owner of Medical Office Buildings27
www.htareit.comPAGE 27Investor Presentation | February 2018
STRATEGIC RATIONALE
24.1 mm (2)
Combined Total GLA
74%Leased to Major
Hospital Systems(3)
~90%Assets Within HTA’s
Markets
3.4%Combined Pro Forma
SS NOI Growth(6)
Transformational Acquisition Creates Dominant Public Pure-Play MOB Platform
▪ National Leader in outpatient healthcare real estate, an unconsolidated sector undergoing significant change and macroeconomic growth trends
▪ Combined enterprise value of ~$9.0 billion makes HTA the largest public MOB platform(1)
High-Quality Portfolio Focused On-Campus and in Community Core Locations
▪ ~76% located directly on or adjacent to health system campuses
▪ Combined portfolios exhibit best-in-class same property NOI growth
▪ Core critical assets with excellent visibility in prime position for healthcare delivery
▪ 93% leased with 9.6 weighted average lease term(4)
▪ New construction with an average age of 8 years(5) and very limited capital needs
Significant Portfolio Overlap Creates Scale in Key Gateway Markets
▪ Portfolio focused in 20-25 markets with strong growth characteristics
▪ Increased market density allows for significant operating synergies and growth opportunities utilizing the combined operating platform.
▪ 17 markets with each having over 500k GLA
Combined Full-Service Operating Platform with History of Performance and Execution
▪ HTA’s operating platform has demonstrated significant growth maximizing acquired properties
▪ Proven development platform allows for full-service relationship with new and existing healthcare providers
▪ Development assets are currently 86% pre-leased
(1) Excludes all properties with exercised ROFR/ROFOs. (2) Includes $391 million investments in 24 MOBs, aggregating 1.4 million square feet as of June 30, 2017. (3) Based on GLA of 2Q Investments. (4) Weighted average lease term of Duke portfolio, does not include Dignity assets. (5) Average age of Duke portfolio, does not include Dignity assets. (6) Same store growth weighted by GLA at 12/31/16 since 2012.
Leading owner of Medical Office Buildings28
www.htareit.comPAGE 28Investor Presentation | February 2018
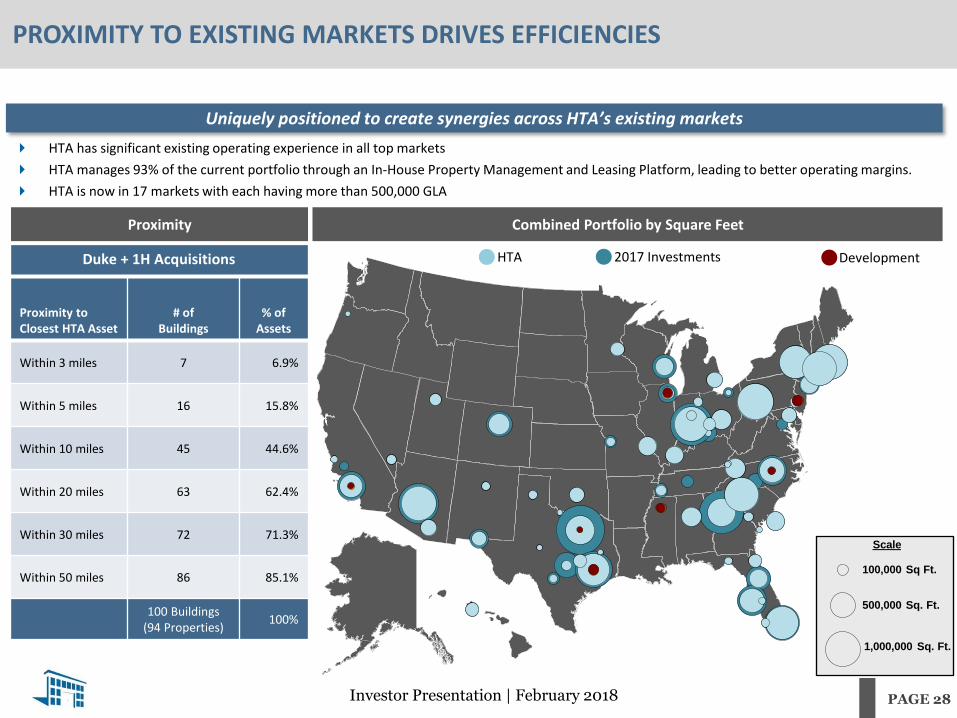
100,000 Sq Ft.
1,000,000 Sq. Ft.
500,000 Sq. Ft.
Scale
Combined Portfolio by Square Feet
PROXIMITY TO EXISTING MARKETS DRIVES EFFICIENCIES
Uniquely positioned to create synergies across HTA’s existing markets
Proximity
HTA 2017 Investments Development
HTA has significant existing operating experience in all top markets
HTA manages 93% of the current portfolio through an In‐House Property Management and Leasing Platform, leading to better operating margins.
HTA is now in 17 markets with each having more than 500,000 GLA
Proximity to Closest HTA Asset
# ofBuildings
% of Assets
Within 3 miles 7 6.9%
Within 5 miles 16 15.8%
Within 10 miles 45 44.6%
Within 20 miles 63 62.4%
Within 30 miles 72 71.3%
Within 50 miles 86 85.1%
100 Buildings(94 Properties)
100%
Duke + 1H Acquisitions

Leading owner of Medical Office Buildings29
www.htareit.comPAGE 29Investor Presentation | February 2018
FINANCIAL PERFORMANCE & BALANCE SHEET
Leading owner of Medical Office Buildings30
www.htareit.comPAGE 30Investor Presentation | February 2018
2.7%
2.4%
3.8%3.4%3.4%
3.2%3.0%3.0%3.1%3.1%
3.3%
3.0%3.0%3.1%3.1%3.0%3.1%3.3%
2.9%
3.2%3.1%2.9%2.8%
0.0%
0.5%
1.0%
1.5%
2.0%
2.5%
3.0%
3.5%
4.0%
$0.32 $0.32 $0.32 $0.32 $0.32 $0.32
$0.34
$0.36 $0.36
$0.38 $0.37 $0.37
$0.38 $0.39 $0.39
$0.40 $0.40 $0.40 $0.41 $0.41
$0.39
$0.42 $0.42
$0.25
$0.27
$0.29
$0.31
$0.33
$0.35
$0.37
$0.39
$0.41
$0.43
$0.45
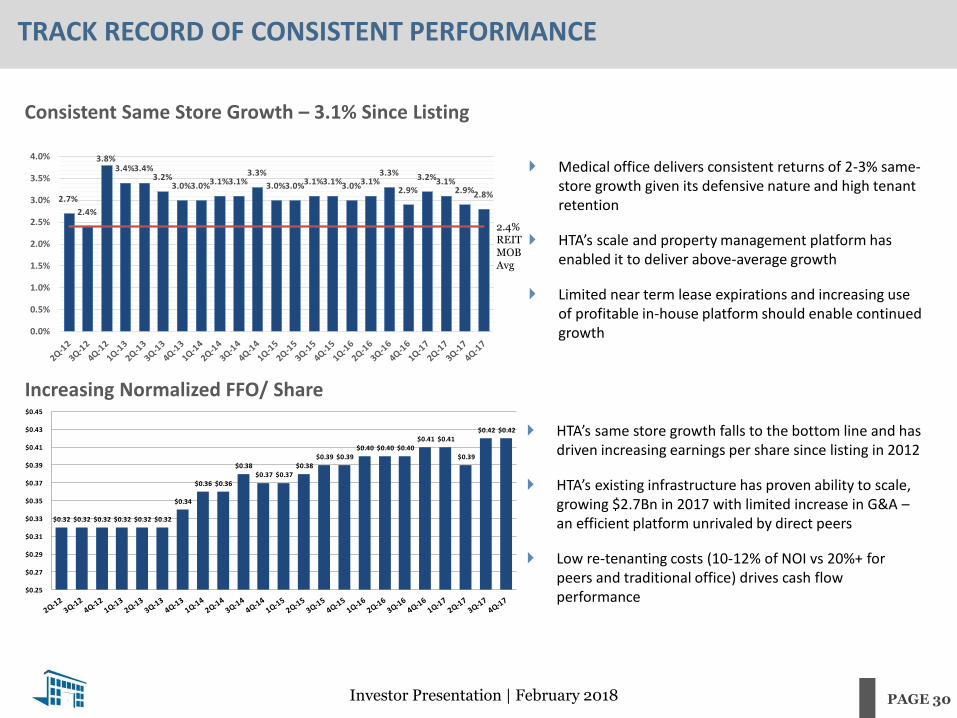
Medical office delivers consistent returns of 2-3% same-store growth given its defensive nature and high tenant retention
HTA’s scale and property management platform has enabled it to deliver above-average growth
Limited near term lease expirations and increasing use of profitable in-house platform should enable continued growth
Consistent Same Store Growth – 3.1% Since Listing
TRACK RECORD OF CONSISTENT PERFORMANCE
Increasing Normalized FFO/ Share
HTA’s same store growth falls to the bottom line and has driven increasing earnings per share since listing in 2012
HTA’s existing infrastructure has proven ability to scale, growing $2.7Bn in 2017 with limited increase in G&A –an efficient platform unrivaled by direct peers
Low re-tenanting costs (10-12% of NOI vs 20%+ for peers and traditional office) drives cash flow performance
2.4% REIT MOB Avg

Leading owner of Medical Office Buildings31
www.htareit.comPAGE 31Investor Presentation | February 2018
33.1%31.4%
30.0%
26.2% 26.4%
29.4%28.3%
30.4%31.9%
29.9%
12.0%
16.0%
20.0%
24.0%
28.0%
32.0%
36.0%
40.0%
44.0%
48.0%
3Q 15 4Q 15 1Q 16 2Q 16 3Q 16 4Q 16 1Q 17 2Q 17 3Q 17 4Q 17
WELL CAPITALIZED, FLEXIBLE BALANCE SHEET
HTA has completed the financing of its investments in a manner that maintains its strong, investment grade balance sheet with 12/31/17 Leverage of 29.9% Debt to Total Capitalization and 5.9x Debt/ EBITDA
Low Leverage / Limited Maturities
Well-Laddered Debt Capitalization with Limited Near-Term Maturities
Equity Financing▪ Raised over $1.9 Billion in common equity through overnight and ATM transactions in Q2▪ Maintained low leverage profile despite significant investments▪ Locked in cost of capital for long term accretion
Debt Financing▪ Raised approximately $1.2 Billion in debt to complete the financing▪ $900 Million in public unsecured bonds at 3.4% average interest rate and 7.7 years average duration▪ $286 Million in seller financing at 4.0% maturing in 3 equal installments
Debt/Total Capitalization
$103 $108$147
$306
$463
$1,677
$0
$200
$400
$600
$800
$1,000
$1,200
$1,400
$1,600
$1,800
$2,000
2018 2019 2020 2021 2022 Thereafter
Mil
lio
ns
Credit Facility Secured Mortgages Term Loans Unsecured Notes Seller Financing
Leading owner of Medical Office Buildings32
www.htareit.comPAGE 32Investor Presentation | February 2018
APPENDIX

Leading owner of Medical Office Buildings33
www.htareit.comPAGE 33Investor Presentation | February 2018
COMMUNITY HEALTH SYSTEMS (CHS) EXPOSURE
(1) Data from latest regulatory filings per AHD
HTA Exposure to CHS
▪ 18 MOBs
▪ 11 CHS Campuses
▪ 1.1 Million SF (665,877 SF CHS Direct Leases)
▪ All hospitals are profitable
▪ 86% are operating above the industry average operating margins of 6% (1)
▪ Over 50 % exceed 10% operating margins
▪ Limited to 2.9% of HTA ABR
Lake Norma Regional Medical Center3 On-Campus MOBs143,188 SF22.1%
Mary Black Health System1 On-Campus MOB108,5056.0%
St. Joseph Hospital1 On-Campus MOB27,948 SF3.1% Op Margin
Northwest Medical Center3 On-Campus MOBs171,641 SF12.8% Op Margin
Navarro Regional Hospital1 On-Campus MOB39,975 SF7.1% Op Margin
Cedar Park Regional Medical Center1 On-Campus MOB83,393 SF0.5% Op Margin
Dupont Hospital1 On-Campus MOB44,898 SF25.2% Op Margin
Deaconess Hospital2 On-Campus MOBs186,301 SF8.4% Op Margin
Bayfront Health1 On-Campus MOB26,500 SF4.3% Op Margin
Longview Regional Medical Center2 On-Campus MOBs178,537 SF11.5% Op Margin
Mountain View Regional Medical Center1 On-Campus MOB107,506 SF32.0% Op Margin
≥0.5% ≥6% ≥10%
Operating Margin

Leading owner of Medical Office Buildings34
www.htareit.comPAGE 34Investor Presentation | February 2018
Healthcare Trust of America, Inc.