large-scale structure: theory & observations
DESCRIPTION
Large-scale Structure: Theory & Observations. Josh Frieman. Structure Formation & Evolution, Santiago, October 2002. The Structure Formation Cookbook. 1. Initial Conditions: A Theory for the Origin of Density Perturbations in the Early Universe - PowerPoint PPT PresentationTRANSCRIPT

Large-scale Structure:Theory & Observations
Josh FriemanStructure Formation & Evolution, Santiago, October 2002

The Structure Formation Cookbook
1. Initial Conditions: A Theory for the Origin of Density Perturbations in the Early Universe Your favorite Inflation model: primordial spectrum Pi ~ kn
2. Cooking with Gravity: Growing Perturbations to Form Structure Set the Oven to Cold (or Hot or Warm) Dark Matter Season with a few Baryons and add Dark Energy
3. Let Cool for 13 Billion years
4. Tweak (1) and (2) until it tastes like the observed Universe.

N-body simulation:Evolution of Structure in aCold Dark Matter Model
Features:
Filamentary structureamplified by gravity
Hierarchical collapse, virialization, and merging of dark halos
See talks by Teyssier, Navarro
Virgo consortium

Formation of Dark Halos
(Virgo consortium)

Evolution of Structure
Density Power Spectrum:
(k) = d3x eik·x (x) (k1)(k2) = (2)3 P(k1)3(k1+k2)
Evolution:
Pgal(k) = b2gal(k) Pi(k) T(k; j, n, 8)
bias primordial spectrum Non-linear Transfer function

ColdDarkMatterModels
Power Spectrum of the Mass Density
Turnover dueto delayedperturbationgrowth in radiationera
SCDMCDMOpen CDM
P ~ k
P ~ k-3
keq ~ mh =
h/Mpc
Non-linearLinear
Shape parameter

Power Spectrum in Cold Dark Matter Models
Cold Dark Matter Models
mh=0.5SCDM
mh=0.2 CDM (assumed biased)
Amplitude
8
Rms Linear
Mass
Fluctuations
in spheres of
Radius
8h-1 Mpc

More ColdDarkMatter
Less ColdDarkMatter(Open)
ColdDarkMatterwith

Probing Neutrino Mass and Baryon Density
SDSS + MAP: will constrain sum of stable neutrino masses as low as ~ 0.5 eV
WigglesDue to Non-zeroBaryonDensity

Constraints on the Baryon Density from 2dF Galaxy Redshift Survey Power Spectrum
Percival, etal. Tegmark & Hamilton
Increasingb suppressespower on small scales(and increasesamplitude of wiggles)

2dF GRS Power Spectrum
m,tot < 2.2 eV
--reasonable prior on m
--BBN prior on b
--simple model of bias & redshift distortions
Elgaroy, etal
=00.01
0.05
= m,tot
94 eV

Probes of Structure Formation
Probing the Galaxy Distribution:
--Galaxy Photometric and Spectroscopic Surveys
Probing the Mass Distribution: --CMB anisotropy --Weak & Strong Gravitational Lensing --Peculiar velocities
Probing the High-redshift Universe:
--Constraining Dark Matter Properties via High-redshift Quasars & the Lyman-alpha forest (see talk by Petitjean)
Bias

Large-scale Structure, circa 1986
`Pizza Slice’ 6 degrees thick containing 1060 galaxies: position of each galaxy represented by a single dot
100 Mpc
You Are Here
Center for Astrophysics Survey
Filaments,Walls,Voids,Richclusters
deLapparent, Geller, Huchra

Las Campanas Redshift SurveyShectman,etal

Colless, etal

SDSS RedshiftSurvey
~200,000 galaxy redshifts so far


APM Galaxy Survey (digitized plates)
~106 galaxy positions, magnitudes bJ < 20 Maddox,etal

SDSS Imaging Survey
~3000 sq deg. covered so far (50 M objects) ~6600 sq. deg. by June 2005 r’ < 22

Determination of the galaxy Power spectrum c. 1990’s
Surveys selectdifferent mixes of galaxypopulations
Evidence for type-dependentBias
Error bars not shown!
Missing:PSCz, EDSGC,ESO Slice, 2dF,SDSS, …
Vogeley

Galaxy Clustering varies with Galaxy Type
How are each of themrelated to the underlying Mass distribution?
Bias depends upon Galaxy Type
Need large, carefully selected samples to study this: 2dF, SDSS

Rescale Power by linear bias factorfor each survey:different galaxy types cluster with different strengths
Pi(k) = b2i Pm(k)
Galaxies Mass
Best fit CDM Model:h = 0.2-0.3 Vogeley

Galaxiesare Biasedtracers of the Dark Matter
Tegmark, etal


• Cannot describe bias on scales smaller than smoothing scale.• Choice of smoothing scale is arbitrary.• δm is generally unobservable.
“Environmental” Bias

Bias Depends onGalaxyColor
Cf. morphology-density relation
Zehavi, etal
SDSS Redshift Survey

Bias depends on Galaxy Luminosity
Compare 2dF results of Norberg, etal
Intrinsically bright
Intrinsicallyfaint
SDSS Redshift Survey

Theoretical Models for Bias
Requires gas dynamics, star formation, dynamical Friction, mergers, feedback, etc.
Expectation:
Bias depends on type and scale, evolves with time, and is stochastic
Blanton, etal

SPH Simulation
• Ωm=0.4, ΩΛ=0.6, Ωb=0.02h-2
h=0.65, n=0.95, σ8=0.8
• 1443 dm + 1443 gas particles l=50 Mpc/h, mb=8.5x10⁸Msun
• Gravity + gas dynamics radiative + Compton cooling photoionization heating star formation + feedback
• FoF halos, b=0.173 Davé, Katz, & Weinberg
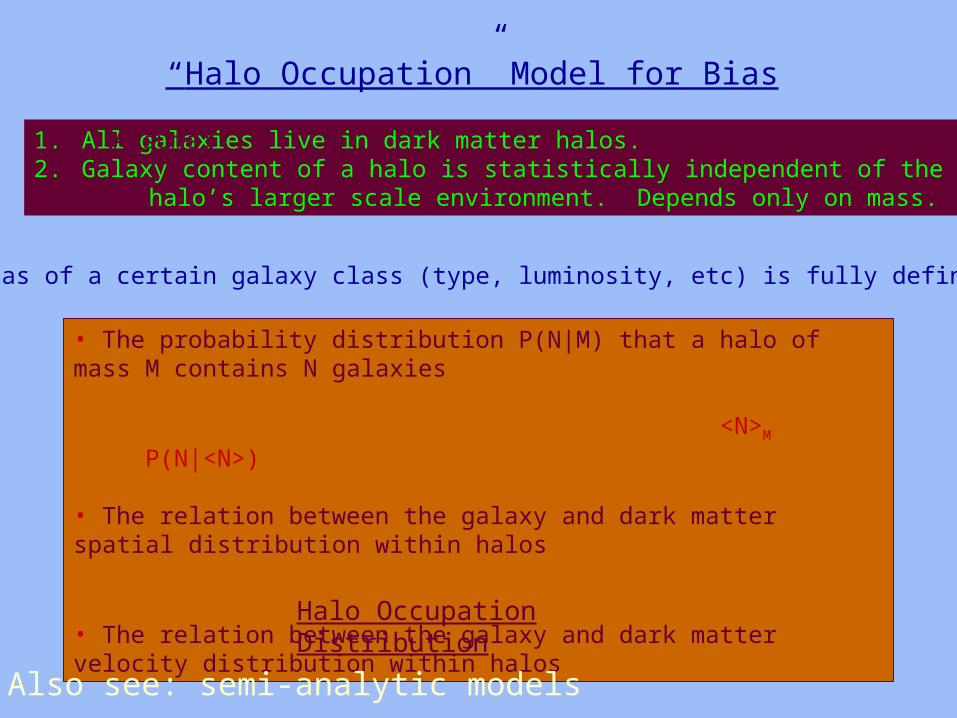
• The probability distribution P(N|M) that a halo of mass M contains N galaxies
<N>M P(N|<N>)
• The relation between the galaxy and dark matter spatial distribution within halos
• The relation between the galaxy and dark matter velocity distribution within halos
Halo Occupation Distribution
1. All galaxies live in dark matter halos.2. Galaxy content of a halo is statistically independent of the halo’s larger scale environment. Depends only on mass.
Assume:
The bias of a certain galaxy class (type, luminosity, etc) is fully defined by:
“Halo Occupation” Model for Bias
Also see: semi-analytic models

Cosmological Model
Ω, P(k), etc.
Galaxy Formation
Gas cooling, Star formation, Feedback, Mergers, etc.
Halo Occupation DistributionP(N|M)
Spatial bias within halosVelocity bias within halos
Galaxy-Mass Correlations
Dark Halo Population
n(M), ξ(r|M), v(r|M), ρ(r)
Galaxy Clustering


SLOAN DIGITAL SKY SURVEY
GOALGOAL: MAP THE UNIVERSE IN 3 DIMENSIONS OVER A LARGE VOLUME
• Photometric Survey: ~108 5-band CCD images
• Spectroscopic Survey: ~106 galaxy and 105 QSO redshifts
University of Chicago Fermilab Princeton University New Mexico State
Johns Hopkins University Institute for Advanced Study
U.S. Naval Observatory University of Washington Japan Participation Group
Max-Planck A and IA
http://www.sdss.org
Funding: Sloan Foundation, NSF, DOE, NASA, member institutions, Japan Ministry of Education
Los Alamos National LabUniversity of Pittsburgh

SDSS 2.5 meter Telescope

SDSS Data
April 2000: Survey begins (commissioning ends)June 2005: Survey finishes
Data so far: ~3,264 unique square degrees of 5-band imaging (7/02) (~60 million objects) ~375,000 object spectra (G,Q,S redshifts)
Samples currently being analyzed (preliminary results today):
~2,500 sq. deg. imaging with photometric redshifts ~170,000 main galaxy (spectroscopic) redshifts ~30,000 QSO redshifts ~25,000 LRG redshifts

ProjectedtoJune 2005:
6600 sq deg imaging
600,000 spectra

SDSS Public Data Releases
•Series of Staged Data Releases (cf. COBE)
•June 2001: Early Data Release
~600 square degrees of 5-band imaging (~8 million galaxies to r* < 22.5)
~60,000 object spectra (redshifts)
•January 2003: First Data Release ~2,800 sq. deg. imaging ~200,000 spectra/redshifts

Large-scale Structure Results
•Results of the LSS Working Group
•Angular Clustering of Galaxies in the Photometric Survey
--incorporation of photometric redshifts
--clustering by galaxy type (color and luminosity) •Power spectrum and Two-point correlation of Galaxies in the Spectroscopic Survey --clustering by galaxy type
•In the works: clustering of LRGs, clusters, QSOs, Ly-a forest; higher order correlations of galaxies; clustering by spectroscopic type and stellar mass
Zehavi, etalTegmark, etal
Budavari,etal

SDSS Angular Clustering I
Galaxy angularcorrelation function
dP=n2[wdd
Check for systematics:correlate with dust, galactic latitude, seeing
Mask out regions of bad seeing, high dust obscuration, bright stars, etc.
Careful error analysis:covariance
Scranton, etalConnolly, etal
bright
faint

SafeTruncationof KL modes
OrthogonalConstraintsProbing Power Around the Peak
Amplitude
8 =
0.92 ± 0.06
Shape ( mh) = 0.19 ± 0.04
Two-parameter fit of SDSS Angular KL Data to CDM Models
Szalay, etal

Angular Clustering with Photometric Redshifts
T. Budavari, A. Connolly, I. Csabai, I. Szapudi, A. Szalay, S. Dodelson,
J. Frieman, R. Scranton, D. Johnston and the SDSS Collaboration
Sample selection based on rest-frame quantities Strictly volume limited samples Largest angular correlation study to date Very clear detection of
Luminosity dependence Color dependence
Results consistent with 3D clustering

Photometric Camerafilter response
with and w/oatmosphericextinction of 1.2 airmasses

Galaxy photometricredshiftestimates
Predictedredshiftfrom 5-bandSDSSPhotometry
Spectroscopic measured redshiftConnolly, etalCsabai, etal

The Photo-z Samples
343k343k 254k254k 185k185k 316k316k 280k280k 326k326k 185k185k 127k127k
-20 > Mr >-21
1182k1182k
-21 > Mr >-23
931k931k
0.1<z<0.3-20 > Mr
2.2M2.2M
-21 > Mr >-22
662k662k
-22 > Mr >-23
269k269k
0.1<z<0.5-21.4 > Mr
3.1M3.1M
10 stripes: 10M10M
mr<21 : 15M15M
All: 50M50M

Angular Correlations II.
Luminosity dependence: 3 cuts-20> M > -21 -21> M > -22 -22> M > -23

Angular Correlations III.
Color Dependence4 bins by rest-frame SED type

Sky coverage of SDSS redshift survey
(Aitoff projection, equatorial coordinates)
(Dust map from Schlegel, Finkbeiner & Davis)

Redshift DistributionandRadialSelectionFunctionfor theSpectroscopicSample
-22 < Mr < -1914.5 < r’ < 17.77
2000 sq. deg.~140,000 galaxies
120,000 at z<0.15cz (km/sec)
N
P

Redshift-Space Galaxy Correlation Function


CorrelationAmplitudeContours
RadialRedshiftDistortionsdue topeculiarvelocities
,pr

1
1212 d(P,r
llpl
Q
)ˆˆcos( zr
4.0~6.0
bm
2dF: = 0.430.07

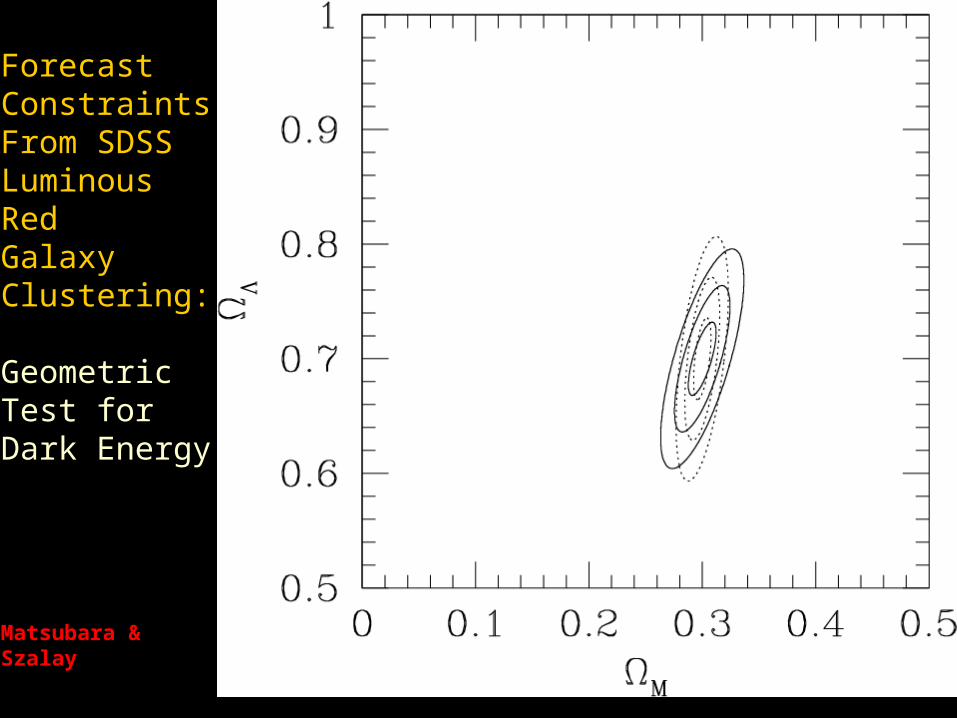
Forecast Constraints From SDSSLuminousRed GalaxyClustering:
GeometricTest for Dark Energy
Matsubara & Szalay

ProjectedCorrelationFunction
m
0
2)(
d,rrw ppp

Lum funcs & sel funcs by Michael Blanton (NYU)
Divide GalaxiesbyIntrinsicLuminosity:
Volume-limitedsubsamples


Clustering as a function of Galaxy Luminosity
Amplitude & Scaling consistent with angular photo-z results
bright
faint


Large scales: All pairs come from separate halos:
Small scales: All pairs come from same halo:
Halo Modeling

Berlind,Zehavi,Zheng, Weinberg
N~M
M1
N ~Mβ


Rescalebias


k=3
k=0.3k=0.1
k=0.03
k=1

Cmbgg OmOlLSS

SDSSClusteringCorrectedFor LuminosityBias

Finding GroupsIn SDSS
Berlind


SDSS Group Identification
Identify groups using:Friends-of-friends algorithmFixed tangential linking lengthVariable line-of-sight linking length
Group catalog:2,143 galaxy groups (N>2)

SDSS Group Multiplicity Function

Preliminary HOD Constraints

Detecting Galaxy ClustersMaxBcg algorithm: Animation of process for single galaxy Perform step for all galaxies Build a 3-d map Locate maxima
Strengths Works to high z Very good photo-z
Weaknesses Assumes clusters contain Bright red galaxies
Annis, etalMiller, etalKim, etalGoto, etal

MaxBcg Photo-z’s


SDSS Cluster Abundance as a CosmologicalProbe

Non-Gaussian structure: beyond Two-point statistics
Identical Power spectra Szalay

JF, Gaztanaga
Angular 3-pointCorrelationFunction
N-body vs.NonlinearPerturbationTheory (PT)
q3 = z(12, 13, 23) -------------------------- w(12)w(13)+ cyc.
12
13
deg
Data
Model

Scoccimarro, Feldman, Fry, JF
Bispectrum of IRAS Redshift Surveys: PSCz Survey (~15,000 galaxies)
Q = B(k1,k2,k3) ------------------------- P(k)P(k2)+ cyc.
k2/k1=0.4-0.6
Perturbation Theory
PT withredshiftdistortions
biasedmodels
Collinearconfigurations
Collinearconfigurations
~Equilateral

Constraints on Bias Parametersfrom IRAS Bispectra
Local, deterministicBias model:
g = f() = b + b22/2
Qg = Q/b1 + b2/b12
Feldman, etal

PDF of the Evolved Density Field on Scales of ~ few Mpc
Cold Dark Matter simulation Bernardeau & Kofman

Higher Order AngularCorrelationsin early SDSSimaging data
SN =
‹N ›/‹ 2()›N-
Higher order Correlations probeBias & initialNon-Gaussianity
Szapudi, etal
S3
S4

Comparison with Biased CDM model
Higher Order Correlations consistent with Non-linear evolution from Gaussian Initial Conditions
Constrain models of Inflation S3
S4

Simulated Halowith Dwarf GalaxySatellites: does CDM predict too much substructure?
What are the Shapes of Dark Matter halos?
SDSS Probes Distribution of Stars in the Milky Way
Yanny, etalNewberg, etal

F turnoff stars on the celestial equator from SDSS: Halo clumps
Debris FromSagittariusDwarf Galaxy
New structures
A
C

Gravitational Lensing
•Strong lensing: (see talk by Kneib)Multiply imaged QSOs: fraction of lensed objects probes dark energy and halo DM profiles
•Weak lensing: Galaxy-Galaxy lensing: Probing Dark Matter Halos and bias
Large-area, low-z lensing: Stebbins, McKay, JF 96

Foregroundgalaxy
Lensing of intrinsically spherical galaxies: induced ellipticities exaggerated
BackgroundSourceshape
Galaxy-Galaxylensing

Foregroundgalaxy
Lensing of real (elliptically shaped) galaxies
Must co-add signal from a large number of foreground galaxies
BackgroundSourceshape

Galaxy-Galaxy Lensing in earlySDSS Data
Galaxy-massCorrelation function
~31,000 foreground galaxies with measuredredshifts
~106 background galaxy shapes (18<r’<22)
Fischer, etalMcKay, etal
g’
r’
i’
from foreground galaxy

December 14, 1999SDSSGalaxy-Galaxy Lensing
Galaxy Halos are Extendedand Massive

Measurement of the Galaxy-Mass correlation function: the GMCF
Galaxy-Mass: measured by SDSS lensing
Galaxy-Galaxy: directly measured by SDSS LSS
Mass-Mass: directly predictable by N-body simulations
Encoded in their relationship is the ‘bias’ between light and mass
wg mbg dk (k/)P (k) dw(w) Gb(w)Wf(w)J0(wk)
Infer mbg ≈ 1/4 to 1/3 from shear and bg
≈ from foreground clustering
Consistent with low-density universe and modest bias

Scaling of Lensing Mass with Galaxy Luminosity
Determine Mass to Light ratios
Combine with Galaxy LuminosityDensity
Infer Cosmic Mass Density

SheldonSheldon

• On-going: extend analysis to ~10 times larger dataset