large-scale photovoltaic power plants - … .com’s database in-cludes more than 6,000 large-scale...
TRANSCRIPT

2 Large-ScaLe PhotovoLtaic Power PLantS
1 IntroductIon . . . . . . . . . . . . . . . . . . . . . . . . . . . . . . . . . . . . . . . . . . . . . . . . . . . . . . . . . . . . . . . . . . . . . . . . . . . . . . . . . . . . . . . . . . . . . . . . . . . . . . . . . . . . . . . 31 .1 how the story began . . . . . . . . . . . . . . . . . . . . . . . . . . . . . . . . . . . . . . . . . . . . . . . . . . . . . . . . . . . . . . . . . . . . . . . . . . . . . . . . . . . . . . . . . . . . . . . . . . . . . . . . . . . . . 31 .2 Large-scale photovoltaic power plants – available data . . . . . . . . . . . . . . . . . . . . . . . . . . . . . . . . . . . . . . . . . . . . . . . . . . . . . . . . . . . . . . 3
2 Power . . . . . . . . . . . . . . . . . . . . . . . . . . . . . . . . . . . . . . . . . . . . . . . . . . . . . . . . . . . . . . . . . . . . . . . . . . . . . . . . . . . . . . . . . . . . . . . . . . . . . . . . . . . . . . . . . . . . . . . . . . . . . 32 .1 Large-scale photovoltaic power plants . . . . . . . . . . . . . . . . . . . . . . . . . . . . . . . . . . . . . . . . . . . . . . . . . . . . . . . . . . . . . . . . . . . . . . . . . . . . . . . . . . . . . 32 .2 installed power capacity . . . . . . . . . . . . . . . . . . . . . . . . . . . . . . . . . . . . . . . . . . . . . . . . . . . . . . . . . . . . . . . . . . . . . . . . . . . . . . . . . . . . . . . . . . . . . . . . . . . . . . . . 32 .3 Power capacity by region/country . . . . . . . . . . . . . . . . . . . . . . . . . . . . . . . . . . . . . . . . . . . . . . . . . . . . . . . . . . . . . . . . . . . . . . . . . . . . . . . . . . . . . . . . . . . 32 .4 Power capacity by type of power plant . . . . . . . . . . . . . . . . . . . . . . . . . . . . . . . . . . . . . . . . . . . . . . . . . . . . . . . . . . . . . . . . . . . . . . . . . . . . . . . . . . . . . 3
3 technology . . . . . . . . . . . . . . . . . . . . . . . . . . . . . . . . . . . . . . . . . . . . . . . . . . . . . . . . . . . . . . . . . . . . . . . . . . . . . . . . . . . . . . . . . . . . . . . . . . . . . . . . . . . . . . . . . . . 33 .1 Solar cell technologies . . . . . . . . . . . . . . . . . . . . . . . . . . . . . . . . . . . . . . . . . . . . . . . . . . . . . . . . . . . . . . . . . . . . . . . . . . . . . . . . . . . . . . . . . . . . . . . . . . . . . . . . . . 33 .2 Market shares of fixed and tracking arrays . . . . . . . . . . . . . . . . . . . . . . . . . . . . . . . . . . . . . . . . . . . . . . . . . . . . . . . . . . . . . . . . . . . . . . . . . . . . . . . . 3
4 AreA . . . . . . . . . . . . . . . . . . . . . . . . . . . . . . . . . . . . . . . . . . . . . . . . . . . . . . . . . . . . . . . . . . . . . . . . . . . . . . . . . . . . . . . . . . . . . . . . . . . . . . . . . . . . . . . . . . . . . . . . . . . . . . . . . 34 .1 ground mounted power plants . . . . . . . . . . . . . . . . . . . . . . . . . . . . . . . . . . . . . . . . . . . . . . . . . . . . . . . . . . . . . . . . . . . . . . . . . . . . . . . . . . . . . . . . . . . . . . . 34 .2 roof mounted power plants . . . . . . . . . . . . . . . . . . . . . . . . . . . . . . . . . . . . . . . . . . . . . . . . . . . . . . . . . . . . . . . . . . . . . . . . . . . . . . . . . . . . . . . . . . . . . . . . . . . 3
5 economy . . . . . . . . . . . . . . . . . . . . . . . . . . . . . . . . . . . . . . . . . . . . . . . . . . . . . . . . . . . . . . . . . . . . . . . . . . . . . . . . . . . . . . . . . . . . . . . . . . . . . . . . . . . . . . . . . . . . . . . . . 35 .1 investment costs . . . . . . . . . . . . . . . . . . . . . . . . . . . . . . . . . . . . . . . . . . . . . . . . . . . . . . . . . . . . . . . . . . . . . . . . . . . . . . . . . . . . . . . . . . . . . . . . . . . . . . . . . . . . . . . . . . 35 .2 electricity price . . . . . . . . . . . . . . . . . . . . . . . . . . . . . . . . . . . . . . . . . . . . . . . . . . . . . . . . . . . . . . . . . . . . . . . . . . . . . . . . . . . . . . . . . . . . . . . . . . . . . . . . . . . . . . . . . . . . 35 .3 Power per capita . . . . . . . . . . . . . . . . . . . . . . . . . . . . . . . . . . . . . . . . . . . . . . . . . . . . . . . . . . . . . . . . . . . . . . . . . . . . . . . . . . . . . . . . . . . . . . . . . . . . . . . . . . . . . . . . . . 35 .4 other economical indicators . . . . . . . . . . . . . . . . . . . . . . . . . . . . . . . . . . . . . . . . . . . . . . . . . . . . . . . . . . . . . . . . . . . . . . . . . . . . . . . . . . . . . . . . . . . . . . . . . . 3
6 envIronment . . . . . . . . . . . . . . . . . . . . . . . . . . . . . . . . . . . . . . . . . . . . . . . . . . . . . . . . . . . . . . . . . . . . . . . . . . . . . . . . . . . . . . . . . . . . . . . . . . . . . . . . . . . . . . . . 36 .1 greenhouse gases . . . . . . . . . . . . . . . . . . . . . . . . . . . . . . . . . . . . . . . . . . . . . . . . . . . . . . . . . . . . . . . . . . . . . . . . . . . . . . . . . . . . . . . . . . . . . . . . . . . . . . . . . . . . . . . . 3
7 the sunnIest regIons . . . . . . . . . . . . . . . . . . . . . . . . . . . . . . . . . . . . . . . . . . . . . . . . . . . . . . . . . . . . . . . . . . . . . . . . . . . . . . . . . . . . . . . . . . . . . . . . 37 .1 california . . . . . . . . . . . . . . . . . . . . . . . . . . . . . . . . . . . . . . . . . . . . . . . . . . . . . . . . . . . . . . . . . . . . . . . . . . . . . . . . . . . . . . . . . . . . . . . . . . . . . . . . . . . . . . . . . . . . . . . . . . . . 37 .2 France . . . . . . . . . . . . . . . . . . . . . . . . . . . . . . . . . . . . . . . . . . . . . . . . . . . . . . . . . . . . . . . . . . . . . . . . . . . . . . . . . . . . . . . . . . . . . . . . . . . . . . . . . . . . . . . . . . . . . . . . . . . . . . . . . 37 .3 germany . . . . . . . . . . . . . . . . . . . . . . . . . . . . . . . . . . . . . . . . . . . . . . . . . . . . . . . . . . . . . . . . . . . . . . . . . . . . . . . . . . . . . . . . . . . . . . . . . . . . . . . . . . . . . . . . . . . . . . . . . . . . . 37 .4 greece . . . . . . . . . . . . . . . . . . . . . . . . . . . . . . . . . . . . . . . . . . . . . . . . . . . . . . . . . . . . . . . . . . . . . . . . . . . . . . . . . . . . . . . . . . . . . . . . . . . . . . . . . . . . . . . . . . . . . . . . . . . . . . . . 37 .5 italy . . . . . . . . . . . . . . . . . . . . . . . . . . . . . . . . . . . . . . . . . . . . . . . . . . . . . . . . . . . . . . . . . . . . . . . . . . . . . . . . . . . . . . . . . . . . . . . . . . . . . . . . . . . . . . . . . . . . . . . . . . . . . . . . . . . . 37 .6 Korea . . . . . . . . . . . . . . . . . . . . . . . . . . . . . . . . . . . . . . . . . . . . . . . . . . . . . . . . . . . . . . . . . . . . . . . . . . . . . . . . . . . . . . . . . . . . . . . . . . . . . . . . . . . . . . . . . . . . . . . . . . . . . . . . . . 37 .7 Spain . . . . . . . . . . . . . . . . . . . . . . . . . . . . . . . . . . . . . . . . . . . . . . . . . . . . . . . . . . . . . . . . . . . . . . . . . . . . . . . . . . . . . . . . . . . . . . . . . . . . . . . . . . . . . . . . . . . . . . . . . . . . . . . . . . 3
8 APPlIcAtIons . . . . . . . . . . . . . . . . . . . . . . . . . . . . . . . . . . . . . . . . . . . . . . . . . . . . . . . . . . . . . . . . . . . . . . . . . . . . . . . . . . . . . . . . . . . . . . . . . . . . . . . . . . . . . . . . 38 .1 ground mounted power plants . . . . . . . . . . . . . . . . . . . . . . . . . . . . . . . . . . . . . . . . . . . . . . . . . . . . . . . . . . . . . . . . . . . . . . . . . . . . . . . . . . . . . . . . . . . . . . . 38 .2 industrial roofs, warehouses and grocery stores . . . . . . . . . . . . . . . . . . . . . . . . . . . . . . . . . . . . . . . . . . . . . . . . . . . . . . . . . . . . . . . . . . . . . . . . 38 .3 waste/wastewater treatment facilities . . . . . . . . . . . . . . . . . . . . . . . . . . . . . . . . . . . . . . . . . . . . . . . . . . . . . . . . . . . . . . . . . . . . . . . . . . . . . . . . . . . . . 38 .4 Sport and other public objects . . . . . . . . . . . . . . . . . . . . . . . . . . . . . . . . . . . . . . . . . . . . . . . . . . . . . . . . . . . . . . . . . . . . . . . . . . . . . . . . . . . . . . . . . . . . . . . 38 .5 abandoned military surfaces . . . . . . . . . . . . . . . . . . . . . . . . . . . . . . . . . . . . . . . . . . . . . . . . . . . . . . . . . . . . . . . . . . . . . . . . . . . . . . . . . . . . . . . . . . . . . . . . . . 38 .6 Building integrated large-scale power plants . . . . . . . . . . . . . . . . . . . . . . . . . . . . . . . . . . . . . . . . . . . . . . . . . . . . . . . . . . . . . . . . . . . . . . . . . . . . 38 .7 other large-scale power plants . . . . . . . . . . . . . . . . . . . . . . . . . . . . . . . . . . . . . . . . . . . . . . . . . . . . . . . . . . . . . . . . . . . . . . . . . . . . . . . . . . . . . . . . . . . . . . . 3
9 hIghlIghts . . . . . . . . . . . . . . . . . . . . . . . . . . . . . . . . . . . . . . . . . . . . . . . . . . . . . . . . . . . . . . . . . . . . . . . . . . . . . . . . . . . . . . . . . . . . . . . . . . . . . . . . . . . . . . . . . . . . 39 .1 architectural highlights . . . . . . . . . . . . . . . . . . . . . . . . . . . . . . . . . . . . . . . . . . . . . . . . . . . . . . . . . . . . . . . . . . . . . . . . . . . . . . . . . . . . . . . . . . . . . . . . . . . . . . . . . 39 .2 environmental highlights . . . . . . . . . . . . . . . . . . . . . . . . . . . . . . . . . . . . . . . . . . . . . . . . . . . . . . . . . . . . . . . . . . . . . . . . . . . . . . . . . . . . . . . . . . . . . . . . . . . . . . . 3
10 why It mAkes sense . . . . . . . . . . . . . . . . . . . . . . . . . . . . . . . . . . . . . . . . . . . . . . . . . . . . . . . . . . . . . . . . . . . . . . . . . . . . . . . . . . . . . . . . . . . . . . . . . . . . 3
11 dIsclAImer / ImPressum . . . . . . . . . . . . . . . . . . . . . . . . . . . . . . . . . . . . . . . . . . . . . . . . . . . . . . . . . . . . . . . . . . . . . . . . . . . . . . . . . . . . . . . . . . . 3
pvresources.com
Annual review 2010Free edition
denis lenardič
Large-Scale PhotovoltaicPower Plants
annual and cumulative installed Power output capacity2000 - 2010

3
Dear reader,
this report presents basic statis-tical data about large-scale pho-tovoltaic power plants put into service by the end of 2010 and a detailed overview for the past decade (2000–2010) . the data-base representing the founda-tion for this report was built dur-ing long-term research related to large scale photovoltaic power plants by the author of this re-port . the report is based on data of more than 6,000 large-scale Pv plants with cumulative peak
power greater than 10 gwp . Please note that only photovolta-ic power plants producing more than 200 kwp put into service by December 2010 are considered – provided that press releases or other official statements were made before the date of publish-ing this report . Because there is still a lack of reliable databases, or other available national or in-ternational sources of informa-tion concerning large-scale pho-tovoltaic power plants, statistical data presented here should be considered to be “conserva-
tive” values1 . For grid connection time, the start of (test) operation is considered . if this data is not available, then official data about grid connection is considered to be the official start of operation . Please note that delays between the start of test operation and of-ficial grid connection can extend to several months in some cases .
Denis LenardičJesenice, December 2011
miguel merino, mstudio, for eyecatching images;
rolf hug, Solarserver, for profes-sional media support;
sibylle Petrak, PhD, Focus So-lar, for precise solar irradiance charts based on satellite solar radiation measurements.
sPecIAl thAnks
For their invaluable contributions to the report’s content, the author would additionally like to express his very special thanks to companies and their representatives, listed below (in alphabetic order):
1 Data published in this report is partially based also on detailed data available for czech republic and italy:
• Výběrprovozovensolárníchelektrárenk31.12.2010,http://eru.cz/user_data/files/statistika_elektro/rocni_zprava/2010/rz/subjekty/9.htm• GSE–ATLASOLAE,http://atlasole.gsel.it/atlasole/

4 Large-ScaLe PhotovoLtaic Power PLantS
credits (in alphabetic order)Focus Solar – juwi – mstudio – rwth aachen – solarhybrid
pvresources .com
Annual review 2010Free edition
large-scale Photovoltaic Power Plantsannual and cumulative installed Power output capacity
Author/Publisher Denis Lenardič, s .p .
Jesenice, Slovenia
contact Address for enquiries
contact(at)pvresources .com
Published in December 2011
disclaimerthe information provided in this report, including text, graphics, links or other items,
is provided “as is” without warranties of any kind . the author does not warrant the
accuracy, reliability or completeness of this information and expressly disclaims liability
for errors or omissions in this report .
references• Výběrprovozovensolárníchelektrárenk31.12.2010,
http://eru.cz/user_data/files/statistika_elektro/rocni_zprava/2010/rz/subjekty/9.htm
• GSE–ATLASOLAE,http://atlasole.gsel.it/atlasole/
copyright ©2011 denis lenardič, All rights reserved. reproduction and distribution of all or any part of the content in any form or by
any electronic or mechanical means without written permission from the publisher
is prohibited . no rights are granted by the author/publisher of this report for use
of material (images, maps, photos . . .) owned by any third party . Before using such
material, permission of the author(s)/owner(s) is required .

5Power caPacity
introduction
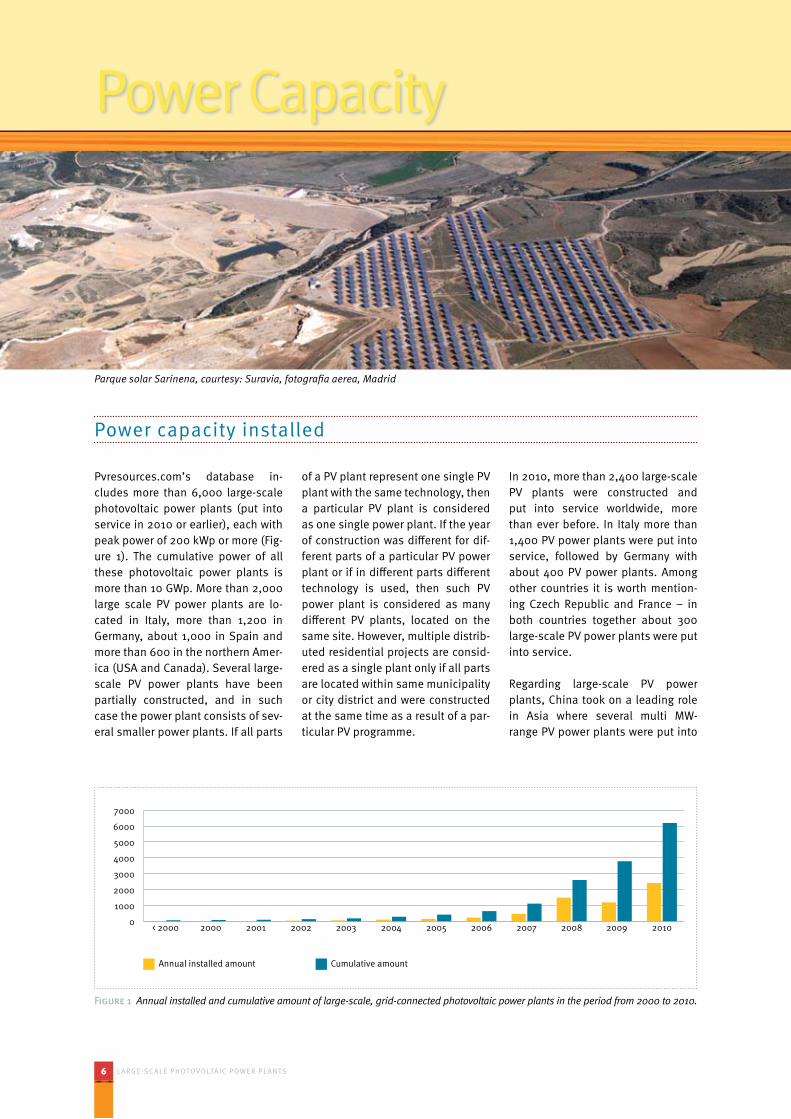
Pvresources .com’s database in-cludes more than 6,000 large-scale photovoltaic power plants (put into service in 2010 or earlier), each with peak power of 200 kwp or more (Fig-ure 1) . the cumulative power of all these photovoltaic power plants is more than 10 gwp . More than 2,000 large scale Pv power plants are lo-cated in italy, more than 1,200 in germany, about 1,000 in Spain and more than 600 in the northern amer-ica (USa and canada) . Several large-scale Pv power plants have been partially constructed, and in such case the power plant consists of sev-eral smaller power plants . if all parts
of a Pv plant represent one single Pv plant with the same technology, then a particular Pv plant is considered as one single power plant . if the year of construction was different for dif-ferent parts of a particular Pv power plant or if in different parts different technology is used, then such Pv power plant is considered as many different Pv plants, located on the same site . however, multiple distrib-uted residential projects are consid-ered as a single plant only if all parts are located within same municipality or city district and were constructed at the same time as a result of a par-ticular Pv programme .
in 2010, more than 2,400 large-scale Pv plants were constructed and put into service worldwide, more than ever before . in italy more than 1,400 Pv power plants were put into service, followed by germany with about 400 Pv power plants . among other countries it is worth mention-ing czech republic and France – in both countries together about 300 large-scale Pv power plants were put into service .
regarding large-scale Pv power plants, china took on a leading role in asia where several multi Mw-range Pv power plants were put into
6
Power capacity
Large-ScaLe PhotovoLtaic Power PLantS
Power capacity installed
0
1000
2000
3000
4000
5000
6000
7000
20102009200820072006200520042003200220012000< 2000
Figure 1 Annual installed and cumulative amount of large-scale, grid-connected photovoltaic power plants in the period from 2000 to 2010.
annual installed amount cumulative amount
Parque solar Sarinena, courtesy: Suravia, fotografia aerea, Madrid

7Power caPacity
service in last year . china is followed by india, whereas both countries could develop into world leading Pv markets in the near future . europe is
still by far the most developed region with more than 2,000 large-scale Pv plants put into service in 2010 . in europe about 5,000 utility-scale Pv
power plants are currently in opera-tion, followed by the USa and can-ada with about 600 utility-scale Pv power plants .
mwp* country locAtIon regIon/ProvInce descrIPtIon
97 canada Sarnia ** ontario Sarnia Pv power plant
84 .2 italy Montalto di castro Lazio Montalto di castro Pv Power Plant
80 .2 germany Finsterwalde Brandenburg Finsterwalde i,ii,iii
70 .6 italy San Bellino veneto rovigo Pv power plant
60 Spain olmedilla de alarcón castilla-La Mancha Parque Fotovoltaico olmedilla de alarcon
54 germany Straßkirchen Bavaria Solarpark Straßkirchen
53 germany turnow-Preilack *** Brandenburg Solarpark Lieberose
48 USa Boulder city, nv nevada copper Mountain 1
47 .6 Spain Puertollano castilla-La Mancha Parque Solar Puertollano
46 Portugal Moura alentejo Moura photovoltaic power plant
42 .7 italy cellino San Marco apulia cellino San Marco Pv power plant
40 germany Brandis Sachsen Solarpark waldpolenz
38 .3 czech republic ralsko Libereckýkraj Fve ralsko
38 France Losse aquitaine Parc Solaire gabardan
36 .2 italy alfonsine emilia-romagna Parco Fotovoltaico alfonsine
35 .9 germany reckahn Brandenburg Solarpark reckahn i,ii
35 .1 czech republic NováVes Středočeskýkraj Fve vepřek
34,6 italy Sant’alberto emilia-romagna Sant’alberto Pv Power Plant
34,5 Spain trujillo extremadura Parque Fotovoltaico La Magascona, La Magasquila
34,4 germany Dörlesberg **** Baden-württemberg Solarpark ernsthof
* Dc array power capacity is not available for all Pv power plants ** official ac power capacity is 80 Mw . Data presented in this table is unofficial Dc power and is based on personal communication . *** Solarpark Lieberose was expanded for an additional 18 Mw stage in 2011 **** Solarpark ernsthof includes Solarpark ernsthof ost and ernsthof west i-iv
Table 1 Largest photovoltaic power plants as at December 2010
Parque solar Sarinena, courtesy: Suravia, fotografia aerea, Madrid

8
Power capacity
Large-ScaLe PhotovoLtaic Power PLantS
mwp* country locAtIon regIon/ProvInce descrIPtIon
97 canada Sarnia ** ontario Sarnia Pv power plant
84 .2 italy Montalto di castro Lazio Montalto di castro Pv Power Plant
80 .2 germany Finsterwalde Brandenburg Finsterwalde i,ii,iii
80 Ukraine ohotnikovo crimea ohotnikovo Pv power plant
80 Ukraine Perovo crimea Perovo Pv power plant
78 germany Senftenberg Brandenburg Solarpark Senftenberg ii,iii
71 germany turnow-Preilack *** Brandenburg Solarpark Lieberose
70 .6 italy San Bellino veneto rovigo Pv power plant
70 germany wittstock Brandenburg Solarpark alt Daber
67 .2 France Losse aquitaine Parc Solaire gabardan
68 canada Sault Ste .Marie ontario Starwood SSM i,ii,iii
60 Spain olmedilla de alarcón castilla-La Mancha Parque Fotovoltaico olmedilla de alarcon
54 germany Straßkirchen Bavaria Solarpark Straßkirchen
52 germany tutow Brandenburg Solarpark tutow i,ii,iii
48 italy canaro veneto Serenissima Pv Power Plant
48 USa Boulder city, nv nevada copper Mountain 1
47 .6 Spain Puertollano castilla-La Mancha Parque Solar Puertollano
46 germany Zerbst Saxony-anhalt Solarpark Zerbst
46 Portugal Moura alentejo Moura photovoltaic power plant
45 USa Kettleman hills, ca california avenal Solar Facility
* Dc array power capacity is not available for all Pv power plants ** official ac power capacity is 80 Mw . Data presented in this table is unofficial Dc power and is based on personal communication . *** Solarpark Lieberose was expanded for an additional 18 Mw stage in 2011
Table 2 Largest photovoltaic power plants as at December 2011
01000
2000
3000
5000
6000
7000
8000
9000
10000
11000
20102009200820072006200520042003200220012000< 2000
4000
MWp
Figure 2 Annual installed and cumulative power output capacity of large-scale, grid-connected photovoltaic power plants in the period from 2000 to 2010.
annual installed power cumulative installed power
9Power caPacity
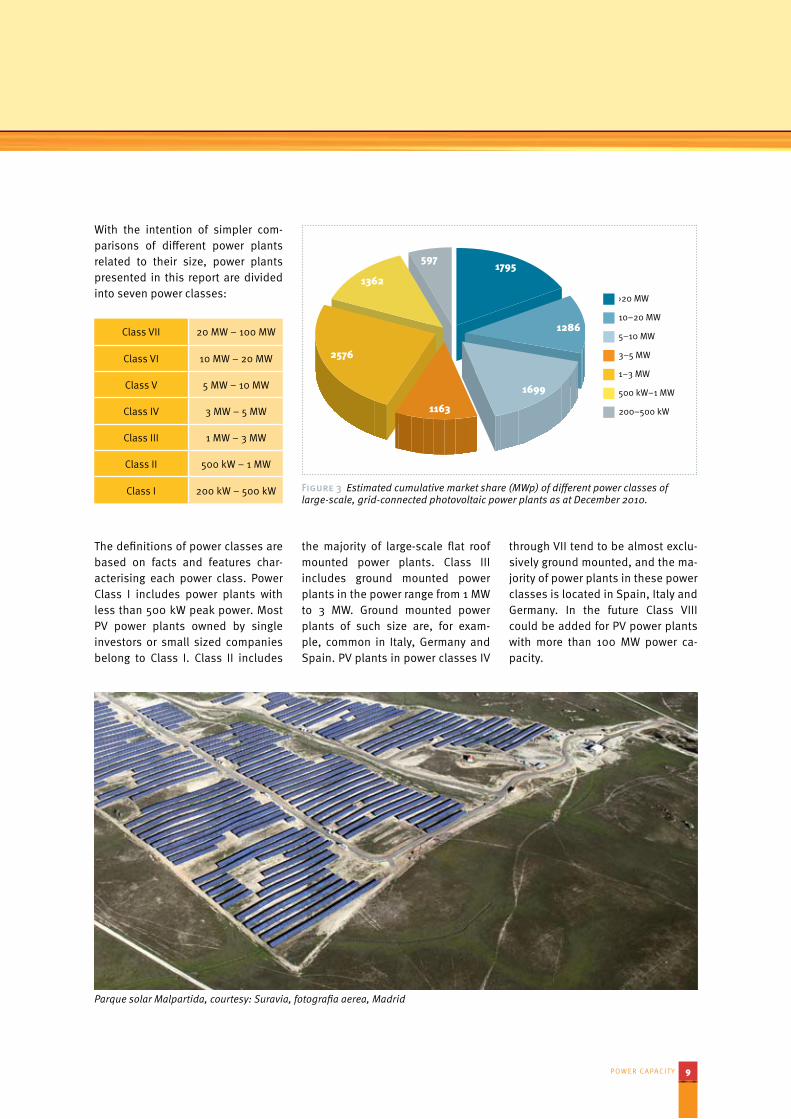
with the intention of simpler com-parisons of different power plants related to their size, power plants presented in this report are divided into seven power classes:
class vii 20 Mw – 100 Mw
class vi 10 Mw – 20 Mw
class v 5 Mw – 10 Mw
class iv 3 Mw – 5 Mw
class iii 1 Mw – 3 Mw
class ii 500 kw – 1 Mw
class i 200 kw – 500 kw Figure 3 Estimated cumulative market share (MWp) of different power classes of large-scale, grid-connected photovoltaic power plants as at December 2010.
10–20 Mw
›20 Mw
5–10 Mw
3–5 Mw
1–3 Mw
500 kw–1 Mw
200–500 kw
597
the definitions of power classes are based on facts and features char-acterising each power class . Power class i includes power plants with less than 500 kw peak power . Most Pv power plants owned by single investors or small sized companies belong to class i . class ii includes
the majority of large-scale flat roof mounted power plants . class iii includes ground mounted power plants in the power range from 1 Mw to 3 Mw . ground mounted power plants of such size are, for exam-ple, common in italy, germany and Spain . Pv plants in power classes iv
through vii tend to be almost exclu-sively ground mounted, and the ma-jority of power plants in these power classes is located in Spain, italy and germany . in the future class viii could be added for Pv power plants with more than 100 Mw power ca-pacity .
1362
2576
1163
1699
1286
1795
Parque solar Malpartida, courtesy: Suravia, fotografia aerea, Madrid

10
Power capacity
Large-ScaLe PhotovoLtaic Power PLantS
Large-scale Pv power plants installed in europe
as at December 2010, more than 3 gw of large-scale Pv power plants were located in Spain, followed by germany (>2 .67 gwp) and italy (>1 .966 gwp) . cumulative power ca-pacity in czech republic has reached almost 1 gw, but all other countries are far behind . Power installed in France, including its overseas de-partments, was about 240 Mw as at December 2010 . other markets worth mentioning were Belgium and greece . other small markets that have shown some progress in recent years include, for example, Slovakia and Slovenia .
country mwp
country Mwp
Spain 3 .015
germany 2 .670
italy 1 .966
czech republic 902
France 192 (240 *)
Belgium 118
Portugal 85
greece 41
* including overseas departments
Table 3 Estimated cumulative power output capacity of utility-scale PV power plants in some European countries as at December 2010
Courtesy: Miguel Merino, mstudio, Madridwww.mstudio.es
sPAIn germAny ItAly czech rePublIc usA
2000 < 2 37 7 < 1 11
2001 < 2 40 7 < 1 15
2002 < 5 47 7 < 1 22
2003 < 5 60 8 < 1 32
2004 < 10 119 8 < 1 43
2005 15 199 8 1 60
2006 65 314 9 1 90
2007 359 524 31 3 158
2008 2660 812 161 31 269
2009 2887 1536 520 286 387
2010 3015 2670 1966 904 663
Table 4 Estimated cumulative power output capacity (MWp) of utility-scale PV power plants for World largest PV markets

11Power caPacity
a significant decrease of investment cost of large-scale photovoltaic pow-er plants has been observed in recent years . investment cost decreased from about 6 million eUr per Mwp in 2008 to about 2 million eUr per Mwp in year 2011 . investment cost for ground mounted Pv power plants for recent years is presented in Figure 4 .
the analysis of investment costs presented in Figure 4 is based on
detailed investment related data of about 500 Pv power plants put into service from 2006 to 2010 and col-lected in recent years for the author’s research . Based on the data of power plants put into service in italy, invest-ment costs are estimated to be with-in a similar range as in germany or Spain with an average value between 2 .5 and 3 .5 million eUr per Mwp in 2010 . Much investment data are available for other countries, how-
ever italy and the czech republic are especially worth mentioning . in eu-rope, the czech republic has offered some quite interesting financial con-ditions . an average investment value for crystalline Pv power plants was at a similar level as the thin-film power plants in germany in recent years . Basically no big differences between investment price (per kwp) for utility scale and smaller Pv power plants were observed in recent years .
Large-Scale Pv investment costs
2007 2008 2009 20100
1
2
3
4
5
6
7EUR/Wp
Figure 4 Investment costs (EUR/MWp) for ground-mounted PV power plants >200 kWp for time period from 2006 to 2010.
investment costs
40 Mwp – 100 Mwp
Sarnia – Montalto di castro – Finsterwalde – ohotnikovo – Senftenberg – Lieberose – San Bellino – wittstock – gabardan – Perovo – Sault Ste .Marie – olmedilla de alarcon – Straßkirchen – tutow – Serenissima – Boulder city – Puertollano – Zerbst – Moura – Kettleman hills – Köthen – cellino San Marco
20 Mwp – 40 Mwp
Brandis – reckahn – alfonsine – veprek – Sant’ alberto – trujillo – Dörlesberg – arnedo – curbans – Dulcinea – gunthawada – Cimmaron–DonAlvaro,Merida–Ševětín–Giebelstadt–Lönnewitz–Heideblick–Eiche–FuenteAlamo–Lauingen– arcadia – Finow – Mixdorf – Saint-Symphorien – Lombardy – Sinan – Les Mees – arnprior – Lucainena de las torres – abertura – Jumilla – almaraz – Pocking – Mengkofen – el coronil – villarrobledo – Blythe – rothenburg – geermu – hongsibao – Sheyang – Seoul – Xuzhou city – granadilla de albona – calasparra – Beneixama – el Bonillo
MaximumMinimum
75%25%
economics

12
Power capacity
Large-ScaLe PhotovoLtaic Power PLantS
0 100 200 300 400 500 km
Monaco
3015 MWp
< 1 MWp
192/240* MWp
118 MWp
< 1 MWp
9 MWp
6.9 MWp3.1 MWp
20.5 MWp
41 MWp
904 MWp
85MWp
1966MWp
Denmark
Spain
Portugal
Italy
FranceSwitzerland
AustriaRomania
Bulgaria
Greece
Albania
Belgium
Luxembourg
Li.
Ireland
Great Britain
Czech Republic
Hungary
Poland
Latvia
Estonia
Lithuania
Sweden
Norway Finland
SlovakiaGermany
Atlantic
Baltic SeaNorth Sea
Mediterranean
Sardinia
Corsica
Sicily
Majorca
Croatia
to Russia
Belarus
Ukraine
Slovenia
HerzegovinaBosnia-
Serbia
Macedonia
MontenegroAndorra
2670 MWp › 30 MWp
17.4 MWp
0.2 MWpVatican
7.5 MWp
Netherlands
Figure 4 large-scale Pv power plants - installed power capacity in european countries as at december 2010 (map is courtesy of Sibylle Petrak, Focus Solar and Ulrich Dewald, Hans-Joachim Ehrig, RWTH University of Aachen)
Solarpark Finow Tower, courtesy: solarhybrid
* including overseas departments

13Power caPacity

14
Power capacity
Large-ScaLe PhotovoLtaic Power PLantS
Courtesy: Miguel Merino, mstudio, Madrid
Solarpark Lieberose, courtesy juwi

15Power caPacity