large-sample evidence on firms’ year-over-year md&a
TRANSCRIPT

Large-sample Evidence on Firms’ Year-over-year MD&A Modifications
Stephen V. Brown Fisher School of Accounting
University of Florida (352) 273-0227
Jennifer Wu Tucker Fisher School of Accounting
University of Florida (352) 273-0214
December 2010
Forthcoming in Journal of Accounting Research We thank Ray Ball, Brian Bratten, Monika Causholli, Alan Cooke, Gus De Franco, Vicki Dickinson, Michael Donohoe, Ann Gaeremynck, Doug Hanna, Carlos Jiménez, Marcus Kirk, Feng Li, Joshua Livnat, Bill Mayew, Volkan Muslu, Karen Nelson, David Reppenhagen, Eddie Riedl, Sergei Shabanov, Doug Skinner (the editor), Ram Venkataraman, an anonymous referee, and participants at the University of Florida, University of Maastricht, Southern Methodist University, New York University, and University of Kentucky accounting workshops, the 2009 FEA Conference, the 2010 Journal of Accounting Research Conference, and the 2010 American Accounting Association Annual Conference. We thank Lan Su for able research assistance. Jenny Tucker thanks the Luciano Prida, Sr. Term Professorship Foundation for financial support.

Large-sample Evidence on Firms’ Year-over-year MD&A Modifications
ABSTRACT
The Securities and Exchange Commission (SEC) has expressed concern about the
informativeness of firms’ Management Discussion and Analysis (MD&A) disclosures. A
firm’s MD&A is potentially uninformative if it does not change appreciably from the
previous year after significant economic changes at the firm. We introduce a measure for
narrative disclosure—the degree to which the MD&A differs from the previous disclosure—
and provide three findings on the usefulness of MD&A disclosure. First, firms with larger
economic changes modify the MD&A more than those with smaller economic changes.
Second, the magnitude of stock price responses to 10-K filings is positively associated with
the MD&A modification score, but analyst earnings forecast revisions are unassociated with
the score, suggesting that investors—but not analysts—use MD&A information. Finally,
MD&A modification scores have declined in the past decade even as MD&A disclosures
have become longer; the price reaction to MD&A modification scores has also weakened,
suggesting a decline in MD&A usefulness.
Keywords: MD&A, voluntary disclosure, similarity score, difference score. Data Availability: http://www.accountingresearch.org/data

1
1. Introduction
This paper examines the extent to which firms modify the Management Discussion and
Analysis (MD&A) from year to year, the usefulness of these modifications to market
participants, and the trend in modifications and usefulness over time. As a key narrative
disclosure required by the Securities and Exchange Commission (SEC) for annual and
quarterly financial reporting, the MD&A must cover certain topics but managers have
flexibility in choosing the breadth and depth of what is discussed. The MD&A is intended as
a way for managers to provide their perspectives of the firm to investors, such as why
earnings have changed, what liquidity needs the firm faces, what capital resources have been
or are planned to be used, and what material market risks the firm is exposed to. Such
information would help investors assess the firm’s past performance and current financial
condition as well as predict future cash flows. An MD&A is unlikely to serve this purpose if
the document does not change appreciably from the previous year, especially after significant
economic changes.
The modification aspect of MD&A disclosure has also been a concern to regulators. The
SEC warned about the lack of modifications in narrative SEC filings in A plain English
handbook: how to create clear SEC disclosure documents, published in 1998 (SEC [1998],
p.12). For the MD&A in particular, in three places in its 2003 MD&A guidance the SEC
urged firms to “evaluate issues presented in previous periods and consider reducing or
omitting discussion of those that may no longer be material or helpful or revise discussions
where a revision would make the continuing relevance of an issue more apparent.”1 Recently,
the SEC told managers to “cut down on the needless information it [Corporate America] 1 See Part III. A, B.1, and B.2 of “Release No. 33-8350: Commission guidance regarding management’s discussion and analysis of financial condition and results of operations” by the SEC on December 19, 2003.
2
discloses to investors” and said it was “looking at its rules to determine whether companies
are being asked to provide the ‘right’ information.”2 This announcement mentioned the
MD&A as a key interest of the SEC.
We develop an MD&A modification score based on an algorithm commonly used by
Internet search engines to determine similarities between documents. We use this measure to
examine three questions. First, do firms with larger economic changes modify the MD&A
more than firms with smaller economic changes? An affirmative finding would suggest that
firms meet a baseline level of disclosure.3 Second, do investors and financial analysts use the
information revealed by MD&A modifications? The usefulness of MD&A disclosure has
been an important issue to investors and regulators. On the one hand, the MD&A was
mandated as a unique venue for providing information to investors and thus the modifications
are expected to be useful. On the other hand, managers may use their discretion to
strategically obfuscate the financial results (Li [2008]). In addition, the MD&A may not be
useful for real-time decision making because of its relative lack of timeliness. Third, have
managers’ MD&A modification behaviors and market participants’ reactions to the MD&A
changed over time? This question is relevant in light of the significant changes in firms’
regulatory and information environments in the past decade.
For the first question—do firms with larger economic changes modify the MD&A more
than firms with smaller economic changes?—we use a range of variables to capture a firm’s
changes in operations, liquidity, capital resources, risk exposure, and business components.
We find a positive association between the MD&A modification score and these variables,
2 See “SEC to firms: Cut the ‘mind numbing’ disclosures,” by Rachelle Younglai, Reuters, November 4, 2009. 3 Although the SEC does not prescribe a minimum (baseline) compliance level, we use the phrase “meet a minimum (baseline) disclosure requirement” to mean that as expected from the Regulation, firms with larger economic changes provide more extensive disclosure than those with smaller economic changes.

3
suggesting that firms meet a minimum disclosure requirement. In addition, managers appear
to modify the document to a larger degree after changes in liquidity and capital resources
(LCR) than after changes in operations, suggesting that the MD&A is perhaps a better
information source about LCR than about earnings. Further, by holding the economic
changes constant, we find that cross-sectional variation in MD&A modifications is associated
with firm size, competition, and legal environment—factors that have been identified in prior
research as determinants of other voluntary disclosure decisions. This finding lends
credibility to the idea that the modification score captures information in narrative disclosure.
For the second question—do investors and financial analysts use the information revealed
by MD&A modifications?—we use a three-day stock return and find that investors respond
to firms’ 10-K filings more strongly when the MD&A is modified to a larger degree. The
overwhelming majority of financial analysts, however, do not revise their earnings forecasts
in the 30 days following the filing date. Further, the magnitude of forecast revisions from the
analysts who do revise is not associated with the MD&A modification score. These results
suggest that equity investors use the MD&A information but analysts do not, perhaps
because the MD&A contains new information for investors to predict cash flows in future
periods but provides little new information about the subsequent period’s earnings.
To further understand the findings related to the first two questions, we hand-code the
MD&A documents of a subsample of firms in the top and bottom quintiles of the
modification score. We find that high-score firms more often discuss different aspects of
business in the current year (that do not appear in the previous year) than do low-score firms.
Even for the aspects that a firm discusses in both years, high-score firms change the
discussion to a larger extent than do low-score firms. These results further validate our
4
modification score. More importantly, we observe that the above differences are largely
driven by discussion about operations and LCR, not by risk factor disclosures and the use of
cautionary language. Furthermore, we find that managers more often discuss different
aspects of LCR (that do not appear in the previous year) than they discuss operations. These
observations corroborate our findings of (1) a higher association of MD&A modifications
with LCR changes than with earnings changes and (2) the usefulness of MD&A
modifications to investors but not to analysts.
Finally, to answer the third question—have firms’ MD&A modification behaviors and
market participants’ reactions to the MD&A changed over time?—we examine the trend of
MD&A modification scores and market participants’ reactions over the past decade. While
MD&A disclosures have become longer over time, they have become more like what
investors saw in the previous year. The combined trends of increasing MD&A length and
decreasing MD&A modification scores suggest that, over time, managers increasingly use
boilerplate disclosure (i.e., standard disclosure that uses many words with little firm-specific
or fiscal-period-specific content). Moreover, we find that the price responses to MD&A
modifications have weakened over time. These findings suggest a decline in MD&A
usefulness in recent years despite the SEC’s 2003 guidance on improving the MD&A.
Our study makes three contributions to the accounting literature. First, we propose a new
measure for narrative disclosure. Measuring narrative disclosure is challenging because the
disclosure is qualitative, difficult to quantify, and prone to disagreement among evaluators.
Although our measure is not perfect, it is one step forward in understanding and quantifying
corporate narrative disclosure. It complements existing measures such as document length,
readability (sentence length and the number of syllables per sentence), tone (positive versus

5
negative words), forward-looking word counts, and small-sample hand coding. Our measure
is applicable to many other accounting settings where the disclosure is narrative, its timing is
routine, but its content is discretionary, such as proxy statements, annual CEO letters to
shareholders, earnings announcement press releases, and the prepared portion of quarterly
conference calls.
Second, our study provides fresh evidence of managers’ MD&A disclosure behaviors.
Compared to earnings announcement press releases, the form of MD&A disclosure is
mandatory and its timing is late. Compared to the notes accompanying the financial
statements, the content of MD&A disclosure is discretionary and not audited. Given this
mixed mandatory/discretionary nature and lack of timeliness, the quality and usefulness of
the MD&A have been issues since the MD&A was required in 1980. Constrained by the high
costs of hand-processing long narrative documents, the MD&A literature has provided
limited evidence of the usefulness of MD&A disclosure (Cole and Jones [2005]). We
examine one important facet of MD&A disclosure from a large sample—modifications from
the previous year—and provide findings helpful for investors and researchers to understand
the usefulness of the MD&A. As the SEC seeks more informative narrative disclosure from
its filers and the International Accounting Standards Board has advised, but not mandated,
that companies prepare an MD&A (IASB [2009]), our findings are also timely and relevant
to regulators. Our third contribution is to extend the emerging large-sample text analysis
literature.4
4 See Li [2008, 2010], Lerman and Livnat [2010], Feldman, Govindaraj, Livnat, and Segal [2009], Kothari, Li, and Short [2009], Frankel, Mayew, and Sun [2010], Nelson and Pritchard [2007], Matsumoto, Pronk, and Roelofsen [2007], Davis, Piger, and Sedor [2008], Davis and Tama-Sweet [2009], and Muslu, Radhakrishnan, Subramanyam, and Lim [2009].
6
The paper proceeds as follows. Section 2 provides background information about MD&A
regulation and discusses related research. Section 3 explains how we measure the differences
between documents. Section 4 describes the data and provides descriptive statistics. Section 5
tests whether firms with larger economic changes modify the MD&A more than firms with
smaller economic changes and examines the firm characteristics associated with cross-
sectional variation in MD&A modifications. Section 6 tests investors’ and analysts’
responses to the MD&A. Section 7 reports our findings from a hand-coded subsample of
MD&A documents, Section 8 examines the trend of MD&A modifications and market
participants’ reactions, and Section 9 concludes.
2. Background and Related Research
2.1 BACKGROUND
Item 303 of Regulation S-K mandates that companies provide an MD&A as Item 7 in the
10-K filing. Managers are required to discuss (1) the results of operations and (2) liquidity
and capital resources. Additional required topics now include “critical accounting policies
and estimates,” market risk disclosure, and off-balance-sheet arrangements. The SEC has
adopted a management approach to allow investors to “see the company through the eyes of
management,” helping investors understand why the operating results and financial condition
have changed and assess the implications of these changes for future cash flows (SEC
[2003]). While the discretion accorded to managers allows them to tailor disclosure to suit
each business, it also gives managers leeway to keep disclosure to a minimum.
The SEC has conducted several targeted reviews of firms’ MD&A practices and provided
three interpretive releases to guide MD&A disclosure (SEC [1987], [1989], and [2003]). The

7
most recent review was on the Fortune 500 companies’ MD&A disclosures filed in 2002 and
as a result 350 companies received comment letters.5 After the review, the SEC issued the
most recent interpretive guidance on December 19, 2003 and emphasized that managers
should provide an analysis, explaining management’s view of the implications and
significance of economic changes at the firm.
2.2 RELATED RESEARCH
Prior research takes three approaches to quantifying disclosure in the MD&A: (1) hand-
coded content analysis (Bryan [1997], Rogers and Grant [1997]), (2) survey rankings
(Clarkson, Kao, and Richardson [1999], Barron, Kile, and O’Keefe [1999]), and (3)
automated text analysis. Under each approach researchers assess the usefulness of MD&A
disclosure by associating their measures of MD&A information or disclosure quality with (1)
future operating performance, (2) contemporaneous returns, (3) future returns, and (4) analyst
forecast behaviors. The hand-coding and survey approaches result in limited sample size and
difficulties for future replication. Because Cole and Jones [2005] and Feldman, Govindaraj,
Livnat, and Segal [2010] provide excellent reviews of the MD&A literature, we highlight a
few recent papers that use automated text analysis and discuss how our study advances the
literature.
Using automated text analysis, Li [2008] finds that the annual reports (including the
MD&A section) of firms with lower earnings and those with positive but less-persistent
earnings are more difficult to read. In a follow-up study, Li [2010] finds that firms 5 “We issued a significant number of comments generally seeking greater analysis of the company’s financial condition and results of operations. Our comments addressed situations where companies simply recited financial statement information without analysis or presented boilerplate analyses that did not provide any insight into the companies’ past performance or business prospects as understood by management.” (“Summary by the Division of Corporation Finance of significant issues addressed in the review of the periodic reports of the Fortune 500 companies,” 2/27/2003. http://www.sec.gov/divisions/corpfin/fortune500rep.htm)

8
strategically use the tone of forward-looking statements in the MD&A and that this tone can
be used to predict future earnings.
Nelson and Pritchard [2007], Feldman et al. [2009], and Muslu, Radhakrishnan,
Subramanyam, and Lim [2009] also use automated text analysis. Nelson and Pritchard
extract the cautionary language that either invokes the safe harbor under the Private
Securities Litigation Reform Act of 1995 or details risk factors generally found in the
MD&A and business description sections of 10-K filings. They take every three adjacent
words in a sentence as a unit, called a “trigram,” and develop a resemblance score that
summarizes whether a trigram is present in both the current year and the previous year. They
find that firms that are subject to greater litigation risk update the cautionary language to a
larger degree from the previous year; after a decrease in litigation risk the previous
cautionary language is not removed.6 Feldman et al. find that a positive tone in the MD&A is
associated with higher contemporaneous and future returns and that a tone that becomes
more negative than the previous year is associated with lower contemporaneous returns.
Muslu et al. find that firms provide more forward-looking statements in the MD&A when
their stock prices poorly reflect future earnings and these disclosures in turn improve the
stock price informativeness of future earnings.
Despite the above studies, an important facet of MD&A disclosure—to what extent is it
modified from the previous year?—is largely unexplored. We introduce a measure of
document differences from the information retrieval literature. In addition, our measure is a
changes measure by design and therefore better captures new information disclosed in the
6 Nelson and Pritchard also calculate a resemblance score for the MD&A (excluding the cautionary language) as a control variable. Their sample is small (1,113 firm-year observations) because the cautionary language section has to be manually identified (even though their resemblance calculations are automated). In their Table 3, they report an upward trend in the word count of cautionary language, but not in staleness.

9
MD&A than the levels measures used by most previous text-analysis studies. Moreover, the
regulatory and information environments in which firms operate have changed substantially
since most of the MD&A studies were conducted (Francis, Schipper, and Vincent [2002],
Bushee, Matsumoto, and Miller [2003], Griffin [2003]). Following these changes, the
disclosure mix and the way managers use the MD&A to communicate with the capital
markets have also likely changed. Meanwhile, following the Internet revolution, market
participants have access to more news outlets and faster information dissemination. Whether
and how they use MD&A disclosure has also likely changed. Therefore, we examine MD&A
modifications and usefulness in the recent decade.
3. Measuring Year-Over-Year MD&A Modifications
Internet search engines organize documents into similar groups and compare web users’
queries to documents in the search provider’s database (for example, the “Find Similar
Documents” function in Google). Many of these search engines have traditionally used the
Vector Space Model (VSM) described by Salton, Wong, and Yang [1975] (Singhal [2001]).
We use this model to compare a firm’s current year MD&A to that from the previous year.
The VSM represents a document as a vector in an n-dimensional Euclidean space, where n is
the number of unique words in all documents in the sample and the value of each vector
element is the frequency of a particular word in that document.7 The similarity of any two
documents is measured by the angle between the two vectors representing the documents: a
smaller angle indicates more similar documents.
7 The VSM may be implemented by using phrases. Using each word as a unit is typically preferable to using phrases or other complex text representations (Salton and Buckley [1988], p.515, Singhal [2001], p.5).

10
Suppose the sample has n unique words. We represent two documents each as an n-
dimension vector—v1 for document 1 and v2 for document 2:
v1 = (w1, w2, … , wn-1, wn) and v2 = (ψ1, ψ2, … , ψn-1, ψn)
Here, wi and ψi are the counts of each word i [1, n]. The similarity score (Sim) is:
1 2 1 2
1 2 1 2
.cos( ) .
|| || || || || || || ||
v v v vSim
v v v v
where θ is the angle between v1 and v2, (.) is the dot product operator, ||v1|| is the vector
length of v1, and ||v2|| is the vector length of v2.8 This score is bounded between 0 and 1 with
a higher score indicating more similarity (cos0=1). The difference score is 1 minus the
similarity score.
As a simplified example, consider two documents where the number of unique words, n,
is 5. Each document is then represented by a vector of five elements with each value being
the number of occurrences of the corresponding word in that document. Three possible cases
are:
Case (i) Case (ii) Case (iii)
Vector v1 = (1, 3, 1, 2, 1) v2 = (1, 3, 1, 2, 1)
v1 = (1, 1, 0, 1, 1) v2 = (1, 0, 1, 1, 1)
v1 = (4, 0, 0, 0, 3) v2 = (0, 2, 2, 1, 0)
Length of vector ||v1|| = 4, ||v2|| = 4 ||v1|| = 2, ||v2|| = 2 ||v1|| = 5, ||v2|| = 3 Dot product of v1 and v2 16 3 0
Similarity score 1 0.75 0 Difference score 0 0.25 1
The two documents are identical in case (i), slightly different in case (ii), and totally different
in case (iii).
8 The length of a vector is not the same concept as the dimension of the vector or the length of the document. For example, the dimension of v1 is n, the length of the document represented by v1 is (w1+w2+ … + wn), and the length of v1 is (w1
2+w22+ … + wn
2) ½. The similarity score formula is also called the “cosine” measure. It is basically the formula for the uncentered correlation coefficient of two vectors.

11
Various weighting functions have been developed in the information retrieval literature in
applying the VSM. The use of word counts described above is referred to as the “term
frequency” (TF).9 A popular weighting refinement is to multiply TF by the logarithm of
M/m, where M is the number of all documents in the sample, m is the number of documents
in which that particular word appears, and M/m is referred to as the “inverse document
frequency” (IDF). As a result, common words are downweighted.10 For example, if a word
appears in every document, it has zero weight (because log1 is 0). In our empirical execution,
we choose the TF-IDF weighting function because of its simplicity and popularity (Salton
and Buckley 1988).
We calculate the difference score between a firm’s current year MD&A and that for the
previous year and refer to it as the “raw difference score,” Rawscore. Appendix A presents
two examples of MD&A disclosure and their raw scores. We cannot directly use Rawscore to
compare the degree of MD&A modifications across firms because the raw difference score is
a decreasing function of document length. The longer a pair of documents, the more probable
a word is included in both documents, leading to a lower likelihood that the documents will
differ (see Appendix B for an analytical proof). Li [2008] reports that a firm’s MD&A length
is sticky over time, albeit with a small growth rate, so comparing consecutive-year MD&A
disclosures across firms involves two long documents for some firms and two short
9 We stem each word using the Porter stemming algorithm to abstract away from word tense and form so that we can focus on the underlying word choice (Manning and Schütze [1999]). For example, “faith,” “faithful,” and “faithfulness” are all stemmed to “faith.” Stemming is used to reduce the dimension of vectors and thus computing time. 10 The IDF weighting eliminates the need for a stop-word list as implemented in many related studies, because common words will receive a weight of, or very close to, zero. For this reason, if a firm merely increases boilerplate with no changes in meaningful disclosure, the difference score will be largely unaffected. On the other hand, IDF heavily weights words that are unique to a company, treating them as very “informative” words. To address the concern of overweighting such words, we alternatively use TF with Li’s [2010] stop-word list to remove common words and our results are largely unchanged.

12
documents for others. The mechanical relationship between Rawscore and document length
must be removed before the difference scores are compared across firms. We empirically
approximate the functional form of the relation between Rawscore and document length by a
Taylor expansion at 0 and calculate the expected difference score given the document length.
Our MD&A modification score is the raw score minus this expected score and is denoted as
variable Score.11
Three contemporaneous accounting and finance studies measure document similarities or
differences. Hoberg and Phillips [2010] examine whether the similarity of product
descriptions in 10-K filings is associated with merger and acquisition decisions. They use the
VSM after removing words that appear in at least 95% of 10-K filings.12 Hanley and Hoberg
[2010] use a regression implementation of the VSM to separate the standard content from the
informative content in an IPO prospectus; the vector weights are a simple word count.
Nelson and Pritchard [2007] use the Ferret Copy Detector software to calculate a
resemblance score between the current and prior years’ cautionary language in 10-K filings.
The software was designed to detect plagiarism and considers the order of words in a
trigram; therefore, it detects similarity at a different level (e.g., the same three words in
different orders are considered different trigrams). The technique identifies the occurrence
but not the frequency of a trigram. In our setting, word frequency in a given MD&A
document conveys information, but a very high frequency in the whole sample indicates that
the word is commonly used and is thus not very indicative of the content of a given
document. Our approach accommodates both features.
11 All of our test results are similar if we replace Score with Rawscore and control for document length by including its natural logarithm. 12 Our results are largely unchanged if we use TF and remove common words following Hoberg and Phillips’ approach.

13
4. Sample and Descriptive Statistics
Our sample period is fiscal years 1997-2006.13 It starts with 1997 because we require the
previous year’s filings to be on EDGAR and 1996 is the first fiscal year for which almost all
companies filed the 10-K electronically. We download 10-K filings from EDGAR and
extract the MD&A from Item 7 in each filing.14 As in Li [2008, 2010], before further
processing we remove tables from the MD&A. We then merge the EDGAR data with
Compustat using the Central Index Key (CIK) and exclude observations (1) whose MD&A
for the previous year is missing, (2) whose total assets or diluted earnings per share (EPS) for
the current year or the previous year are missing, (3) whose year-end stock price is below $1
(to avoid outliers created by small scalars), or (4) which changed the month of fiscal year end
during the year. The screening leaves us with 28,142 firm-year observations. This number is
comparable to the number of 28,279 firm-year observations for 1994-2004 in Li [2008].
Table 1 presents descriptive statistics for the sample by fiscal year.
We validate our document difference measure by comparing the MD&A disclosure of
two firms in the same industry versus two firms not in the same industry. Because of similar
business environments, operating conditions, and specialized industry terminology, the raw
difference measure from comparing two firms within an industry should be lower than that
from firms not in the same industry. In addition, the measure from comparing firms within an
13 We use annual data to avoid seasonality and Compustat’s updates of originally reported quarterly data (Feldman et al. [2009]). Moreover, Griffin (2003) finds a stronger market reaction to 10-Ks than to 10-Qs. 14 Our sample includes the 10-K and 10-K405. Before April 8, 2002, 10-K405 was filed instead of 10-K if insider trading activity was not disclosed in a timely manner. In addition to Item 7, we also extract Item 7a because some companies use Item 7a for market risk disclosure while others include the disclosure in Item 7. The 10-Ks retrieved from EDGAR are free-form text. We use a variety of string searches to extract MD&A, such as “Item 7,” and exclude the extractions led by phrases such as “please refer to Item 7 for more information” and “Item 7 …. Page 8” (which is likely to be a Table of Contents entry). We are able to successfully extract MD&A documents from 73% of the 10-K filings that are covered by Compustat. Most of the filings from which we could not extract MD&A refer to other sources for the MD&A.

14
industry should decrease when the definition of industry is stricter. We define “industry” in
progressively narrower terms by using the eight-digit Global Industry Classification Standard
(GICS) code. Digits 1-2 define the sector (the broadest definition of an industry); digits 1-4
define the industry group; digits 1-6 define the industry; and digits 1-8 define the sub-
industry (the narrowest definition of an industry).
In each year for each industry definition, we compare a firm to every other firm in the
industry and calculate a mean raw difference score for that firm. Averaging this mean
difference score of all firms in an industry, we get a data point for this industry for a given
year. Figure 1 shows the five data points for each year: four from different industry
definitions and one from comparing 1,000 random pairs regardless of industry.15 In each year
the difference measure from comparing two random firms is the highest and the measure
decreases monotonically when the industry definition becomes stricter. Such patterns are
consistent with our expectations, lending support to the idea that our measure captures
document differences. The figure also reveals a downward trend in the difference measure
for all groups. This trend is either because firms’ MD&A disclosures have become more
similar to each other or because document length has increased during our sample period.
After confirming the validity of the raw difference measure, we compare each firm’s
MD&A document with its previous year’s and calculate Rawscore. To gauge the magnitude
of this score, we additionally plot the average Rawscore for each year in Figure 1. For
example, Rawscore is 0.10 for 2006, much lower than the difference scores from comparing
firms within the same industry (ranging from 0.64 to 0.75 for the four industry definitions).
Of course, a firm’s MD&A document is supposed to be more similar to its own in the
15 Comparing these five data points in a given year is valid because each data point is the mean raw score of many firms, each being compared with other firms’ documents with different MD&A length.
15
previous year (because of the same business characteristics) than to a different firm’s MD&A
document. To gauge how high or low a Rawscore value is, Table B2 of Appendix B presents
the sample distribution of Rawscore. The mean of 0.155 and standard deviation of 0.147
indicate that a Rawscore of 0.302 (which is one standard deviation higher than the mean) is
higher than 84% of Rawscore values in the sample.
Score is calculated in Appendix B by adjusting Rawscore for document length. Figure 2
presents the distributions of Rawscore, Score, and MD&A length. The majority of MD&A
documents are between 2,000 and 8,000 words; a few are extremely long. As expected,
Rawscore decreases with document length and Score is flat with respect to MD&A length.16
5. MD&A Modifications after Economic Changes
If managers follow the spirit of MD&A regulations, managers of firms with large
economic changes are expected to provide more in-depth discussion and analysis than other
firms. On the other hand, managers have substantial discretion in what and how to disclose.
Given the costs of preparing long narrative documents, managers may simply use last year’s
MD&A as a template and make minor changes. The role of auditors in overseeing MD&A
disclosure is limited because they merely review the disclosure for consistency with what is
known to them. The risk of an SEC enforcement action is small because of the soft-talk (vs.
hard-fact) nature of the disclosure, even though the MD&A is subject to SEC reviews.
16 Our sample has 60,296 unique words. The 1st and 99th percentiles of the distribution of document length are 1,107 and 21,703 words. Our results are robust to excluding the 99th percentile of the Length observations.
16
5.1 EMPIRICAL MODEL
Economic changes at a firm come from multiple sources, including (1) results of
continuing operations, (2) liquidity and capital resources, (3) market risk exposure, and (4)
business components (e.g., acquisitions, spin-offs, and discontinued operations). Managers’
view of how and why operating results have changed is key information required from the
MD&A. We measure operating changes by the change in a firm’s diluted EPS from the
previous year, scaled by the fiscal-year-end stock price, and refer to the variable as ΔEPS.
Also required from the MD&A is managers’ view of the firm’s liquidity condition and
the use and sufficiency of capital resources. We use three measures for liquidity changes:
|ΔCurrent|, |ΔDebtdue|, and |ΔLeverage|. The current ratio, Current, captures the ability to
meet working capital needs. The amount of debt due in the coming year, Debtdue, captures
the need for short-term liquidity beyond working capital. The amount of total liability,
Leverage, captures the need for total liquidity. We use free cash flows to capture the sources
of cash for capital needs and measure the change in free cash flows as |ΔFCF|. Except for the
current ratio, these variables are scaled by total assets before the differences are calculated.
The SEC requires firms to discuss a known market risk that has “affected reported trends
or financial condition in the period presented, or is reasonably likely to affect materially
future reported results or liquidity.”17 The market risks that companies typically disclose
include commodity prices, interest rates, and foreign currency translation. We use a firm’s
return volatility to proxy for its risk exposure. The greater the exposure, the more volatile the
stock price. Return volatility is calculated from weekly raw stock returns to avoid the
influence of infrequent and non-synchronous trading in daily returns. The change in return
17 See SEC staff responses at http://www.sec.gov/divisions/corpfin/guidance/derivfaq.htm#qgen.
17
volatility from the previous year to the current year is denoted as |ΔStdret|. To mitigate the
effect of outliers, all the changes variables are winsorized at the 1st and 99th percentiles
before the absolute values are taken.
Another form of economic change is the change in business components. These changes
either reflect the execution of a long-term business strategy (e.g., some firms grow by
acquisitions while others grow from within) or the cumulative effects of past operating
performances reaching a threshold (e.g., some units are discontinued or spun off). We use
indicators for substantial asset changes to capture such events: Acquire is 1 if total assets
increase by at least one-third from the previous year and 0 otherwise; Downsize is 1 if total
assets decrease by at least one-third from the previous year and 0 otherwise.18 Acquire is 1
for 20.7% of our sample and Downsize is 1 for 4.2%.
The MD&A may be modified from the previous year because of the implementation of
new MD&A disclosure requirements and accounting standards. We use the fixed-year effects
to control for modifications for this reason. We create a dummy variable for each sample
year except for 2003. Equation (1) summarizes the empirical model:
Score = a0 + a1|ΔEPS| + a2|ΔCurrent| + a3|ΔDebtdue| + a4|ΔLeverage| + a5|ΔFCF| + a6|ΔStdret| + a7Acquire + a8Downsize + year dummies + e (1)
Next, we hold constant the year-to-year economic changes and examine what firm
characteristics, which are typically stable from year to year, are associated with MD&A
modifications. These characteristics have been identified by prior research as determinants of
corporate voluntary disclosures in other venues. Firm size is expected to be positively
associated with the modification score either because large firms are under pressure to
18 We do not use the SDC data because some firms routinely make small acquisitions. Our method ensures that the changes are major.

18
modify the MD&A to avoid the political costs of being perceived as being opaque or because
small firms might be more likely to cut and paste disclosure from the previous year to save
preparation costs. Size is the natural logarithm of total assets at the end of the current year.
The MD&A is reviewed by auditors, and Big N auditors (N is 6, 5, or 4 during our sample
period) may encourage managers to provide more informative disclosure. BigN is 1 if the
firm is audited by a Big N accounting firm and 0 otherwise.
Institutional investors and analysts are key players in a firm’s information environment.
Typically, institutional investors and financial analysts demand more corporate disclosures
for valuation and monitoring purposes (Bushee and Noe 2000). This demand may not apply
to the MD&A because the disclosure is not a timely source of information. By the time the
10-K is filed, these participants might have already obtained the information elsewhere. We
examine institutions’ and analysts’ associations with MD&A modifications without offering
predictions. IO is the percentage of ownership by institutional investors according to the most
recent SEC 13f filing before the 10-K filing. Analyst is the number of analysts whose
earnings estimates for the subsequent year are included in the most recent IBES consensus
before the 10-K filing.
Informative MD&A disclosure may benefit competitors, so firms in competitive
industries may be more concerned about proprietary disclosure costs than those in other
industries. We use the Herfindahl index, Herf, as a proxy for industry competition and
calculate it using the 100 firms (or fewer if the number of firms is less than 100) with the
highest sales in the industry (the first six digits of the GICS code are used for industry
identifications). A lower Herf indicates more intense competition. We predict its coefficient
19
to be positive, meaning that firms in more competitive industries are less likely to make
informative MD&A disclosures.
Finally, firms in a more litigious environment may be more likely to provide disclosure to
defend themselves against potential lawsuits. Following Francis, Philbrick, and Schipper
(1994), we use industry classifications to identify firms that are exposed to high litigation
risk, Litig. Equation (2) is the expanded empirical model:
Score = a0 + a1|ΔEPS| + a2|ΔCurrent| + a3|ΔDebtdue| + a4|ΔLeverage| + a5|ΔFCF| + a6|ΔStdret| + a7Acquire + a8Downsize + a9Size + a10BigN + a11IO+ a12 Analyst + a13Herf + a14Litig + year dummies + e (2)
5.2 TEST RESULTS
Panel A of Table 2 presents descriptive statistics for the non-indicator variables and Panel
B reports Spearman correlations. Score has reasonable variation, ranging from -0.090 at the
25th percentile to 0.047 at the 75th percentile. Score is positively correlated with the absolute
changes in earnings per share, current ratio, short-term debt due, leverage, free cash flows,
return volatility, and with the dummies for the changes in business components.
Table 3 reports the multivariate results, which are robust to heteroskedasticity and within-
firm error correlations.19 The first three columns estimate Equation (1) in different ways.
Column 1 uses the raw absolute values of the economic changes. This estimation preserves
the magnitude of the changes, but the coefficients cannot be readily compared and the
relations between Score and the economic changes are restricted to be linear. Column 2 uses
19 Serial correlations within a firm and cross-sectional correlations within a sample year may exist in our data. We use Rogers standard errors to address serial correlations and use the fixed-year effects to mitigate the effect of cross-sectional correlations. We do not cluster by years in our main analysis because our panel data are very short in the time series and clustering by 10 years may only add noise to the system (Petersen [2009]). Our results, however, are robust to two-way clustering. We do not include firm-fixed effects in the main analysis because the estimation would examine within-firm variations, whereas our interest is broader in this step and because in Equation (2) we specifically examine the firm characteristics that contribute to firm-fixed effects. Our results, however, are robust to adding firm-fixed effects.

20
the decile rankings with 1 being the smallest absolute change group and 10 being the largest.
The coefficients can now be compared; moreover, by using a coarser scale, this approach
relaxes the linearity restriction. Because of these advantages, we treat Column 2 as our
primary analysis. Column 3 aggregates the liquidity and capital resources variables into one
variable LCR, which is the mean decile ranking of |ΔCurrent|, |ΔDebtdue|, |ΔLeverage|, and
|ΔFCF|. This approach allows us to compare the degree of disclosure modifications after
changes in operations versus changes in LCR.
Except for |ΔStdret|, all the explanatory variables in Column 2 have significantly positive
coefficients. The magnitude of the coefficients for operations and liquidity variables is
between 0.002 and 0.003, indicating that the modification scores from firms in the highest
decile are on average 0.018 to 0.027 higher than the scores from those in the lowest decile.
This difference is equivalent to about half of the difference between either the 10th and 25th
percentiles or between the 25th and 50th percentiles of Score and is thus material. If a firm is
ranked high for more than one variable, the difference between its modification score and
those of other firms would be even larger. These results suggest that managers with large
economic changes (except for changes in risk exposure) modify the MD&A more than firms
with small economic changes, apparently meeting a minimum disclosure requirement.
In Column 3, LCR has a coefficient of 0.007 with a t statistic of 13.42, significantly
higher than the coefficient of 0.003 on |ΔEPS| (Wald test F = 42.21). This result suggests that
managers modify the MD&A to a larger extent when discussing changes in LCR than when
discussing operations. Given that firms’ earnings announcements, which typically occur a
few weeks before the 10-K filing, convey predominately information about operations, the
MD&A is perhaps a better information source about LCR than about operations.
21
The last column expands Column 2 and examines why firms with similar year-to-year
economic changes would modify the MD&A to different degrees. The coefficient on Size is
significantly positive at 0.007 (t=7.61), suggesting that large firms modify MD&A disclosure
from the previous year to a greater degree. The coefficients on IO and Analyst are
significantly negative (coefficient = -0.020 and t = -4.62 for IO; coefficient = -0.001 and t = -
3.60 for Analyst). The positive coefficients of 0.070 on Herf (t=3.00) and of 0.013 on Litig
(t=4.41) suggest that firms facing more competition are less likely to provide informative
MD&A disclosure and those in a more litigious environment modify MD&A disclosure to a
larger degree from year to year. Except for the coefficients on IO and Analyst, these findings
are consistent with the conclusion of Clarkson et al. [1999] that MD&A disclosure is part of
a firm’s overall disclosure package, further validating our modification score.
6. Investors’ and Analysts’ Responses to MD&A Modifications
The usefulness of MD&A disclosure has been a long-standing issue.20 On the one hand,
MD&A disclosure was mandated as an important venue for managers to communicate what
cannot be delivered by numbers, financial statements, and notes so that investors will
understand management’s perspective. The modifications are thus expected to be useful. On
the other hand, managers may use the financial reporting and disclosure discretion to mislead
investors (e.g., Teoh, Welch, and Wong [1998], Bartov and Mohanram [2004], Marquardt
and Wiedman [2005]). In particular, Li [2008] concludes that managers use their discretion
in preparing narrative disclosure to strategically obfuscate the underlying financial results. If
so, even if managers modify the MD&A, users will not have a clear view of the company and
20 Until Griffin [2003], the literature failed to find evidence that investors reacted to 10-K or 10-Q filings.

22
therefore their responses to the MD&A may be subdued. Doubts about MD&A usefulness
also arise from its relative lack of timeliness. Even if the MD&A is modified in good faith,
the information is likely preempted by other corporate disclosure venues and the media as
well as the private information search of sophisticated investors.
6.1 EMPIRICAL MODELS
To examine investors’ and analysts’ responses to MD&A information, we exclude 3,685
firm-years (13.1% of the sample) that did not announce earnings before the 10-K filing date,
because investors and analysts would be reacting to an earnings surprise in addition to new
information typically disclosed in the 10-K. 21 We further exclude 286 firm-years with
missing earnings announcement dates because these dates are required in both tests.
Investors’ responses are measured by |CAR|, the absolute value of the cumulative market-
adjusted stock return over the three days beginning with the 10-K filing date (Griffin [2003]).
For analysts’ responses, we first examine the proportion of analysts who revise their earnings
forecasts or issue initial forecasts for year t+1 in the 30-day window after the 10-K filing for
year t. Then we conduct a very conservative analyst revision test on firm-years that have at
least one forecast issued in this post-event window, using only the new forecasts to compute
the post-event consensus. |Revision| is the absolute value of the change from the pre- to post-
10-K consensus, scaled by the stock price at the end of year t.22 In addition, to put investors’
and analysts’ reactions to the 10-K in perspective, we compare them to the reactions to
earnings announcements and pseudo events. The latter are randomly chosen during fiscal 21 These combined earnings announcement and 10-K filing events are not excluded in Griffin [2003]. Feldman et al. [2009] and You and Zhang [2009] do not exclude these events, either, in documenting a drift in the market reaction after 10-K filings. It is unclear to what extent the drift findings are driven by the post-earnings announcement drift of the firms whose earnings news is first released on the 10-K filing date. 22 The test is conservative because if we do not find evidence of analyst reaction for the subsample of revision firms, it would be safe to conclude no analyst reaction for the full sample of revision and no-revision firms.

23
year t+1 after we exclude the earnings announcement and 10-K filing dates for fiscal year t
and the earnings announcement dates for the first three quarters of year t+1.
In the multivariate analysis, we control for firm size (Size), filing delay (Filelate),
additional financial information (NewItems), and the magnitude of market reaction around
the earnings announcement date (|CAREA|). We expect market participants’ reactions to large
firms’ 10-K filings to be smaller than to small firms’ because private information search for
large firms is more active than for small firms (Grant [1980], Atiase [1985]). Filelate is 1 if
the filing is more than 90 days after the fiscal year end and 0 otherwise.23 A late filing
indicates a potentially significant problem (Choudhary, Merkley, and Schloetzer [2009]). We
do not, however, predict the coefficient on Filelate because prior research has documented a
price drop when firms fail to file on time and it is unclear whether the market’s anticipation
of bad news due to the missed deadline was complete.
The MD&A is only part of the 10-K and the literature provides limited guidance on how
to quantify and control for other information in the filing. A key portion of such information
that investors can obtain uniquely from the 10-K is the additional items reported in the full-
fledged financial statements and notes. We proxy for this information using the number of
non-missing and non-zero Compustat items (data1-data399) for the event year and refer to it
as NewItems. This proxy assumes that firms disclose a similar number of basic financial
statement items at the earnings announcement. When this is not the case, the market reaction
to firms with more reporting items at the earnings announcement is expected to be larger in
magnitude than the reaction to other firms. Our variable |CAREA| controls for this cross-
23 Since 2004, the 10-K filing deadline has been accelerated for certain firms. Firms currently have 60, 75, or 90 days to file the 10-K, depending on company size. If a 10-K is not filed within 90 days after the fiscal year end, it is definitely late under either the old or new deadlines.
24
sectional difference, although its main purpose is to control for the complementary or
substitutive relation between the earnings announcement and subsequent 10-K filing.
|CAREA| is the three-day, [-1, 1], cumulative market-adjusted stock return. If the earnings
announcement and 10-K filing are complementary, the 10-K of a firm whose earnings
announcement is informative is also expected to reveal much new information. If the
announcement and filing are substitutes, investors are not expected to react much to the 10-K
of a firm whose earnings announcement has already contained significant information. The
empirical models are: 24
|CAR| = b0 + b1Score + b2Size + b3Filelate + b4NewItems + b5|CAREA| +year dummies+ e (3) |Revision|=c0 + c1Score + c2Size + c3Filelate + c4NewItems + c5|CAREA|+year dummies+e (4)
6.2 TEST RESULTS
To explore the relative usefulness of 10-K filing events, we plot the stock returns and
analyst forecast revisions after 10-K filings along with the responses to earnings
announcements and pseudo events. Figure 3 shows that the reaction to earnings
announcements is much larger than that to 10-K filings and that the latter is slightly larger
than the price movements around pseudo-event dates, suggesting that 10-K filings are
informational events but they are less important to investors than earnings announcements.
For analysts who provide at least one forecast in the [-90, 30] window around the event,
Figures 4a plots the proportion of analysts who initiate earnings forecasts for year t+1 in the
post-event window. Nearly half of the analysts initiate forecasts after earnings
announcements, but the percentage after 10-K filings is not distinguishable from that after
24 Bryan [1997] controls for only return on assets. Feldman et al. [2009] control for accruals and earnings surprises, but find a significant coefficient only for earnings surprises. We control for the magnitude of earnings announcement return because, arguably, price incorporates a variety of information including return on assets and earnings surprises.

25
pseudo events. Figure 4b shows that the proportion of analysts who do not revise forecasts is
drastically higher after 10-K filings than after earnings announcements. The slight increase
after 2002 for 10-K filings might be due to the slight decrease for earnings announcements.
That is, earnings announcements have become increasingly informative for earnings
revisions, leaving a decreasing amount of information for 10-K events. These patterns
suggest that 10-K filings are not important events for analyst in revising earnings estimates.
Tables 4, 5, and 6 report the response tests, where the analyst revision test uses only firms
with at least one forecast in the post-event window. In Panel A of Table 4, the observations
for |CAR| and |CAREA| are slightly less than 24,171 due to CRSP coverage. At least 9.5% of
the sample firms file late. The average number of non-missing and non-zero Compustat items
is 160 and its distribution is fairly symmetric. The mean market reaction at earnings
announcements is 6.1%. In Panel B, investors’ and analysts’ responses are significantly
positively correlated with the MD&A modification score.
Table 5 reports the multivariate analysis of price reactions, where the estimation is robust
to heteroskedasticity and within-firm error correlations. The left column uses |CAR| as the
dependent variable. The intercept is significantly positive because the dependent variable is
positive by design, whereas our interest is in the main effect of Score. The coefficient on
Score is significantly positive at 0.016, meaning that if a firm’s score increases from the 25th
to 75th percentile of the distribution, the market reaction increases by 0.2%, which is 10% of
the median price reaction to 10-K filings. As expected, Size is negatively associated with
|CAR|. Filelate is significantly positively associated with |CAR|, suggesting that additional
information is revealed in the delayed filing. The coefficient on NewItems is weakly positive,
suggesting that investors respond to the new numerical information in 10-K filings. The

26
coefficient on |CAREA| is significantly positive, suggesting that earnings announcements
complement 10-K filings. The middle column uses the natural logarithm of |CAR| as the
dependent variable and the result for Score is similar to Column 1, indicating that the least-
squares estimation of Equation (3) is robust to a violation of the normality assumption (and
skewness). In the right column we subtract the absolute value of the three-day market-
adjusted return around a pseudo event from |CAR| to control for a firm’s normal level of
price movement at a typical day. The intercept is not significantly different from 0, indicating
that on average the pseudo-event-return adjustment successfully produces an unbiased
abnormal return measure. The coefficient on Score is 0.007, weakly positive.25 Thus, we
conclude that investors appear to use information in MD&A modifications.26
Table 6 presents the analyst forecast revision test results, with Column 1 using |Revision|,
Column 2 using log|Revision|, and Column 3 using the absolute revision in excess of what
analysts would make following a pseudo event.27 The coefficient on Score is statistically
insignificant in all the estimations, even though the results for the control variables are
largely consistent with Table 5. We conclude that analysts do not use the MD&A in revising
earnings forecasts.28 The finding that investors respond to the MD&A but that analysts do not
is consistent with our finding in Section 5 that managers apparently modify the MD&A more
25 We do not use this specification as the primary analysis because pseudo-event returns add noise to measurement for individual firms even though the noise aggregates to 0 for the sample as a whole. For example, a pseudo-event date could have an M&A announcement for one firm and be extremely quiet for another firm. 26 We identify firms whose 10-K filing dates are clustered and find that the results for this subsample (49.3% of the sample) hold even when we do not adjust returns by the market index. Following Li and Ramesh [2009], we also identify firms whose 10-K filing dates are within five days of the calendar-quarter-end and find robust results for both the calendar-quarter-end-clustered (37.3% of the sample) and unclustered subsamples with and without the adjustment by the market index. 27 We add 0.0001 to every observation before the transformation to retain the 179 firm-year observations that have revision value of 0 (analyst forecasts exist in both the pre- and post-event windows for these observations). 28 It is possible that analysts do not revise a forecast unless the revision is at least a penny. If so, our forecast revision variable has captured larger revisions and missed small revisions. We find that even those large revisions are not associated with the MD&A modification score.
27
after large changes in LCR than after large changes in operations. The LCR information is
useful for predicting future cash flows, but less useful for analysts’ year-ahead earnings
predictions.
7. Hand-coding MD&A documents
To further validate our VSM-based modification score and probe what types of
information are modified, we hand-code a subset of MD&A documents. We sort the sample
into quintiles (each year) by the MD&A modification score and randomly select 50 firms
from the highest quintile and 50 firms from the lowest quintile. Each firm’s MD&A
documents for the current year (t) and the previous year (t-1) are compared and coded. 29 On
average, an MD&A document is 17 pages long.
We first identify the sections of MD&A disclosure. Almost all firms clearly label the
sections (except for “overview” and “cautionary language”) but section names vary from firm
to firm and some firms use several sections to discuss what would be contained in one section
by another firm. We organize the reported sections into “overview,” “operations,” “liquidity
and capital resources” (LCR), “accounting policies and estimates,” “risk factors,” “cautionary
language,” “recent accounting standards,” and “other.”30
Within each section, we read through the paragraphs and sentences and identify the basic
units of discussion, referred to as aspects. For example, in the “operations” section, the
discussion of current-year sales and its change from the previous year is one aspect and the
discussion of profit margin is another aspect. Firms typically discuss one aspect in a
29 Two coders with an accounting background are trained in pilot coding and receive an equal number of high- and low-score firms. Both the coding and review are blind to a firm’s high- vs. low-score status. 30 The “other” section includes “discontinued operations,” “subsequent events,” “Y2k,” “off-balance sheet arrangements,” “related party transaction,” “trends & management actions,” “outlook,” etc.

28
paragraph, although an aspect is occasionally discussed in more than one paragraph. For each
aspect we code whether it appears in both year t and year t-1 (“same aspect”) or not
(“different aspect”) and, if it is a “same aspect,” whether the discussion in year t has been
substantially changed from year t-1. If a firm merely changes numbers, a few non-crucial
phrases, or one or two non-crucial sentences in a long paragraph, the change is not considered
substantial. In addition, for each aspect appearing in year t, we code whether the discussion is
interpretive and forward-looking. If the discussion provides explanations, analysis, or a great
amount of detail, it is “interpretive.” If the discussion includes specific strategies, plans,
projections, and managers’ assessment of the input factors and market/industry trends, it is
“forward-looking.”
Panel A of Table 7 presents the mean and median hand-coded measures separately for the
high- and low-score groups along with the VSM-based modification score. The high-score
group discusses a similar number of aspects as the low-score group (35.1 vs. 31.3, t=1.57),
but uses significantly more words (7,424 vs. 5,214, t=2.88). The percentage of different
aspects for the former is significantly higher than for the latter (42.8% vs. 17.4%, t=7.07),
indicating that high-score firms add new aspects and remove old aspects to a large extent than
the low-score firms. Even for “same aspect,” the discussion by the high-score group is revised
to a larger degree than by the low-score group (53.2% vs. 27.4%, t=7.02).31 These results
further validate our VSM-based modification score.
Regarding the types of information firms disclose, the last two rows of Panel A indicate
that the two groups do not differ much in the quantity of interpretive disclosures (mean of
31 In untabulated analysis, we sum the percentage of different aspects and the percentage of different discussion of “same aspect” for each section and weight the sum by the number of words in each section. This measure is highly correlated with the VSM-based modification score (Spearman correlation coefficient = 0.671).

29
41.8% vs. 34.4%, t=1.79; median of 40.3% vs. 33.7%, Z=1.18), but the high-score group
provides significantly more forward-looking disclosure than the low-score group (7.2% vs.
4.2%, t=2.51). Panel B presents key measures by section. The discussion of operating results
accounts for 36% of the words used in the MD&A (untabulated) and includes about 11
aspects. The discussion of LCR accounts for 22% of the words and covers about eight aspects.
For both sections the high-score group includes different aspects and modifies the discussion
of “same aspect” from the previous year to a larger extent than the low-score group.
Furthermore, we observe that managers discuss more different aspects about LCR than about
operations (23.2% vs. 14.9%, t=2.49), but modify the discussion of “same aspect” to a larger
degree for operations than for LCR (44.0% vs. 54.1%, t = -2.43).
Not all firms provide disclosure beyond operations and LCR. When they do, we observe
higher modifications by the high-score group in “overview,” “accounting policies and
estimates” (through modifying the discussion of existing aspects), “risk factors,” and “other”
(through modifying the discussion of existing aspects). Yet, the statistical significance is the
strongest for operations and LCR and the degree of modifications is greater for these sections
than for risk disclosure and cautionary language.
We also probe the extent to which the MD&A discussions about LCR are not preempted
in the earnings announcement press releases and are not duplicated in the notes of the same
10-K filing. That is, we ask how new the LCR information is. We randomly select 20 firms in
the high-score group and trace each aspect coded in the MD&A to the earnings announcement
release. We observe that 98.4% of the MD&A LCR discussions either do not appear in the
release or are much more thorough than that in the release, while 44.4% of the firms do not
mention any LCR issue at all in the release. Managers are not supposed to merely repeat in

30
the MD&A what is already disclosed in the notes. We trace the MD&A LCR discussions to
various notes and observe that 61.2% of the MD&A discussion provides details and
interpretation beyond what is available in the notes. It appears that much new LCR
information is provided by firms that modify the MD&A diligently. Such information could
be helpful to investors in projecting future cash flows, while not as useful to analysts in
revising year-end earnings estimates.
In sum, the analysis of the hand-coded sample bolsters our case that the VSM-based
modification score captures changes in narrative disclosure. Moreover, the analysis shows that
many of the MD&A changes are related to operations and, in particular, liquidity and capital
resources.
8. MD&A Modifications and Usefulness over Time
The previous two sections use data from a 10-year period and make inferences about
MD&A modification and usefulness for the decade as a whole. The past decade has seen a
tightening of regulations. The Sarbanes-Oxley Act was passed in July 2002 and most of the
recommended changes took place in 2003. These regulations require firms to provide
additional disclosure, for example, on internal control and off-balance-sheet arrangements.
After 2003, firms are also explicitly required to discuss critical accounting estimates in the
MD&A. Specific regulatory requirements elicit disclosure that managers may otherwise not
provide, increasing the degree of MD&A modifications in the initiation year, but potentially
leading to meaningless boilerplate discussion merely out of compliance in subsequent years.
It is exactly for this reason that the SEC has adopted the management approach, leaving the
disclosure decisions to managers. This tradeoff is also why the SEC’s 2003 MD&A guidance

31
specifically reminded firms to provide meaningful discussion and analysis. Whether the
increased regulation in the past decade has led to more or less informative MD&A disclosure
is an empirical question of relevance to investors and regulators.
We show in Figure 5 the distributions of sample mean Score and Length each year in the
sample period. MD&A length increases over time, possibly triggered by more regulations as
well as a more litigious environment after the Enron and WorldCom scandals. In contrast,
Score generally declines over these years. The dramatic increase in Score in 1998 might be
due to the SEC’s push for “plain English” (SEC [1998], Loughran and McDonald [2008]) or
triggered by Y2K disclosures. Score for fiscal year 2001 is relatively high, possibly due to
the Enron scandal (Leuz and Schrand [2009]) and disclosure of the effect of terrorists’
attacks by airlines and insurance carriers (Carter and Simkins [2004]).32 Other than these two
years, the overall trend in Score is downward, which is confirmed by the year-fixed effects in
Table 3. The SEC’s 2003 guidance did not reverse this trend. Over time the MD&A has
become longer but looks more like what investors saw in the previous year.
The market reaction to MD&A information might have changed over time and whether
the MD&A has been useful in recent years is an empirical question. On the one hand, Griffin
(2003) reports an increase in market reaction to 10-K filings over his sample period of 1996-
2001. Market reaction after 2004 has likely increased following the accelerated 10-K filing
deadlines, because the acceleration should improve the timeliness of MD&A disclosure. On
the other hand, there are reasons to believe that investors’ reaction to MD&A disclosure has
weakened. The past decade has seen increased corporate interim disclosures (e.g., expanded
earnings announcements, increased use of quarterly conference calls, and increased scope of
32 Using page counts, Leuz and Schrand [2009] find that firms respond to the exogenous shock of a desire for transparency after the Enron collapse with longer 10-K filings.

32
8-K filings), more media outlets, faster information dissemination, and increased ease of
private information search. These factors make it likely that MD&A information is
increasingly preempted by other information sources over time.
Figure 3 shows that the price reaction to 10-K filings increased for fiscal years 1997 to
2000 and was as high as about 6% for 2000, consistent with Griffin [2003], who uses
calendar filing years whereas we use fiscal years. The price reaction, however, has declined
since 2000 to as low as 2% in 2006. This decline is confirmed by the year dummies in Table
8. More importantly, tests of the sum of coefficients on Score and the interaction of Score
with the year dummies indicate that the association of price reaction and MD&A
modification scores is significantly positive in 1998-2000, but disappears after 2000. This
result is confirmed in yearly estimations, where we allow all the coefficients to vary each
year (untabulated).
9. Conclusion
Our study introduces a document modification score from the information retrieval
literature to detect year-over-year changes in the extensiveness of a firm’s MD&A
disclosure. A document that is very similar to that from the previous year does not reveal
much new information. We find that firms with larger economic changes modify the MD&A
more than those with smaller economic changes, suggesting that firms meet a minimum
MD&A disclosure requirement. In addition, managers modify the MD&A to a larger extent
to reveal information about the firm’s liquidity and capital resources than about operations.
Consistent with this result, we find that equity investors react to the MD&A, but that analysts
do not revise their earnings forecasts, suggesting that the MD&A contains new information

33
for investors to predict cash flows in future periods even though it provides little new
information about the subsequent period’s earnings.
Despite firms apparently meeting a minimum MD&A requirement and investors reacting
to MD&A information, the overall trend in MD&A modification scores is downward over
the past 10 years. This trend is coupled with an increase in MD&A length, suggesting that
managers have increased the use of boilerplate disclosure. Moreover, we find that the price
reaction to 10-K filings has also declined over time and that it is not associated with MD&A
modifications after 2000, suggesting declining or insignificant MD&A usefulness in recent
years.
Overall, we introduce a measure for narrative disclosure which could be applied in a
variety of other accounting research settings. We document an important facet of MD&A
disclosure—modifications. Our findings are likely to be useful to investors and regulators in
reevaluating the MD&A regulation and disclosure behaviors.

34
REFERENCES
ATIASE, R. K. ‘Predisclosure Information, Firm Capitalization, and Security Price Behavior around Earnings Announcements.’ Journal of Accounting Research 23 (1985): 21-36.
BARRON, O. E.; C. O. KILE; and T. B. O’KEEFE. ‘MD&A Quality as Measured by the SEC and Analysts’ Earnings Forecasts.’ Contemporary Accounting Research 16 (1999): 75-109.
BARTOV, E., and P. MOHANRAM. ‘Private Information, Earnings Manipulations, and Executive Stock-Option Exercises.’ The Accounting Review 79 (2004): 889-920.
BRYAN, S. H. ‘Incremental Information Content of Required Disclosures Contained in Management Discussion and Analysis.’ The Accounting Review 72 (1997): 285-301.
BUSHEE, B. J., and C. F. NOE. ‘Corporate Disclosure Practices, Institutional Investors, and Stock Return Volatility.’ Journal of Accounting Research 38 (2000): 171-202.
BUSHEE, B.; D. MATSUMOTO; and G. MILLER. ‘Open versus Closed Conference Calls: The Determinants and Effects of Broadening Access to Disclosure.’ Journal of Accounting and Economics 34 (2003): 149-180.
CARTER, D., and B. SIMKINS. ‘The Market’s Reaction to the Unexpected, Catastrophic Events: The Case of Airline Stock Returns and the September 11th Attacks.’ Quarterly Review of Economics and Finance 44 (2004): 539-558.
CHOUDHARY, P.; K. J. MERKLEY; and J. D. SCHLOETZER. ‘Timeliness of Form 10-K, Firm Financial Performance and Information Uncertainty.’ Working Paper, Georgetown University, 2009.
CLARKSON, P. M.; J. L. KAO; and G. D. RICHARDSON. ‘Evidence that Management Discussion And Analysis (MD&A) is a Part of a Firm’s Overall Disclosure Package.’ Contemporary Accounting Research 16 (1999): 111-134.
COLE, C. J., and C. L. JONES. ‘Management Discussion and Analysis: A Review and Implications for Future Research.’ Journal of Accounting Literature 24 (2005): 135-174.
DAVIS, A. K.; J. M. PIGER; and L. M. SEDOR. ‘Beyond the Numbers: Managers’ Use of Optimistic and Pessimistic Tone in Earnings Press Releases.’ Working Paper, University of Oregon, 2008.
DAVIS, A. K., and I. TAMA-SWEET. ‘Managers’ Use of Language across Alternative Disclosure Outlets: Earnings Press Releases versus MD&A.’ Working Paper, University of Oregon, 2009.
FELDMAN, R.; S. GOVINDARAJ; J. LIVNAT; and B. SEGAL. ‘Management’s Tone Change, Post Earnings Announcement Drift and Accruals.’ Review of Accounting Studies 15 (2010): 915-953.
FRANCIS, J.; D. PHILBRICK; and K. SCHIPPER. ‘Shareholder Litigation and Corporate Disclosures.’ Journal of Accounting Research. 32 (1994): 137-164.
FRANCIS, J.; K. SCHIPPER; and L. VINCENT. ‘Expanded Disclosures and the Increased Usefulness of Earnings Announcements.’ The Accounting Review 77 (2002): 515-546.
FRANKEL, R. M.; W. J. MAYEW; and Y. SUN. ‘Do Pennies Matter? Investor Relations Consequences of Small Negative Earnings Surprises.’ Review of Accounting Studies 15 (2010): 220-242.
GRANT, E. B. ‘Market Implications of Differential Amounts of Interim Information.’ Journal of Accounting Research 18 (1980): 255-268.

35
GRIFFIN, P. A. ‘Got Information? Investor Response to Form 10-K and Form 10-Q EDGAR Filings.’ Review of Accounting Studies 8 (2003): 433-460.
HANLEY, K. W., and G. HOBERG. ‘The Information Content of IPO Prospectuses.’ Review of Financial Studies 23 (2010): 2821-2864.
HOBERG, G., and G. PHILLIPS. ‘Product Market Synergies in Mergers and Acquisitions: A Text Based Analysis.’ Working Paper, University of Maryland, 2010.
HUTTON, A. P.; G. S. MILLER; and D. J. SKINNER. ‘The Role of Supplementary Statement with Management Earnings Forecasts.’ Journal of Accounting Research 41 (2003): 867-890.
INTERNATIONAL ACCOUNTING STANDARDS BOARD. Management Commentary: Exposure Draft (June), 2009.
KOTHARI, S. P.; X. LI; and J. E. SHORT. ‘The Effect of Disclosure by Management, Analysts, and Financial Press on Cost of Capital, Return Volatility, and Analyst Forecasts: A Study Using Content Analysis.’ The Accounting Review 84 (2009): 1639-1670.
LERMAN, A., and J. LIVNAT. ‘The New Form 8-K Disclosures.’ Review of Accounting Studies 15 (2010): 752-778.
LEUZ, C., and C. SCHRAND. ‘Disclosure and the Cost of Capital: Evidence from Firms’ Responses to the Enron Shock.’ Working Paper, University of Chicago, 2009.
LI, E., and K. RAMESH. ‘Market Reaction Surrounding the Filing of Periodic SEC Reports.’ The Accounting Review 84 (2009): 1171-1208.
LI, F. ‘Annual Report Readability, Current Earnings, and Earnings Persistence.’ Journal of Accounting and Economics 45 (2008): 221-247.
LI, F. ‘The Determinants and Information Content of the Forward-Looking Statements in Corporate Filings – A Naïve Bayesian Machine Learning Approach.’ Journal of Accounting Research. 48 (2010): 1049-1102.
LOUGHRAN, T., and B. MCDONALD. ‘Plain English.’ Working Paper, University of Notre Dame, 2008.
MANNING, C. D., and H. SCHÜTZE. Foundations of Statistical Natural Language Processing. Cambridge, Massachusetts: MIT Press, 1999.
MARQUARDT, C., and C. WIEDMAN. ‘Earnings Management through Transaction Structuring: Contingent Convertible Debt and Diluted Earnings per Share.’ Journal of Accounting Research 43 (2005): 205-243.
MATSUMOTO, D.; M. PRONK; and E. ROELOFSEN. ‘Conference Call Disclosures and Firm Performance: An Empirical Analysis of the Length and Content of Earnings-Related Conference Calls.’ Working Paper, University of Washington, 2007.
MUSLU, V.; S. RADHAKRISHNAN; K. R. SUBRAMANYAM; and D. LIM. ‘Forward-Looking Disclosures in the MD&A and the Financial Information Environment.’ Working Paper, University of Texas at Dallas and University of Southern California, 2009.
NELSON, K. K., and A. C. PRITCHARD. ‘Litigation Risk and Voluntary Disclosure: The Use of Meaningful Cautionary Language.’ Working paper, Rice University and University of Michigan, 2007.
PETERSEN, M. A. ‘Estimating Standard Errors in Finance Panel Data Sets: Comparing Approaches.’ Review of Financial Studies 22 (2009): 435-479.

36
ROGERS, R. K., and J. GRANT. ‘Content Analysis of Information Cited in Reports of Sell-Side Financial Analysts.’ Journal of Financial Statement Analysis 3 (1997): 17-30.
SALTON, C., and C. BUCKLEY. ‘Term Weighting Approaches in Automatic Text Retrieval.’ Information Processing & Management 24 (1988): 513-523.
SALTON, G.; A. WONG; and C. S. YANG. ‘A Vector Space Model for Automatic Indexing.’ Communications of the ACM 18 (1975): 613-620.
SECURITIES AND EXCHANGE COMMISSION. Release No. 33-6711: Concept Release on Management’s Discussion and Analysis of Financial Condition and Operations (April 17), 1987.
SECURITIES AND EXCHANGE COMMISSION. Release No. 33-6835: Management’s Discussion and Analysis of Financial Condition and Results of Operations; Certain Investment Company Disclosures (May 18), 1989.
SECURITIES AND EXCHANGE COMMISSION. A Plain English Handbook: How to Create Clear SEC Disclosure Documents (August), 1998.
SECURITIES AND EXCHANGE COMMISSION. Release No. 33-8350: Commission Guidance Regarding Management’s Discussion and Analysis of Financial Condition and Results of Operations (December 29), 2003.
SINGHAL, A. ‘Modern Information Retrieval: A Brief Overview.’ Bulletin of the IEEE Computer Society Technical Committee on Data Engineering 24 (2001): 35-43.
TEOH, S. H.; I. WELCH; and T. J. WONG. ‘Earnings Management and the Underperformance of Seasoned Equity Offerings.’ Journal of Financial Economics 59 (1998): 63-99.
YOU, H and X. ZHANG. ‘Financial Reporting Complexity and Investor Underreaction to 10-K Information.’ Review of Accounting Studies 14 (2009): 559-586.

37
APPENDIX A Examples of MD&A Disclosure about Capital Expenditures
Example 1: Brunswick Corp
Fiscal year 2002 10-K Fiscal year 2003 10-K The Company invested $112.6 million, $111.4 million and $156.0 million in capital expenditures in 2002, 2001 and 2000, respectively. The largest portion of these expenditures was made for on-going investments to introduce new products, expand product lines and achieve improved production efficiencies and product quality.
The Company invested $159.8 million in capital expenditures in 2003. The largest portion of these expenditures was made for investments to introduce new products and expand product lines in the Marine Engine, Fitness and Bowling & Billiards segments, and achieve improved production efficiencies and product quality. The most significant expenditures in 2003 relate to the equipment needed for production of Verado, the Marine Engine segment’s new series of high-horsepower outboard engines introduced in 2004, and the conversion of 13 bowling centers to Brunswick Zones.
The Company anticipates spending approximately $180.0 million for capital expenditures in 2004. About one-half of the capital spending covers investments in new and upgraded products, and plant capacity expansion in the Marine Engine and Boat segments, about one-third for profit maintaining capital and the balance targeted toward cost reductions and investments in information technology.
Rawscore = 0.86
Example 2: Interline Brands Inc.
Fiscal year 2001 10-K Fiscal year 2002 10-K Capital expenditures were $7.9 million in 2005 as compared to $6.8 million in 2004. Capital expenditures as a percentage of sales were 0.9% in year 2005 and 0.9% in 2004.
Acquisition expenditures were $73.2 million in 2005, which consisted of $69.5 million related to our Copperfield acquisition in July 2005 and $3.6 million related to our Florida Lighting acquisition in November 2003, compared to $0.6 million in 2004, which related to our Florida Lighting acquisition.
Capital expenditures were $7.8 million in 2006, $7.9 million in 2005 and $6.8 million in 2004. Capital expenditures as a percentage of sales were 0.7%, 0.9% and 0.9% in 2006, 2005 and 2004, respectively.
Acquisition expenditures were $131.5 million in 2006, which consisted primarily of 130.8 million related to our AmSan acquisition in July 2006, $73.2 million in 2005, which consisted of $69.5 million related to our Copperfield acquisition in July 2005 and $3.6 million related to our Florida Lighting acquisition in November 2003 and $0.6 million in 2004, which related to our Florida Lighting acquisition.
Rawscore = 0.17
Note: The raw scores from comparing the excerpts of MD&A documents are not comparable to the raw scores from comparing the whole MD&A documents.

38
APPENDIX B Adjusting the Raw Difference Score by Document Length
1. The relation between the raw difference score and document length: Let us assume a simple scenario, where (1) a manager must choose from a population of n words (w1, w2, w3, ... wn) to write a document, (2) the firm’s document has r number of words, and (3) each word is used in a document only once.
Previous year’s document Current year’s document w1 w2 … wr-1 wr ? ? ? ? ?
Question 1: How many ways can the manager select words for the current year’s document? Answer: In statistical terms, we ask how many ways one can combine r objects chosen from n objects without replacement:
!
!( )!n r
nC
r n r
Question 2: How many ways can the manager select words for the current year’s document without repeating the words used in the previous year? Answer: In statistical terms, we ask how many ways one can combine r objects chosen from (n-r) objects without replacement:
( )!
!( 2 )!n r r
n rC
r n r
Question 3: What is the likelihood that the current year’s document uses totally different words than the previous year’s?
( )! ( )!( ) /
( 2 )! !n r r n r
n r n rP r C C
n r n
Statement: P(r) decreases with r as long as r is less than (2/3)n.
Proof: P(r) / P(r-1) = (n-2r+2)(n-2r+1) / (n-r+1)2, where r>=2. The difference between the numerator and denominator of this ratio is 3r2 - 2(n+2)r + (n+1). This difference is a U-shaped function of r with the first intercept with the x-axis less than 1 and the second intercept larger than (2/3)n. In other words, as long as r<(2/3)n, the difference is negative and therefore the ratio is less than 1 (i.e., P (.) is decreasing in r).
Our setting: (1) we allow a word to be used more than once in a document and (2) we downweight common words used by sample firms as a whole. The decreasing relation between the raw difference score and document length demonstrated above is expected to hold.
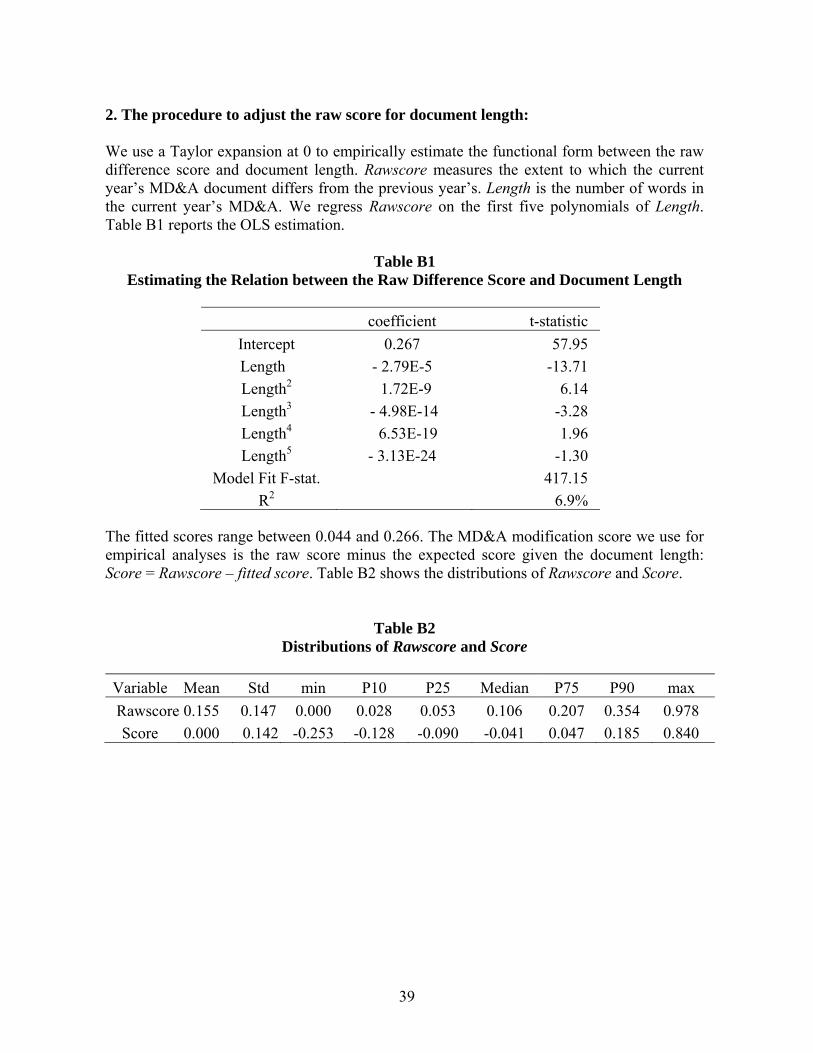
39
2. The procedure to adjust the raw score for document length: We use a Taylor expansion at 0 to empirically estimate the functional form between the raw difference score and document length. Rawscore measures the extent to which the current year’s MD&A document differs from the previous year’s. Length is the number of words in the current year’s MD&A. We regress Rawscore on the first five polynomials of Length. Table B1 reports the OLS estimation.
Table B1 Estimating the Relation between the Raw Difference Score and Document Length
coefficient t-statistic
Intercept 0.267 57.95
Length - 2.79E-5 -13.71
Length2 1.72E-9 6.14
Length3 - 4.98E-14 -3.28
Length4 6.53E-19 1.96
Length5 - 3.13E-24 -1.30
Model Fit F-stat. 417.15
R2 6.9% The fitted scores range between 0.044 and 0.266. The MD&A modification score we use for empirical analyses is the raw score minus the expected score given the document length: Score = Rawscore – fitted score. Table B2 shows the distributions of Rawscore and Score.
Table B2 Distributions of Rawscore and Score
Variable Mean Std min P10 P25 Median P75 P90 max
Rawscore 0.155 0.147 0.000 0.028 0.053 0.106 0.207 0.354 0.978
Score 0.000 0.142 -0.253 -0.128 -0.090 -0.041 0.047 0.185 0.840

40
FIGURE 1 How Different Is a Firm’s MD&A from other MD&A Documents?
Note: Raw difference score measures the extent to which two documents are different. A higher score indicates more differences. For each fiscal year, the figure shows the mean raw score of MD&A comparisons (1) of 1,000 randomly selected pairs (the highest line), (2) within an industry sector, industry group, industry, and sub-industry, and (3) with the firm’s previous year’s document (the lowest line). A firm is compared with every other firm in the group, the mean score of these comparisons are calculated for each firm, and the mean of all firms is the value for that industry definition in a given fiscal year. We use four industry definitions from the Global Industry Classification Standard (GICS) code. Digits 1-2 define the sector, digits 1-4 define the industry group, digits 1-6 define the industry, and digits 1-8 define the sub-industry. “Sector” is the broadest definition of industry and “sub-industry” is the narrowest.
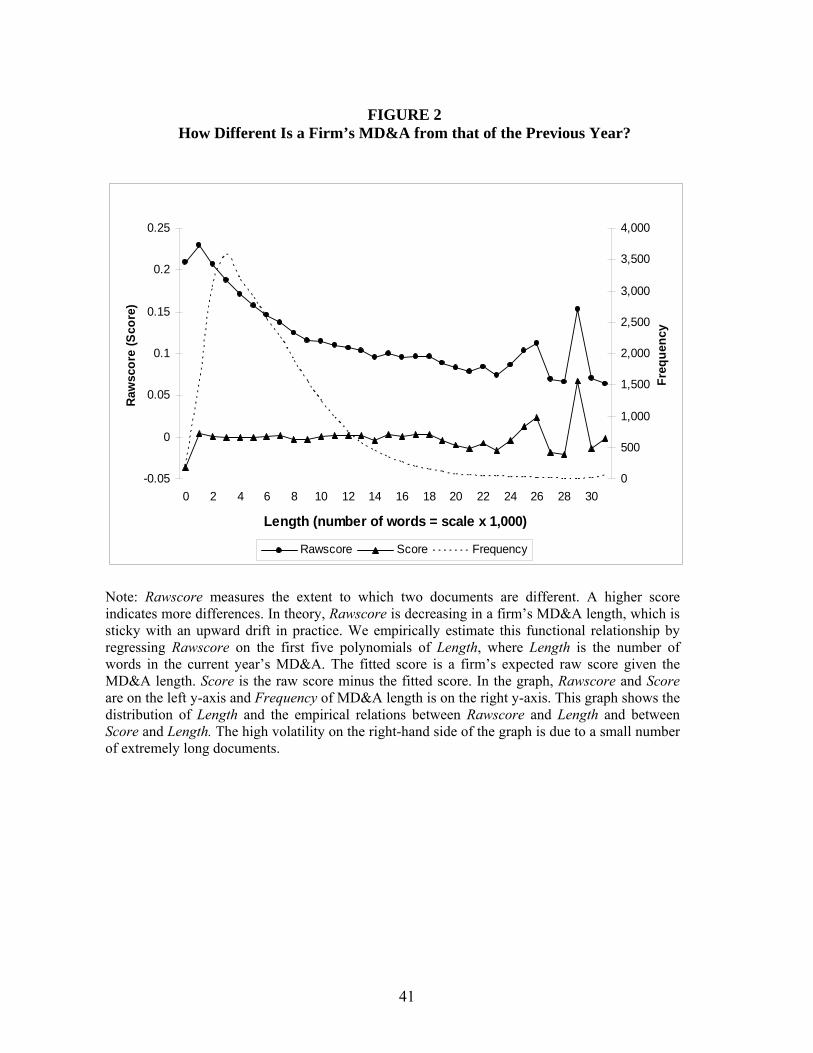
41
FIGURE 2 How Different Is a Firm’s MD&A from that of the Previous Year?
-0.05
0
0.05
0.1
0.15
0.2
0.25
0 2 4 6 8 10 12 14 16 18 20 22 24 26 28 30
Length (number of words = scale x 1,000)
Raw
sco
re (
Sco
re)
0
500
1,000
1,500
2,000
2,500
3,000
3,500
4,000
Fre
qu
ency
Rawscore Score Frequency
Note: Rawscore measures the extent to which two documents are different. A higher score indicates more differences. In theory, Rawscore is decreasing in a firm’s MD&A length, which is sticky with an upward drift in practice. We empirically estimate this functional relationship by regressing Rawscore on the first five polynomials of Length, where Length is the number of words in the current year’s MD&A. The fitted score is a firm’s expected raw score given the MD&A length. Score is the raw score minus the fitted score. In the graph, Rawscore and Score are on the left y-axis and Frequency of MD&A length is on the right y-axis. This graph shows the distribution of Length and the empirical relations between Rawscore and Length and between Score and Length. The high volatility on the right-hand side of the graph is due to a small number of extremely long documents.
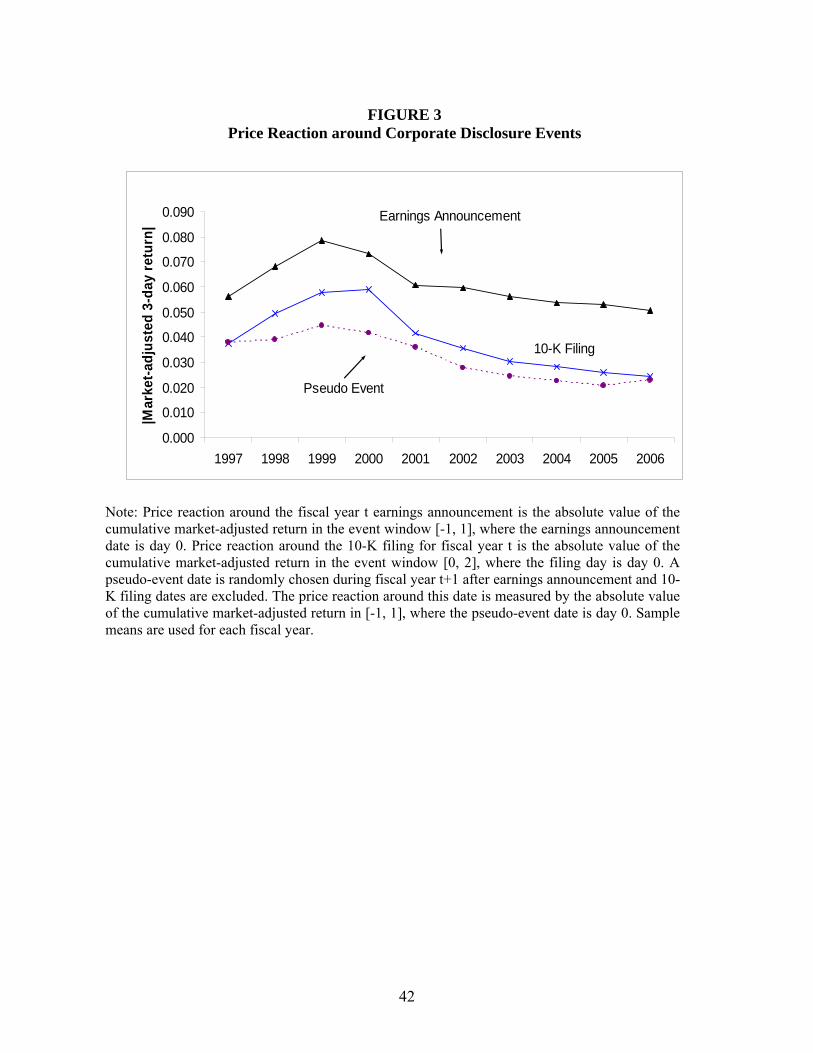
42
FIGURE 3 Price Reaction around Corporate Disclosure Events
0.000
0.010
0.020
0.030
0.040
0.050
0.060
0.070
0.080
0.090
1997 1998 1999 2000 2001 2002 2003 2004 2005 2006
|Mar
ket-
adju
sted
3-d
ay r
etu
rn|
Earnings Announcement
10-K Filing
Pseudo Event
Note: Price reaction around the fiscal year t earnings announcement is the absolute value of the cumulative market-adjusted return in the event window [-1, 1], where the earnings announcement date is day 0. Price reaction around the 10-K filing for fiscal year t is the absolute value of the cumulative market-adjusted return in the event window [0, 2], where the filing day is day 0. A pseudo-event date is randomly chosen during fiscal year t+1 after earnings announcement and 10-K filing dates are excluded. The price reaction around this date is measured by the absolute value of the cumulative market-adjusted return in [-1, 1], where the pseudo-event date is day 0. Sample means are used for each fiscal year.
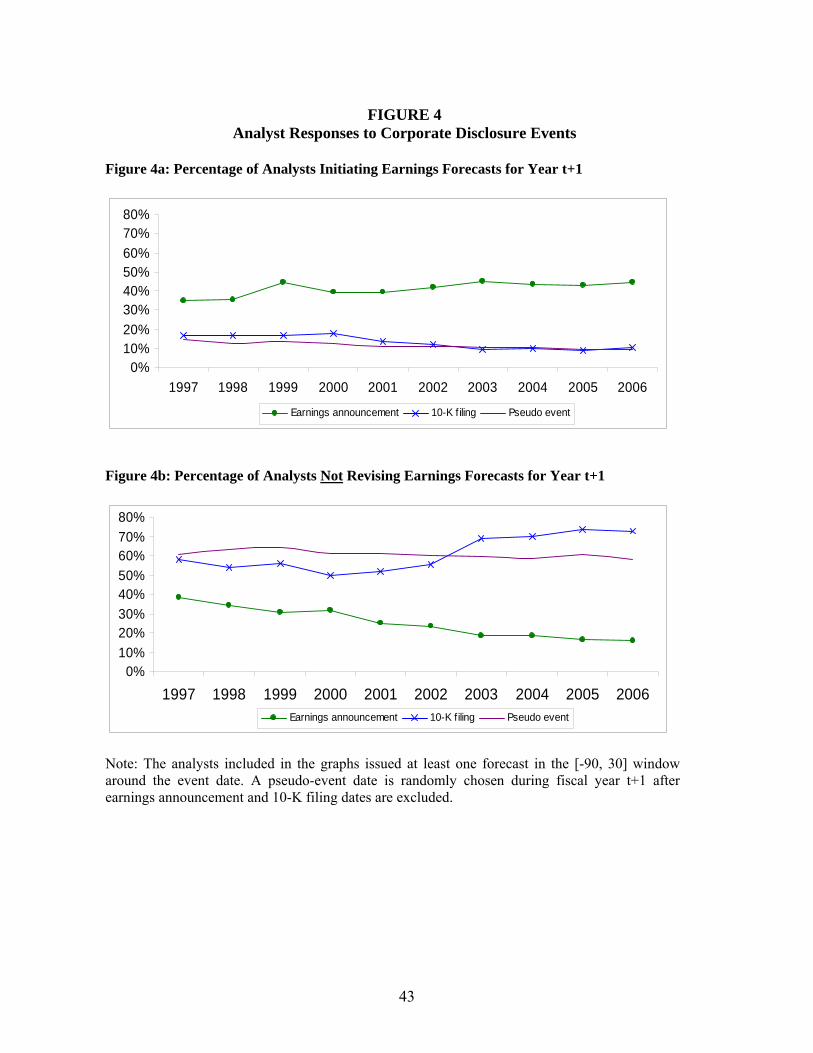
43
FIGURE 4 Analyst Responses to Corporate Disclosure Events
Figure 4a: Percentage of Analysts Initiating Earnings Forecasts for Year t+1
0%10%20%
30%40%50%60%
70%80%
1997 1998 1999 2000 2001 2002 2003 2004 2005 2006
Earnings announcement 10-K f iling Pseudo event
Figure 4b: Percentage of Analysts Not Revising Earnings Forecasts for Year t+1
0%10%
20%30%
40%50%
60%70%
80%
1997 1998 1999 2000 2001 2002 2003 2004 2005 2006Earnings announcement 10-K filing Pseudo event
Note: The analysts included in the graphs issued at least one forecast in the [-90, 30] window around the event date. A pseudo-event date is randomly chosen during fiscal year t+1 after earnings announcement and 10-K filing dates are excluded.
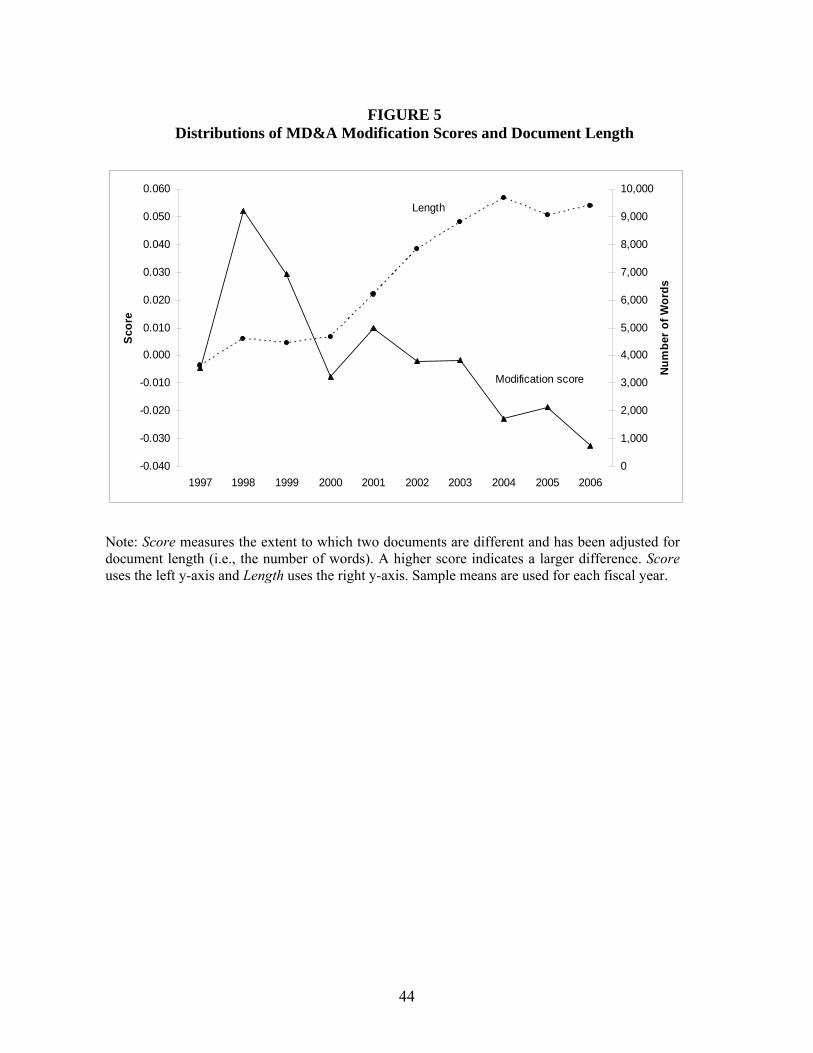
44
FIGURE 5 Distributions of MD&A Modification Scores and Document Length
-0.040
-0.030
-0.020
-0.010
0.000
0.010
0.020
0.030
0.040
0.050
0.060
1997 1998 1999 2000 2001 2002 2003 2004 2005 2006
Sco
re
0
1,000
2,000
3,000
4,000
5,000
6,000
7,000
8,000
9,000
10,000
Nu
mb
er o
f W
ord
s
Length
Modification score
Note: Score measures the extent to which two documents are different and has been adjusted for document length (i.e., the number of words). A higher score indicates a larger difference. Score uses the left y-axis and Length uses the right y-axis. Sample means are used for each fiscal year.

45
TABLE 1 Sample Means (Medians) by Year
Year Obs. Score Assets ΔEPS BigN IO Analyst Herf Litig |CAR|
1997
2,655
-0.005 (-0.049)
1,176 (143)
-0.005(0.006)
0.893 (1)
0.397 (0.357)
5.1 (3)
0.062 (0.043)
0.307 (0)
0.037 (0.022)
1998
2,767
0.052 (0.008)
1,499 (162)
-0.033(0.003)
0.880 (1)
0.408 (0.367)
5.5 (4)
0.061 (0.044)
0.311 (0)
0.050 (0.031)
1999
2,832
0.029 (-0.020)
1,689 (189)
0.008 (0.006)
0.863 (1)
0.399 (0.349)
5.5 (4)
0.060 (0.042)
0.313 (0)
0.058 (0.038)
2000
2,771
-0.008 (-0.053)
1,944 (251)
-0.049(0.003)
0.858 (1)
0.425 (0.386)
5.4 (3)
0.057 (0.040)
0.327 (0)
0.059 (0.034)
2001
2,884
0.010 (-0.034)
2,021 (262)
-0.023(-0.003)
0.859 (1)
0.462 (0.434)
5.5 (4)
0.058 (0.045)
0.347 (0)
0.041 (0.024)
2002
2,716
-0.002 (-0.038)
2,590 (319)
0.036 (0.008)
0.842 (1)
0.504 (0.502)
5.9 (4)
0.062 (0.051)
0.331 (0)
0.036 (0.019)
2003
2,907
-0.002 (-0.035)
2,939 (348)
0.060 (0.011)
0.823 (1)
0.542 (0.556)
6.5 (4)
0.063 (0.049)
0.334 (0)
0.030 (0.018)
2004
2,931
-0.023 (-0.053)
3,507 (420)
0.017 (0.009)
0.782 (1)
0.586 (0.624)
6.7 (5)
0.063 (0.048)
0.323 (0)
0.028 (0.016)
2005
2,910
-0.019 (-0.043)
4,484 (486)
0.004 (0.007)
0.777 (1)
0.611 (0.659)
6.6 (5)
0.065 (0.050)
0.318 (0)
0.026 (0.016)
2006
2,769
-0.032 (-0.059)
5,413 (584)
0.008 (0.006)
0.738 (1)
0.648 (0.716)
7.1 (5)
0.076 (0.049)
0.310 (0)
0.024 (0.014)
Notes: Year is the fiscal year. Score measures the extent to which two documents are different and has been adjusted for document length (i.e., the number of words). A higher score indicates more differences. Assets is the total assets at the end of the fiscal year. ΔEPS is the change in diluted earnings per share, scaled by the stock price at the end of the fiscal year. Both earnings and price are adjusted for stock splits. The observations with stock prices less than 1 are excluded. BigN is 1 if the firm is audited by a Big N (N is 6, 5, or 4) accounting firm or its predecessor and 0 otherwise. IO is the percentage of ownership by institutional investors according to the most recent SEC 13f filings before the firm’s 10-K filing, collected by Thomson-Reuters. Analyst is the number of financial analysts whose earnings estimates for year t+1 are included in the most recent IBES consensus before the 10-K filing. Herf is the Herfindahl index, using the 100 firms with the highest sales in the industry. Litig is 1 for high litigation risk firms (the four-digit SIC code is 2833-2836, 8731-8734, 3570-3577, 7370-7374, 3600-3674, or 5200-5961) and 0 otherwise. |CAR| is the absolute value of the cumulative market-adjusted returns over the three days beginning with the 10-K filing date. ΔEPS is winsorized at 1% and 99% each year. The sample has 28,142 firm-year observations. For some variables, the number of observations is slightly smaller.

46
TABLE 2 The MD&A Modification Score and Economic Changes
Panel A: Descriptive statistics
Mean P25 Median P75
Score 0.000 -0.090 -0.041 0.047
EPS -0.049 -0.044 0.033 0.064
Current 3.101 1.376 2.138 3.526
Debtdue 0.020 0.000 0.003 0.021
Leverage 0.520 0.299 0.514 0.716
FCF -0.025 -0.060 0.018 0.071
Stdret 0.076 0.043 0.065 0.096
|ΔEPS| 0.126 0.010 0.030 0.100
|ΔCurrent| 0.846 0.049 0.266 0.830
|ΔDebtdue| 0.014 0.000 0.001 0.011
|ΔLeverage| 0.071 0.014 0.038 0.088
|ΔFCF| 0.083 0.014 0.044 0.104
|ΔStdret| 0.022 0.005 0.013 0.028 Panel B: Spearman correlations
|ΔEPS| |ΔCurrent| |ΔDebtdue| |ΔLeverage| |ΔFCF| |ΔStdret| Acquire Downsize
Score 0.111 0.092 0.085 0.130 0.084 0.056 0.082 0.083
|ΔEPS| 0.155 0.168 0.241 0.287 0.221 -0.077 0.197
|ΔCurrent| 0.114 0.359 0.405 0.198 0.136 0.125
|ΔDebtdue| 0.217 0.121 0.030 0.029 0.020
|ΔLeverage| 0.338 0.127 0.265 0.183
|ΔFCF| 0.218 0.096 0.188
|ΔStdret| 0.015 0.097
Acquire -0.090 Note: See variable definitions in Table 3. All the correlations are statistically significant at 5%.

47
TABLE 3 Regression Analysis of the MD&A Modification Score and Economic Changes
Measurement scale of explanatory variables
Raw Deciles Deciles Deciles
Intercept -0.026 (-10.04)
*** -0.049(-14.91)
*** -0.058(-15.57)
-0.100(-13.36)
***
|ΔEPS| 0.012 (3.28)
*** 0.003(6.74)
*** 0.003(6.78)
*** 0.002(6.03)
***
|ΔCurrent| 0.000 (0.36)
0.002(4.30)
*** 0.002(5.55)
***
|ΔDebtdue| 0.202 (6.30)
*** 0.002(6.45)
*** 0.002(6.53)
***
|ΔLeverage| 0.128 (10.10)
*** 0.003(7.37)
*** 0.003(8.17)
***
|ΔFCF| 0.036 (3.36)
*** 0.001(2.28)
** 0.001(3.70)
***
LCR 0.007(13.42)
***
|ΔStdret| 0.181 (5.57)
*** 0.000(1.20)
0.000(0.81)
0.001(1.73)
*
Acquire 0.026 (9.74)
*** 0.030(11.13)
*** 0.031(11.56)
*** 0.028(10.63)
***
Downsize 0.026 (4.46)
*** 0.037(6.68)
*** 0.037(6.62)
*** 0.037(6.55)
***
Size 0.007(7.61)
***
BigN -0.003(-0.87)
IO -0.020(-4.62)
***
Analyst -0.001(-3.60)
***
Herf 0.070(3.00)
***
Litig 0.013(4.41)
***
Y1997 -0.008 (-2.18)
** -0.009(-2.51)
** -0.009(-2.61)
*** -0.009(-2.33)
**
Y1998 0.047 (12.34)
*** 0.046(12.28)
*** 0.046(12.26)
*** 0.047(12.11)
***
Y1999 0.024 (6.36)
*** 0.025(6.48)
*** 0.024(6.43)
*** 0.024(6.24)
***
Y2000 -0.013 *** -0.012 *** -0.012 *** -0.013 ***

48
(-3.51) (-3.27) (-3.30) (-3.64)Y2001 0.007
(2.12) ** 0.007
(2.21)** 0.007
(2.13)** 0.006
(1.81)*
Y2002 -0.001 (-0.50)
-0.002(-0.55)
-0.002(-0.59)
-0.002(-0.79)
Y2004 -0.020 (-7.46)
*** -0.020(-7.28)
*** -0.019(-7.25)
*** -0.019(-7.13)
***
Y2005 -0.014 (-4.91)
*** -0.013(-4.82)
*** -0.014(-4.88)
*** -0.013(-4.63)
***
Y2006 -0.029 (-10.35)
*** -0.028(-9.99)
*** -0.028(-10.01)
*** -0.028(-9.76)
***
Model F 73.11 *** 74.74 *** 88.80 *** 60.08 *** R2 5.8% 5.8% 5.8% 6.4% Obs. 28,142 28,142 28,142 28,142
Note: Score measures the extent to which two documents are different and has been adjusted for document length. A higher score indicates more differences. ΔEPS is the change in diluted EPS, scaled by the stock price at the end of the fiscal year. Current is the current ratio. Debtdue is the debts due in one year, Leverage is the total liabilities, and FCF is the free cash flows (i.e., operating cash flows minus capital expenditures) in the current year, all scaled by total assets. Stdret is the volatility of weekly returns in the current fiscal year. The change variables are changes from the prior year to the current year and are filled with 0 when the data are missing. The above independent variables are winsorized at 1% and 99% and then the absolute values (| |) are calculated. LCR is the mean decile ranking of |ΔCurrent|, |ΔDebtdue|, |ΔLeverage|, and |ΔFCF|. Acquire is 1 if a firm’s asset growth during the year is 1/3 or higher and 0 otherwise. Downsize is 1 if the total assets decrease by 1/3 or more during the year and 0 otherwise. Size is the natural logarithm of total assets at the end of the fiscal year. See Table 1 for the definitions of BigN, IO, Analyst, Herf, and Litig. The regression estimations are robust to heteroskedasticity and within-firm error correlations. “***,” “**”, and “*” mark statistical significance at 1%, 5%, and 10% in a two-tailed test, respectively. The t-statistics are in the parentheses.
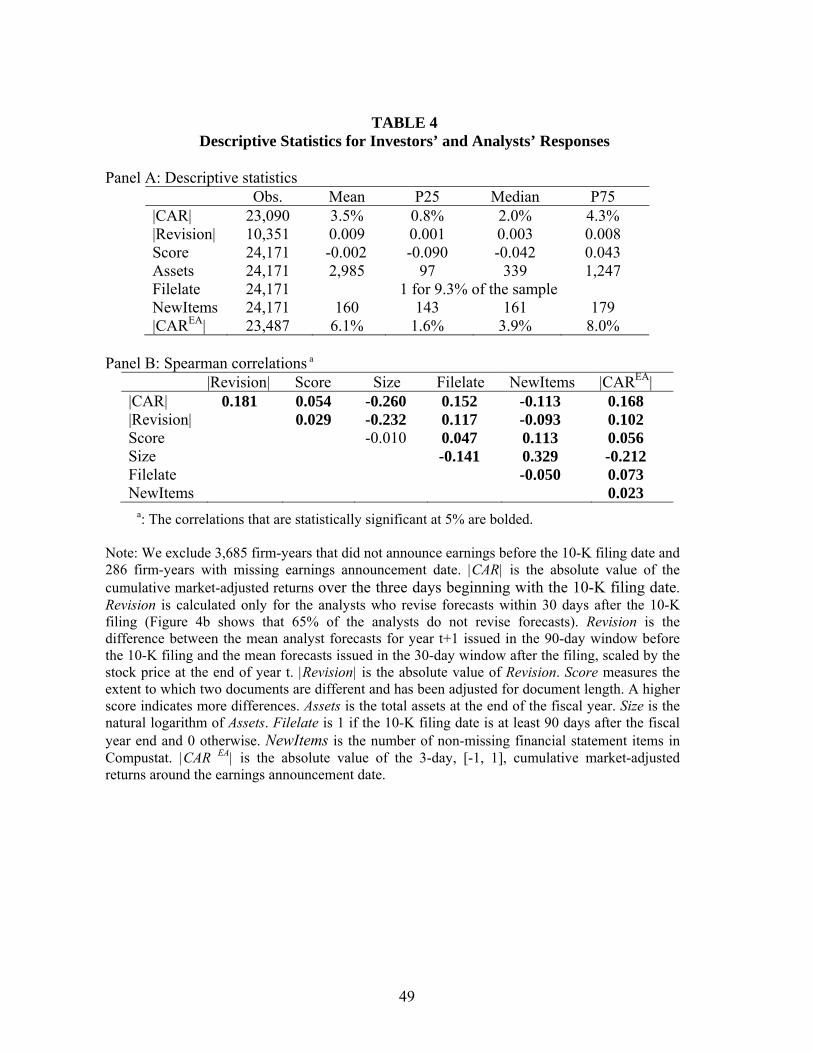
49
TABLE 4 Descriptive Statistics for Investors’ and Analysts’ Responses
Panel A: Descriptive statistics
Obs. Mean P25 Median P75 |CAR| 23,090 3.5% 0.8% 2.0% 4.3% |Revision| 10,351 0.009 0.001 0.003 0.008 Score 24,171 -0.002 -0.090 -0.042 0.043 Assets 24,171 2,985 97 339 1,247 Filelate 24,171 1 for 9.3% of the sample NewItems 24,171 160 143 161 179 |CAREA| 23,487 6.1% 1.6% 3.9% 8.0%
Panel B: Spearman correlations a
|Revision| Score Size Filelate NewItems |CAREA| |CAR| 0.181 0.054 -0.260 0.152 -0.113 0.168 |Revision| 0.029 -0.232 0.117 -0.093 0.102 Score -0.010 0.047 0.113 0.056 Size -0.141 0.329 -0.212 Filelate -0.050 0.073 NewItems 0.023
a: The correlations that are statistically significant at 5% are bolded. Note: We exclude 3,685 firm-years that did not announce earnings before the 10-K filing date and 286 firm-years with missing earnings announcement date. |CAR| is the absolute value of the cumulative market-adjusted returns over the three days beginning with the 10-K filing date. Revision is calculated only for the analysts who revise forecasts within 30 days after the 10-K filing (Figure 4b shows that 65% of the analysts do not revise forecasts). Revision is the difference between the mean analyst forecasts for year t+1 issued in the 90-day window before the 10-K filing and the mean forecasts issued in the 30-day window after the filing, scaled by the stock price at the end of year t. |Revision| is the absolute value of Revision. Score measures the extent to which two documents are different and has been adjusted for document length. A higher score indicates more differences. Assets is the total assets at the end of the fiscal year. Size is the natural logarithm of Assets. Filelate is 1 if the 10-K filing date is at least 90 days after the fiscal year end and 0 otherwise. NewItems is the number of non-missing financial statement items in Compustat. |CAR EA| is the absolute value of the 3-day, [-1, 1], cumulative market-adjusted returns around the earnings announcement date.
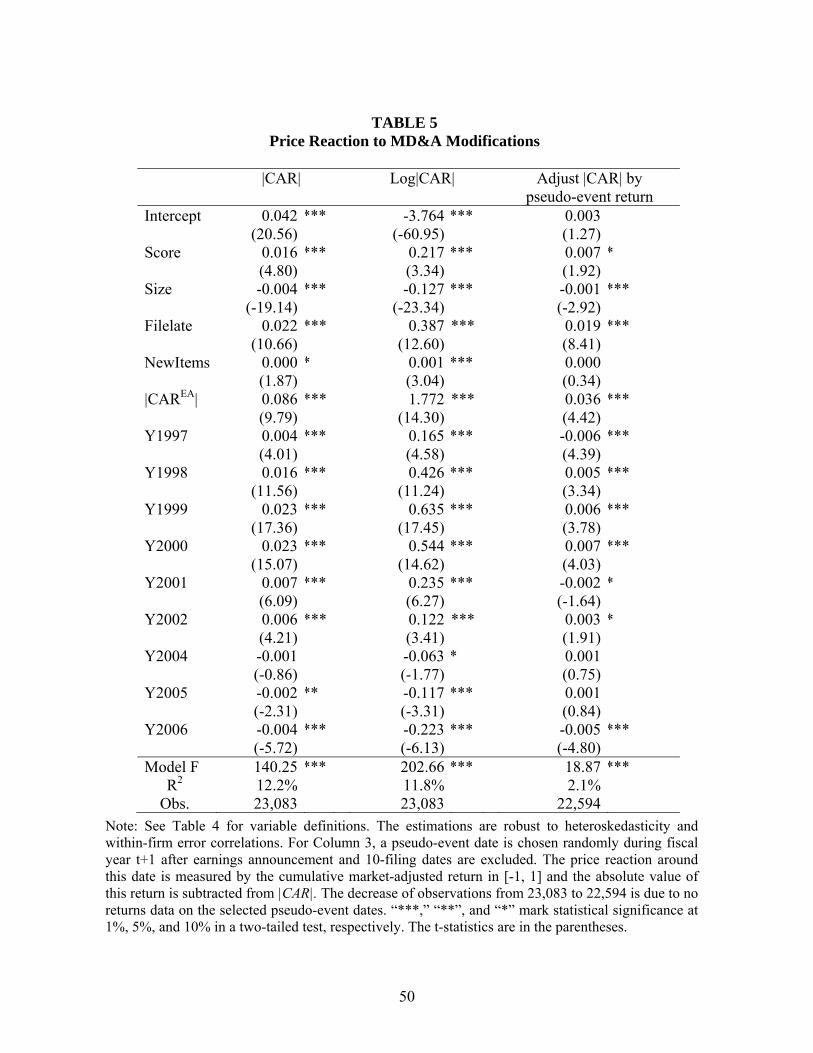
50
TABLE 5 Price Reaction to MD&A Modifications
|CAR| Log|CAR| Adjust |CAR| by
pseudo-event return Intercept 0.042
(20.56) *** -3.764
(-60.95)*** 0.003
(1.27) Score 0.016
(4.80) *** 0.217
(3.34)*** 0.007
(1.92) *
Size -0.004 (-19.14)
*** -0.127(-23.34)
*** -0.001 (-2.92)
***
Filelate 0.022 (10.66)
*** 0.387(12.60)
*** 0.019 (8.41)
***
NewItems 0.000 (1.87)
* 0.001(3.04)
*** 0.000 (0.34)
|CAREA| 0.086 (9.79)
*** 1.772(14.30)
*** 0.036 (4.42)
***
Y1997 0.004 (4.01)
*** 0.165(4.58)
*** -0.006 (4.39)
***
Y1998 0.016 (11.56)
*** 0.426(11.24)
*** 0.005 (3.34)
***
Y1999 0.023 (17.36)
*** 0.635(17.45)
*** 0.006 (3.78)
***
Y2000 0.023 (15.07)
*** 0.544(14.62)
*** 0.007 (4.03)
***
Y2001 0.007 (6.09)
*** 0.235(6.27)
*** -0.002 (-1.64)
*
Y2002 0.006 (4.21)
*** 0.122(3.41)
*** 0.003 (1.91)
*
Y2004 -0.001 (-0.86)
-0.063(-1.77)
* 0.001 (0.75)
Y2005 -0.002 (-2.31)
** -0.117(-3.31)
*** 0.001 (0.84)
Y2006 -0.004 (-5.72)
*** -0.223(-6.13)
*** -0.005 (-4.80)
***
Model F 140.25 *** 202.66 *** 18.87 *** R2 12.2% 11.8% 2.1%
Obs. 23,083 23,083 22,594 Note: See Table 4 for variable definitions. The estimations are robust to heteroskedasticity and within-firm error correlations. For Column 3, a pseudo-event date is chosen randomly during fiscal year t+1 after earnings announcement and 10-filing dates are excluded. The price reaction around this date is measured by the cumulative market-adjusted return in [-1, 1] and the absolute value of this return is subtracted from |CAR|. The decrease of observations from 23,083 to 22,594 is due to no returns data on the selected pseudo-event dates. “***,” “**”, and “*” mark statistical significance at 1%, 5%, and 10% in a two-tailed test, respectively. The t-statistics are in the parentheses.

51
TABLE 6 MD&A Modifications and Analyst Earnings Forecast Revisions
|Revision| Log|Revision| Adjust |Revision| by revisions
around pseudo event Intercept 0.015
(9.79) *** -4.771
(-47.95)*** 0.010
(7.51) ***
Score 0.000 (0.31)
0.042(0.44)
-0.000 (-0.24)
Size -0.002 (-11.26)
*** -0.138(-14.97)
*** -0.001 (-9.30)
***
Filelate 0.005 (5.74)
*** 0.368(7.48)
*** 0.003 (3.13)
***
NewItems 0.000 (1.29)
0.001(1.39)
-0.000 (-0.20)
|CAREA| 0.018 (4.861)
*** 1.134(6.01)
*** 0.002 (0.42)
Y1997 0.000 (0.47)
-0.029(-0.615)
0.000 (0.57)
Y1998 0.002 (3.08)
*** 0.105(2.25)
** 0.001 (1.78)
*
Y1999 0.001 (1.00)
0.064(1.36)
0.000 (0.63)
Y2000 0.005 (6.57)
*** 0.295(6.03)
*** 0.003 (3.51)
***
Y2001 0.002 (3.45)
*** 0.143(3.52)
*** 0.002 (2.66)
***
Y2002 0.005 (7.42)
*** 0.318(7.71)
*** 0.003 (3.83)
***
Y2004 0.001 (0.99)
-0.054(-1.43)
0.001 (0.95)
Y2005 0.001 (1.15)
0.015(0.40)
0.000 (0.54)
Y2006 0.001 (1.57)
0.015(0.37)
0.000 (0.33)
Model F 26.51 *** 44.57 *** 11.56 *** R2 5.6% 8.7% 2.3%
Obs. 10,165 10,165 9,919 Note: See Table 4 for variable definitions. The estimations are robust to heteroskedasticity and within-firm error correlations. For Column 3 a pseudo-event date is chosen randomly during fiscal year t+1 after earnings announcement and 10-K filing dates are excluded. The absolute value of consensus analyst forecast revision from the 90-day window before to the 30-day window after this date is subtracted from |Revision|. The decrease of observations from 10,165 to 9,919 is due to no revision data around the selected pseudo-event dates. “***,” “**”, and “*” mark statistical significance at 1%, 5%, and 10% in a two-tailed test, respectively. The t-statistics are in the parentheses.

52
TABLE 7 Hand-coded MD&A Subsample
Panel A: Firm-level Analysis High-Score Firms Low-Score Firms T-test Wilcoxon Year Mean Median Mean Median t Z
Score t-1,t 0.229 0.182 -0.129 -0.128 15.50*** 8.61***
Rawscore t-1,t 0.382 0.351 0.041 0.036 13.26*** 8.61***
Words t 7,424 6,744 5,214 5,182 2.88*** 2.31**
Number of aspects t 35.1 31.5 31.3 30.5 1.57 1.19
Different aspect (%) t-1,t 42.8% 40.8% 17.4% 15.4% 7.07*** 6.21***
Same aspect (%) t-1,t 71.6% 71.2% 86.5% 88.8% -6.57*** -5.67***
Change in discussion of same aspect (%) t-1,t 53.2% 52.6% 27.4% 22.3% 7.02*** 5.79***
Interpretive (%) t 41.8% 40.3% 34.4% 33.7% 1.79* 1.18
Forward looking (%) t 7.2% 4.1% 4.2% 3.6% 2.51** 1.85* Notes: 1. Sample firms are sorted into quintiles each year by the MD&A modification score. Fifty
firms are randomly selected from the highest (lowest) quintile and are referred to as the “high (low)-score group.” Each firm’s MD&A documents for the current year (t) and the previous year (t-1) are compared and coded.
2. “Aspect” is the basic unit of discussion, for example, sales performance in the current year. If an aspect appears in both years, it is a “same aspect”; otherwise, it is a “different aspect.” Both rows are presented as percentages, using the number of current-year aspects as the scalar.
3. For a “same aspect,” the discussions in both years are compared and the aspect receives a “change” code if the change is substantial. This row is presented as percentages, using the number of “same aspect” as the scalar.
4. The last two rows reflect the type of discussion for an aspect. If the discussion provides explanations, analysis, and a great amount of detail, the aspect is coded as “interpretive.” If the discussion includes statements regarding a firm’s strategy, plans, projections, and managers’ assessment of the input factors and market/industry trends, the aspect is coded as “forward-looking.” Each row is presented as percentages, using the number of current-year aspects as the scalar.
5. “***,” “**”, and “*” mark statistical significance at 1%, 5%, and 10% in a two-tailed test, respectively.

53
TABLE 7 (Continued)
Panel B: Analysis by Disclosure Section
High-Score Firms Low-Score Firms T-test Wilcoxon Section Mean Median Mean Median t Z
Overview: 38 firms 38 firms Words 755 535 555 455 1.40 0.84 Number of aspects 3.7 2 3.5 3 0.22 -0.57 Different aspect 42.8% 36.7% 12.6% 0.0% 3.68*** 2.99*** Change in discussion of same aspect 54.9% 50.0% 19.3% 0.0% 3.77*** 3.52***
Operations: 50 firms 50 firms Words 2,601 2,522 1,919 1,833 2.39** 1.71* Number of aspects 11.5 11 10.8 10 0.73 0.88 Different aspect 22.5% 16.7% 7.2% 0.0% 4.15*** 4.77*** Change in discussion of same aspect 69.3% 76.0% 38.9% 40.0% 6.64*** 5.60***
Liquidity and capital resources: 50 firms 50 firms Words 1,700 1,331 1,121 969 1.92* 1.87* Number of aspects 8.0 7 7.4 7 0.92 0.54 Different aspect 34.1% 21.1% 12.2% 11.1% 4.49*** 3.67*** Change in discussion of same aspect 56.5% 60.0% 31.5% 28.6% 4.32*** 4.06***
Accounting policies and estimates: 29 firms 31 firms Words 1,364 1,228 770 702 3.94*** 3.51*** Number of aspects 5.7 6 4.6 4 2.14** 1.93* Different aspect 38.7% 22.2% 28.1% 0.0% 0.94 1.66* Change in discussion of same aspect 27.3% 25.0% 3.4% 0.0% 4.03*** 4.01***
Risk factors: 39 firms 39 firms Words 1,393 538 837 419 1.74* 1.40 Number of aspects 4.8 4 4.8 3 1.43 1.73* Different aspect 72.3% 25.0% 15.3% 0.0% 1.44 2.43** Change in discussion of same aspect 31.5% 2.5% 11.0% 0.0% 2.44** 2.52**
Cautionary language: 34 firms 36 firms Words 193 149 233 225 1.00 -1.92* Number of aspects 1.2 1 1.1 1 1.38 1.28 Different aspect 22.1% 0.0% 8.3% 0.0% 1.62 1.69* Change in discussion of same aspect 14.8% 0.0% 6.1% 0.0% 1.07 1.10
Recent accounting standards: 32 firms 23 firms Words 404 442 476 381 -0.82 0.23 Number of aspects 3.1 3 3.4 3 -0.52 0.28
Other: 30 firms 25 firms Words 470 449 385 293 1.03 1.01 Number of aspects 2.3 2 2.6 1 0.44 0.87 Different aspect 47.1% 33.3% 30.9% 0.0% 1.14 1.06 Change in discussion of same aspect 49.3% 50.0% 16.7% 0.0% 2.73*** 2.31***
Note: If a firm does not have a given section, it is excluded from comparisons for that section.

54
TABLE 8
Price Reaction to MD&A Modifications over Time
|CAR| Log|CAR| Adjust |CAR| by pseudo-event return
Coeff. t-statistic Coeff. t-statistic Coeff. t-statistic Intercept 0.041 20.49 *** -3.774 -61.06 *** 0.003 1.16 Score 0.002 0.50 0.129 0.65 -0.000 -0.07 Y1997 0.004 3.99 *** 0.166 4.57 *** -0.006 -4.30 *** Y1998 0.015 11.23 *** 0.408 10.49 *** 0.005 2.99 *** Y1999 0.023 17.36 *** 0.632 17.25 *** 0.006 4.03 *** Y2000 0.023 14.89 *** 0.546 14.60 *** 0.007 4.11 *** Y2001 0.008 6.22 *** 0.236 6.28 *** -0.002 -1.58 Y2002 0.006 4.18 *** 0.120 3.35 *** 0.003 1.92 * Y2004 -0.001 -1.48 -0.073 -2.00 ** 0.000 0.38 Y2005 -0.002 -2.76 *** -0.118 -3.32 *** 0.001 0.54 Y2006 -0.005 -5.58 *** -0.240 -6.21 *** -0.005 -4.51 *** Score * Y1997 0.006 0.72 0.005 0.02 0.009 0.83 Score * Y1998 0.026 2.71 *** 0.478 1.85 * 0.021 1.84 * Score * Y1999 0.018 2.07 ** 0.287 1.16 -0.005 -0.46 Score * Y2000 0.041 2.57 *** 0.220 0.83 0.030 1.72 * Score * Y2001 0.005 0.52 0.059 0.22 0.002 0.16 Score * Y2002 0.005 0.37 -0.450 -1.55 0.006 0.42 Score * Y2004 -0.007 -0.99 -0.281 -0.90 -0.007 -0.82 Score * Y2005 -0.007 -1.01 0.043 0.14 -0.008 -0.94 Score * Y2006 0.000 0.03 -0.396 -1.05 0.001 0.11 Size -0.004 -19.29 *** -0.127 -23.35 *** -0.001 -3.00 *** Filelate 0.022 10.67 *** 0.399 12.61 *** 0.018 8.40 *** NewItems 0.000 2.29 ** 0.001 3.22 *** 0.000 0.56 |CAR EA| 0.086 9.74 *** 1.770 14.28 *** 0.036 4.40 *** Model F 87.85 *** 124.87 *** 12.27 *** R2 12.3% 11.9% 2.2% Obs. 23,083 23,083 22,594
Note: See variable definitions in Table 4. The estimations are robust to heteroskedasticity and within-firm error correlations. With |CAR| being the dependent variable, the F statistics from the Wald tests of (Score+Score*Y1998), (Score+Score*Y1999), and (Score+Score*Y2000) are 12.04, 8.28, and 8.28, respectively. The F statistics are 13.98, 7.56, and 3.66 when Log|CAR| is the dependent variable and are 4.67, 0.37, and 3.24 when |CAR| is adjusted by the pseudo-event return. “***,” “**”, and “*” mark statistical significance at 1%, 5%, and 10% in a two-tailed test, respectively. The t-statistics are in the parentheses.