large deformation finite element analysis of … · the popular stress recovery technique, ......
TRANSCRIPT
1 INTRODUCTION Large displacement of structural elements relative to seabed sediments is a routine practice in offshore geotechnical engineering. Some examples of this practice are the full-flow penetrometer tests, pipeline laying, lateral buckling and axial walking of the pipeline, spudcan penetration and the pull out of various anchorage systems.
For in-situ geotechnical investigation in deep waters, the full-flow penetrometers, such as the cylindrical T-bar and the spherical ball, are being proven to be more accurate in softer soils than the traditional vane shear test and piezocone penetration test. The latter usually requires corrections of the raw measured cone resistance and involves uncertainties over
LARGE DEFORMATION FINITE ELEMENT ANALYSIS OF OFFSHORE PENETRATION TESTS
Y. Tian Centre for Offshore Foundation Systems, University of Western Australia, Perth, WA, Australia
D. Wang Centre for Offshore Foundation Systems, University of Western Australia, Perth, WA, Australia
M. J. Cassidy Centre for Offshore Foundation Systems, University of Western Australia, Perth, WA, Australia
ABSTRACT: Large deformations are commonly encountered in offshore geotechnical applications, with typical examples including penetrometer characterization, pipeline laying and buckling, spudcan preloading, anchor installation, and anchor keying and pull out. As the oil and gas industry pushes into deeper water, this large deformation challenges are becoming more severe rather than mitigated. As one example in deep water, full flow penetrometers are widely used in geotechnical site investigations to evaluate the behaviour of soft clay. Offshore engineers therefore require reliable, yet easily accessible, numerical approaches that can consistently simulate these large deformation penetration processes. Although the finite element method is the most popular numerical method in geotechnical engineering, the traditional small strain finite element analysis is challenged in these large deformation events due to the excessive mesh distortion. In this paper, the large-amplitude penetration of the full flow penetrometers and pipeline are studied using three approaches based on the general concept of Arbitrary Lagrangian-Eulerian (ALE) method. The three approaches are: the Remeshing and Interpolation Technique with Small Strain, featured with standard Lagrangian increments but with periodic remeshing; the Adaptive Meshing method, using a single mesh typology definition but with adaptive relocation of the element nodes; and the Coupled Eulerian Lagrangian approach. The last methodology employs Eulerian mesh to model the soil and the soil material is allowed to flow through the elements. After comparing the numerical results from the three ALE approaches, the computing accuracy and robustness are discussed and new insight into the offshore application of the ALE methods is also presented.
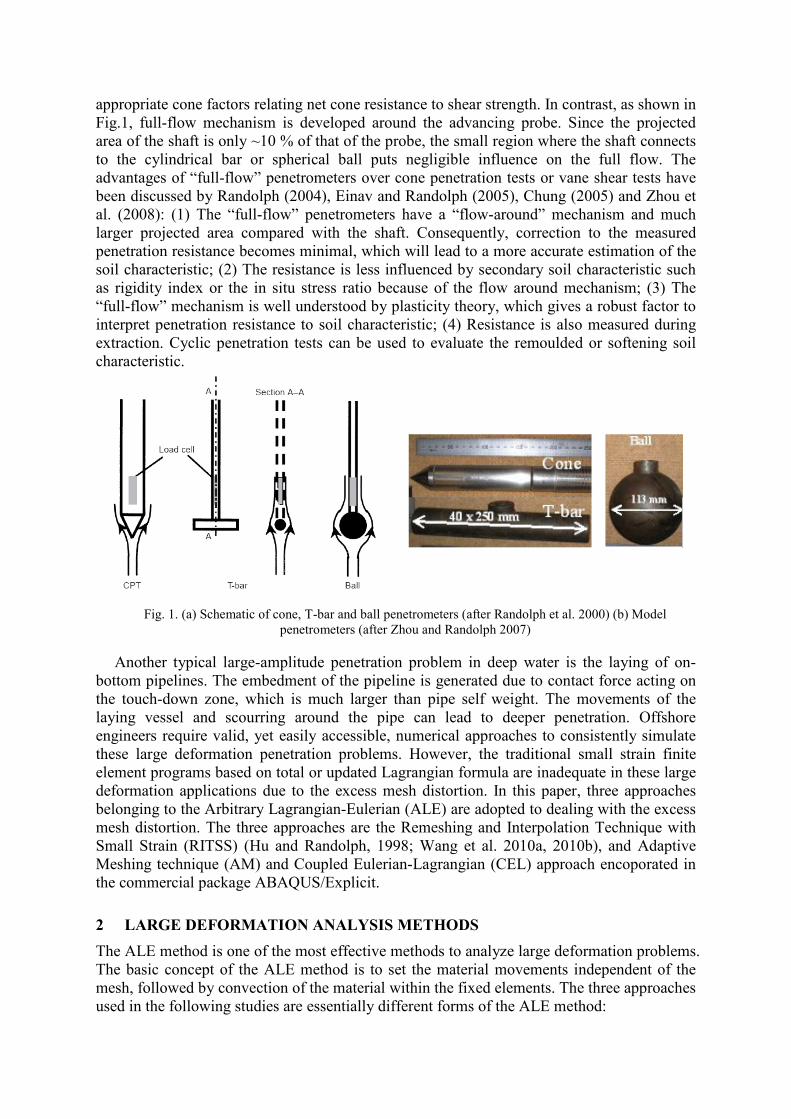
appropriate cone factors relating net cone resistance to shear strength. In contrast, as shown in Fig.1, full-flow mechanism is developed around the advancing probe. Since the projected area of the shaft is only ~10 % of that of the probe, the small region where the shaft connects to the cylindrical bar or spherical ball puts negligible influence on the full flow. The advantages of “full-flow” penetrometers over cone penetration tests or vane shear tests have been discussed by Randolph (2004), Einav and Randolph (2005), Chung (2005) and Zhou et al. (2008): (1) The “full-flow” penetrometers have a “flow-around” mechanism and much larger projected area compared with the shaft. Consequently, correction to the measured penetration resistance becomes minimal, which will lead to a more accurate estimation of the soil characteristic; (2) The resistance is less influenced by secondary soil characteristic such as rigidity index or the in situ stress ratio because of the flow around mechanism; (3) The “full-flow” mechanism is well understood by plasticity theory, which gives a robust factor to interpret penetration resistance to soil characteristic; (4) Resistance is also measured during extraction. Cyclic penetration tests can be used to evaluate the remoulded or softening soil characteristic.
Fig. 1. (a) Schematic of cone, T-bar and ball penetrometers (after Randolph et al. 2000) (b) Model penetrometers (after Zhou and Randolph 2007)
Another typical large-amplitude penetration problem in deep water is the laying of on-bottom pipelines. The embedment of the pipeline is generated due to contact force acting on the touch-down zone, which is much larger than pipe self weight. The movements of the laying vessel and scourring around the pipe can lead to deeper penetration. Offshore engineers require valid, yet easily accessible, numerical approaches to consistently simulate these large deformation penetration problems. However, the traditional small strain finite element programs based on total or updated Lagrangian formula are inadequate in these large deformation applications due to the excess mesh distortion. In this paper, three approaches belonging to the Arbitrary Lagrangian-Eulerian (ALE) are adopted to dealing with the excess mesh distortion. The three approaches are the Remeshing and Interpolation Technique with Small Strain (RITSS) (Hu and Randolph, 1998; Wang et al. 2010a, 2010b), and Adaptive Meshing technique (AM) and Coupled Eulerian-Lagrangian (CEL) approach encoporated in the commercial package ABAQUS/Explicit.
2 LARGE DEFORMATION ANALYSIS METHODS The ALE method is one of the most effective methods to analyze large deformation problems. The basic concept of the ALE method is to set the material movements independent of the mesh, followed by convection of the material within the fixed elements. The three approaches used in the following studies are essentially different forms of the ALE method:
(1) Remeshing and Interpolation Technique with Small Strain (RITSS) approach: The RITSS approach was proposed by Hu and Randolph (1998) and is based on standard small strain Lagrangian increments but with frequent mesh regeneration. At the beginning of each increment, the deformed soil is remeshed and the stresses and material properties are interpolated from the old mesh to the new mesh. This interpolation is similar to the convection of the materials for Eulerian computation. The advantage of the RITSS strategy is that it can be coupled with any standard FE code. In this paper’s study, the commercial package, ABAQUS/Standard, is employed to conduct updated Lagrangian calculation in each increment. The popular stress recovery technique, Superconvergent Patch Recovery, is adopted for interpolation from the old mesh to the new mesh. The detailed procedure of ABAQUS-based RITSS analyses can be found in Wang et al (2010a; 2010b). In this method’s analysis cases, the soil is meshed with quadratic triangular elements.
(2) Adaptive meshing (AM) technique incorporated in ABAQUS/Explicit (Dassault Systèmes, 2010): This technique is in principal similar to the RITSS approach except that the mesh topology is unchanged. The nodes in specified adaptive domains are frequently adapted to remain reasonable element shape during large deformation analysis. However, the topology i.e. the number of elements and connectivity of each element is not altered. A second-order advection proposed by Van Leer (1977) is involved in this adaptive technique to map the field variables to the new mesh. The soil is meshed with linear quadrilateral elements in the AM analyses.
(3) Coupled Eulerian-Lagrangian (CEL) approach in ABAQUS/Explicit (Dassault Systèmes, 2010): The soil undergoing large displacements is discretized as Eulerian mesh, whilst the structure elements, such as pipeline, T-bar and Ball penetrometer, are discretized as Lagrangian mesh. The interaction between the structure elements and the soil is modeled with general contact algorithm. The Eulerian elements are fixed in space, with soil material flowing in or out of the elements. Since Eulerian elements may not always be 100% full of material, the material boundaries are tracked automatically to obtain the soil surfaces and structure/soil interfaces. The Eulerian mesh generated before the calculation has to be large enough to accommodate the movements of the soil. Only 3D simulations are available in the current version of ABAQUS CEL, so the plane strain or axial symmetric analyses in this paper are implemented by taking a slice or a quarter. The soil is meshed with 8-node linear hexahedron elements with reduced integration.
3 CALCULATION EXAMPLES OF OFFSHORE PENETRATION The above mentioned methods are employed to investigate undrained penetrations of T-Bar, pipeline and ball penetrometer in soft clays. The diameters of the penetrometers are taken as representative sizes in the offshore industry (Low, 2009). The soil is modeled as elastic-perfectly plastic material with the Tresca yield criteria. The undrained soil strength is taken as homogeneous or increasing with the soil depth for normally consolidated (NC) clay:
kzss umu += (1)
where su is the undrained shear strength; z is soil depth from the surface and sum is the shear strength at the soil surface; and k is the strength gradient, with k = 0 meaning a homogeneous soil. The Young’s modulus E of the soil is taken as 500 su and the Poisson ratio ν is considered as 0.49 to model the constant volume under undrained conditions.
Since their stiffness is far higher than the soil, the penetrometers or the pipes are modeled as rigid bodys. The interaction between penetrometers and soil is modeled as “hard-contact pairs”. The interface is taken as either fully rough or smooth. Due to the suction generated in
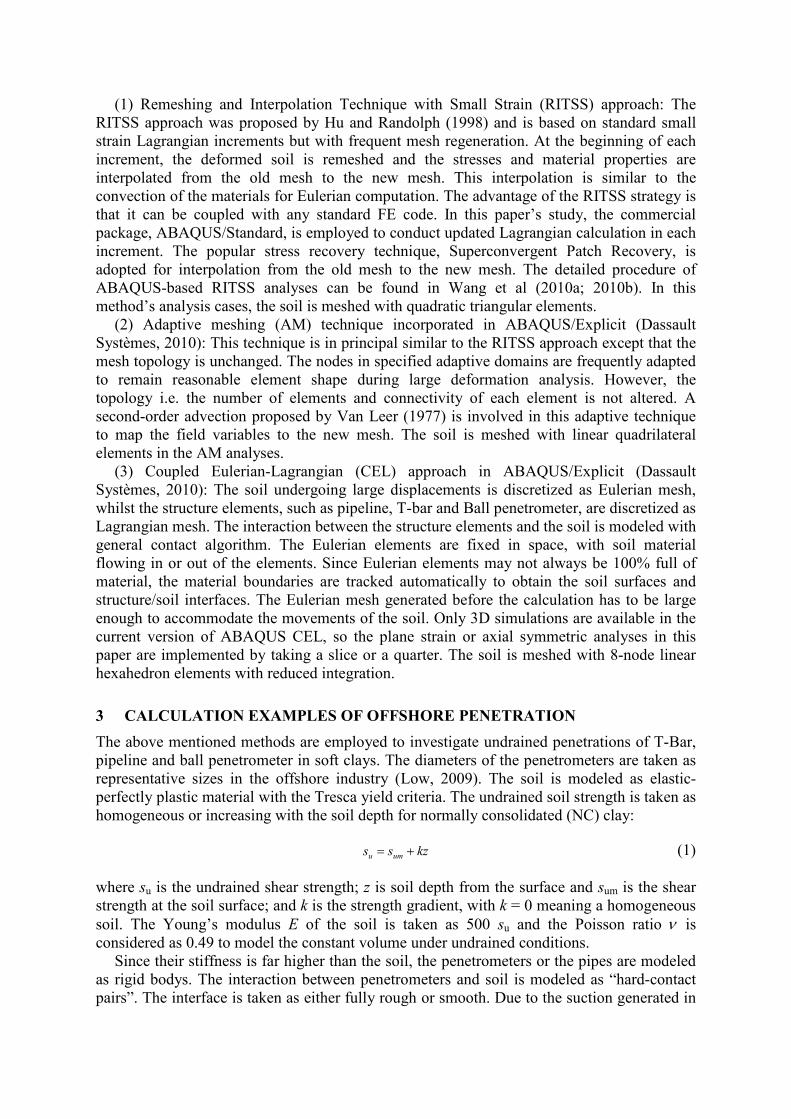
the undrained soil behaviour, the soil is assumed to remain attached to the penetrometer or pipe after occurrence of contact in the RITSS and AM. In CEL, however, the above assumption is not allowed due to the “general contact” used (Dassault Systèmes, 2010). The calculation cases are detailed in Table 1. Although the AM and CEL simulations are conducted in explicit dynamic analysis, all these study cases are to investigate the static responses. Therefore, the penetration velocity has to be sufficiently slow to diminish the inertia effect. The velocity of T-bar, pipeline and ball are taken as 0.0024m/s, 0.012m/s and 0.00678m/s respectively. The calculation cases are detailed in Table 1.
Table 1. Calculation cases of cylindrical object penetration
Calculation example
Case name Penetrometer diameter D (m)
Soil type Soil shear strength (kPa)
Penetrometer-soil contact condition
T-bar TSH* 0.04 Homogeneous 5 Smooth
TRH Homogeneous 5 Rough
TSN Normal consolidated 0.1+1z Smooth
TRN Normal consolidated 0.1+1z Rough
Pipeline PSH 1 Homogeneous 9 Smooth
PRH Homogeneous 9 Rough
PSN Normal consolidated 5+1.5z Smooth
PRN Normal consolidated 5+1.5z Rough
Ball BSH 0.113 Homogeneous 5 Smooth
BRH Homogeneous 5 Rough
BSN Normal consolidated 0.1+1z Smooth
BRN Normal consolidated 0.1+1z Rough
* The first letter the of Case Name stands for penetrometer: T-bar, Pipeline or Ball; the second stands for contact condition: Smooth or Rough; the third stands for soil type: Homogeneous or Normal consolidated.
In the T-bar and pipeline cases, infinite long T-bar or pipeline is considered (plane strain
condition). The RITSS and AM can conduct plane strain analysis, whilst a slice of the T-bar or pipeline is utilised in the CEL analyses to mimic the plane strain condition (only 3D is supported in the current ABAQUS version). In the ball cases, axial symmetric conditions are employed in RITSS and AM and a quarter of the three dimensional ball is adopted in the CEL. The mobilized soil resistance is normalized as a bearing capacity factor Nc
Ls
VNu
c = (2)
where V is the soil resistance; L is the maximum projecting area, L = D under plane strain condition and L = πD2/4 under axial symmetric condition; and su is adopted as the soil strength at the depth of the structure centre.
For deep T-bar/pipe and ball without shaft, ideal full flow mechanisms are formed and the theoretical solution of Nc from upper and lower bound limit analyses are listed in Table 2 (Randolph & Houlsby, 1984; Einav & Randolph, 2005; Martin & Randolph, 2006). The RITSS approach is first verified by comparison with the analytical solutions. The diameters of penetrometers and soil strength are the same as the corresponding values in Table 1. The penetrometer is “wished in place” with an initial embedment depth of 4.5D. The soil is weightless to remove the effect of overburden pressure on the bearing capacity. The load-
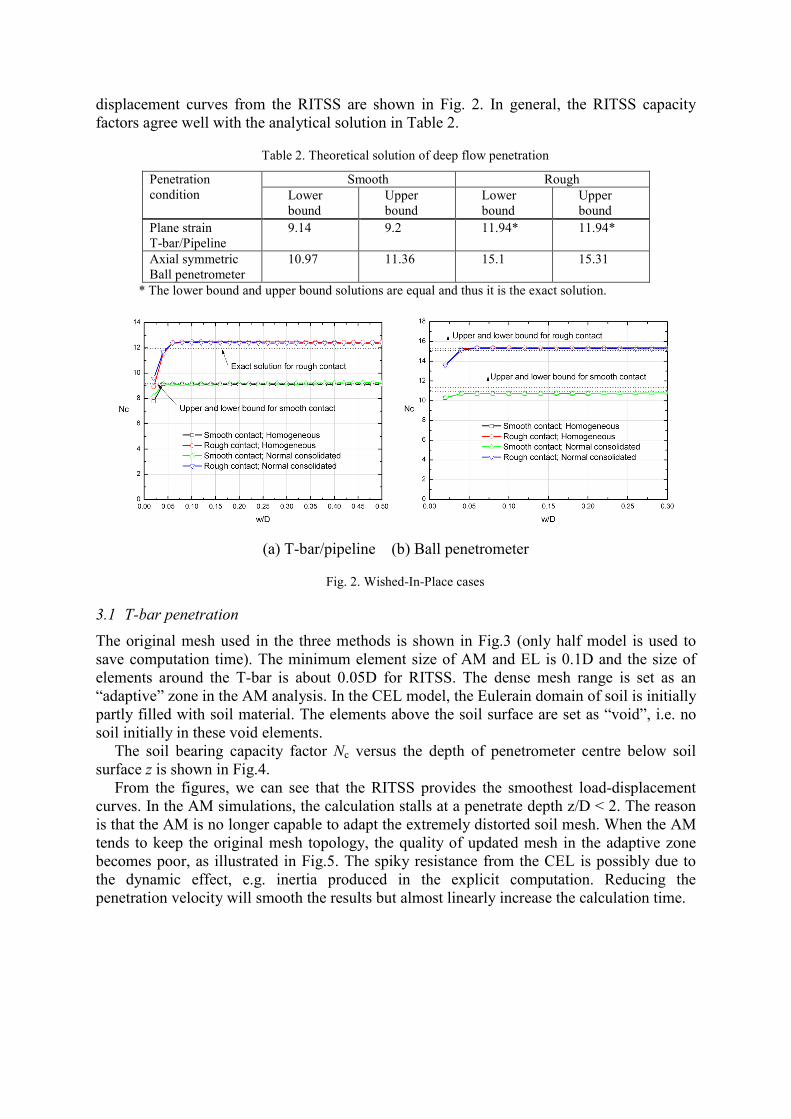
displacement curves from the RITSS are shown in Fig. 2. In general, the RITSS capacity factors agree well with the analytical solution in Table 2.
Table 2. Theoretical solution of deep flow penetration
Penetration condition
Smooth Rough Lower bound
Upper bound
Lower bound
Upper bound
Plane strain T-bar/Pipeline
9.14 9.2 11.94* 11.94*
Axial symmetric Ball penetrometer
10.97 11.36 15.1 15.31
* The lower bound and upper bound solutions are equal and thus it is the exact solution.
(a) T-bar/pipeline (b) Ball penetrometer
Fig. 2. Wished-In-Place cases
3.1 T-bar penetration The original mesh used in the three methods is shown in Fig.3 (only half model is used to save computation time). The minimum element size of AM and EL is 0.1D and the size of elements around the T-bar is about 0.05D for RITSS. The dense mesh range is set as an “adaptive” zone in the AM analysis. In the CEL model, the Eulerain domain of soil is initially partly filled with soil material. The elements above the soil surface are set as “void”, i.e. no soil initially in these void elements.
The soil bearing capacity factor Nc versus the depth of penetrometer centre below soil surface z is shown in Fig.4.
From the figures, we can see that the RITSS provides the smoothest load-displacement curves. In the AM simulations, the calculation stalls at a penetrate depth z/D < 2. The reason is that the AM is no longer capable to adapt the extremely distorted soil mesh. When the AM tends to keep the original mesh topology, the quality of updated mesh in the adaptive zone becomes poor, as illustrated in Fig.5. The spiky resistance from the CEL is possibly due to the dynamic effect, e.g. inertia produced in the explicit computation. Reducing the penetration velocity will smooth the results but almost linearly increase the calculation time.
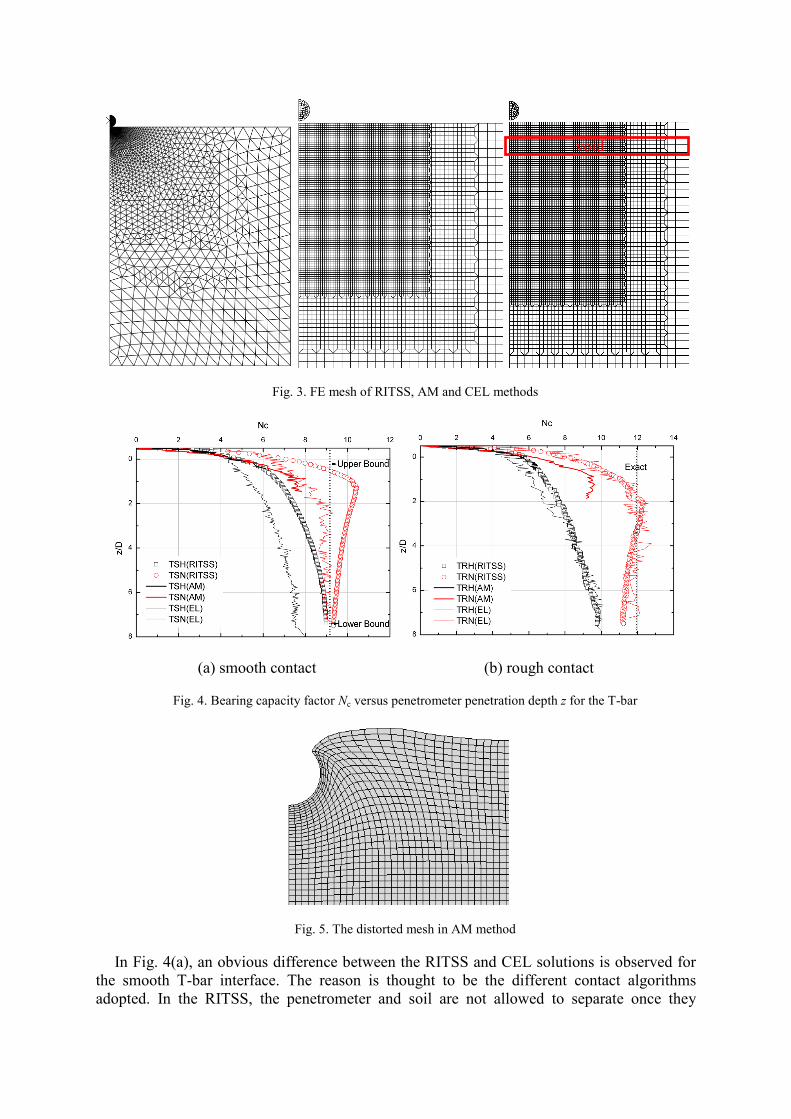
Fig. 3. FE mesh of RITSS, AM and CEL methods
(a) smooth contact (b) rough contact
Fig. 4. Bearing capacity factor Nc versus penetrometer penetration depth z for the T-bar
Fig. 5. The distorted mesh in AM method
In Fig. 4(a), an obvious difference between the RITSS and CEL solutions is observed for the smooth T-bar interface. The reason is thought to be the different contact algorithms adopted. In the RITSS, the penetrometer and soil are not allowed to separate once they
void

contact, which is to simulate the suction developed on the interface. In contrast, this no-separation behaviour is not available in CEL due to software limitations. This can be further proven in homogeneous soil: an inclined wall is formed above the T-bar shoulder in CEL simulation (Fig. 6). The full flow mechanism is not fully mobilized even the T-bar approaches an embedment depth as deep as 7D (CEL at a depth of 6.85D and RITSS at 6.7D are used because there is not no exact same penetration data due to the difference calculation time increment). Correspondingly, the CEL capacity factor in deep embedment is significantly lower than the analytical solution and the RITSS results. As shown in Fig. 6, the wall also exists in the RITSS simulation, but the gap width above the T-bar is very small, so the deep resistance from RITSS in Fig. 4(a) is marginally lower than the analytical solution.
When the T-bar interface is rough, the CEL and RITSS give close curves for both homogeneous and normally consolidated clay in Fig. 4(b), although bearing capacity factors from both methods are lower than the exact solution. The reason is similar to that presented for the smooth T-bar in homogenous soil: the large gap width above the T-bar prevents a full flow mechanism.
Fig. 6. Comparison of the soil surface profile between RITSS and CEL
3.2 Pipeline penetration The pipeline penetration is similar as the T-bar analysis except a larger diameter and different soil shear strength (see Table 1). The soil bearing capacity factor Nc versus the depth of penetrometer centre below soil surface z is shown in Fig.7.
For the smooth pipe, the large overburden pressure drives the soil wall collapsing onto the pipeline to form the full flow mechanism. Thus the capacity factors of the smooth pipe reach the ultimate value at a relatively shallower depth. However, for the rough pipe, the gap above the pipe still remains as the pipe embedment depth approaches z/D = 7.5.
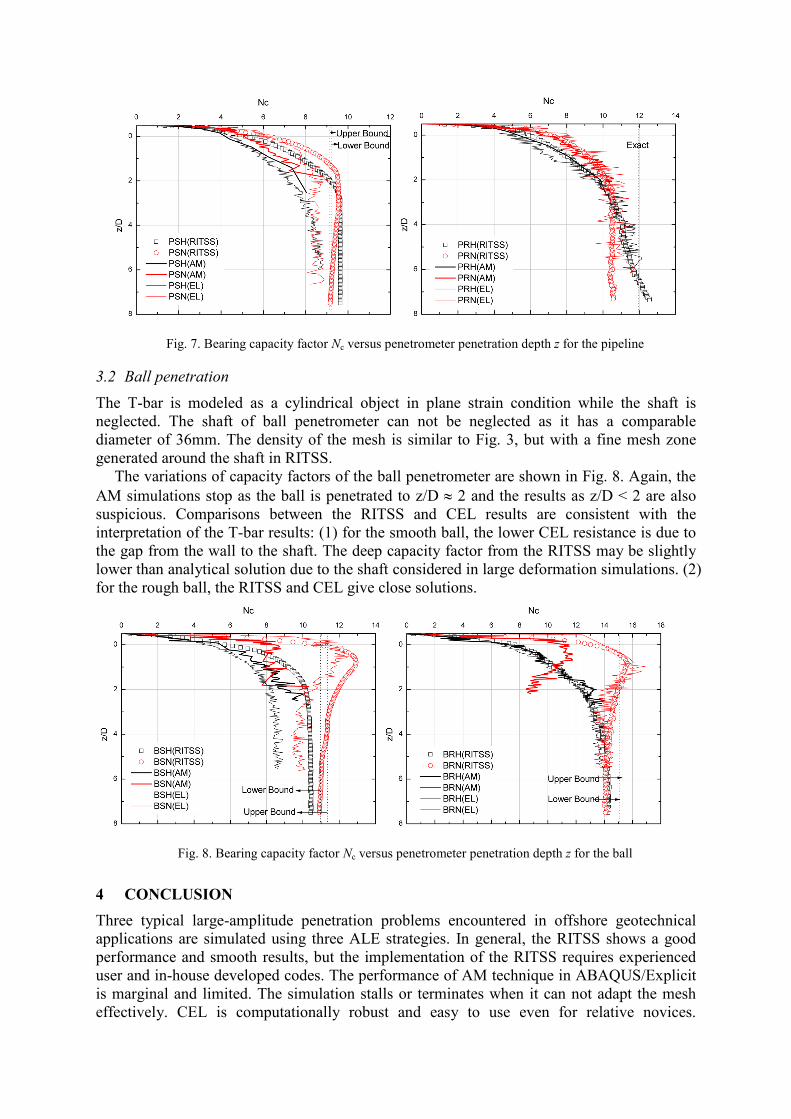
Fig. 7. Bearing capacity factor Nc versus penetrometer penetration depth z for the pipeline
3.2 Ball penetration The T-bar is modeled as a cylindrical object in plane strain condition while the shaft is neglected. The shaft of ball penetrometer can not be neglected as it has a comparable diameter of 36mm. The density of the mesh is similar to Fig. 3, but with a fine mesh zone generated around the shaft in RITSS.
The variations of capacity factors of the ball penetrometer are shown in Fig. 8. Again, the AM simulations stop as the ball is penetrated to z/D ≈ 2 and the results as z/D < 2 are also suspicious. Comparisons between the RITSS and CEL results are consistent with the interpretation of the T-bar results: (1) for the smooth ball, the lower CEL resistance is due to the gap from the wall to the shaft. The deep capacity factor from the RITSS may be slightly lower than analytical solution due to the shaft considered in large deformation simulations. (2) for the rough ball, the RITSS and CEL give close solutions.
Fig. 8. Bearing capacity factor Nc versus penetrometer penetration depth z for the ball
4 CONCLUSION Three typical large-amplitude penetration problems encountered in offshore geotechnical applications are simulated using three ALE strategies. In general, the RITSS shows a good performance and smooth results, but the implementation of the RITSS requires experienced user and in-house developed codes. The performance of AM technique in ABAQUS/Explicit is marginal and limited. The simulation stalls or terminates when it can not adapt the mesh effectively. CEL is computationally robust and easy to use even for relative novices.
Although its numerical accuracy is lower than the RITSS (at least in this paper’s cases), it is a promising and potential approach.
ACKNOWLEDGEMENT This research was funded by the Australia-China Natural Gas Technology Partnership Fund and forms part of the activities of the Australian Research Council Centre of Excellence on Geotechnical Science and Engineering. The third author is the recipient of an Australian Research Council Future Fellowship. The IT support from Mr. Kan Yu at The University of Western Australia is appreciated.
REFERENCES Chung, S.F. (2005). Characterisation of soft soils for deep water developments. PhD Thesis,
The University of Western Australia, Perth, WA, Australia Dassault Systèmes. (2010). Abaqus Analysis User’s Manual Einav, I. and Randolph, M.F. (2005). Combining upper bound and strain path methods for
evaluating penetration resistance. Int. J. Numer. Methods Eng. 63(14), 1991-2016 Hu, Y. and Randolph, M. F. (1998). A practical numerical approach for large deformation
problem in soil. International Journal for Numerical and Analytical Methods in Geomechanics, Vol. 22, No. 5, 327-350.
Low, H.E. (2009). Performance of Penetrometers in Deepwater Soft Soil Characterisation. PhD Thesis, The University of Western Australia, Perth, WA, Australia
Martin, C. M. and Randolph, M. F. (2006). Upper-bound analysis of lateral pile capacity in cohesive soil. Geotechnique, 56(2), 141-145.
Randolph, M. F. and Houlsby, G. T. (1984). The limiting pressure on a circular pile loaded laterally in cohesive soil. Geotechnique, 34(4), 613-623.
Randolph, M. F., Martin, C.M. and Hu, Y. (2000). Limiting resistance of a spherical penetrometer in cohesive material. Geotechnique, Vo. 50, No.5, 573-582.
Randolph, M. F. (2004). Characterisation of soft sediments for offshore applications, keynote paper, Proc. 2nd Int. Conf. on Site Characterisation, Porto, Portugal, 1, 209-231
Van Leer, B. (1977). Towards the Ultimate Conservative Difference Scheme IV. A New Approach to Numerical Convection. J. Comp. Phy., Vol. 23, 276.
Wang, D., Hu, Y., and Randolph, M. F. (2010a) Three-dimensional large deformation finite element analysis of plate anchor in uniform clay. J. Geotech. Geoenviron. Engrg., 136(2), 355-365.
Wang, D., White, D. J. and Randolph, M. F. (2010b). Large deformation finite element analysis of pipe penetration and large-amplitude lateral displacement. Can. Geotech. J., 47: 842-856.
Zhou, H., White, D.J. and Randolph, M.F. (2008). Physical and numerical simulation of shallow penetration of a cylindrical object into soft clay. Proc. GeoCongress 2008: The Challenges of Sustainability in the Geoenvironment, New Orleans, Louisiana, USA.
Zhou, H. and Randolph, M.F. (2007). Computational techniques and shear band development for cylindrical and spherical penetrometers in strain-softening clay. Int. J. Geomech., ASCE. Vol.7, No. 4, 287-295