large anomalous nernst effect at room temperature in a ... · large anomalous nernst effect at room...
TRANSCRIPT
arX
iv:1
710.
0006
2v1
[co
nd-m
at.m
es-h
all]
20
Sep
2017
Large anomalous Nernst effect at room temperature in a
chiral antiferromagnet
Muhammad Ikhlas1∗, Takahiro Tomita1∗, Takashi Koretsune2,3, Michi-To Suzuki2, Daisuke Nishio-
Hamane1, Ryotaro Arita2,4, Yoshichika Otani1,2,4, Satoru Nakatsuji1,4,∗
1Institute for Solid State Physics, University of Tokyo, Kashiwa 277-8581, Japan
2RIKEN-CEMS, 2-1 Hirosawa, Wako 351-0198, Japan
3PRESTO, Japan Science and Technology Agency (JST), 4-1-8 Honcho Kawaguchi, Saitama 332-
0012, Japan.
4CREST, Japan Science and Technology Agency (JST), 4-1-8 Honcho Kawaguchi, Saitama 332-
0012, Japan.
Temperature gradient in a ferromagnetic conductor may generate a spontaneous transverse
voltage drop in the direction perpendicular to both magnetization and heat current. This
anomalous Nernst effect (ANE) has been considered to be proportional to the magnetization1–7,
and thus observed only in ferromagnets, while recent theories indicate that ANE provides a
measure of the Berry curvature at the Fermi energy EF8, 9. Here we report the observation of
a large ANE at zero field in the chiral antiferromagnet Mn3Sn10. Despite a very small mag-
netization ∼ 0.002 µB/Mn, the transverse Seebeck coefficient at zero field is ∼ 0.35 µV/K at
room temperature and reaches ∼ 0.6 µV/K at 200 K, comparable with the maximum value
known for a ferromagnetic metal. Our first-principles calculation reveals that the large ANE
∗These two authors contributed equally.
1

comes from a significantly enhanced Berry curvature associated with the Weyl points nearby
EF11. The ANE is geometrically convenient for the thermoelectric power generation, as it
enables a lateral configuration of the modules to efficiently cover the heat source6. Our ob-
servation of the large ANE in an antiferromagnet paves a way to develop a new class of ther-
moelectric material using topological magnets to fabricate an efficient, densely integrated
thermopile.
Current intensive studies on thermally induced electron transport in ferromagnetic (FM) ma-
terials have opened various venues for the research on thermoelectricity and its application12–15.
This trend has also triggered renewed interest in anomalous Nernst effect (ANE) in FM metals3–7, 15,
which is the spontaneous transverse voltage drop induced by heat current and is known to be pro-
portional to magnetization (Fig. 1a). On the other hand, the recent Berry phase formulation of the
transport properties has led to the discovery that a large anomalous Hall effect (AHE) may arise
not only in ferromagnets, but in antiferromagnets and spin liquids, in which the magnetization is
vanishingly small10, 16–23. As the first case in antiferromagnets, Mn3Sn has been experimentally
found to exhibit a large AHE10. While the AHE is obtained by an integration of the Berry curva-
ture for all the occupied bands, the ANE is determined by the Berry curvature at EF8, 9. Thus, the
observation of a large AHE does not guarantee the observation of a large ANE. Furthermore, the
ANE measurement should be highly useful to clarify the Berry curvature spectra near EF and to
verify the possibility of the Weyl metal recently proposed for Mn3Sn11.
Mn3Sn has a hexagonal crystal structure with space group of P63/mmc24. Mn atoms form
a breathing type of a kagome lattice in the ab-plane (Fig. 1b), and the Mn triangles constituting
2

the kagome lattice are stacked on top along the c-axis forming a tube of face sharing octahedra.
On cooling below the Neel temperature of 430 K, Mn magnetic moments of ∼ 3µB lying in the
ab-plane form a coplanar, chiral magnetic structure characterized by Q = 0 wave vector, as clar-
ified by the previous neutron diffraction studies25, 26. The combination of geometrical frustration
and Dzyaloshinskii−Moriya interaction leads to the inverse triangular spin structure with uniform
vector chirality (Fig. 1b)25–27. The chiral antiferromagnetic order has orthorhombic symmetry and
thus induces a very tiny magnetization ∼ 2 mµB/Mn, which is essential to switch the non-collinear
antiferromagnetic structure by using magnetic field. On further cooling below ∼ 50 K, a cluster
glass phase appears as spins cant toward [0001] (c axis)26, 28, 29. In this study, we used two as-grown
single crystals that have a single phase of hexagonal Mn3Sn 30 (Methods, Supplementary Informa-
tion), with slightly different compositions, i.e., Mn3.06Sn0.94 for “Sample 1”, and Mn3.09Sn0.91 for
“Sample 2” (Methods). Hereafter, we focus on the coplanar magnetic phase at T > 60 K.
We first provide clear evidence of the large anomalous Hall and Nernst effects observed
in Samples 1&2. Figures 2a & 2b show the field dependence of the Hall resistivity ρH(B) in
B ‖ [0110] for Samples 1 & 2, respectively. Clearly, there is a sharp jump in ρH(B) with a small
coercivity of < 200 G. In particular for Sample 2, the size of the jump ∆ρH reaches ∼ 9 µΩcm
at 100 K, which would be equivalent to the Hall resistivity due to an ordinary Hall effect under
∼ a few 100 T for free conduction electrons with density of order one electron per Mn atom.
To make comparison with theory later, here we take the x, y, and z coordinates along [2110],
[0110], and [0001], and estimate the Hall conductivity employing the following expression that
takes care of the anisotropy of longitudinal resistivity (Fig. S1), namely, σji ≈ −ρji/(ρjjρii),
where (i, j) = (x, y), (y, z), (z, x) 22 (Supplementary Information). Figures 2c & 2d show −σzx
3

vs. B for Samples 1 & 2, respectively. The zero field value is ∼ 50 Ω−1cm−1 at 300 K for both
samples and it becomes particularly enhanced for Sample 2 at low T s and reaches 120 Ω−1cm−1
at 100 K. The sign change in the Hall effect as a function of field should come from the flipping of
the tiny uncompensated moment which follows the rotation of the sublattice moments10, 25, 27.
Our main experimental observation of a large ANE at room temperature is provided in Fig.
3a. The Nernst signal (transverse thermopower) −Szx of Sample 1 shows a clear rectangular hys-
teresis with an overall change of ∆Szx ∼ 0.7 µV/K as a function of the in-plane field. This is
significantly large for an antiferromagnet and comparable to the values reported for ferromagnets,
as we will discuss. While the in-plane Nernst signal exhibits hysteresis with almost no anisotropy,
the out-of-plane c-axis component is zero within experimental accuracy, indicating no spontaneous
effect in this direction. To further characterize the ANE, we compare it with the magnetization M
by plotting in Fig. 3a both −Szx and M sharing an x-axis for the in-plane field. In low fields,
the hystereses in both data almost overlap on top of each other. On the other hand, in the higher
field region than the coercivity of ∼ 100 G, the Nernst effect remains nearly constant, while M
increases linearly with field as the sub-lattice moments cant toward the external field direction.
These indicate negligible contributions from the normal Nernst effect and presumably the conven-
tional ANE. Furthermore, the remnant Nernst signal at zero field is nearly the same as the saturated
value in high field, demonstrating that the single-domain crystal has a large spontaneous Nernst
signal as the first case for an antiferromagnet. Similar behavior was found in the field cycles made
for Sample 2 (Fig. 3b). A systematic change of the Nernst signal was observed with varying T
for both Samples 1 & 2, (Figs. 3c & 3d). For Sample 1, the Nernst signal peaks at ∼ 200 K,
reaching a value of 0.6 µV/K, comparable with the maximum value known for a FM metal at room
4

temperature7, while Sample 2 shows a smaller value, peaking at 250 K with 0.3 µV/K. A distinct
mechanism from the FM case should be at work here as the spontaneous M in Mn3Sn is nearly
1000 times smaller than ordinary ferromagnets.
To further characterize thermoelectric properties, we measured the longitudinal Seebeck co-
efficient Sii as a function of T and B. No field dependence was seen in Sii for both samples in
the T and B range of the measurements (Supplementary Information, Figs. S2a&b). The Seebeck
coefficient for Sample 1 positively peaks at ∼ 300 K (Fig. 3c, inset), and takes a minimum value
with a negative sign around 50 K. This minimum coincides with the steep rise in the specific heat,
and thus, this sign change in S(T ) may be related to the effect of phonon drag which typically oc-
curs at ∼ ΘD/5, where ΘD is the Debye T (Supplementary Information, Fig. S3). Much reduced
or no low T sign change was seen for Sample 2 (Fig. 3d, inset).
Generally, temperature gradient ∇T in an open circuit condition is known to produce longi-
tudinal and transverse electric field E, which can be expressed as J = σ · E +α · (−∇T ) = 0.
Here J , σ and α are the current density, electrical conductivity tensor, and thermoelectric con-
ductivity tensor, respectively. This contains the transverse electric field coming from the thermal
Hall effect, which should be negligible as it is usually one order of magnitude smaller than other
contributions3, 4, 31. Assuming this, the Nernst signal can be expressed as Sji = ρjj(αji − Siiσji),
using the Seebeck coefficient Sii(= S) and the Hall conductivity σji(= σH). For this analysis, we
used the T dependence of the Hall conductivity shown in Fig. 3e. As shown in Figs. 3c&3d, −ραji
estimated using this relation is found to be larger than −Sji. We further estimated the transverse
thermoelectric conductivity −αzx vs. T (Fig. 3f), which shows a systematic increase on cooling
5

and has the maximum at T ∼ 150(100) K for Sample 1(2). At low T s, Sample 2 has twice smaller
values than Sample 1. In ferromagnets, αji normally shows an increase on cooling, scaling linearly
with M , and decreases linearly with T after M saturates3, 4. In Mn3Sn, however, no correlation
with M was seen in −αzx(T ) (Fig. 3f).
To further demonstrate the qualitative difference between the ANE observed in Mn3Sn and in
ferromagnets, we made a full logarithmic plot of the anomalous Nernst signal vs. the magnetization
for various FM metals and Mn3Sn (Fig. 4, Methods). Here, the absolute values of the Nernst signal
were taken in the magnetically ordered states of each material, and were plotted using B and T as
implicit parameters. Similarly to AHE16, the ANE for ferromagnets is known to be proportional to
magnetization. Indeed, Figure 4 confirms such an overall trend for a broad range of FM metals that
the anomalous Nernst signal becomes larger with increasing magnetization (Methods). The shaded
region which covers all the data points indicates that the anomalous Nernst signal is indeed roughly
proportional to the magnetization M , i.e. |Sji| = |Qs|µ0M with the anomalous Nernst coefficient
|Qs| ranging between 0.05 and 1 µV/KT. Following this relation, Mn3Sn would have produced the
Nernst signal of the order of 0.01 ∼ 2 nV/K with the observed magnetization. Strikingly, however,
Sji ∼ 0.3µV/K found at room T is more than 100 times larger than what would be expected based
on the above scaling relation for ferromagnets.
The significantly large anomalous Nernst and Hall effects in Mn3Sn do not follow their
conventional scaling relation with M , and thus it is natural to assume that both effects arise through
the same mechanism distinct from the conventional one for ferromagnets. The inverse triangular
spin structure for Mn3Sn reduces the lattice symmetry from six fold to two fold in the plane and
6
thus based on the symmetry argument, the Hall effect may appear in the ab-plane32. Indeed, a
recent calculation found that Mn3Sn may have a large anomalous Hall conductivity21, which can
be estimated by integrating the Berry curvature of the occupied bands over the entire Brillouin
zone9. More recently, the possibility of a Weyl metal has been proposed, where the bands crossing
EF have several Weyl points, around which the Berry curvature diverges11.
Another intriguing quantity governed by the Berry curvature is the anomalous Nernst effect.
While all the occupied bands are relevant for the anomalous Hall conductivity, only the Berry
curvature around the Fermi level determines the ANE or, more precisely, the transverse thermo-
electric conductivity αji8, 9. Therefore, αji is significantly enhanced when the Berry curvature
takes a large value at EF. To see this in the case of Mn3Sn, we performed a first-principles cal-
culation, confirming the Weyl points nearby EF11. The calculated anomalous Hall conductivity
−σzx is found as large as seen in experiment. Theoretically, the extra Mn in Sample 1(2) should
dope the conduction electron (Supplementary Information) and thus increase EF by 0.04 (0.05)
eV. Since −σzx forms a peak at E − EF ∼ 0.065 eV (Fig. S4), a shift in EF from +0.04 to +0.05
eV leads to a slight increase in −σzx, but a substantial decrease in −αzx (Figs. 3e, 3f inset). This
behaviour is consistent with the experimental observation, i.e., Mn doping suppresses −αzx by
50 % at low temperatures, while it enhances −σzx only by ∼ 10 % (Figs. 3e, 3f). For a simple
Weyl Hamiltonian, σji takes its maximum and αji becomes zero when EF is located exactly at the
Weyl node and on the other hand, αji becomes strongly enhanced when EF moves slightly away33.
Clearly, the real band structure of Mn3Sn should be more complicated. Interestingly, however, our
theory also finds that −σzx forms a peak at E − EF ∼ 0.065 eV, around which Weyl nodes exist
11, and −αzx becomes large when EF is slightly away from the nodes (Fig. S4). Our results thus
7
indicate that the ANE in Mn3Sn is particularly enhanced because of the characteristic structure of
the Berry curvature with several Weyl points nearby the Fermi level11, 33. Our study further high-
lights the complementary roles of anomalous Hall conductivity σji and transverse thermoelectric
conductivity αji in revealing the topological character of band structure.
Finally, from the viewpoint of application for thermoelectric power generation, ANE could
be useful as it facilitates the fabrication of a module structurally much simpler than the conven-
tional one using the Seebeck effect6. The orthogonal orientation of the voltage output to the thermal
heat flow (Fig. 1a) enables a lateral series connection of a single kind of ferromagnet with alter-
nating magnetization direction (Fig. 1a inset). This simplifies a thermopile structure to efficiently
cover the surface of a heat source (Fig. 1a inset), in comparison with the conventional thermo-
electric module using the Seebeck effect, which consists of a pillar structure of alternating P- and
N-type semiconductors. To increase power density, a thermopile should ideally cover the entire
surface of a heat source, and therefore, a micro-fabricated thermopile array has to be arranged as
densely as possible. However, as long as a ferromagnet is used, their inherent stray fields may
perturb magnetization direction of neighboring modules, and limit the integration density.
Our discovery of a new class of material that produces almost no stray fields but exhibits
a large ANE is highly important for the application toward thermoelectric power generation, and
it should allow us to design a thermopile with a much denser integration of thermoelectric mod-
ules to efficiently cover a heat source than the ferromagnetic counterparts. While the observed
values in this work would be still far from the size necessary for application, our study indicates
that the magnetic Weyl metals such as Mn3Sn would be particularly useful to obtain a large ANE
8
by enhancing the Berry curvature at EF. Further studies to develop the technology for applica-
tion such as thin film growth and coercivity control of such magnets will be important to build a
thermoelectric power generator.
9
Figure 1 Thermoelectric module using anomalous Nernst effect, and crystal and magnetic
structures of Mn3Sn. a, Schematic illustration of a thermoelectric module based on the
anomalous Nernst effect. The anomalous Nernst electric field E appears in the direction
of the outer product of the magnetization M and heat current Q ∼ −∇T , and thus can
be described as E = Qsµ0M × −∇T , where Qs is the anomalous Nernst coefficient
and µ0 is vacuum permeability. For the case of Mn3Sn, the configuration of the sublattice
moments is schematically presented. Inset: Schematic illustration of a thermopile made
of an array of magnetic modules. The in-plane magnetization directions of neighboring
thermoelectric modules are alternated so that the Nernst signal with the same sign can
be added up in series. The heat flows along the direction perpendicular to the basal plane
of the heat source. b, An individual ab-plane of Mn3Sn. Spheres represent Mn (purple)
and Sn (gray) atoms. In addition to the unit cell frame, Mn atoms are connected by lines
to illustrate that they form a breathing type of kagome lattice (alternating array of small
and large triangles). Mn moments (arrow) form an inverse triangular spin structure.
Figure 2 Magnetic field dependence of the anomalous Hall effect in Mn3Sn. a & b, Field
dependence of the Hall resistivity ρH = −ρzx of a, Sample 1 (Mn3.06Sn0.94), and b, Sam-
ple 2 (Mn3.09Sn0.91), obtained at 100 K, and 300 K. c & d, Field dependence of the Hall
conductivity σH = −σzx of c, Sample 1 and d, Sample 2 obtained at 100 K, and 300 K.
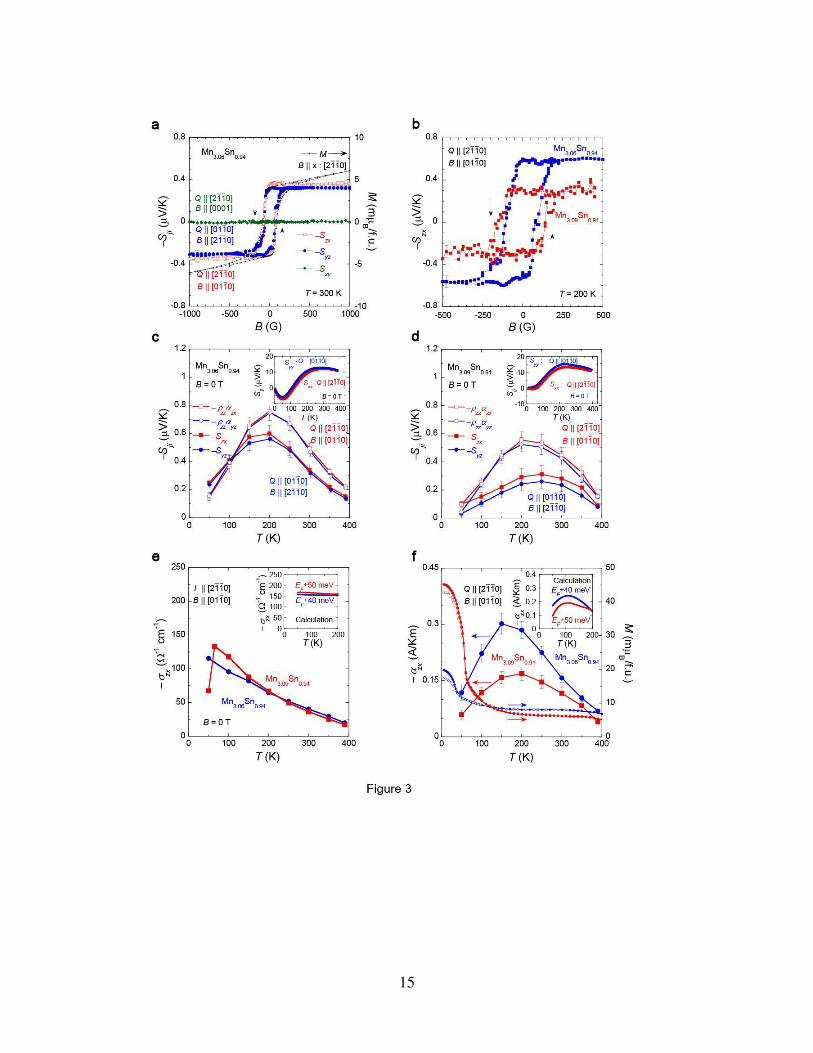
Figure 3 Anomalous Nernst effect in Mn3Sn. a, Anisotropic field dependence of the
Nernst signal −Sji of Sample 1. For comparison, the field dependence of the magnetiza-
tion M (right axis) for B ‖ x is shown. b, −Szx vs. B of Samples 1 & 2 measured at various
10

temperatures. Here, Samples 1 & 2 refer to crystals with Mn3.06Sn0.94, and Mn3.09Sn0.91,
respectively. c & d, T dependence of the zero-field remnant Nernst signal Sji (solid sym-
bol) obtained by the field sweep measurements of c, Sample 1 and d, Sample 2. The
thermoelectric contribution estimated using the relation, ρjjαji = Sji − Sii(ρji/ρii), is also
shown (open symbol). Insets: Seebeck coefficients Sxx, Syy vs. T measured under zero
field for c, Sample 1 and d, Sample 2. e, Hall conductivity −σzx vs. T estimated using the
relation σzx = −ρzx/(ρxxρzz). The sudden drop in −σzx for Sample 2 is due to the magnetic
transition at ∼ 60 K (see f). Inset: −σzx vs. T for E −EF = +40 (blue) and +50 (red) meV
obtained by the first-principles calculation. f, Transverse thermoelectric conductivity −αzx
vs. T (left axis), estimated using the relation, αzx = (Szx/ρzz) + σzxSxx for the field sweep
results (solid circle). For comparison, the T dependences of M (right axis) obtained in
B = 1000 G ‖ y using a field-cooling (FC, solid symbols) and zero-field-cooling (ZFC,
open symbols) sequences are shown. The FC and ZFC results bifurcate at ∼ 50 (60) K
for Sample 1 (2) due to the magnetic transition. Inset: −αzx vs. T for E−EF = +40 (blue)
and +50 (red) meV obtained by the first-principles calculation. The error-bars are shown
if they are larger than the symbol sizes and indicate the measurement errors that come
from the uncertainties of their geometrical factors (Methods).
Figure 4 Magnetization dependence of the spontaneous Nernst effect for ferromagnetic
metals and Mn3Sn. Full logarithmic plot of the anomalous Nernst signal |Sji| vs. the
magnetization M for a variety of ferromagnetic metals and Mn3Sn measured at various
temperatures and fields (Methods). It shows the general trend for ferromagnets that |Sji|
increases with M . The shaded region indicates the linear relation |Sji| = |Qs|µ0M , with
11
|Qs| ranging from ∼ 0.05 µV/KT to ∼ 1 µV/KT. The Nernst signal data points for Sample
1 (Mn3.06Sn0.94) obtained at various temperatures for B ‖ [0110] (blue closed circle) and
for Sample 2 (Mn3.09Sn0.91) for B ‖ [0110] (green closed circle) do not follow the relation,
and reach almost the same value as the largest among ferromagnetic metals with three
orders of magnitude smaller M .
12

13

14
15

16

Methods Polycrystalline samples were made by melting the mixtures of manganese and tin in an
alumina crucible sealed in an evacuated quartz ampoule in a box furnace at 1050 C for 6 hours.
In preparation for single crystal growth, the obtained polycrystalline materials were crushed into
powders, compacted into pellets, and inserted into an alumina crucible which was subsequently
sealed in an evacuated silica ampoule. Single crystal growth was performed using a single-zone
Bridgman furnace with a maximum temperature of 1080 C and growth speed of 1.5 mm/h. Anal-
ysis using an inductively coupled plasma (ICP) spectroscopy showed that the composition of the
single crystal is Mn3.06Sn0.94 for Sample 1 and Mn3.09Sn0.91 for Sample 2. Powder X-ray diffrac-
tion measurement was performed using diffractometer (RAPID, Rigaku) with a rotating stage in
order to remove preferred orientation in the data. One dimensional intensity pattern was extracted
from two-dimensional Debye-Scherrer rings which were obtained using transmission mode. Ri-
etveld analysis were performed using RIETAN-FP. All the samples were shown to be single phase,
with lattice parameters consistent with previous work (see Supplementary Information and Table
S1&S2). After the alignment made using Laue diffractometer, the as-grown single crystals were
cut into bar-shaped samples by spark machining for transport and magnetization measurements.
The magnetization measurements were done using a commercial SQUID magnetometer
(MPMS, Quantum Design). The associated measurement error is less than a few %. The specific
heat measurement was performed using a commercial system (PPMS, Quantum Design) under
zero magnetic field (Supplementary Information). Both longitudinal and Hall resistivities were
measured by a standard four-probe method using a commercial system (PPMS, Quantum Design).
Electrical contacts were made by spot-welding gold wires for the longitudinal and transverse volt-
age probes, both of which were placed ∼ 1.5 mm apart on the sample with a typical current cross
17

section area of ∼ 0.20 mm2. In addition, thermoelectric properties were jointly measured by the
one-heater and two-thermometer configuration using a commercial system (PPMS, Quantum De-
sign). For thermoelectric measurements, the samples have the typical dimension of ∼ 10 × 2 × 2
mm3 for Sample 1 (Mn3.06Sn0.94) and ∼ 5× 1.5× 1.5 mm3 for Sample 2 (Mn3.09Sn0.91). The ther-
mal gradient −∇T was applied by a heater at one end of the bar-shaped sample toward a thermal
bath at the other end, and was measured by monitoring two thermometers linked to the sample by
strips of ∼ 0.5 mm-wide copper-gold plates along the longest direction of the sample. The dis-
tance between the two thermometers are approximately ∼ 5 mm for Sample 1 and ∼ 2.5 mm for
Sample 2. The magnitude of the transverse voltage ∆V was found to be linearly increasing with
the increase of applied temperature difference ∆T . Here, ∆T was typically set to be 1.5 % ∼ 2.0
% of the sample temperature for both Seebeck and Nernst measurements. By setting the tempera-
ture gradient −∇T along a bar-shaped single crystal (x-axis), the thermoelectric longitudinal and
transverse emf voltages Vi and Vj were measured in an open circuit condition. The Seebeck coef-
ficient Sii and Nernst signal Sji were then estimated as Sii = Ei/∇T and Sji = Ej/∇T , where
Ei and Ej are the longitudinal and transverse electric field. The magnetic field dependence of the
Hall resistivity and the Nernst signal was obtained after removing the longitudinal component of
the respective transport properties, which is found to be approximately constant as a function of
the magnetic field (Supplementary Information).
The measurement errors for the longitudinal resistivity ρii, Hall resistivity ρji, and Nernst
signal Sji, are dominated by the uncertainties of their respective geometrical factors. The uncer-
tainty of the longitudinal resistivity and Hall resistivity is 1-2% and smaller than the symbol sizes
used in Figures in the main text and Supplementary Information. The uncertainty in the Nernst
18

signal Sji is ∼ 10% for Sample 1 and ∼ 20% for Sample 2. The corresponding error-bars for the
Nernst signal and the transverse thermoelectric conductivity are given in Fig. 3 and Fig. S2.
The transverse thermoelectric conductivity αzx was calculated using the Berry curvature
formula8 with the first-principles electronic structure. The density functional theory calculation
was performed within the generalized-gradient approximation34 as implemented in the quantum-
ESPRESSO package35. A 7×7×7 k-point grid, ultrasoft pseudopotentials36 and plane wave basis
sets with cutoff energies of 80 Ry for wave functions and 320 Ry for charge densities were used.
For the Berry curvature calculation, a Wannier-interpolated band structure37 with 40×40×40 k-
point grid was employed.
The specimens for transmission electron microscope were prepared by Ar ion milling using
a JEOL Ion-Slicer operated at 5.5 kV and 150 µA under a low beam angle of 2.5. Selected area
electron diffraction and high resolution lattice images were obtained using a transmission electron
microscope (JEOL JEM-2010F) operated at 200 kV. High resolution lattice images were simulated
by MacTempas software.
Figure 4 was made using the ANE results obtained for various ferromagnets well below their
Curie temperatures, as reported in literature including L10-FePt (300 K)7, L10-FePd (300 K)7,
L10-MnGa (300 K)7, D022-Mn2Ga (300 K)7, Co/Ni films (300 K)7, Nd2Mo2O7 (T < Tc = 73
K, B = 1 T ‖ [111])31, Fe (300 K) 38, Co (300 K)38, Fe3O4 (300 K, B < 0.8 T)39, MnGe (140
K, B > 2 T)40, MnGe (100 K, B > 5 T)40, MnGe (20 K, B < 14 T)40, and Pt/Fe Multilayer
N = 1 ∼ 9 (300 K, B < 5 T)41.
19

1. Smith, A. W. The Transverse Thermomagnetic Effect in Nickel and Cobalt. Phys. Rev. (Series
I) 33, 295–306 (1911).
2. Kondorskii, E. I. & Vasileva, R. Degree of Localization of Magnetic Electron and the Nernst-
Ettingshausen Effect in Ferromagnetic Metals. Sov. Phys. JEPT 18, 277–278 (1964).
3. Lee, W.-L., Watauchi, S., Miller, V. L., Cava, R. J. & Ong, N. P. Anomalous Hall Heat Current
and Nernst Effect in the CuCr2Se4−xBrx Ferromagnet. Phys. Rev. Lett. 93, 226601 (2004).
4. Miyasato, T. et al. Crossover Behavior of the Anomalous Hall effect and Anomalous Nernst
Effect in Itinerant Ferromagnets. Phys. Rev. Lett. 99, 086602 (2007).
5. Pu, Y., Chiba, D., Matsukura, F., Ohno, H. & Shi, J. Mott Relation for Anomalous Hall and
Nernst Effects in Ga1−xMnxAs Ferromagnetic Semiconductors. Phys. Rev. Lett. 101, 117208
(2008).
6. Sakuraba, Y. et al. Anomalous Nernst effect in L10-FePt/MnGa Thermopiles for New Ther-
moelectric Applications. Appl. Phys. Express 6, 033003 (2013).
7. Hasegawa, K. et al. Material dependence of anomalous Nernst effect in perpendicularly mag-
netized ordered-alloy thin films. Appl. Phys. Lett. 106, 252405 (2015).
8. Xiao, D., Yao, Y., Fang, Z. & Niu, Q. Berry-phase Effect in Anomalous Thermoelectric
Transport. Phys. Rev. Lett. 97, 026603 (2006).
9. Xiao, D., Chang, M.-C. & Niu, Q. Berry phase effects on electronic properties. Rev. Mod.
Phys. 82, 1959–2007 (2010).
20

10. Nakatsuji, S., Kiyohara, N. & Higo, T. Large anomalous Hall effect in a non-collinear antifer-
romagnet at room temperature. Nature 527, 212–215 (2015).
11. Yang, H. et al. Topological Weyl semimetals in the chiral antiferromagnetic materials Mn3Ge
and Mn3Sn. New J. Phys. 19, 015008 (2017).
12. Bauer, G. E. W., Saitoh, E. & van Wees, B. J. Spin caloritronics. Nat. Mater. 11, 391–399
(2012).
13. Uchida, K. et al. Observation of the spin Seebeck effect. Nature 455, 778–781 (2008).
14. Slachter, A., Bakker, F. L., Adam, J.-P. & van Wees, B. J. Thermally driven spin injection
from a ferromagnet into a non-magnetic metal. Nat. Phys. 6, 879–882 (2010).
15. Huang, S. Y., Wang, W. G., Lee, S. F., Kwo, J. & Chien, C. L. Intrinsic Spin-Dependent
Thermal Transport. Phys. Rev. Lett. 107, 216604 (2011).
16. Nagaosa, N., Sinova, J., Onoda, S., MacDonald, A. H. & Ong, N. P. Anomalous Hall effect.
Rev. Mod. Phys. 82, 1539–1592 (2010).
17. Bruno, P. The Berry Phase in Magnetism and the Anomalous Hall Effect. In Kronmuller,
H. & Parkins, S. (eds.) Handbook of Magnetism and Advanced Magnetic Materials, vol. 1,
chap. 22, 540–558 (John Wiley and Sons, Ltd, 2007).
18. Shindou, R. & Nagaosa, N. Orbital ferromagnetism and anomalous Hall effect in antiferro-
magnets on the distorted fcc lattice. Phys. Rev. Lett. 87, 116801 (2001).
21
19. Machida, Y., Nakatsuji, S., Onoda, S., Tayama, T. & Sakakibara, T. Time-reversal symmetry
breaking and spontaneous Hall effect without magnetic dipole order. Nature 463, 210–213
(2010).
20. Chen, H., Niu, Q. & MacDonald, A. H. Anomalous Hall Effect Arising from Noncollinear
Antiferromagnetism. Phys. Rev. Lett. 112, 017205 (2014).
21. Kubler, J. & Felser, C. Non-collinear antiferromagnets and the anomalous Hall effect. EPL
108, 67001 (2014).
22. Kiyohara, N., Tomita, T. & Nakatsuji, S. Giant anomalous hall effect in the
chiral antiferromagnet mn3Ge. Phys. Rev. Applied 5, 064009 (2016). URL
https://link.aps.org/doi/10.1103/PhysRevApplied.5.064009.
23. Nayak, A. K. et al. Large anomalous Hall effect driven by a nonvanishing Berry curvature in
the noncolinear antiferromagnet Mn3Ge. Sci. Adv. 2, e1501870 (2016).
24. Kren, E., Paitz, J., Zimmer, G. & Zsoldos, E. Study of the magnetic phase transformation in
the Mn3Sn phase. Physica B 80, 226–230 (1975).
25. Tomiyoshi, S. & Yamaguchi, Y. Magnetic structure and weak ferromagnetism of Mn3Sn
studied by polarized neutron diffraction. J. Phys. Soc. Jpn. 51, 2478–2486 (1982).
26. Brown, P. J., Nunez, V., Tasset, F., Forsyth, J. B. & Radhakrishna, P. Determination of the
magnetic structure of Mn3Sn using generalized neutron polarization analysis. J. Phys. Con-
dens. Matter. 2, 9409–9422 (1990).
22
27. Nagamiya, T., , S. & Yamaguchi, Y. Triangular spin configuration and weak ferromagnetism
of Mn3Sn and Mn3Ge. Solid State Commun. 42, 385–388 (1982).
28. Tomiyoshi, S., Abe, S., Yamaguchi, Y., Yamauchi, H. & Yamamoto, H. Triangular spin struc-
ture and weak ferromagnetism of Mn3Sn at low temperature. J. Magn. Magn. Mater. 54–57,
Part 2, 1001–1002 (1986).
29. Feng, W. J. et al. Glassy ferromagnetism in Ni3Sn-type Mn3.1Sn0.9. Phys. Rev. B 73, 205105
(2006).
30. Ohmori, H., Tomiyoshi, S., Yamauchi, H. & Yamamoto, H. Spin structure and weak ferro-
magnetism of Mn3Sn. J. Magn. Magn. Mater. 70, 249–251 (1987).
31. Hanasaki, N. et al. Anomalous Nernst Effects in Pyrochlore Molybdates with Spin Chirality.
Phys. Rev. Lett. 100, 106601 (2008).
32. Suzuki, M.-T., Koretsune, T., Ochi, M. & Arita, R. Cluster multipole theory for anomalous
Hall effect in antiferromagnets. Phys. Rev. B 95, 094406 (2017).
33. Sharma, G., Goswami, P. & Tewari, S. Nernst and magnetothermal conductivity in a lattice
model of Weyl fermions. Phys. Rev. B 93, 035116 (2016).
34. Perdew, J., Burke, K. & Ernzerhof, M. Generalized gradient approximation made simple.
Phys. Rev. Lett 77, 3865 (1996).
35. Giannozzi, P. et al. Quantum espresso: a modular and open-source software project for quan-
tum simulations of materials. J. Phys: Condens. Matter 21, 395502 (2009).
23
36. Vanderbilt, D. Soft self-consistent pseudopotentials in a generalized eigenvalue formalism.
Phys. Rev. B 41, 7892 (1990).
37. Mostofi, A. A. et al. wannier90: A tool for obtaining maximally-localised Wannier functions.
Comput Phys. Comm. 178, 685–699 (2008).
38. Weischenberg, J., Freimuth, F., Blugel, S. & Mokrousov, Y. Scattering-independent anomalous
Nernst effect in ferromagnets. Phys. Rev. B 87, 060406 (2013).
39. Ramos, R. et al. Anomalous Nernst effect of Fe3O4 single crystal. Phys. Rev. B 90, 054422
(2014).
40. Shiomi, Y., Kanazawa, N., Shibata, K., Onose, Y. & Tokura, Y. Topological Nernst effect in a
three-dimensional skyrmion-lattice phase. Phys. Rev. B 88, 064409 (2013).
41. Uchida, K. et al. Enhancement of anomalous Nernst effects in metallic multilayers free from
proximity-induced magnetism. Phys. Rev. B 92, 094414 (2015).
42. Ziman, J. M. Electrons and phonons: the theory of transport phenomena in solids (Oxford
University Press, 1960).
43. Izumi, F. & Momma, K. Three-dimensional visualization in powder diffraction. In Solid State
Phenomena, vol. 130, 15–20 (Trans Tech Publ, 2007).
44. Tomiyoshi, S. Polarized neutron diffraction study of the spin structure of Mn3Sn. J. Phys. Soc.
Jpn. 51, 803–810 (1982).
45. Duan, T. et al. Magnetic anisotropy of single-crystalline Mn3Sn in triangular and helix-phase
states. App. Phys Lett 107, 082403 (2015).
24
46. Cable, J. W., Wakabayashi, N. & Radhakrishna, P. Magnetic excitations in the triangular
antiferromagnets Mn3Sn and Mn3Ge. Phys. Rev. B 48, 6159–6166 (1993).
47. Tomiyoshi, S., Abe, S., Yamaguchi, Y., Yamauchi, H. & Yamamoto, H. Triangular spin struc-
ture and weak ferromagnetism of Mn3Sn at low temperature. J. Magn. Magn. Mater. 54,
1001–1002 (1986).
Acknowledgements We thank Agung Nugroho, Akito Sakai, Tomoya Higo, Naoki Kiyohara for useful
discussions. This work is partially supported by CREST and PRESTO, Japan Science and Technology
Agency, and Grants-in-Aid for Scientific Research (16H02209), and Program for Advancing Strategic In-
ternational Networks to Accelerate the Circulation of Talented Researchers (No. R2604) from the Japanese
Society for the Promotion of Science, and by Grants-in-Aids for Scientific Research on Innovative Areas
(15H05882, 15H05883, 26103002) of the Ministry of Education, Culture, Sports, Science, and Technology
of Japan. The use of the facilities of the Materials Design and Characterization Laboratory at the Institute
for Solid State Physics, The University of Tokyo, is gratefully acknowledged.
Author Contributions S.N. and Y.O. conceived the project. S.N. planned the experiments, and T.T., M.I.,
S.N. performed experiments and analyzed data. T.K., M.S., R.A. performed the first-principles calculations.
D.N performed the TEM measurements and analyses. S.N., R.A. wrote the main text. M.I., S.N., T.T., D.N,
T.K., M.S., R.A. prepared the supplementary information and figures; All authors discussed the results and
commented on the manuscript.
Competing Interests The authors declare that they have no competing financial interests.
Correspondence Correspondence and requests for materials should be addressed to S.N.
(email: [email protected]).
25

Data Availability Statement The data that support the plots within this paper and other findings of this
study are available from the corresponding author upon reasonable request
26
Supplementary Information:
Observation of large anomalous Nernst effect at room tempera-
ture in a chiral antiferromagnet
Muhammad Ikhlas1∗, Takahiro Tomita1∗, Takashi Koretsune2,3, Michi-To Suzuki2, Daisuke
Nishio-Hamane1, Ryotaro Arita2,4, Yoshichika Otani1,2,4, Satoru Nakatsuji1,4
1Institute for Solid State Physics, University of Tokyo, Kashiwa 277-8581, Japan
2RIKEN-CEMS, 2-1 Hirosawa, Wako 351-0198, Japan
3PRESTO, Japan Science and Technology Agency (JST), 4-1-8 Honcho Kawaguchi, Saitama 332-
0012, Japan.
4CREST, Japan Science and Technology Agency (JST), 4-1-8 Honcho Kawaguchi, Saitama 332-
0012, Japan.
1 Expression of the Hall conductivity σji and transverse thermoelectric conductivity αji
To compare the experimental results with first-principle calculation, we used the following expres-
sion for the Hall conductivity σji and transverse thermoelectric conductivity αji, which take into
account the anisotropy of the longitudinal resistivity ρii,
σji ≈ −ρji
ρiiρjj, (1)
αji ≈1
ρjj(Sji −
ρjiρii
Sii) (2)
∗These two authors contributed equally.
27

Here, (i, j) = (x, y), (y, z), and (z, x), where x, y, and z are taken to be the coordinates along
[2110], [0110], and [0001], respectively 22. In our transport measurements, the applied current I
(heat current Q = −∇T ) is defined to be parallel to the i-axis. The longitudinal resistivity ρii
(Seebeck coefficient Sii) is then measured using contacts placed along the i-axis while the Hall
resistivity ρji (Nernst signal Sji) is measured using contacts located along the j-axis. Using this
definition, the sign of the Hall and the Nernst effect is determined by the right-hand rule.
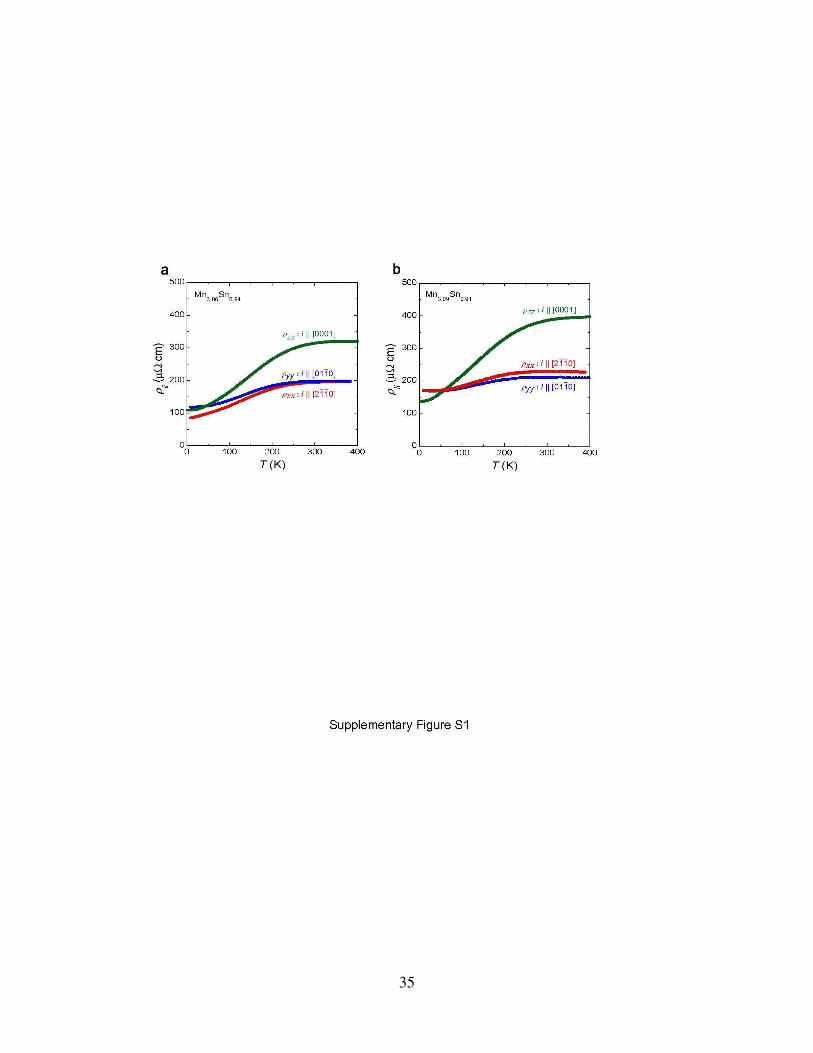
2 Temperature dependence of the longitudinal resistivity
The temperature dependence of the longitudinal resistivity for Sample 1 (Mn3.06Sn0.94) and Sam-
ple 2 (Mn3.09Sn0.91) single crystals used is given in Figure S1. Both Samples 1&2 show similar
behaviour, i.e the in-plane resistivity is almost isotropic, while the out-of-plane resistivity shows a
much stronger temperature dependence than the in-plane resistivity. The residual resistivity ratio
(RRR = ρ (390 K) / ρ (4.2 K)) which is a rough measure of the quality of the single crystals shows
the value of RRR ∼ 1.5 – 2.3 for Sample 1 and RRR ∼ 1.2 – 1.35 for Sample 2 in the in-plane
direction, and ∼ 3.5 for Sample 1 and ∼ 2.8 for Sample 2 in the out-of-plane direction. This is con-
sistent with the smaller coercivity observed in the Sample 1 crystals compared to Sample 2, as the
coercivity in magnets generally increases with the number of defects and impurities, which may
pin a magnetic domain wall. All the components of the longitudinal resistivity have continuous
temperature change and nearly saturate above room temperature.
28
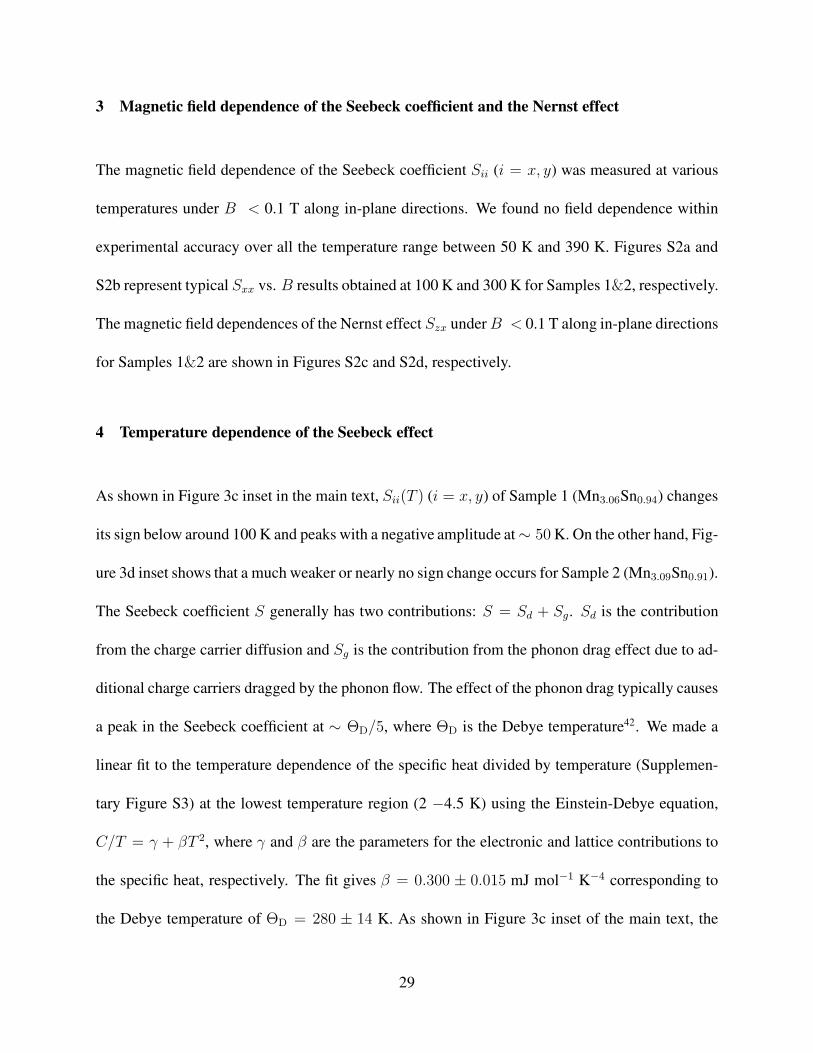
3 Magnetic field dependence of the Seebeck coefficient and the Nernst effect
The magnetic field dependence of the Seebeck coefficient Sii (i = x, y) was measured at various
temperatures under B < 0.1 T along in-plane directions. We found no field dependence within
experimental accuracy over all the temperature range between 50 K and 390 K. Figures S2a and
S2b represent typical Sxx vs. B results obtained at 100 K and 300 K for Samples 1&2, respectively.
The magnetic field dependences of the Nernst effect Szx under B < 0.1 T along in-plane directions
for Samples 1&2 are shown in Figures S2c and S2d, respectively.
4 Temperature dependence of the Seebeck effect
As shown in Figure 3c inset in the main text, Sii(T ) (i = x, y) of Sample 1 (Mn3.06Sn0.94) changes
its sign below around 100 K and peaks with a negative amplitude at ∼ 50 K. On the other hand, Fig-
ure 3d inset shows that a much weaker or nearly no sign change occurs for Sample 2 (Mn3.09Sn0.91).
The Seebeck coefficient S generally has two contributions: S = Sd + Sg. Sd is the contribution
from the charge carrier diffusion and Sg is the contribution from the phonon drag effect due to ad-
ditional charge carriers dragged by the phonon flow. The effect of the phonon drag typically causes
a peak in the Seebeck coefficient at ∼ ΘD/5, where ΘD is the Debye temperature42. We made a
linear fit to the temperature dependence of the specific heat divided by temperature (Supplemen-
tary Figure S3) at the lowest temperature region (2 −4.5 K) using the Einstein-Debye equation,
C/T = γ + βT 2, where γ and β are the parameters for the electronic and lattice contributions to
the specific heat, respectively. The fit gives β = 0.300 ± 0.015 mJ mol−1 K−4 corresponding to
the Debye temperature of ΘD = 280 ± 14 K. As shown in Figure 3c inset of the main text, the
29

minimum of the Seebeck coefficient is roughly located around ΘD/5 = 56 K, suggesting that the
low temperature behaviour may be related to the phonon drag effect. The nearly no sign change in
Sample 2 may be related to a larger amount of defects caused by doping, which reduces the phonon
lifetime. However, further discussion on the temperature dependence of the Seebeck effect is be-
yond the scope of this paper, since the multiband nature of this system11 would necessitate more
involved analysis. On the other hand, the observed Nernst effect is dominated by the anomalous
(spontaneous) contribution and thus transverse thermoelectric conductivity αji mainly comes from
the Berry curvature. Therefore, the contribution from phonon drag in αji is negligible.
5 Crystal structure of Mn3Sn
RAPID (Rigaku) X-ray diffractometer (MoKα, λ = 0.7103 A) was used at room temperature
to investigate the crystal structure of Mn3Sn. Two-dimensional Debye-Scherrer rings were ob-
tained by the X-ray intensity transmitted through the sample, which were then converted to one-
dimensional intensity patterns. The diffraction patterns were analyzed using the Rietveld analysis
program RIETAN-FP to determine the precise crystal structure 43 . We assign a hexagonal struc-
ture (P63/mmc) with the lattice parameters a =5.662 A and c =4.529 A44. Figure S5 shows
the typical result of the X-ray powder pattern obtained for Sample 1 (Mn3.06Sn0.94). The atomic
coordinates for the crystal parameter are shown in Table S1 for Sample 1 (Mn3.06Sn0.94) and Table
S2 for Sample 2 (Mn3.09Sn0.91). Our results indicate that the samples used in our study have the
same crystal structure as those used for previous neutron diffraction measurements26, 44 .
30

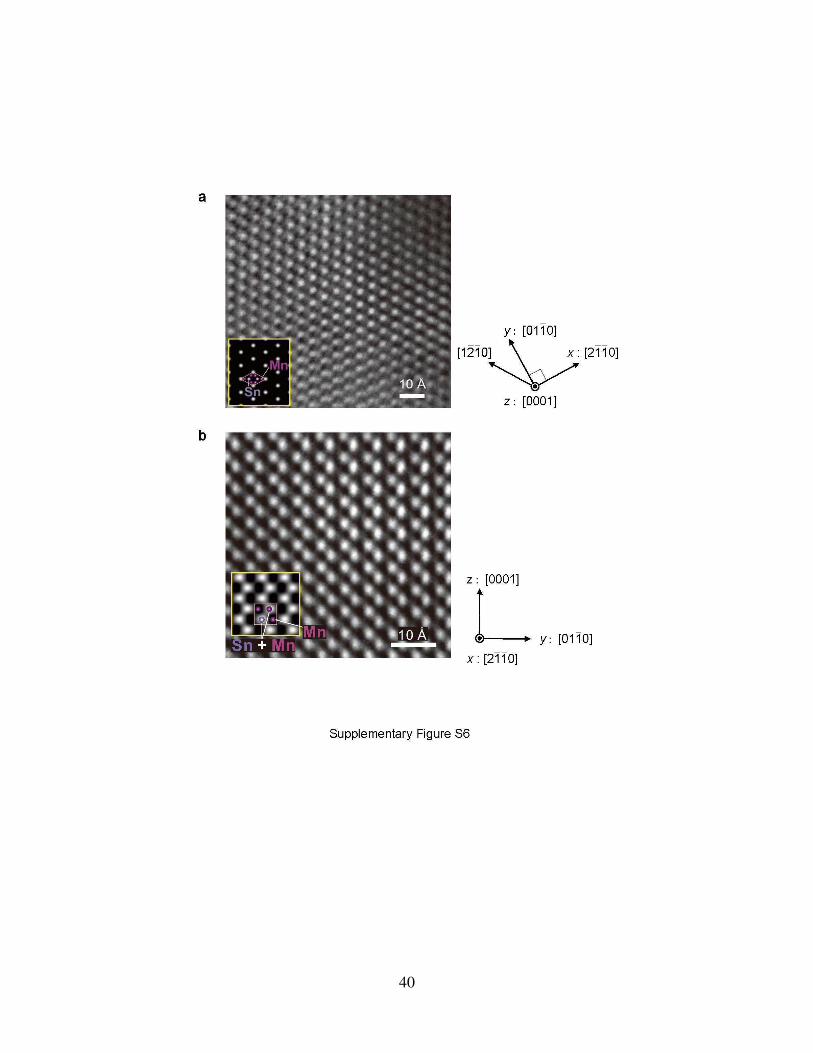
6 High-resolution transmission electron microscope (TEM) image of Mn3Sn
Figures S6a and S6b show the high resolution TEM image of Mn3Sn (using Sample 1 as a rep-
resentative) taken at room temperature for the (0001) and (2110) planes, respectively. Within the
resolution permitted by the maximum operating voltage (200 kV) of the transmission electron mi-
croscope (JEOL JEM-2010F), the lattice parameters a and c obtained from the image are in good
agreement with the results of our Rietveld analyses discussed above. The overlayed simulation
images show the expected position of the Mn and Sn atoms within the lattice.
7 Heat treatment effect on the temperature dependence of the magnetization
A recent paper reported the magnetization curves for Mn3Sn at different temperatures and found
that the in-plane coercive field disappears along with the spontaneous magnetization as the sample
is cooled down below 270 K45. In contrast to the temperature dependence of the magnetization of
our crystal, an additional transition is observed below 270 K in both their magnetization and heat
capacity data. They associated this with a transition from the triangular spin structure to a long-
period helical spin configuration, which has been observed in earlier neutron scattering studies46.
It has been known that this transition is observed most pronouncedly in single crystals that were
annealed at temperatures below 800C?. Their single crystals were synthesized by slow-cooling
the melt from 1000C to 600C, and thus a part of this slow-cooling process may play a role of
the annealing procedure mentioned above. The mechanism behind this transition is still unknown.
On the other hand, the single crystal used in our present paper was prepared from the Bridgman
furnace without any additional annealing process, and thus exhibit no transition above 50 K47.
31

8 Relation between the anomalous Nernst effect and the anomalous Hall conductivity
Both the intrinsic anomalous Hall conductivity σzx and the intrinsic anomalous transverse thermo-
electric conductivity αzx are governed by the Berry curvature, Ωn(k), as8
σzx = −e2
h
∫
dk
(2π)3Ωn,y(k)fnk, (3)
αzx = −e
T h
∫ dk
(2π)3Ωn,y(k)
(εnk − µ)fnk + kBT ln[
1 + e−β(εnk−µ)]
. (4)
Here, εnk, fnk are the band energy and the Fermi-Dirac distribution function with the band index n
and the wave vector k. Since
(εnk − µ)fnk + kBT ln[
1 + e−β(εnk−µ)]
is finite only around the
Fermi energy, αzx is determined by the Berry curvature around the Fermi energy whereas σzx is
the summation of all the Berry curvature below the Fermi energy. According to these equations,
αzx and σzx are related as follows:
αzx = −1
e
∫
dε∂f
∂µσzx(ε)
ε− µ
T. (5)
Thus, the size and the sign of αzx are determined by the slope of σzx(ε) as well as the Berry
curvature around the Fermi energy. Indeed, at low temperatures, Eq.(5) can be approximated as
αzx =π2k2
BT
3|e|∂σzx(ε)
∂ε+O(T 3). (6)
Supplementary Figure S4 indicates the calculated result of the energy dependence of the anoma-
lous Hall and transverse thermoelectric conductivity. According to the result, a slight shift of the
Fermi energy leads to a change in the anomalous Hall conductivity. For example, at ε = 0.04 eV,
−∂σzx/∂ε ∼ 1000 (Ωcm)−1(eV)−1. This means that −αzx ∼ 0.0024T (A/Km) at low tempera-
ture limit, which is consistent with the value of −αzx = 0.25 (A/Km) at T = 100 K in the inset of
Fig. 3f.
32

In our first-principles calculation for Mn3Sn, the number of the Mn-s, Mn-d, Sn-s, Sn-p
electrons are estimated to be 0.84, 5.85, 1.67, and 3.26, respectively. For Mn3.06Sn0.94, we can
assume that the electron occupancy of the Sn-s, Sn-p and Mn-s orbital are the same as those of
Mn3Sn, since the low-energy states around the Fermi level are mainly formed by the Mn-d orbital.
Then the number of electrons doped into the Mn-d orbital is estimated to be 0.024, which shifts
the Fermi energy by 0.04 eV for Mn3.06Sn0.94. With a similar calculation, the shift of the Fermi
energy is estimated to be 0.05 eV for Mn3.09Sn0.91.
In experiment, a small change in the composition in the crystals used in the present study,
namely Mn3.06Sn0.94 and Mn3.09Sn0.91, may cause such a shift in EF. Although the Hall conduc-
tivity between the two crystals are almost the same at high temperatures, the difference between
the Hall conductivity of the two crystals becomes apparent at low temperatures, as shown in Fig.
3e in the main text. At 100 K, Sample 2 (Mn3.09Sn0.91) shows larger anomalous Hall conductiv-
ity (lower anomalous transverse thermoelectric conductivity) than Sample 1 (Mn3.06Sn0.94), which
semi-quantitatively agrees with first principle-calculation shown in Figure S4. Further investiga-
tion is necessary to make a more thorough, quantitative comparison between experiment and theory
using samples with a variety of doping levels, and this defines a subject of future study.
The DFT calculation does not take account of the temperature dependence of the local mag-
netic moment size. Generally, the states further apart from the Fermi energy are more affected by
the change in the moment size. Thus, in comparison with the transverse thermoelectric conductiv-
ity, the theoretical estimate for the Hall conductivity is expected to have the larger deviation from
experiment. This is because according to Eqs. (3) & (4), the Hall effect is the sum of Berry curva-
33
ture of all occupied bands, while the transverse thermoelectric conductivity only derives from the
low energy states around EF . In fact, we found that the disagreement between the theoretical and
experimental values of the Hall conductivity is larger than the one for the transverse thermoelectric
conductivity (Fig. 3 in the main text).
34
35

36

37

38

39
40
Supplementary Figure S1. Temperature dependences of the longitudinal resistivity in Mn3Sn
Temperature dependence of the longitudinal resistivity ρii(T ) (i = x (red), y (blue), and z
(green)) of a, Sample 1 (Mn3.06Sn0.94) and b, Sample 2 (Mn3.09Sn0.91) measured at zero field.
Supplementary Figure S2. Magnetic field dependences of the Seebeck coefficient and Nernst
effect in Mn3Sn
a, Field dependence of the Seebeck coefficient Sii (i = x, y) at 100 K and 300 K for Sample
1 (Mn3.06Sn0.94). b, Field dependence of the Seebeck coefficient Sii (i = x, y) at 100 K and
300 K for Sample 2 (Mn3.09Sn0.91). c, Field dependence of the Nernst effect −Szx of Sample
1 (Mn3.06Sn0.94) at 350 K, 300 K, 200 K, and 50 K. d, Field dependence of the Nernst effect
−Szx of Sample 2 (Mn3.09Sn0.91) at 300 K and 200 K. The error-bars are shown if they
are larger than the symbol sizes and indicate the measurement errors that come from the
uncertainties of their geometrical factors (Methods)
Supplementary Figure S3. Temperature dependence of the specific heat in Mn3Sn
Specific heat of Sample 1 (Mn3.06Sn0.94) single crystal measured in zero magnetic field di-
vided by temperature C/T (red circle), plotted vs. T 2. The blue solid line indicates a linear
fit at the low temperature region, 2 ≤ T ≤ 4.5 K, to estimate γ and β in the Einstein-Debye
equation C/T = γ + βT 2. The fit gives the values γ = 22.7 ± 0.2 mJ mol−1 K−2 and
β = 0.300± 0.015 mJ mol−1 K−4.
Supplementary Figure S4. Energy dependence of the anomalous Hall conductivity and anoma-
lous transverse thermoelectric conductivity
Energy dependence of a, the anomalous Hall conductivity −σzx, and b, the anomalous trans-
41
verse thermoelectric conductivity −αzx at T = 100 K obtained by the first-principles calcu-
lation. EF stands for the Fermi energy for the stoichiometric Mn3Sn.
Supplementary Figure S5. X-ray diffraction pattern for Mn3Sn
Room temperature X-ray diffraction (XRD) patterns of Sample 1 Mn3.06Sn0.94. The crosses
correspond to experimental data and the solid line (red) is for the Rietveld refinement fit.
Vertical bars (green) below the curves indicate the peak positions of Mn3Sn phase. The
lower curve (blue) is the difference between the observed and calculated at each step.
Supplementary Figure S6. Transmission electron microscope image
Bright field high resolution lattice image projected from a, [0001] and b, [2110] directions,
compared with simulation image.
42

Table 1: Crystal structure parameters refined by Rietveld analysis for Mn3+0.06Sn1−0.06 (Sample
1) with P63/mmc structure at 300 K. The lattice parameters and the atomic positions of the Mn
site are determined by the analysis, which is made using the X-ray diffraction spectra with MoKα
radiation (λ = 0.7103 A). The final R indicators are RWP=5.29, Re=9.45, and S=0.560 43.
Mn3+0.06Sn1−0.06 V = 125.747(8) A3
parameters (A) a = 5.6624(2) b = 5.6624(2) c = 4.5286(2)
Atom Wyckoff position x y z Occupancy
Mn 6h 0.8388(2) 0.6777(3) 1/4 1
Sn/Mn 2c 1/3 2/3 1/4 (0.94/0.06)
Table 2: Crystal structure parameters refined by Rietveld analysis for Mn3+0.09Sn1−0.09 (Sample
2) with P63/mmc structure at 300 K. The lattice parameters and the atomic positions of the Mn
site are determined by the analysis, which is made using the X-ray diffraction spectra with MoKα
radiation (λ = 0.7103 A). The final R indicators are RWP= 4.35, Re=13.0, and S=0.334 43.
Mn3+0.09Sn1−0.09 125.623(9) A3
parameters (A) a = 5.6587(2) b = 5.6587(2) c = 4.5300(2)
Atom Wyckoff position x y z Occupancy
Mn 6h 0.8402(2) 0.6803(3) 1/4 1
Sn/Mn 2c 1/3 2/3 1/4 (0.91/0.09)
43