“large and complex organizations are a tangible manifestation of advanced technology ......
TRANSCRIPT

University of Pisa
MSc in Computer Engineering
Business Processes Management
“Large and complex organizations are a tangible manifestation of advanced technology, more than machinery itself.” (J.K. Galbraith)
Lectures
Mario G. Cimino, Department of Information Engineering, Center for Logistics Systems
Pisa, March-May 2013, Monday 15.30-18.30, Room: ADInform1

Cimino – Modeling and Simulation of Business Processes using BPMN 2.0 – Lecture 1 – 2 of 15
Course Schedule and Materials
� The course will take about 30 hours in total:
2/3 of the time (March-April) for learning notation and tools (in parallel)
1/3 of the time (May) for working on the group project
� Materials:
http://www.iet.unipi.it/m.cimino/bpm
user: business
password: pr0cess (note: 0 is a zero)
� References:
OMG BPMN 2.0 Specification:
http://www.omg.org/spec/BPMN/2.0/PDF/
http://www.omg.org/spec/BPMN/2.0/examples/PDF
T. Allweyer, Introduction to the Standard for Business Process Modeling
2009, http://bpmn-introduction.com
Logizian 10.x Simulacian, a business workflow design and simulation
tool, http://www.visual-paradigm.com/product/lz/
Cimino – Modeling and Simulation of Business Processes using BPMN 2.0 – Lecture 1 – 3 of 15
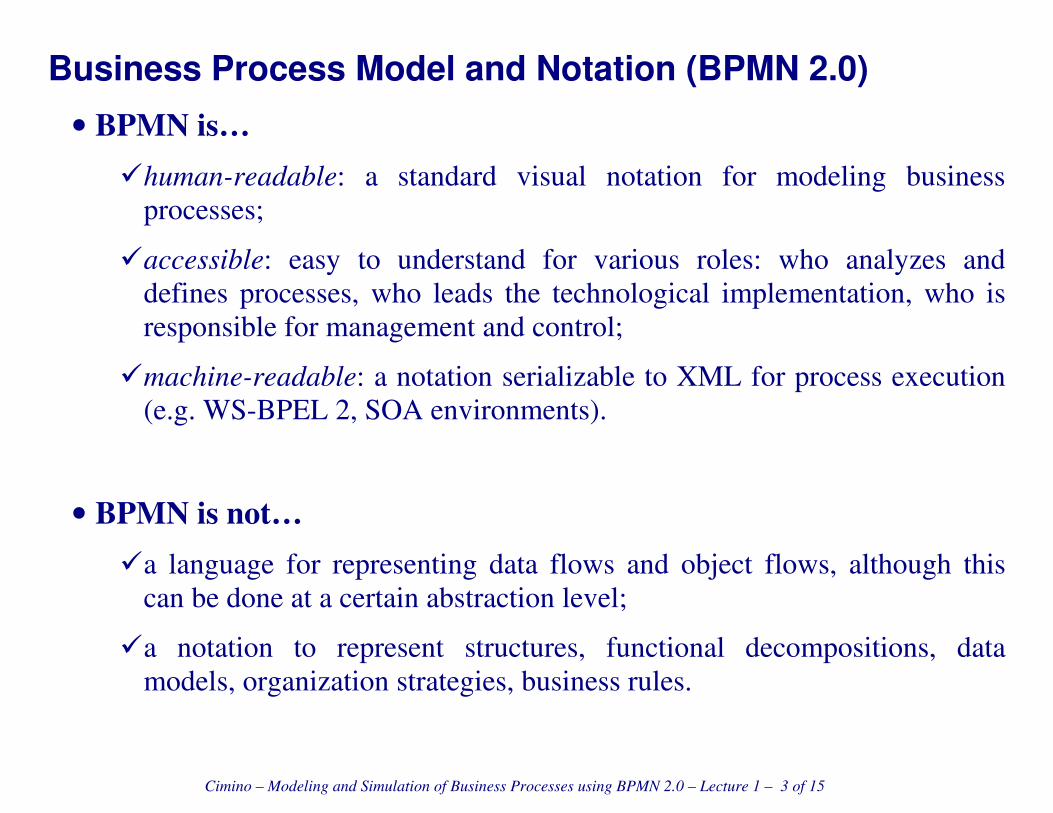
Business Process Model and Notation (BPMN 2.0)
• BPMN is…
� human-readable: a standard visual notation for modeling business
processes;
� accessible: easy to understand for various roles: who analyzes and
defines processes, who leads the technological implementation, who is
responsible for management and control;
� machine-readable: a notation serializable to XML for process execution
(e.g. WS-BPEL 2, SOA environments).
• BPMN is not…
� a language for representing data flows and object flows, although this
can be done at a certain abstraction level;
� a notation to represent structures, functional decompositions, data
models, organization strategies, business rules.

Cimino – Modeling and Simulation of Business Processes using BPMN 2.0 – Lecture 1 – 4 of 15
• “Relatives” of BPMN (languages for worlfkow-based analysis)
� Petri Nets (1962): formal language to model distributed systems, usable
by computer scientist and designers of specialized software. It consists of
a visual representation and a corresponding mathematical notation
(graphs), which allow advanced analyses such as validation, verification
(e.g.. soundness to identify deadlock, livelock, ...)
� UML Activity Diagram (OMG, 1997): language for visual modeling for
the object-oriented paradigm, usable by software engineers. The extended
UML of Eriksson e Penker (2000) is suitable for business process
modeling, and usable also by business level (non-technical) roles.

Cimino – Modeling and Simulation of Business Processes using BPMN 2.0 – Lecture 1 – 5 of 15
Generic example of a process diagram, with UML extension of Eriksson-Penker
e.g. drilling
process of a
metal plate
Cimino – Modeling and Simulation of Business Processes using BPMN 2.0 – Lecture 1 – 6 of 15
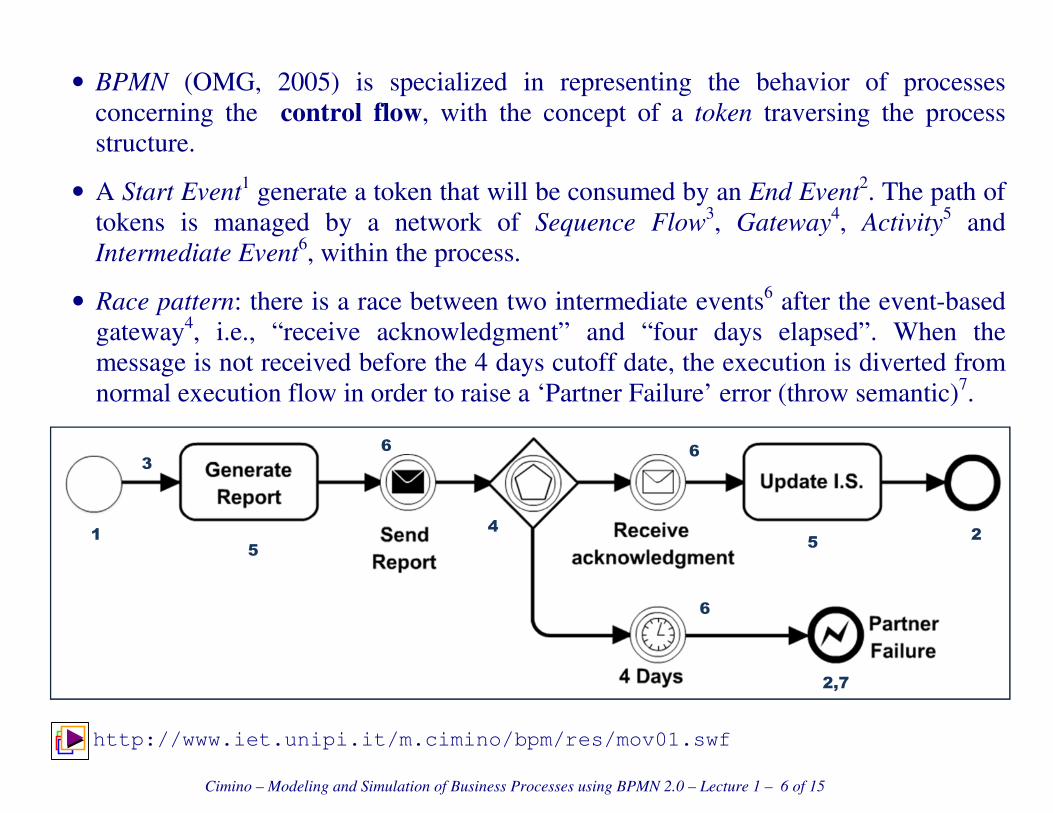
• BPMN (OMG, 2005) is specialized in representing the behavior of processes
concerning the control flow, with the concept of a token traversing the process
structure.
• A Start Event1 generate a token that will be consumed by an End Event
2. The path of
tokens is managed by a network of Sequence Flow3, Gateway
4, Activity5 and
Intermediate Event6, within the process.
• Race pattern: there is a race between two intermediate events6 after the event-based
gateway4, i.e., “receive acknowledgment” and “four days elapsed”. When the
message is not received before the 4 days cutoff date, the execution is diverted from
normal execution flow in order to raise a ‘Partner Failure’ error (throw semantic)7.
http://www.iet.unipi.it/m.cimino/bpm/res/mov01.swf
3
1 2 4
5
6
6
6
2,7
5

Cimino – Modeling and Simulation of Business Processes using BPMN 2.0 – Lecture 1 – 7 of 15
• Interruption pattern: the previous model is reused and embedded as the ‘Reporting’
sub-process (expanded notation)1. An intermediate event (‘catch’ semantic) has been
added to the boundary of that sub-process. The model contains also a collapsed sub-
process (details are not visible), denoted by a “plus” sign4.
• The ’Partner failure’ event (‘catch’ semantic) gets activated when the execution
points reaches the ‘Reporting’ sub-process2, and gets un-activated when the
‘Reporting’ sub-process completes successfully (i.e., an end event is reached).
http://www.iet.unipi.it/m.cimino/bpm/res/mov02.swf
1
2
3
4

Cimino – Modeling and Simulation of Business Processes using BPMN 2.0 – Lecture 1 – 8 of 15
• Note how the partner failure event (‘send’ semantic) raised by the reporting sub-
process is caught by the ‘Partner failure’ event3 (‘receive’ semantic) and how the
execution flow get diverted from that point.
• Note that if a sub-process of a diagram is expanded in the diagram, the elements
inside the sub-process cannot be connected to elements outside the sub-process.
• BPMN allows the structured modeling of processes, i.e., views at different levels of
abstraction: from the level “0” (the least amount of detail) the processes are
decomposed into sub-processes, up to activities (that are atomic, the most amount of
detail). For instance, in the IMB methodology the analysis stops at the level “3”.
http://www.iet.unipi.it/m.cimino/bpm/res/mov03.swf

Cimino – Modeling and Simulation of Business Processes using BPMN 2.0 – Lecture 1 – 9 of 15
• At the level 0 process is a high-level not executable process, i.e., which has been
modeled for the purpose of documenting process behavior at a modeler-defined level
of detail. Thus, information needed for execution, such as formal condition
expressions are typically not included. In contrast, an executable process is modeled
for the purpose of being executed (e.g. a WS-BPEL process).
• BPMN allows process segmentation, at a given level, to create different modular
segments. For instance, in the IBM methodology it is recommended that the
maximum number of process activities per page should be six.
• The off-page connector, generally used for printing, is an object showing where a
Sequence Flow leaves one page and then restarts on the next page. A Link
Intermediate Event with throw1 and catch2 semantic can be used as an Off-Page
Connector. In figure, the flow of the exclusive gateway3 labeled with “No” leads to
come back, and then to a cycle.
1 2
3

Cimino – Modeling and Simulation of Business Processes using BPMN 2.0 – Lecture 1 – 10 of 15
• As a result of a ‘Sequential Loop’ marker1 on the Sub-Process, the sub-process will
be instantiated several times sequentially. As a result of a Parallel Loop’ marker2 on
the Sub-Process, the sub-process will be instantiated several times in parallel.
• The number of loops to execute might be: (i) defined at design time, (ii) affected at
runtime from some process data, (iii) computed at runtime.
http://www.iet.unipi.it/m.cimino/bpm/res/mov04.swf
http://www.iet.unipi.it/m.cimino/bpm/res/mov05.swf
1
2

Cimino – Modeling and Simulation of Business Processes using BPMN 2.0 – Lecture 1 – 11 of 15
• Gateways are decisions points used to constrain the execution flow, fork an
execution point into several or merge several into one. A gateway is represented by a
diamond and the kind of a gateway is specified by a marker.
• An exclusive gateway can be used as a decision point1 where several outgoing
sequence flows are possible. Such flows are all constrained by a condition allowing
only one of them to be used by a token. Such a condition will be evaluated based on
the process data. The gateway can be also used as a way to merge2 several sequence
flows into one. The incoming token moves straight through the gateway and goes on.
http://www.iet.unipi.it/m.cimino/bpm/res/mov06.swf
1 2
Cimino – Modeling and Simulation of Business Processes using BPMN 2.0 – Lecture 1 – 12 of 15
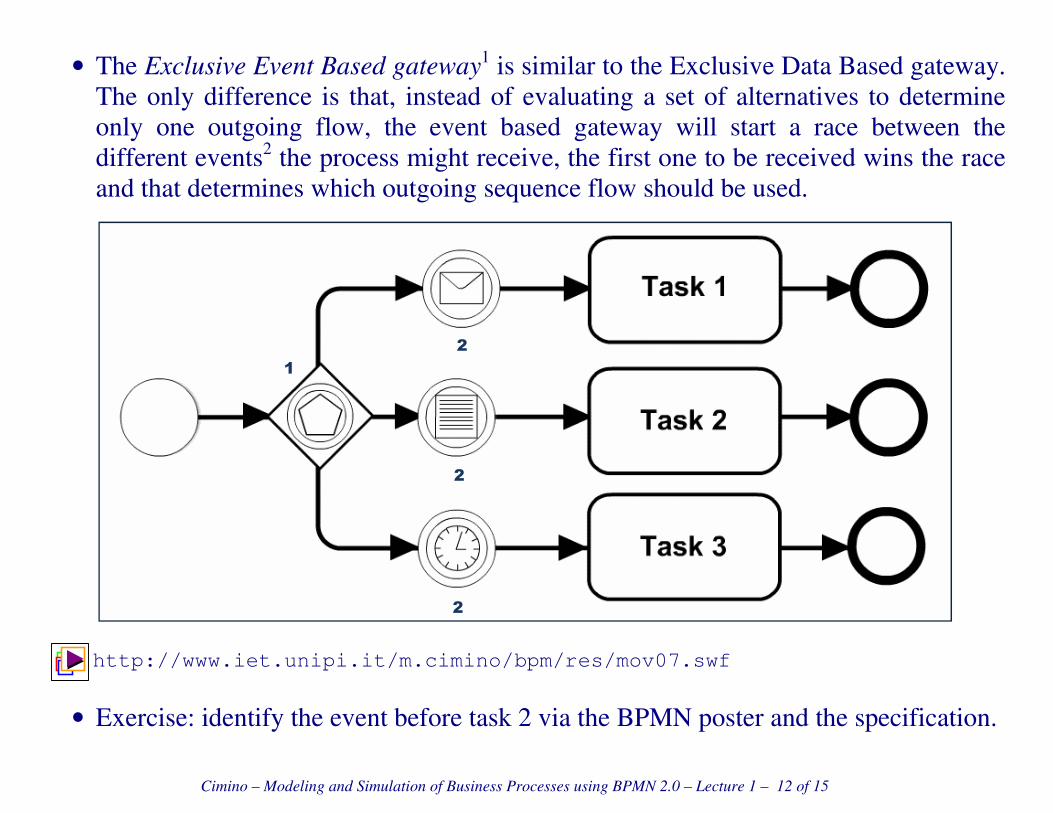
• The Exclusive Event Based gateway1 is similar to the Exclusive Data Based gateway.
The only difference is that, instead of evaluating a set of alternatives to determine
only one outgoing flow, the event based gateway will start a race between the
different events2 the process might receive, the first one to be received wins the race
and that determines which outgoing sequence flow should be used.
http://www.iet.unipi.it/m.cimino/bpm/res/mov07.swf
• Exercise: identify the event before task 2 via the BPMN poster and the specification.
1
2
2
2
Cimino – Modeling and Simulation of Business Processes using BPMN 2.0 – Lecture 1 – 13 of 15
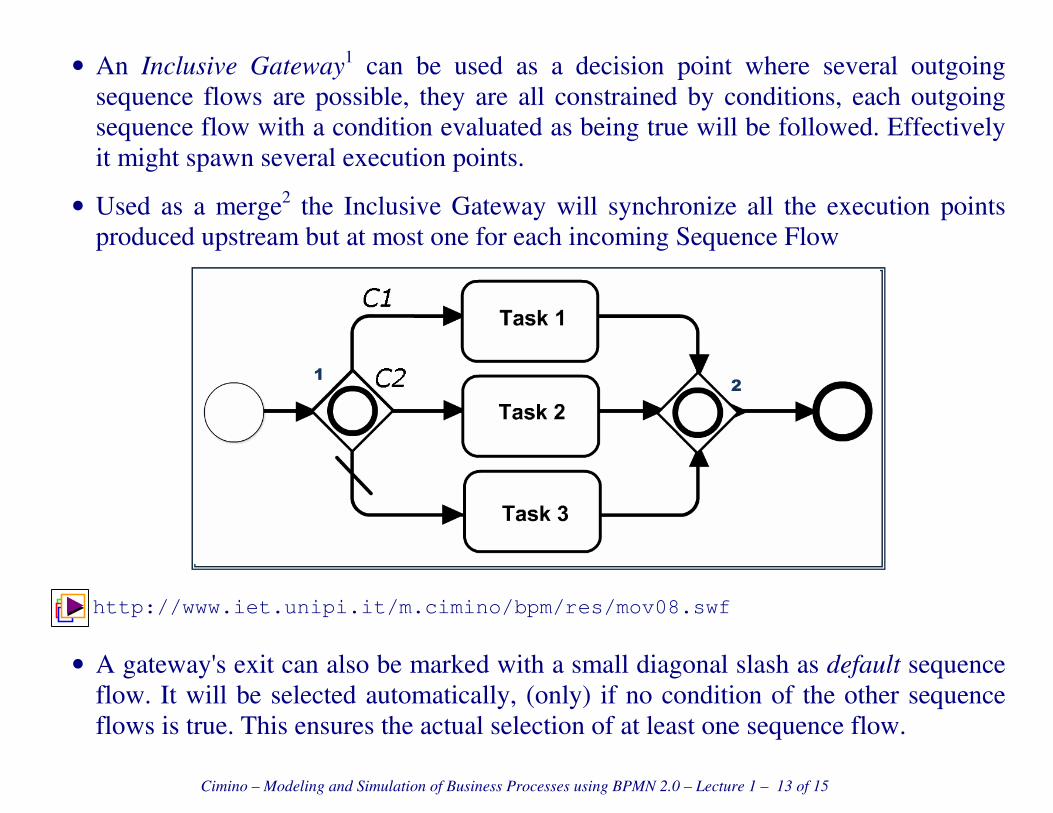
• An Inclusive Gateway1 can be used as a decision point where several outgoing
sequence flows are possible, they are all constrained by conditions, each outgoing
sequence flow with a condition evaluated as being true will be followed. Effectively
it might spawn several execution points.
• Used as a merge2 the Inclusive Gateway will synchronize all the execution points
produced upstream but at most one for each incoming Sequence Flow
http://www.iet.unipi.it/m.cimino/bpm/res/mov08.swf
• A gateway's exit can also be marked with a small diagonal slash as default sequence
flow. It will be selected automatically, (only) if no condition of the other sequence
flows is true. This ensures the actual selection of at least one sequence flow.
1 2

Cimino – Modeling and Simulation of Business Processes using BPMN 2.0 – Lecture 1 – 14 of 15
• A Parallel Gateway1 provides a mechanism to fork and synchronize flows. There are
no conditions associated to this gateway.
http://www.iet.unipi.it/m.cimino/bpm/res/mov09.swf
1 2
Cimino – Modeling and Simulation of Business Processes using BPMN 2.0 – Lecture 1 – 15 of 15
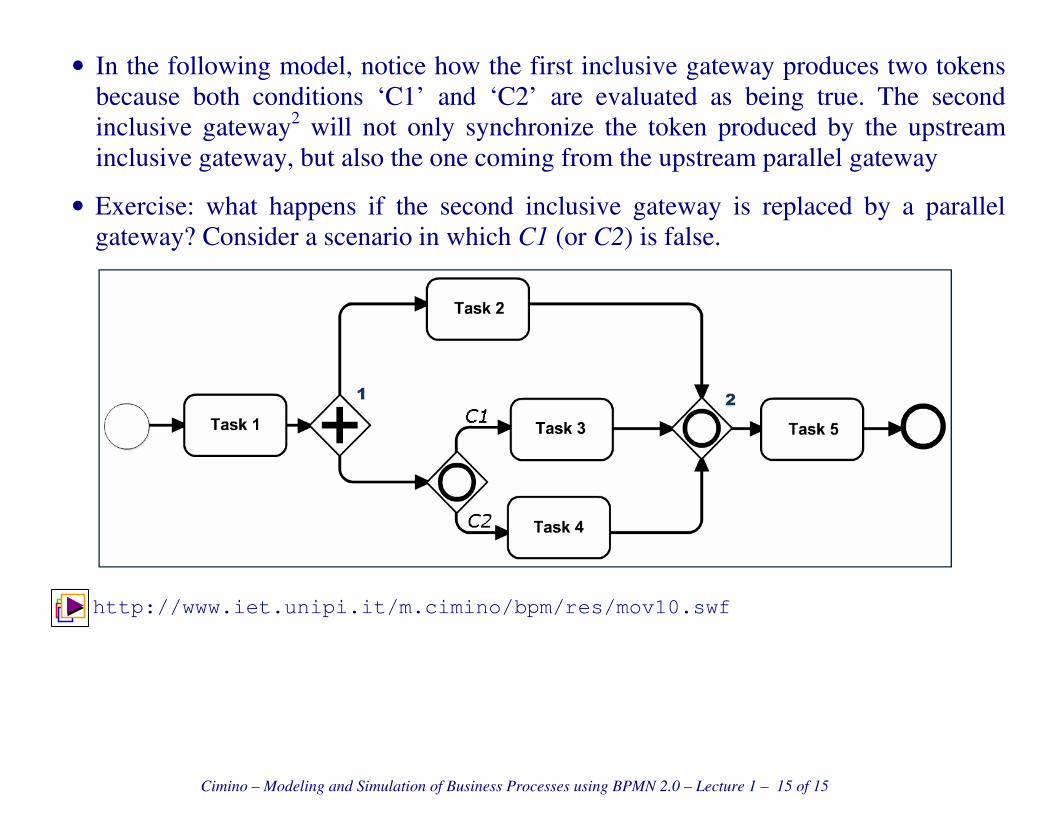
• In the following model, notice how the first inclusive gateway produces two tokens
because both conditions ‘C1’ and ‘C2’ are evaluated as being true. The second
inclusive gateway2 will not only synchronize the token produced by the upstream
inclusive gateway, but also the one coming from the upstream parallel gateway
• Exercise: what happens if the second inclusive gateway is replaced by a parallel
gateway? Consider a scenario in which C1 (or C2) is false.
http://www.iet.unipi.it/m.cimino/bpm/res/mov10.swf
1 2
Cimino – Modeling and Simulation of Business Processes using BPMN 2.0 – Lecture 2 – 16 of 31
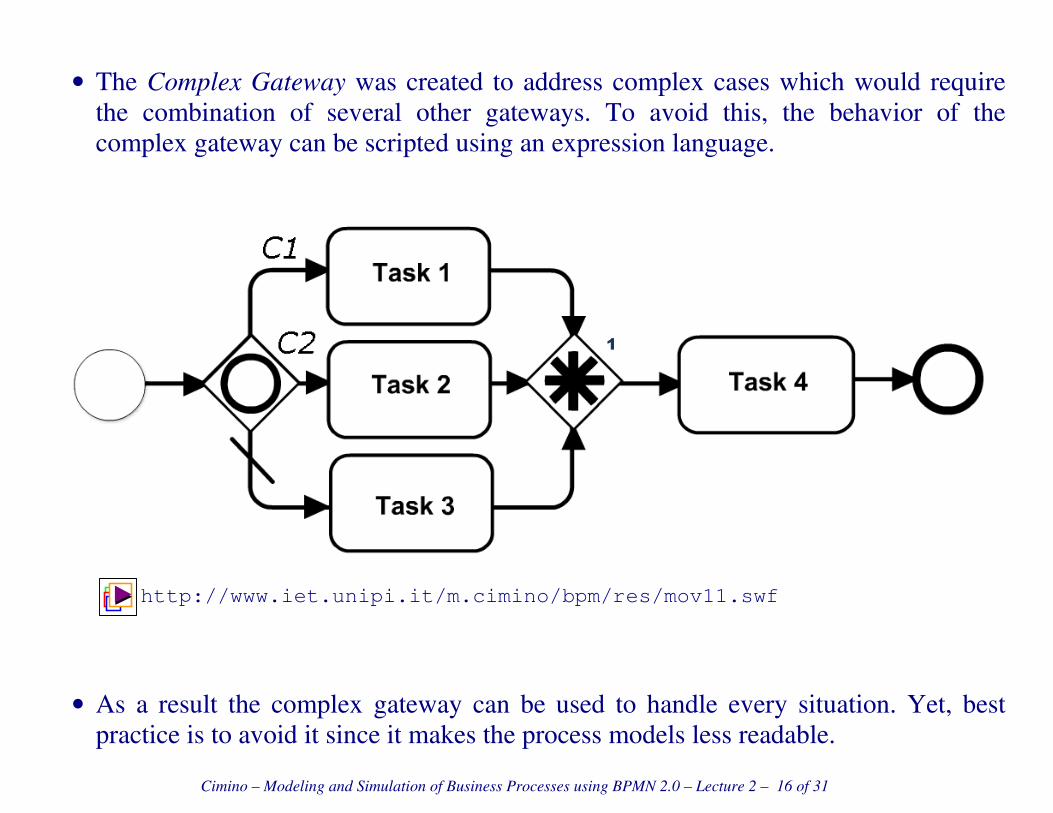
• The Complex Gateway was created to address complex cases which would require
the combination of several other gateways. To avoid this, the behavior of the
complex gateway can be scripted using an expression language.
http://www.iet.unipi.it/m.cimino/bpm/res/mov11.swf
• As a result the complex gateway can be used to handle every situation. Yet, best
practice is to avoid it since it makes the process models less readable.
1
Cimino – Modeling and Simulation of Business Processes using BPMN 2.0 – Lecture 2 – 17 of 31
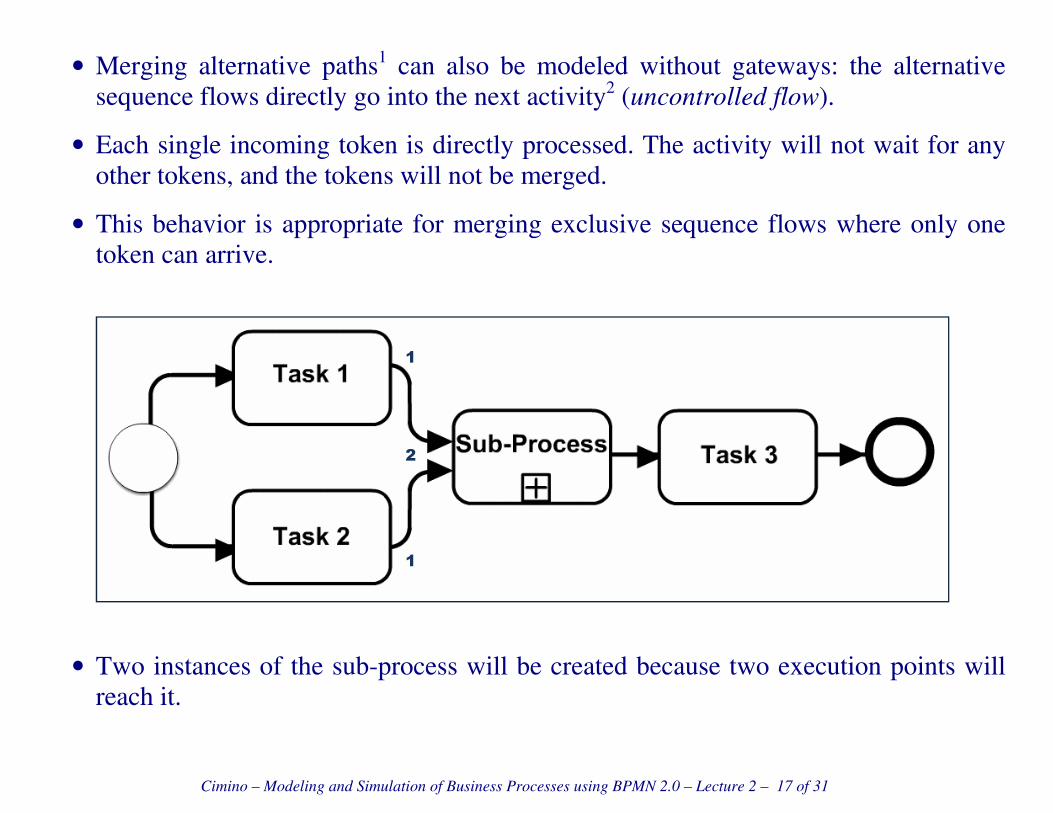
• Merging alternative paths1 can also be modeled without gateways: the alternative
sequence flows directly go into the next activity2 (uncontrolled flow).
• Each single incoming token is directly processed. The activity will not wait for any
other tokens, and the tokens will not be merged.
• This behavior is appropriate for merging exclusive sequence flows where only one
token can arrive.
• Two instances of the sub-process will be created because two execution points will
reach it.
1
2
1

Cimino – Modeling and Simulation of Business Processes using BPMN 2.0 – Lecture 2 – 18 of 31
• Notice how the sub-process can be expanded and how the two incoming flows can
point to different start events.
http://www.iet.unipi.it/m.cimino/gpa/res/movie/mov12.swf
• Modeling with (+) or without (–) gateways?
+ it is not possible to model entirely without gateways
+ gateways are more expressive and, sometimes, necessary
– if gateways are omitted as far as possible, more compact models can be created
– gateways with several inputs and several outputs may cause misunderstanding
1
1

Cimino – Modeling and Simulation of Business Processes using BPMN 2.0 – Lecture 2 – 19 of 31
• Swimlanes are used to organize activities and depict collaboration between partners.
A business process is then organized inside a pool of swimlanes (business units).
• Private business processes are those internal to a specific organization, i.e. contained
in a pool, which does not interact with external pools (orchestration). A
collaboration is a synchronized interaction of more processes without a central
control (choreography), via public processes and message flows1 (white dashed
arrow) between pools (a).
• Control flow between pools (b) and message flow within a pool (c) are forbidden
1
Cimino – Modeling and Simulation of Business Processes using BPMN 2.0 – Lecture 2 – 20 of 31
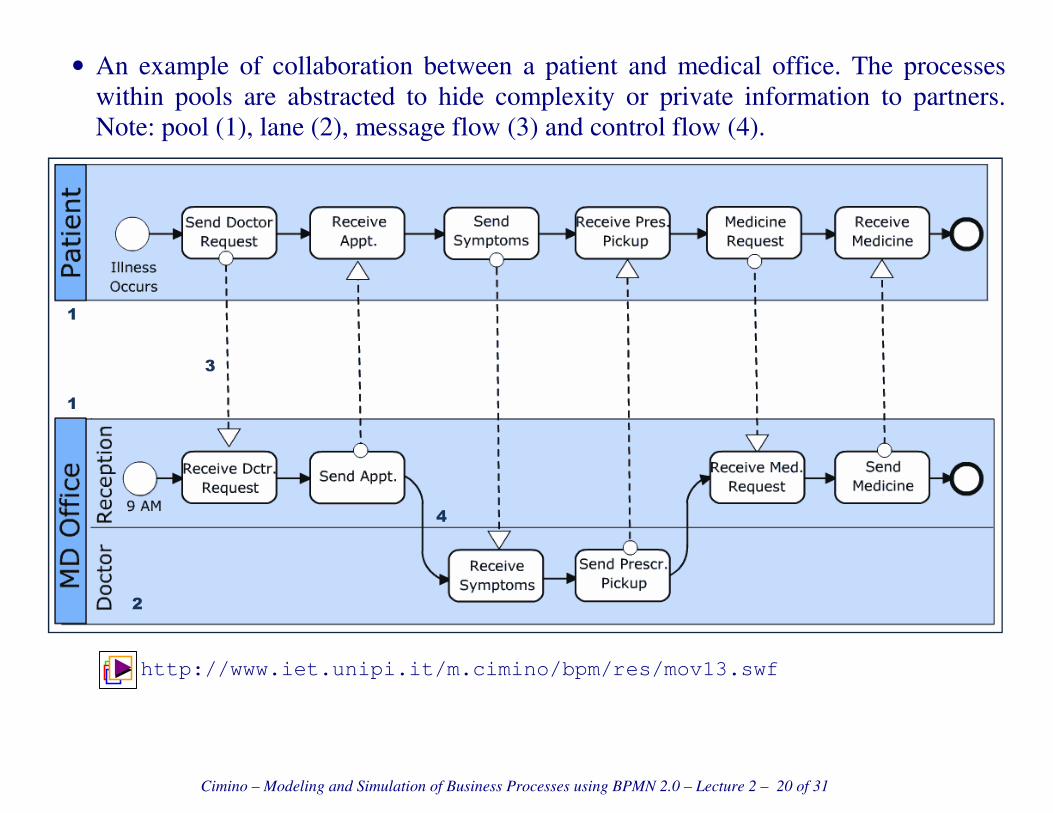
• An example of collaboration between a patient and medical office. The processes
within pools are abstracted to hide complexity or private information to partners.
Note: pool (1), lane (2), message flow (3) and control flow (4).
http://www.iet.unipi.it/m.cimino/bpm/res/mov13.swf
1
1
2
3
4
Cimino – Modeling and Simulation of Business Processes using BPMN 2.0 – Lecture 2 – 21 of 31
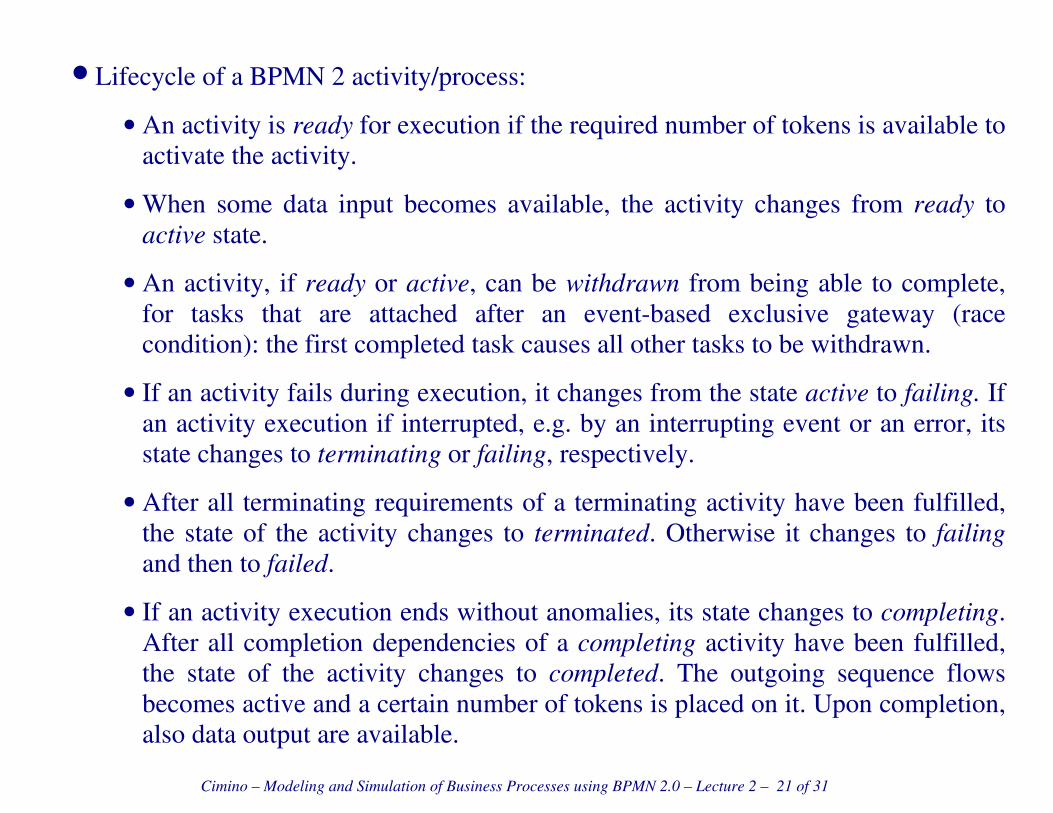
• Lifecycle of a BPMN 2 activity/process:
• An activity is ready for execution if the required number of tokens is available to
activate the activity.
• When some data input becomes available, the activity changes from ready to
active state.
• An activity, if ready or active, can be withdrawn from being able to complete,
for tasks that are attached after an event-based exclusive gateway (race
condition): the first completed task causes all other tasks to be withdrawn.
• If an activity fails during execution, it changes from the state active to failing. If
an activity execution if interrupted, e.g. by an interrupting event or an error, its
state changes to terminating or failing, respectively.
• After all terminating requirements of a terminating activity have been fulfilled,
the state of the activity changes to terminated. Otherwise it changes to failing
and then to failed.
• If an activity execution ends without anomalies, its state changes to completing.
After all completion dependencies of a completing activity have been fulfilled,
the state of the activity changes to completed. The outgoing sequence flows
becomes active and a certain number of tokens is placed on it. Upon completion,
also data output are available.

Cimino – Modeling and Simulation of Business Processes using BPMN 2.0 – Lecture 2 – 22 of 31
• Only completed activities can change their state to compensating until either
compensation finishes successfully (state compensated), an exception occurs
(state failed), or termination is triggered (state terminated).
• An UML state diagram
Cimino – Modeling and Simulation of Business Processes using BPMN 2.0 – Lecture 2 – 23 of 31
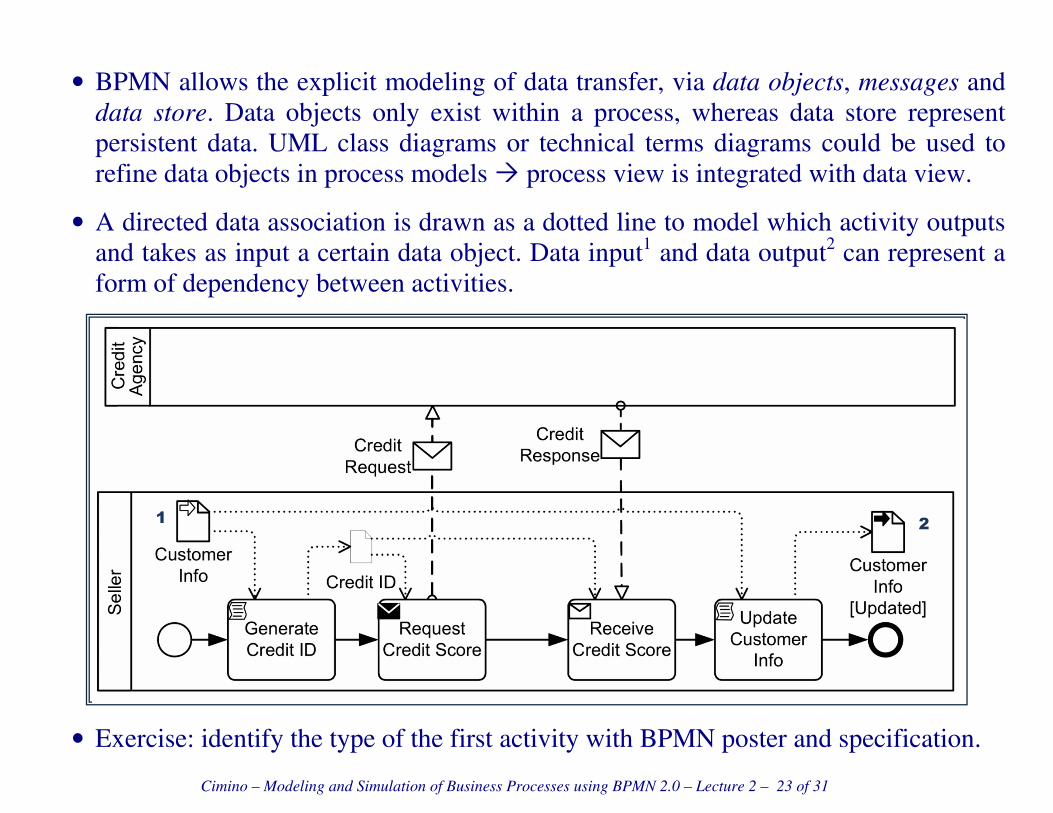
• BPMN allows the explicit modeling of data transfer, via data objects, messages and
data store. Data objects only exist within a process, whereas data store represent
persistent data. UML class diagrams or technical terms diagrams could be used to
refine data objects in process models � process view is integrated with data view.
• A directed data association is drawn as a dotted line to model which activity outputs
and takes as input a certain data object. Data input1 and data output2 can represent a
form of dependency between activities.
• Exercise: identify the type of the first activity with BPMN poster and specification.
1 2

Cimino – Modeling and Simulation of Business Processes using BPMN 2.0 – Lecture 2 – 24 of 31
• Types of tasks and icons
� a service task is an automated function;
� a receive/send task receives/sends a message;
� a user task expects input by a user via a UI;
� in a business rule task some business rules are applied (e.g. via a business rule
management system launched by the process engine) to produce a result;
� a script task contains statements processed directly by the process engine;
� a manual task is carried out without IT support;
� in an abstract task no type is defined.

Cimino – Modeling and Simulation of Business Processes using BPMN 2.0 – Lecture 2 – 25 of 31
• Workflow patterns are models of recurrent aspects of processes control flows, as
identified by the Workflow Pattern Initiative (www.workflowpatterns.com).
• e.g., wcp-10: unstructured loop (known as arbitrary cycles): the ability to represent
cycles in a process model that have more than one entry or exit point. Block
structured looping operators (while, for,…) cannot implement this pattern.
• Example: two entry points1
http://www.iet.unipi.it/m.cimino/bpm/res/mov14.swf
1
1

Cimino – Modeling and Simulation of Business Processes using BPMN 2.0 – Lecture 2 – 26 of 31
• e.g., wcp-18: milestone, a task is only enabled when its process is in a specific state,
which corresponds to a specific execution point. When this execution point is
reached the nominated task can be enabled.
• If the process instance has progressed beyond this state, then the task cannot be
enabled now or at any future time (i.e. the deadline has expired).
http://www.iet.unipi.it/m.cimino/bpm/res/mov15.swf
• example: most budget airlines allow the routing of a booking to be changed
providing the ticket has not been issued.
1
1

Cimino – Modeling and Simulation of Business Processes using BPMN 2.0 – Lecture 2 – 27 of 31
• e.g., wcp-15: multiple instances without a priori run-time knowledge, multiple
instances of a task can be created. The required number of instances may depend on
a number of runtime factors, and is not known until the final instance has completed.
Once initiated, these instances are independent of each other and run concurrently.
At any time, whilst instances are running, it is possible for additional instances to be
initiated. It is necessary to synchronize the instances at completion before any
subsequent tasks can be triggered.
http://www.iet.unipi.it/m.cimino/bpm/res/mov16.swf
• The dispatch of an oil rig from factory to site involves numerous transport shipment
tasks. These occur concurrently, and it is always possible for additional tasks to be
initiated if there is a shortfall in transportation requirements. Once the whole oil rig
has been transported, and all transport shipment tasks are completed, the next task
(assemble rig) can commence.

Cimino – Modeling and Simulation of Business Processes using BPMN 2.0 – Lecture 2 – 28 of 31
• Each BPMN element has a structure made of attributes and element associations, as
defined in the BPMN specification via UML classes and XML schemas.
• Example: text annotation, used for adding explanations, with no execution effect.

Cimino – Modeling and Simulation of Business Processes using BPMN 2.0 – Lecture 2 – 29 of 31
• Example: timer event, which waits until (i) an absolute point of time, (ii) the end of a
certain time span, or (iii) a time cycle for a recurring time interval.

Cimino – Modeling and Simulation of Business Processes using BPMN 2.0 – Lecture 2 – 30 of 31
• Roughly speaking, a BPMN orchestration process (i.e., within a Pool) may be
mapped to an individual WS-BPEL process (executable on a SOA environment). A
BPMN choreography can be mapped to WSDL calls (web services interfaces).
• Not all BPMN orchestration processes can be mapped to WS-BPEL, because BPMN
allows the modeler to draw almost arbitrary graphs to model control flow, whereas in
WS-BPEL there are certain restrictions. For example, an unstructured loop cannot
directly be represented in WS-BPEL (there is no goto like statement, there are while,
for, … structured cycles)
• Further, to map a BPMN orchestration process to WS-BPEL it must be sound (i.e.,
no deadlock, no lack of synchronization, etc., van der Aalst 2003).
• A block of a BPMN diagram is a sub-diagram that is connected to the rest of the
diagram only through exactly one entering sequence flow and one leaving sequence
flow.
Cimino – Modeling and Simulation of Business Processes using BPMN 2.0 – Lecture 2 – 31 of 31
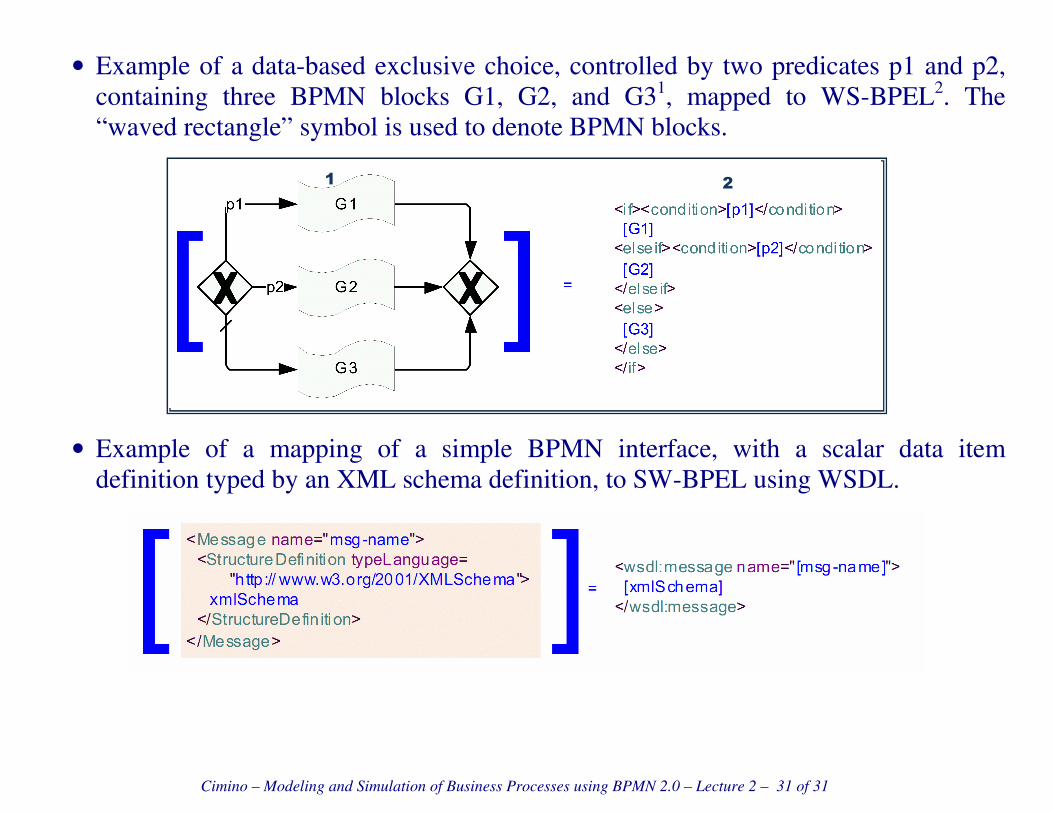
• Example of a data-based exclusive choice, controlled by two predicates p1 and p2,
containing three BPMN blocks G1, G2, and G31, mapped to WS-BPEL2. The
“waved rectangle” symbol is used to denote BPMN blocks.
• Example of a mapping of a simple BPMN interface, with a scalar data item
definition typed by an XML schema definition, to SW-BPEL using WSDL.
1 2

Cimino – Modeling and Simulation of Business Processes using BPMN 2.0 – Lecture 3 – 32 of 43
• Exercise: describe in natural language the following orchestration, concerning the
book lending process managed by a library. Use both the BPMN poster and the
BPMN specification to understand the meaning of unknown icons.

Cimino – Modeling and Simulation of Business Processes using BPMN 2.0 – Lecture 3 – 33 of 43
About events
• The Conditional event (a) starts a process when the related condition becomes true:
“provide additional resources when the utilization of the current ones exceeds 90%”.
• The Signal event (b) is triggered by the reception of a signal. In contrast to a message
which is always sent to a specific receiver, a signal is broadcasted everywhere, from
the same or a different pool: “when the computer system is not available, start a
process for manually processing data”.
• The Multiple event (c) combines many events; if one of them occurs, the process is
started: “a cleaning activity is started when either the cleaning interval has been
reached, or a contamination has been detected”.
• In the Parallel multiple event (d) all of the combined events must have occurred: “
the take-off procedure can be started as soon as both the permission has been given
and the engines have been checked”.

Cimino – Modeling and Simulation of Business Processes using BPMN 2.0 – Lecture 3 – 34 of 43
• The Terminate event (a)(c), like an un-typed end event, deletes the arriving token
when it arrives, but it also terminates the entire process, i.e., any other tokens in the
entire process are also removed at the same time.
• Example: skills and experiences of a job applicant are checked, as well as his formal
qualification is also checked in parallel. If the results of both checks are positive, the
two tokens are joined together to one token which eventually is deleted (b).
• If one of the checks has a negative result, the result of the other checks is irrelevant,
because the application will be rejected anyway. Thus the process can be
immediately terminated (a) (c).
• Replacing the terminate events by un-typed end event would cause a problem: if the
result of one of the checks would be positive and the other negative, the token from
the positive check would be stuck at the parallel gateway.
Cimino – Modeling and Simulation of Business Processes using BPMN 2.0 – Lecture 3 – 35 of 43
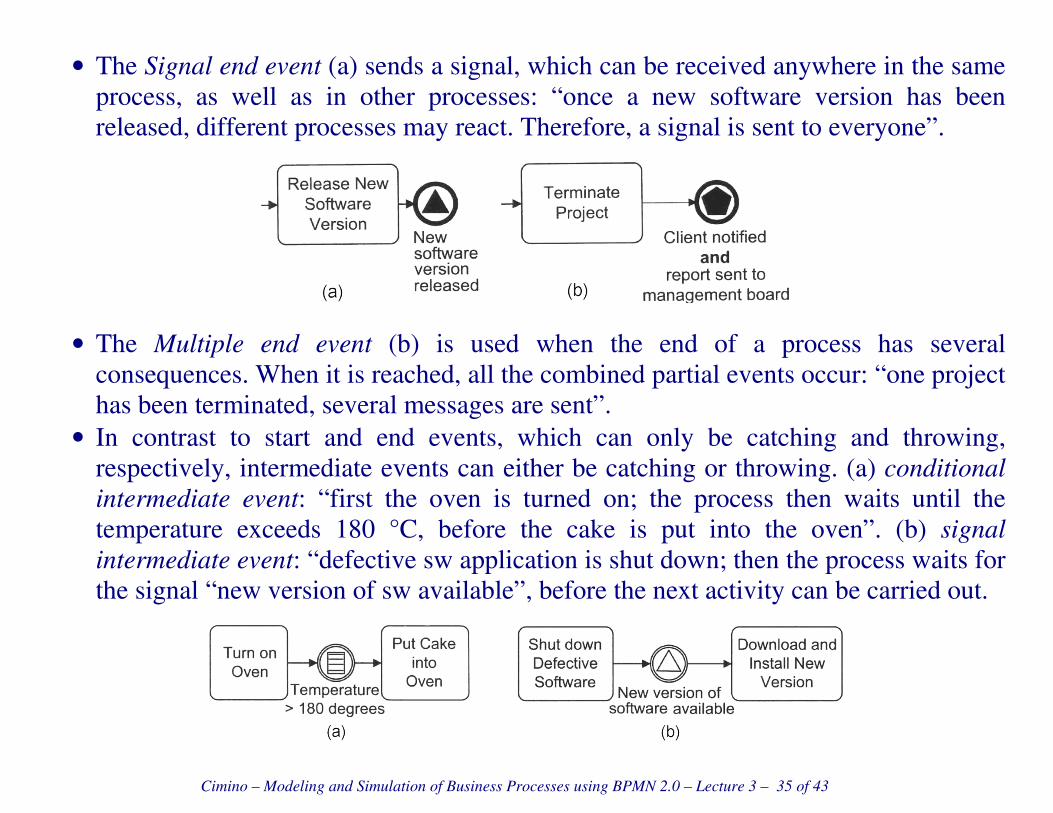
• The Signal end event (a) sends a signal, which can be received anywhere in the same
process, as well as in other processes: “once a new software version has been
released, different processes may react. Therefore, a signal is sent to everyone”.
• The Multiple end event (b) is used when the end of a process has several
consequences. When it is reached, all the combined partial events occur: “one project
has been terminated, several messages are sent”.
• In contrast to start and end events, which can only be catching and throwing,
respectively, intermediate events can either be catching or throwing. (a) conditional
intermediate event: “first the oven is turned on; the process then waits until the
temperature exceeds 180 °C, before the cake is put into the oven”. (b) signal
intermediate event: “defective sw application is shut down; then the process waits for
the signal “new version of sw available”, before the next activity can be carried out.
Cimino – Modeling and Simulation of Business Processes using BPMN 2.0 – Lecture 3 – 36 of 43
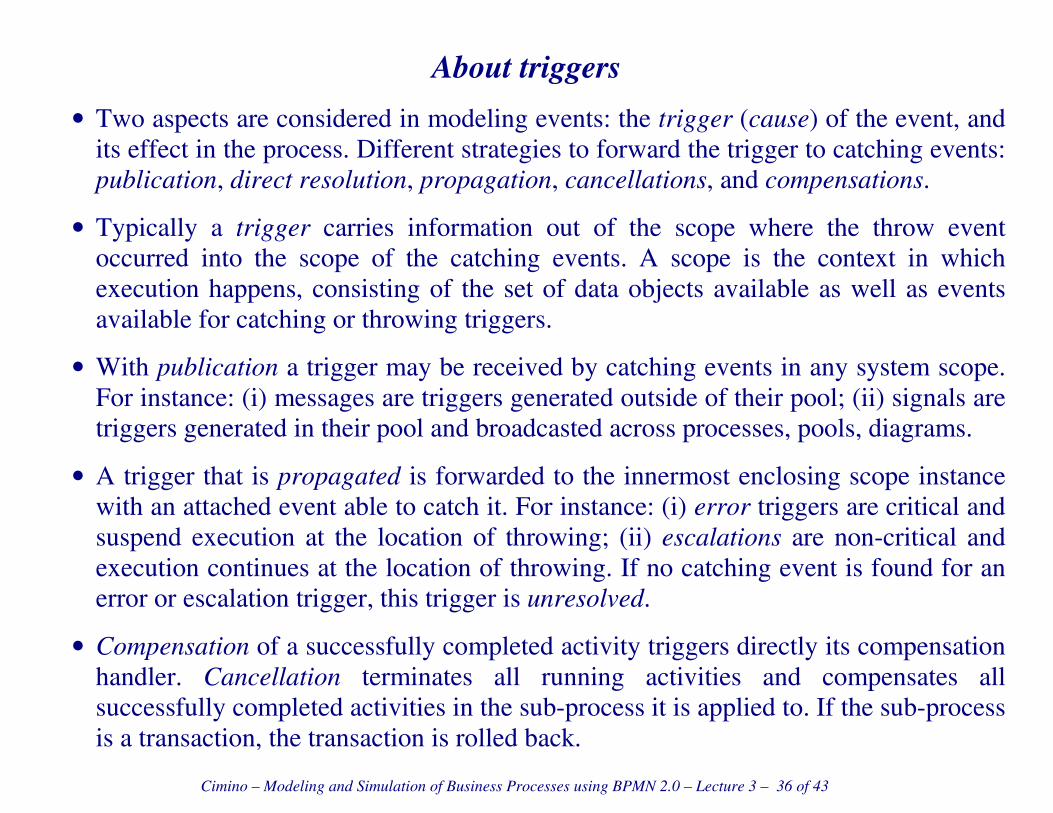
About triggers
• Two aspects are considered in modeling events: the trigger (cause) of the event, and
its effect in the process. Different strategies to forward the trigger to catching events:
publication, direct resolution, propagation, cancellations, and compensations.
• Typically a trigger carries information out of the scope where the throw event
occurred into the scope of the catching events. A scope is the context in which
execution happens, consisting of the set of data objects available as well as events
available for catching or throwing triggers.
• With publication a trigger may be received by catching events in any system scope.
For instance: (i) messages are triggers generated outside of their pool; (ii) signals are
triggers generated in their pool and broadcasted across processes, pools, diagrams.
• A trigger that is propagated is forwarded to the innermost enclosing scope instance
with an attached event able to catch it. For instance: (i) error triggers are critical and
suspend execution at the location of throwing; (ii) escalations are non-critical and
execution continues at the location of throwing. If no catching event is found for an
error or escalation trigger, this trigger is unresolved.
• Compensation of a successfully completed activity triggers directly its compensation
handler. Cancellation terminates all running activities and compensates all
successfully completed activities in the sub-process it is applied to. If the sub-process
is a transaction, the transaction is rolled back.
Cimino – Modeling and Simulation of Business Processes using BPMN 2.0 – Lecture 3 – 37 of 43
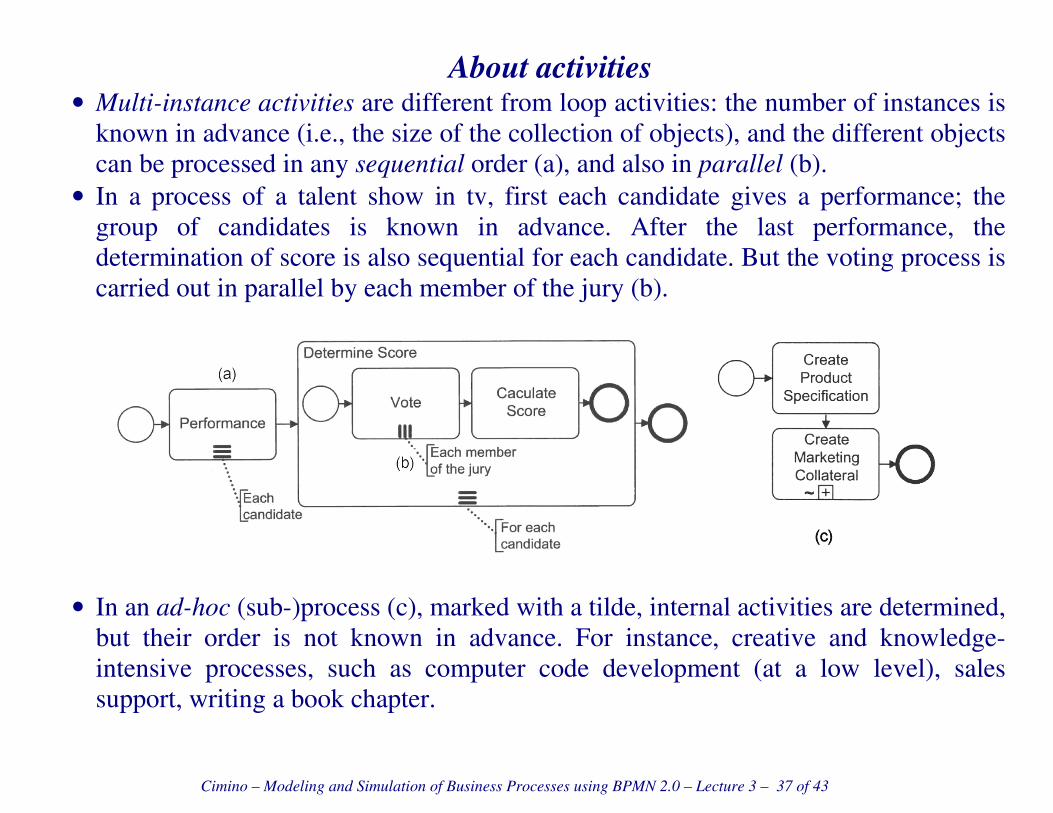
About activities
• Multi-instance activities are different from loop activities: the number of instances is
known in advance (i.e., the size of the collection of objects), and the different objects
can be processed in any sequential order (a), and also in parallel (b).
• In a process of a talent show in tv, first each candidate gives a performance; the
group of candidates is known in advance. After the last performance, the
determination of score is also sequential for each candidate. But the voting process is
carried out in parallel by each member of the jury (b).
• In an ad-hoc (sub-)process (c), marked with a tilde, internal activities are determined,
but their order is not known in advance. For instance, creative and knowledge-
intensive processes, such as computer code development (at a low level), sales
support, writing a book chapter.
Cimino – Modeling and Simulation of Business Processes using BPMN 2.0 – Lecture 3 – 38 of 43
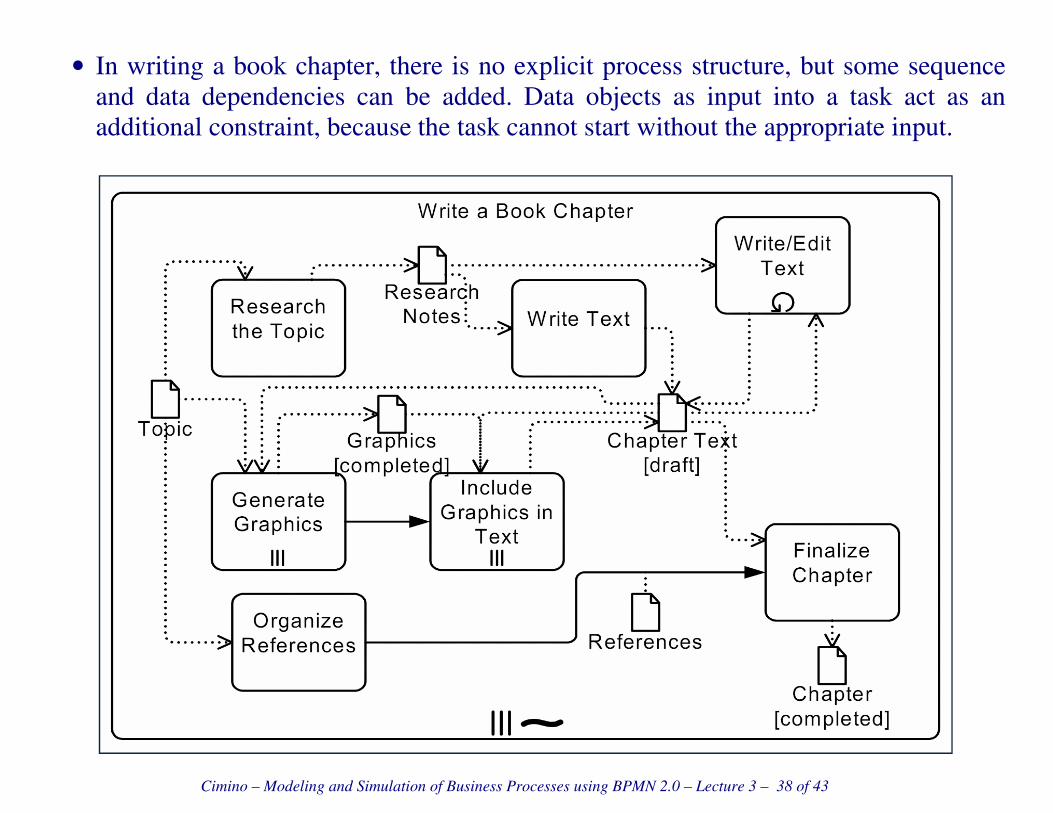
• In writing a book chapter, there is no explicit process structure, but some sequence
and data dependencies can be added. Data objects as input into a task act as an
additional constraint, because the task cannot start without the appropriate input.
Cimino – Modeling and Simulation of Business Processes using BPMN 2.0 – Lecture 3 – 39 of 43
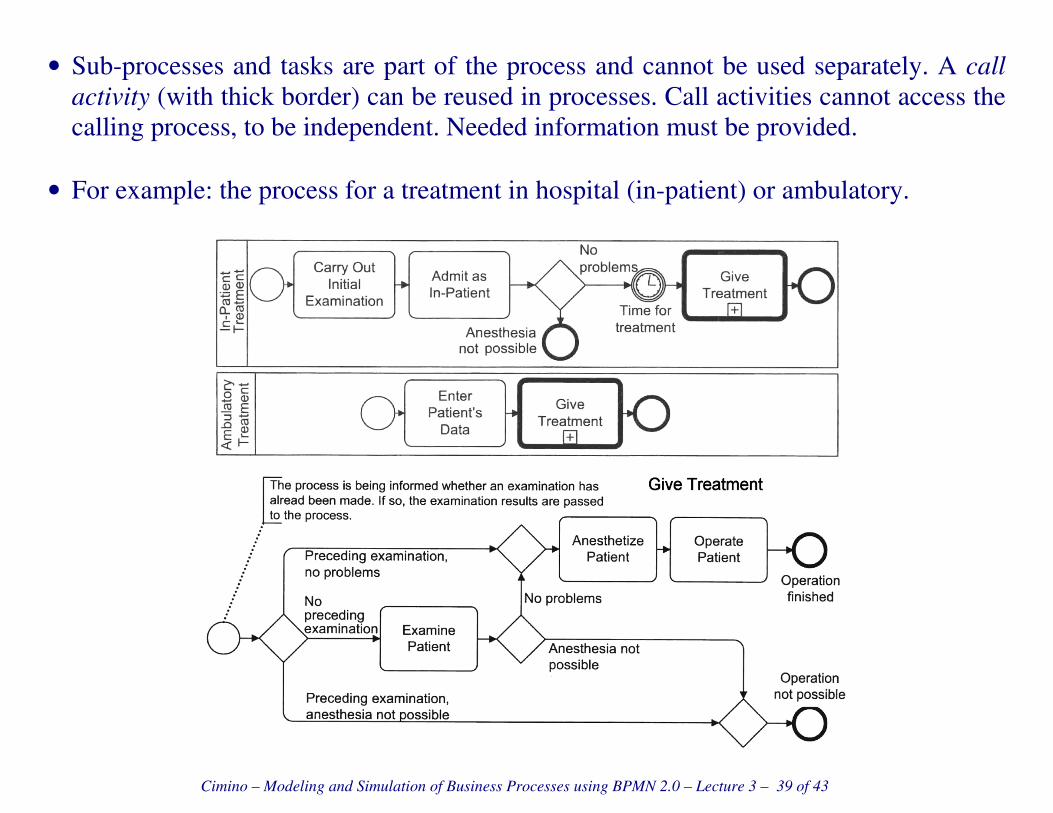
• Sub-processes and tasks are part of the process and cannot be used separately. A call
activity (with thick border) can be reused in processes. Call activities cannot access the
calling process, to be independent. Needed information must be provided.
• For example: the process for a treatment in hospital (in-patient) or ambulatory.

Cimino – Modeling and Simulation of Business Processes using BPMN 2.0 – Lecture 3 – 40 of 43
About exception handling
• While an activity / a process is carried out, sometimes an event occurs that results in
an early abortion of the activity / process.
• The sub-process “Process Order” is aborted when a cancellation is received, i.e., all
token will be removed from within that sub-process, and a token will be emitted via
the exception flow at the interrupting event.
• If the order has been completely processed, no cancellations are possible anymore. If
a cancellation arrives anyway, it will be ignored.
Cimino – Modeling and Simulation of Business Processes using BPMN 2.0 – Lecture 3 – 41 of 43
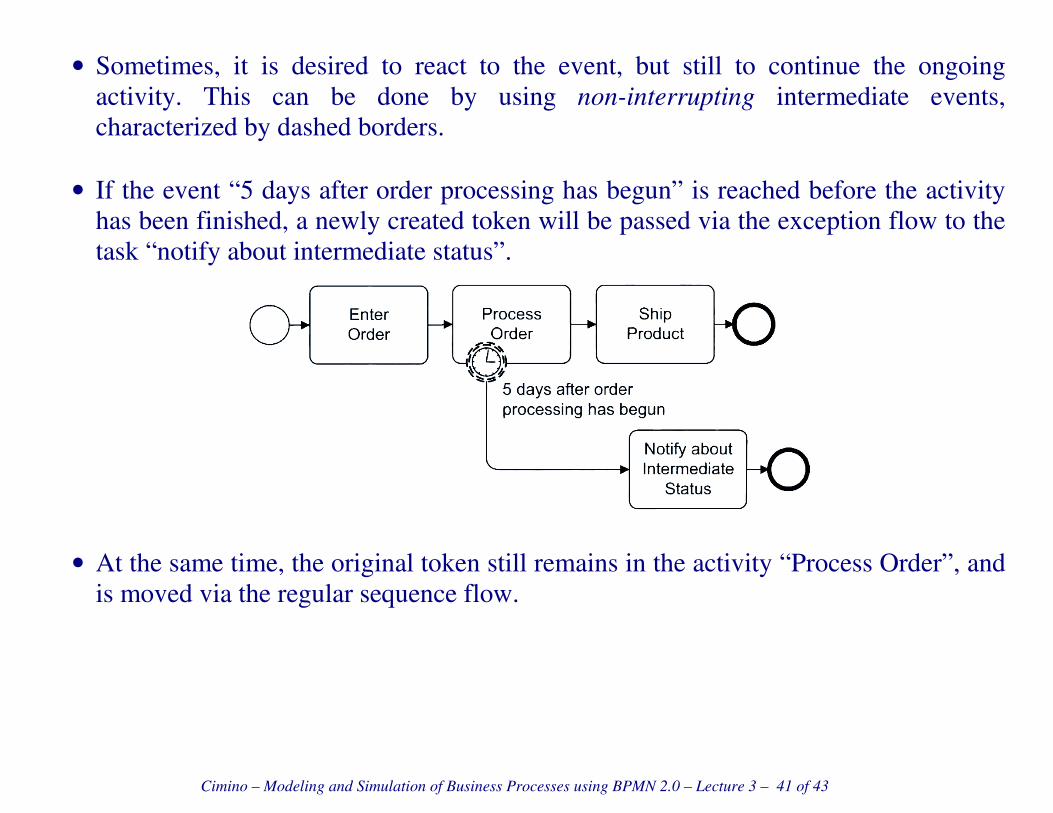
• Sometimes, it is desired to react to the event, but still to continue the ongoing
activity. This can be done by using non-interrupting intermediate events,
characterized by dashed borders.
• If the event “5 days after order processing has begun” is reached before the activity
has been finished, a newly created token will be passed via the exception flow to the
task “notify about intermediate status”.
• At the same time, the original token still remains in the activity “Process Order”, and
is moved via the regular sequence flow.

Cimino – Modeling and Simulation of Business Processes using BPMN 2.0 – Lecture 3 – 42 of 43
• Exercise: describe in natural language the following process diagram, concerning an
e-tendering.

Cimino – Modeling and Simulation of Business Processes using BPMN 2.0 – Lecture 3 – 43 of 43
• Consider an e-tender that sends a request for quote to multiple service providers
(e.g., warehouse storage) in a marketplace.
• The e-tender process sends out requests to each service provider and anticipates their
response through three choreography activities.
• The response branches merge at a complex gateway to model the requirement that
when 66% responses have arrived, an assessment of the tender can proceed.
• The assessment occurs after the complex gateway. If the assessment reports that the
reserve amount indicated by the customer cannot be met, a new iteration of the
tender is made.
• A key issue is to ensure that the responses should not be mixed across tender
iterations. A terminate end event ensures that all activities are terminated, when a
tender has been successful.

Cimino – Modeling and Simulation of Business Processes using BPMN 2.0 – Lecture 4 – 44 of 53
• The intermediate error events can only be attached to activity / process boundaries.
• In a process in a laboratory, after taking a sample, the sub-process is started. First the
sample is analyzed. This is usually followed by checking the result. If the result is
plausible, the sub process finishes. If the result is not plausible, this is an error, and
the throwing error and event “Result not plausible” is reached.
• In this case, the sub-process is aborted and the thrown error is caught by the error
intermediate event (with the same name) at the sub-process boundary. In this case,
the exception flow is followed, and the activity “Arrange for external analysis” is
triggered.

Cimino – Modeling and Simulation of Business Processes using BPMN 2.0 – Lecture 4 – 45 of 53
• In the sub-process, another error may occur: if during the activity "Analyze Sample"
it turns out that the equipment is defective (here also modeled with a catching error
event), it will be repaired.
• If repair has been successful, the analysis of the sample will be started again. In the
case of an unsuccessful repair, the throwing error event "Equipment out of order"
occurs.
• Again, the sub-process is aborted and the error is thrown to the intermediate error
event (with the same name) that triggers the exception flow to the activity “Arrange
for repair by Manufacturer” in addition to “Arrange for External Analysis”.
• Note that if there are several error intermediate events attached to a sub-process
boundary, they should be always labeled.
• Since unlabeled error intermediate event always catches any type of error, the
resulting implicit parallel flows are difficult to understand.
• Escalation events are rather similar to error events. Error events are mainly used for
technical problems, escalation events primarily stands for problems on a business
level, e.g., a task not completed, a goal not reached, a require agreement not
achieved.
Cimino – Modeling and Simulation of Business Processes using BPMN 2.0 – Lecture 4 – 46 of 53
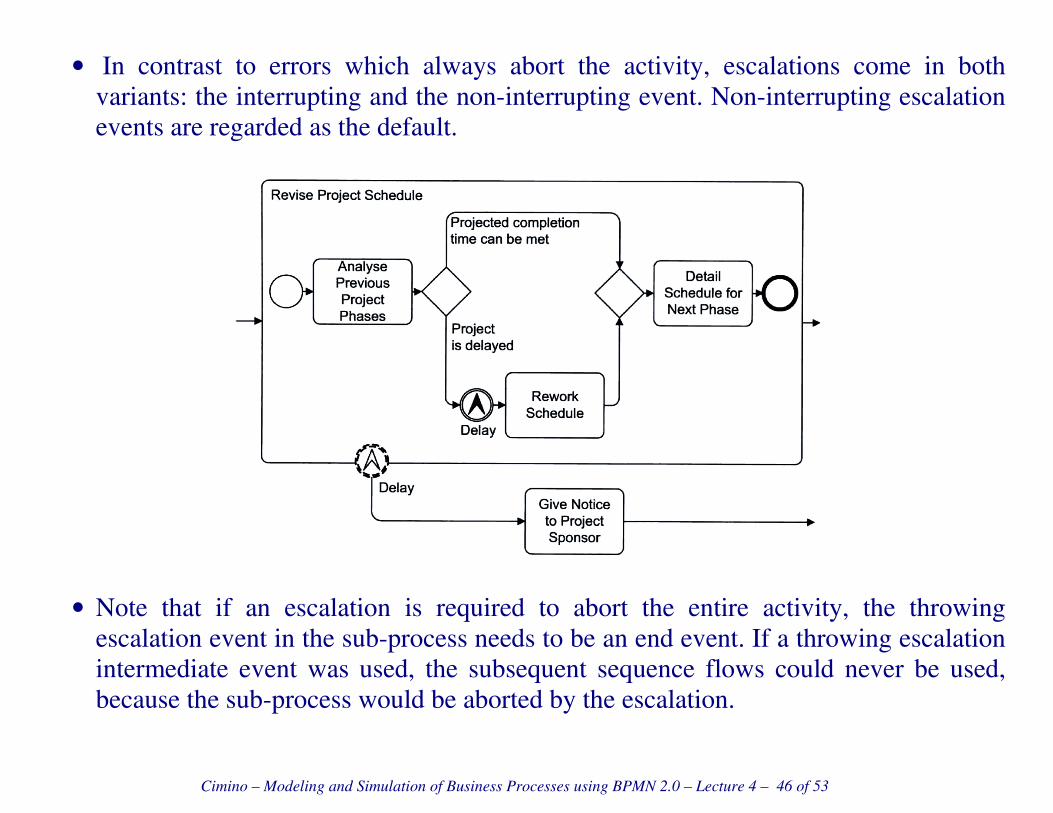
• In contrast to errors which always abort the activity, escalations come in both
variants: the interrupting and the non-interrupting event. Non-interrupting escalation
events are regarded as the default.
• Note that if an escalation is required to abort the entire activity, the throwing
escalation event in the sub-process needs to be an end event. If a throwing escalation
intermediate event was used, the subsequent sequence flows could never be used,
because the sub-process would be aborted by the escalation.

Cimino – Modeling and Simulation of Business Processes using BPMN 2.0 – Lecture 4 – 47 of 53
• An Event Sub-Process is triggered by an event occurring during process execution,
and is characterized by a dotted border. The sub-process “Produce Chemicals”
contains two events sub-process, the first one is non-interrupting, i.e. the system may
be adjusted several times during production. The second one is interrupting, and also
throws an error by an end event, which is caught in turn by an error intermediate
event (Emergency shut-off) so as to emit a token to the exception flow.

Cimino – Modeling and Simulation of Business Processes using BPMN 2.0 – Lecture 4 – 48 of 53
About transactions
• Parts of business processes can be treated as transactions, i.e., complete units of
work. A transaction can be either carried out in its entirety, or not at all. If something
goes wrong, the transaction must be rolled back. • A BPMN transaction is drawn with a double line border. Aborting a transaction
automatically reverses the effects of the activities that have already been carried out.
For this purpose, a compensation activity is assigned to each activity that requires it.
Cimino – Modeling and Simulation of Business Processes using BPMN 2.0 – Lecture 4 – 49 of 53
• In the above example, the activity “Put Goods into Stock” contains a rewind-symbol
(two white arrowheads) to express it as a compensation activity. Indeed it
compensates the activity “Remove Goods from Stock”. The compensation
association is a dotted line with an arrow. Do not confuse it with message flow.
• The activity “Check order” does not have a compensating activity, because it does
not have any effects that need to be reversed.
• The throwing end event of type “cancel” is used to abort a transaction. Once the
required compensation has been carried out, the exception flow starts as the catching
cancel intermediate events.
• Note that the terminate end event is needed to cancel the token waiting for receiving
cancellations.
• Compensation can also be handled by event sub-processes. They have a
compensation start event, and can be started when a throwing compensation event of
the same name occurs after the surrounding process is already finished.
• In contrast with compensation events, error/escalation events can be caught only in
the surrounding process during its execution.

Cimino – Modeling and Simulation of Business Processes using BPMN 2.0 – Lecture 4 – 50 of 53
Cimino – Modeling and Simulation of Business Processes using BPMN 2.0 – Lecture 4 – 51 of 53
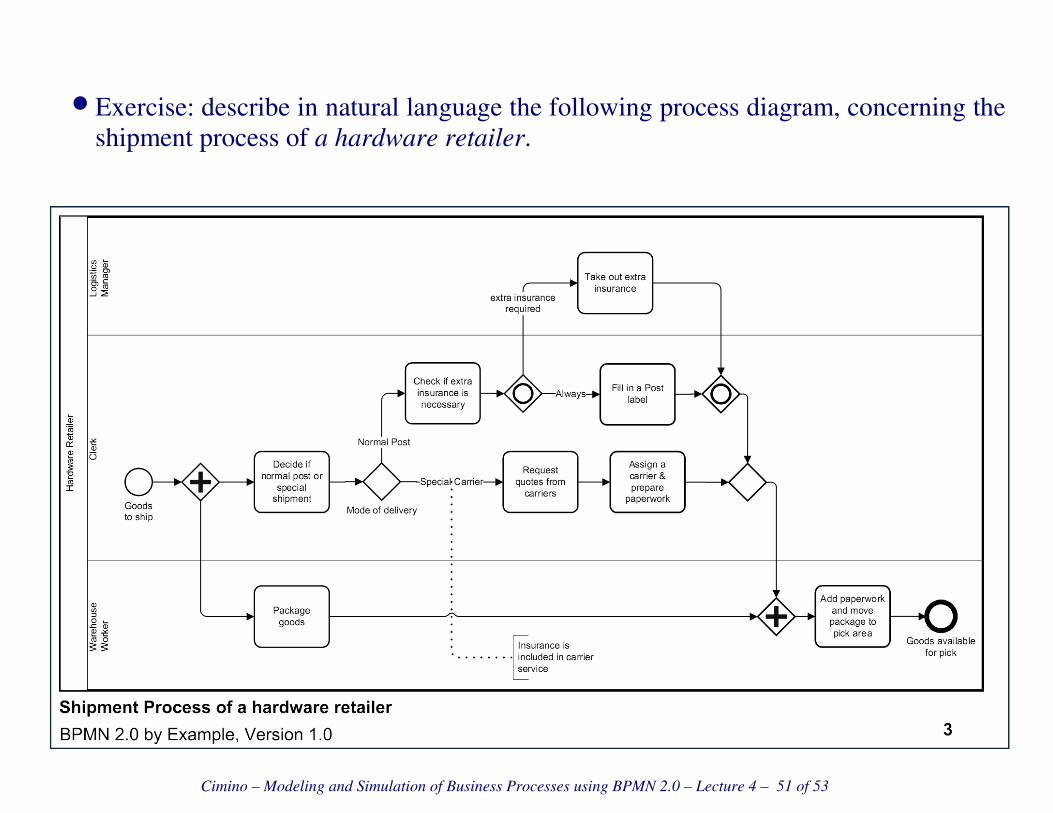
• Exercise: describe in natural language the following process diagram, concerning the
shipment process of a hardware retailer.

Cimino – Modeling and Simulation of Business Processes using BPMN 2.0 – Lecture 4 – 52 of 53
• Exercise: describe in natural language the following process diagram, concerning the
interaction between a pizza customer and the vendor.

Cimino – Modeling and Simulation of Business Processes using BPMN 2.0 – Lecture 4 – 53 of 53
• Exercise: describe in natural language the following process diagram, concerning the
incident management process.

Cimino – Modeling and Simulation of Business Processes using BPMN 2.0 – Lecture 5 – 53 of 55
• Exercise (reverse modeling): describe in natural language the following process
diagram, concerning the selection of a Nobel Prize in Medicine.
Cimino – Modeling and Simulation of Business Processes using BPMN 2.0 – Lecture 5 – 54 of 55
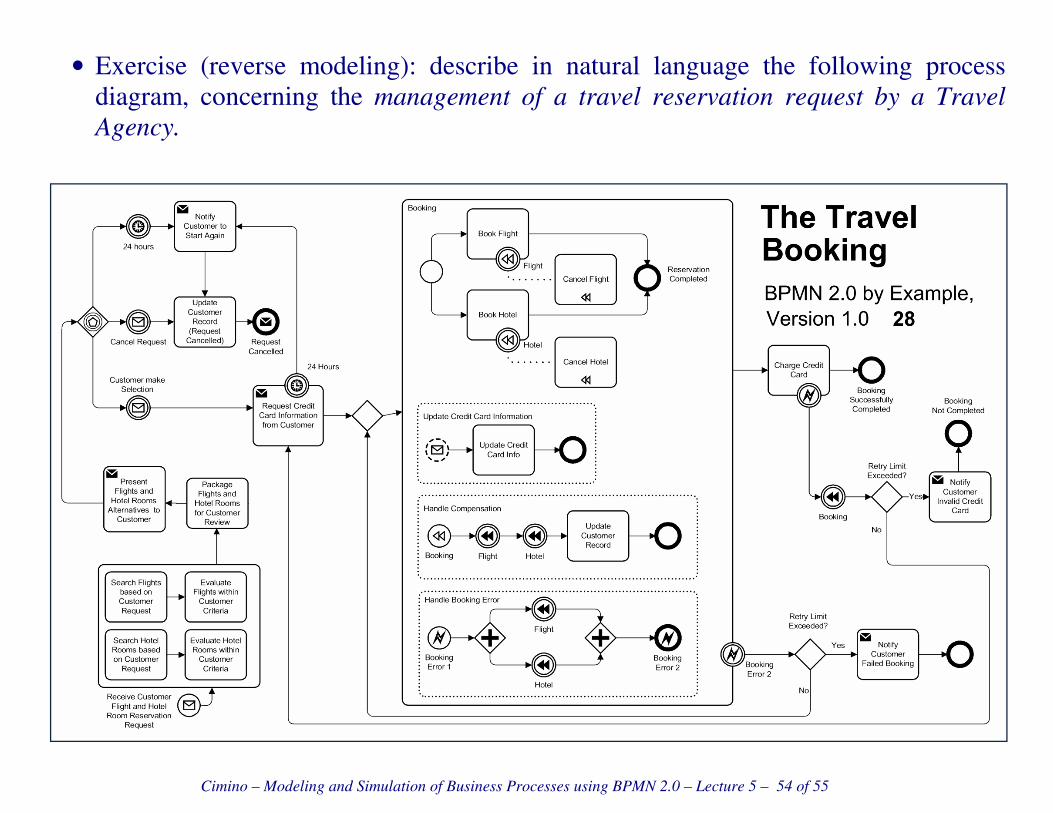
• Exercise (reverse modeling): describe in natural language the following process
diagram, concerning the management of a travel reservation request by a Travel
Agency.
Cimino – Modeling and Simulation of Business Processes using BPMN 2.0 – Lecture 5 – 55 of 55
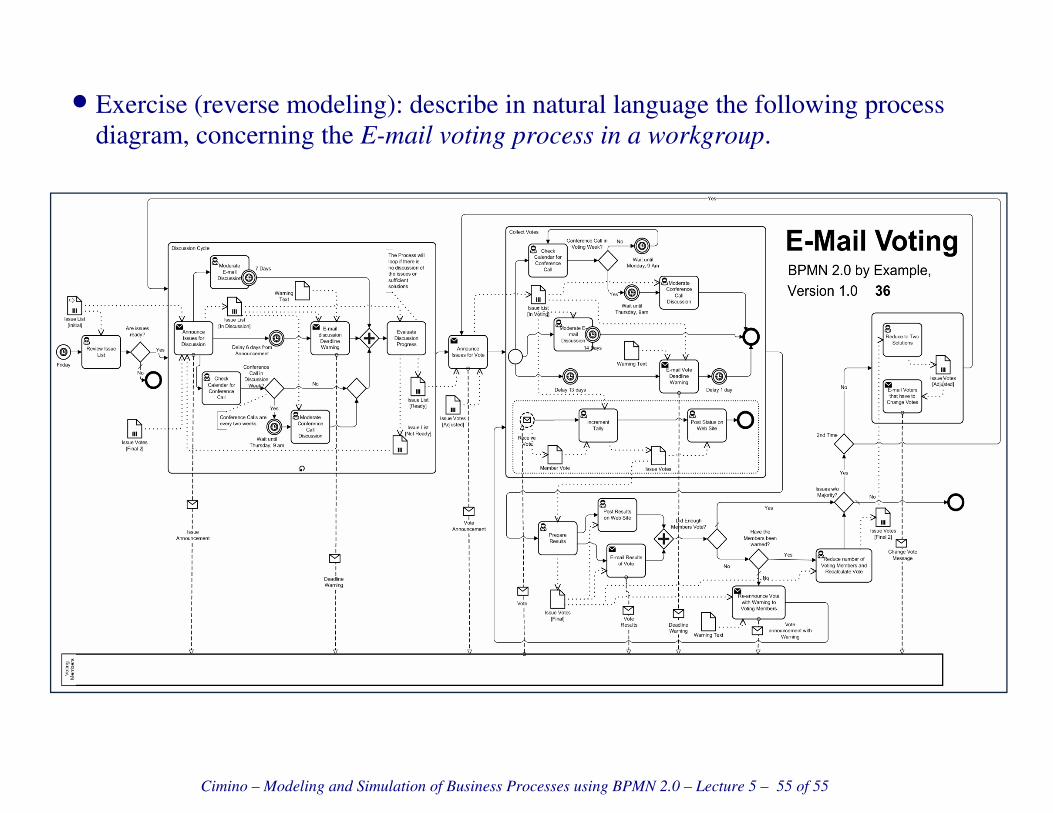
• Exercise (reverse modeling): describe in natural language the following process
diagram, concerning the E-mail voting process in a workgroup.
Cimino – Modeling and Simulation of Business Processes using BPMN 2.0 – Lecture 6 – 56 of 59
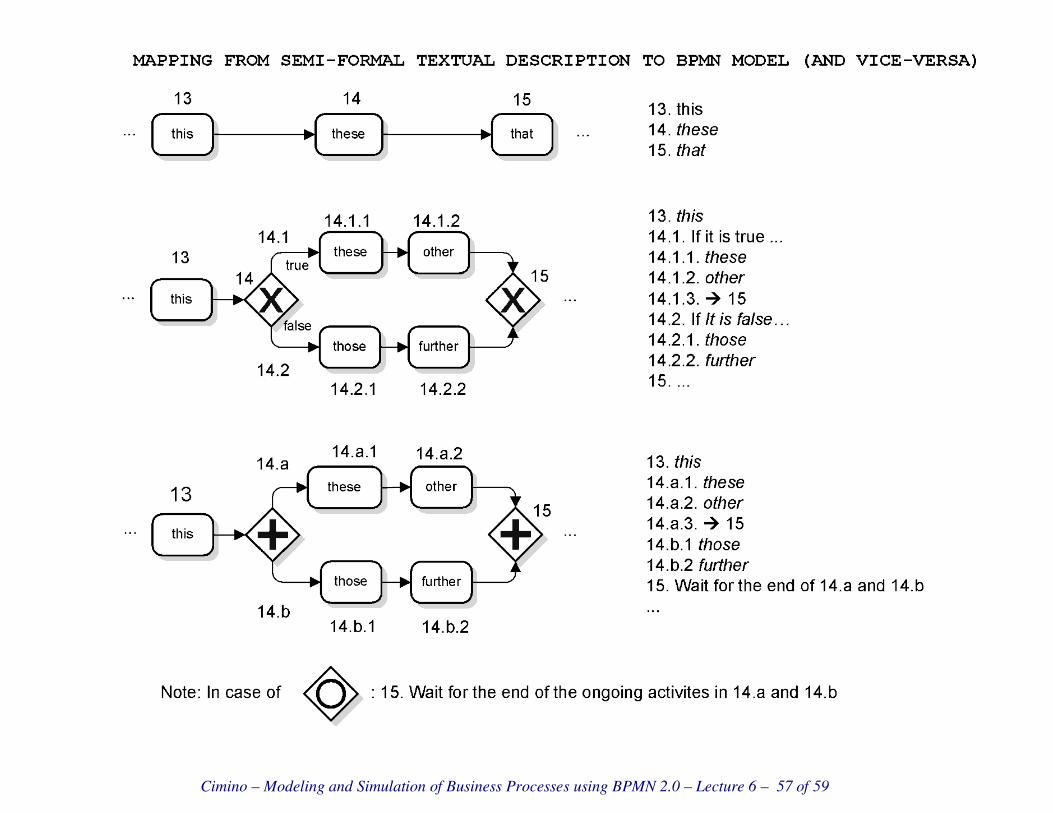
From Reverse Modeling to Modeling
• Reverse modeling is easy: it mainly consists in translation from visual to textual
representation. In contrast, the modeling process requires a higher cognitive effort: it
is an inherently inductive (creative) process: from informal natural language to a
clear and standardized model.
• An efficient learning of the modeling process can be supported by a semi-formal
textual description. In the following, we will start to learn the modeling process via
simple scenarios described in a semi-formal textual notation.
• The semi-formal notation is made of short sentences, numbered so as to allow the
specification of the control flows with BPMN 2. It resembles detailed use cases in
UML.
• A sequential numbering is used to express a sequential order of execution. A new
level of numbering is used to express a flow internal to some branch of the control
flow. A new decimal numbering level is used to expresses exclusive branches (e.g.
x.1 and x.2). In this case, each branch starts with the if keyword. A new alphabetic
numbering level is used to express parallel or inclusive branches (e.g. x.a, and x.b).
Cimino – Modeling and Simulation of Business Processes using BPMN 2.0 – Lecture 6 – 57 of 59

Cimino – Modeling and Simulation of Business Processes using BPMN 2.0 – Lecture 6 – 58 of 59
Advertising agency
• How an advertising agency produces an advertisement, and which messages it
exchanges in doing so.
1. The Agency waits for orders from customers
2. A Customer sends an order to the Agency including the text for advertisement
3. The Agency receives the order from the Customer
4. The Agency designs the Advertisement
5.a.1. The Agency proofreads the text
5.a.2.1. If the text is okay
5.a.2.1.1. � 6
5.a.2.2. If the text is not okay
5.a.2.2.1. The Agency corrects the text
5.a.2.2.2. � 5.a
5.b.1. The Agency checks the layout
5.b.2.1. If the layout is okay
5.b.2.1.1. � 6
5.b.2.2. If the layout is not okay
5.b.2.2.1. The Agency reworks the layout
5.b.2.2.2. � 5.b
6. Wait until both text and layout are okay
7. The Agency sends a proof to the Customer
8. The Customer receives the proof from the Agency
9. The Customer sends to the Agency a feedback on the proof
10. The Agency receives the feedback on the proof from the Customer
11.1. If the Customer accepts the proof
11.1.1. The Agency archives the advertisement
11.1.2. The advertisement can be produced.
11.2. If the Customer requests changes
11.2.1. The Agency reworks the advertisement
11.2.2. � 5

Cimino – Modeling and Simulation of Business Processes using BPMN 2.0 – Lecture 6 – 59 of 59

Cimino – Modeling and Simulation of Business Processes using BPMN 2.0 – Lecture 7 – 60 of 63
Job application
• The interaction between a job applicant and an enterprise. 1. An Applicant begins to search for a job
2. The Applicant writes a job application
3. The application has been sent to the Enterprise
(The Applicant waits for the confirmation of receipt)
4. The Enterprise has received the Application from the Applicant
5. The Enterprise writes the confirmation of receipt
6. The confirmation of receipt from the Enterprise has been sent to the Applicant
7. The Applicant has received the confirmation of receipt from the Enterprise
(The Applicant waits for receiving an invitation or a rejection)
8. The Enterprise reviews the application
9.1. If the Applicant is not suitable
9.1.1. The Enterprise rejects the application
9.1.2. A message of rejection has been sent from the Enterprise to the Applicant
(The Enterprise rejected the Applicant)
9.1.3. The rejection message of the Enterprise has been received by the Applicant
9.1.4. The Applicant has been rejected by the Enterprise.
9.2. If the Applicant is interesting
9.2.1. The Enterprise Invites the Applicant to interview
9.2.2. The invitation to interview of the Enterprise has been sent to the Applicant
(The Enterprise waits for a confirmation of date)
9.2.3. The invitation to interview of the Enterprise has been received by the Applic
9.2.4. The Applicant confirm the date for the interview
9.2.5. The confirmation of date of the Applicant has been sent to the Enterprise
9.2.6. The confirmation of date of the Applicant has been received by the Enterprise
9.2.7. Time needed for starting the interview has elapsed
9.2.8. The Applicant takes part to the interview, receiving questions and providing
answers. The Enterprise carries out the interview, asking questions and
receiving answers.
9.2.9. The interview is ended.

Cimino – Modeling and Simulation of Business Processes using BPMN 2.0 – Lecture 7 – 61 of 63
Cimino – Modeling and Simulation of Business Processes using BPMN 2.0 – Lecture 7 – 62 of 63
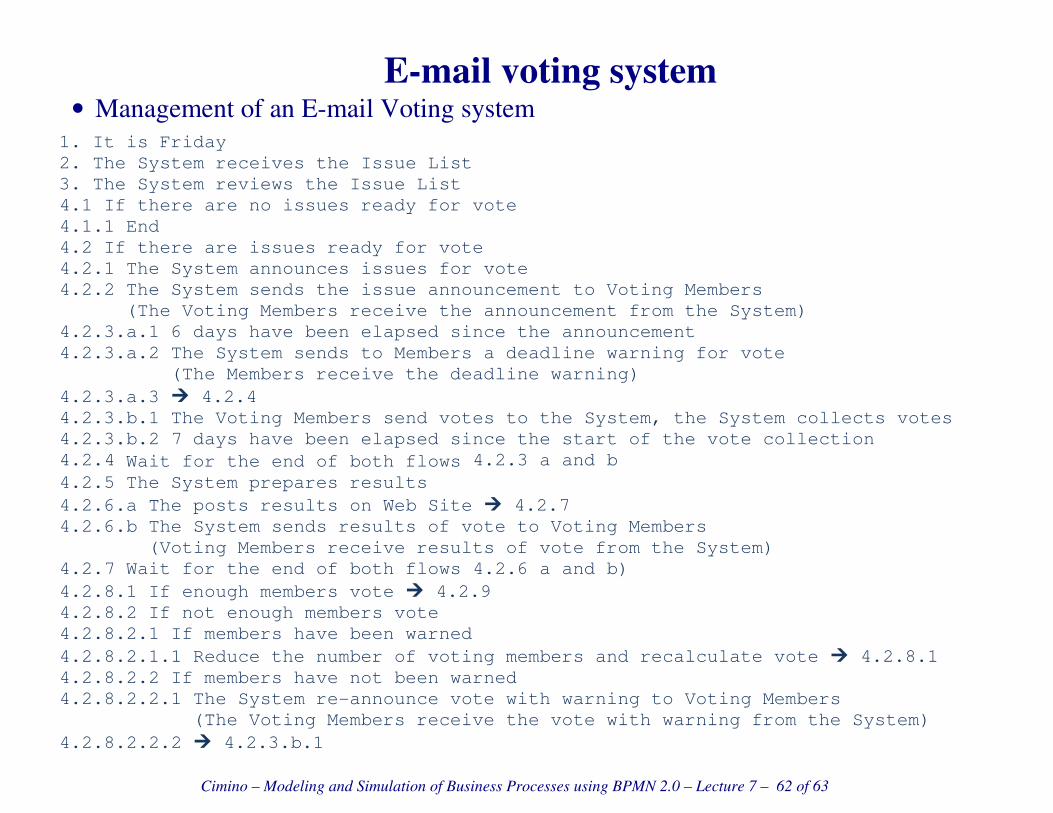
E-mail voting system
• Management of an E-mail Voting system 1. It is Friday
2. The System receives the Issue List
3. The System reviews the Issue List
4.1 If there are no issues ready for vote
4.1.1 End
4.2 If there are issues ready for vote
4.2.1 The System announces issues for vote
4.2.2 The System sends the issue announcement to Voting Members
(The Voting Members receive the announcement from the System)
4.2.3.a.1 6 days have been elapsed since the announcement
4.2.3.a.2 The System sends to Members a deadline warning for vote
(The Members receive the deadline warning)
4.2.3.a.3 � 4.2.4
4.2.3.b.1 The Voting Members send votes to the System, the System collects votes
4.2.3.b.2 7 days have been elapsed since the start of the vote collection
4.2.4 Wait for the end of both flows 4.2.3 a and b
4.2.5 The System prepares results
4.2.6.a The posts results on Web Site � 4.2.7
4.2.6.b The System sends results of vote to Voting Members
(Voting Members receive results of vote from the System)
4.2.7 Wait for the end of both flows 4.2.6 a and b)
4.2.8.1 If enough members vote � 4.2.9
4.2.8.2 If not enough members vote
4.2.8.2.1 If members have been warned
4.2.8.2.1.1 Reduce the number of voting members and recalculate vote � 4.2.8.1
4.2.8.2.2 If members have not been warned
4.2.8.2.2.1 The System re-announce vote with warning to Voting Members
(The Voting Members receive the vote with warning from the System)
4.2.8.2.2.2 � 4.2.3.b.1

Cimino – Modeling and Simulation of Business Processes using BPMN 2.0 – Lecture 7 – 63 of 63
4.2.9 (go on)
4.2.9.1 If there are no issues with majority � End
4.2.9.2 If there are issues with majority
4.2.9.2.1 Reduce to two solutions
4.2.9.2.2 The System announces the vote only to Voting Members that have to change
votes (Voting Members receive the change vote message from the System)
4.2.9.2.3 � 4.2.3.b.1
Cimino – Modeling and Simulation of Business Processes using BPMN 2.0 – Lecture 8 – 64 of 65
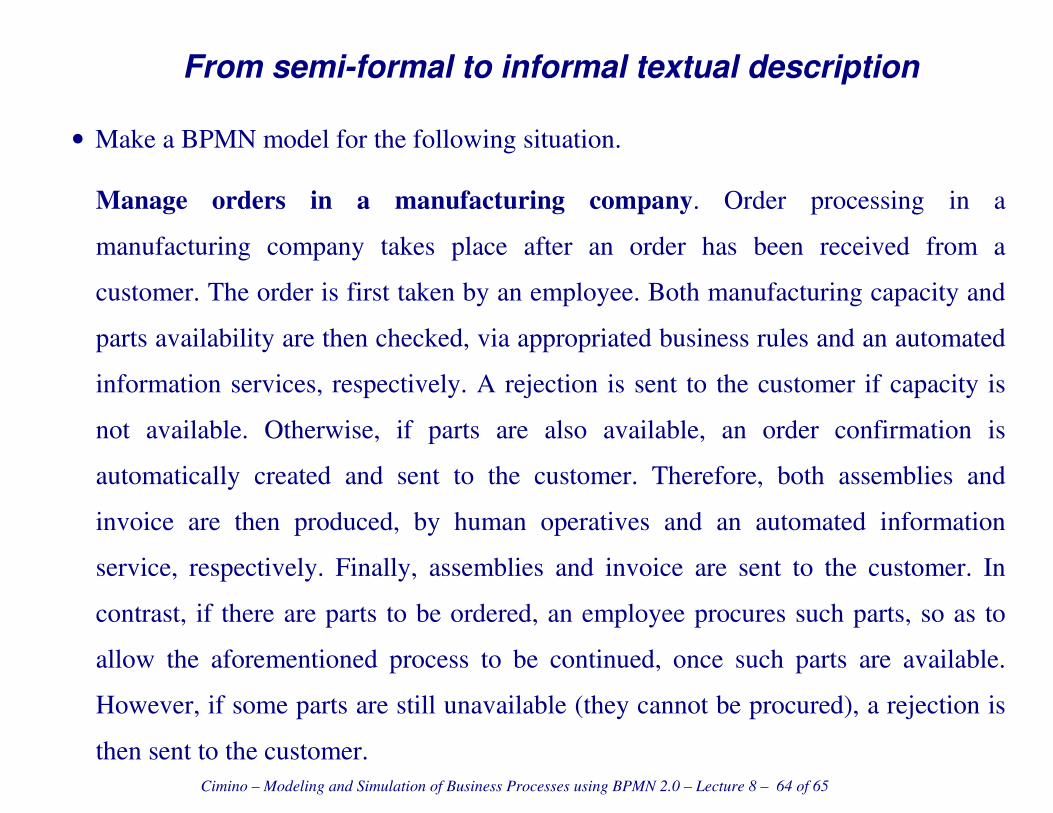
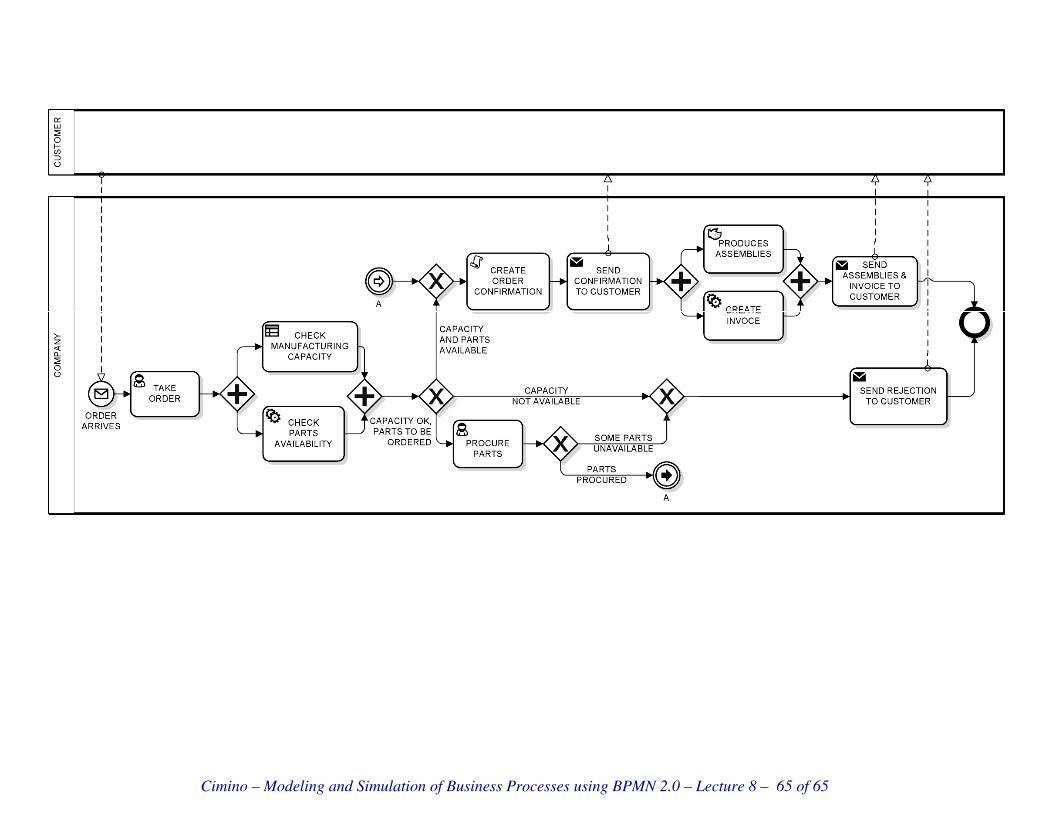
From semi-formal to informal textual description
• Make a BPMN model for the following situation.
Manage orders in a manufacturing company. Order processing in a
manufacturing company takes place after an order has been received from a
customer. The order is first taken by an employee. Both manufacturing capacity and
parts availability are then checked, via appropriated business rules and an automated
information services, respectively. A rejection is sent to the customer if capacity is
not available. Otherwise, if parts are also available, an order confirmation is
automatically created and sent to the customer. Therefore, both assemblies and
invoice are then produced, by human operatives and an automated information
service, respectively. Finally, assemblies and invoice are sent to the customer. In
contrast, if there are parts to be ordered, an employee procures such parts, so as to
allow the aforementioned process to be continued, once such parts are available.
However, if some parts are still unavailable (they cannot be procured), a rejection is
then sent to the customer.
Cimino – Modeling and Simulation of Business Processes using BPMN 2.0 – Lecture 8 – 65 of 65

University of Pisa
MSc in Computer Engineering
Business Processes Management
“Large and complex organizations are a tangible manifestation of advanced technology, more than machinery itself.” (J.K. Galbraith)
Tutorials
Mario G. Cimino, Department of Information Engineering, Center for Logistics Systems
Pisa, March-May 2013, Monday 15.30-18.30, Room: ADInform1
Cimino – Modeling and Simulation of Business Processes using BPMN 2.0 – Tutorials – 2 of 2
Logizian 10.x
• Suite to model and simulate the execution of business processes
• Download: http://www.visual-paradigm.com/download/lz.jsp (no-install version)
• Unzip and execute bin/Logizian.exe
• Workspace: select a folder to use as workspace
• Evaluation: 30 Days Free Evaluation, Simulacian, press “Evaluate”
LogizianDrawing BPMN 2.0 business process diagram
Tutorial
http://www.visual-paradigm.com/product/lz/tutorials/businessprocessmodeling.jsp Page 1 of 11
Drawing BPMN 2.0 business process diagramWritten Date : October 30, 2009
Business Process Modeling Notation 2.0 makes a great improvement in business process modeling.There are number of new notations introduced in BPMN 2.0. In this tutorial we will show you howto draw choreography task and message. We will draw the example diagram of BPMN 2.0 draftspecification (An example of stand-alone Choreogrpahy diagram).
1. We first create a model in our project. Right click on the Model Explorer and select Model >New Model...
2. Name the model as Sales.

LogizianDrawing BPMN 2.0 business process diagram
Tutorial
http://www.visual-paradigm.com/product/lz/tutorials/businessprocessmodeling.jsp Page 2 of 11
3. We can then create pools directly under Sales model without using diagram. Right click on Salesmodel and select Model Element > New Model Element.
4. You can search the model you would like to create in the New Model Element dialog. Enter Poin the Model element type text field to search for the Pool.
5. Name the pool as Customer. Press OK to proceed.
LogizianDrawing BPMN 2.0 business process diagram
Tutorial
http://www.visual-paradigm.com/product/lz/tutorials/businessprocessmodeling.jsp Page 3 of 11
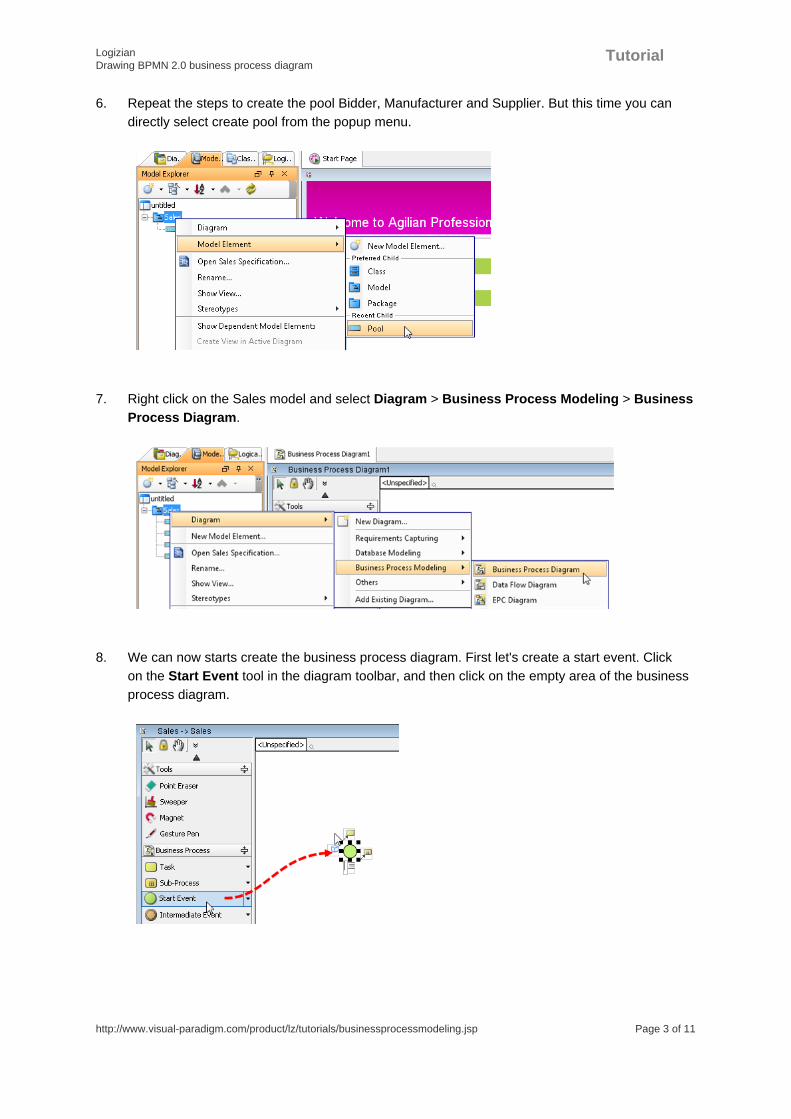
6. Repeat the steps to create the pool Bidder, Manufacturer and Supplier. But this time you candirectly select create pool from the popup menu.
7. Right click on the Sales model and select Diagram > Business Process Modeling > BusinessProcess Diagram.
8. We can now starts create the business process diagram. First let's create a start event. Clickon the Start Event tool in the diagram toolbar, and then click on the empty area of the businessprocess diagram.

LogizianDrawing BPMN 2.0 business process diagram
Tutorial
http://www.visual-paradigm.com/product/lz/tutorials/businessprocessmodeling.jsp Page 4 of 11
9. Now click on the start event and drag out the Generic Resource icon.
10. Release the mouse button at the blank area of the diagram, and select Choreogrpahy Taskfrom the popup menu.
11. Name the task as Order Request.
12. Right click on Order Request and select Open Specification...

LogizianDrawing BPMN 2.0 business process diagram
Tutorial
http://www.visual-paradigm.com/product/lz/tutorials/businessprocessmodeling.jsp Page 5 of 11
13. Specify Customer pool in Participant 1.
14. Specify Manufacturer pool in Participant 2.
15. And select Customer pool in the Initiating participant field.
16. Press OK to commit.
LogizianDrawing BPMN 2.0 business process diagram
Tutorial
http://www.visual-paradigm.com/product/lz/tutorials/businessprocessmodeling.jsp Page 6 of 11
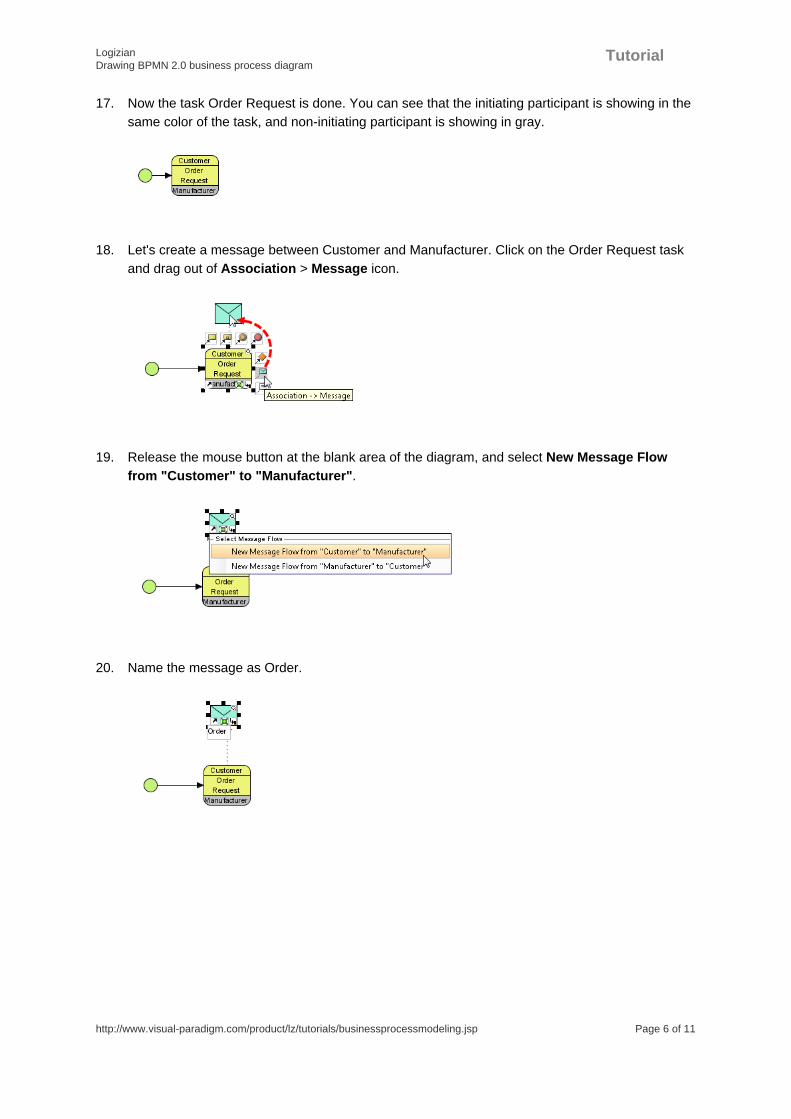
17. Now the task Order Request is done. You can see that the initiating participant is showing in thesame color of the task, and non-initiating participant is showing in gray.
18. Let's create a message between Customer and Manufacturer. Click on the Order Request taskand drag out of Association > Message icon.
19. Release the mouse button at the blank area of the diagram, and select New Message Flowfrom "Customer" to "Manufacturer".
20. Name the message as Order.

LogizianDrawing BPMN 2.0 business process diagram
Tutorial
http://www.visual-paradigm.com/product/lz/tutorials/businessprocessmodeling.jsp Page 7 of 11
21. Create an Event-based Exclusive Gateway from Order Request. Click on Order Request anddrag out the Sequence Flow > Gateway icon. Drop it on the blank area of the diagram.
22. Name the gateway as Can Fulfill Order?
23. Right click on the gateway and select Type > Event-based Exclusive Decision/Merge (XOR).

LogizianDrawing BPMN 2.0 business process diagram
Tutorial
http://www.visual-paradigm.com/product/lz/tutorials/businessprocessmodeling.jsp Page 8 of 11
24. Repeat the steps to complete the following business process diagram.
25. It could be multiple instance of procure parts activity doing at the same time. Let's specify it asmulti-instance activity. Right click on the Procure Parts task and select Open specification...
26. Select Multi-Instance Loop in the Loop type combo box.
27. Press OK to commit. Now the Multi-Instance loop marker is showing in the Procure Parts task.

LogizianDrawing BPMN 2.0 business process diagram
Tutorial
http://www.visual-paradigm.com/product/lz/tutorials/businessprocessmodeling.jsp Page 9 of 11
28. Let's create messages between Manufacturer and Bidder on the Part Auction activity. Clickon the Part Auction activity and drag out the Message icon. Select New Message Flow from"Manufacturer" to "Bidder" from the popup menu.
29. Name the message as Part Request.
30. Repeat the step to create another message to Part Auction activity. The message should beNew Message Flow from "Bidder" to "Manufacturer". Name the message as Part Response.
31. You can see that the message from Bidder to Manufacturer is in different color since Bidder isnon-initiating participant.
32. Now the gateway All Parts Available? and All Parts Obtained? in business process diagram onlymodeled the false situation. What about the true case? It should be go to Order Confirmationactivity. We don't want the diagram become so much cross lines since they mess up the layoutand make the diagram difficult to read. We can create Link Event to simplify the flow.
33. Click on the All Parts Available? gateway and drag out the Sequence Flow > IntermediateEvent icon.
34. Name the intermediate event as A.

LogizianDrawing BPMN 2.0 business process diagram
Tutorial
http://www.visual-paradigm.com/product/lz/tutorials/businessprocessmodeling.jsp Page 10 of 11
35. Right click on the intermediate event and select Trigger > Link Trigger.
36. Repeat the steps to create another link event to All Parts Obtained? gateway.
37. Click on the Link Intermediate Event in the diagram toolbar, and click on the blank area of thediagram.
38. Name the intermediate event as A.
39. Click on the link event A and drag out the Sequence Flow > Task icon, drop it to the OrderConfirmation task.
LogizianDrawing BPMN 2.0 business process diagram
Tutorial
http://www.visual-paradigm.com/product/lz/tutorials/businessprocessmodeling.jsp Page 11 of 11
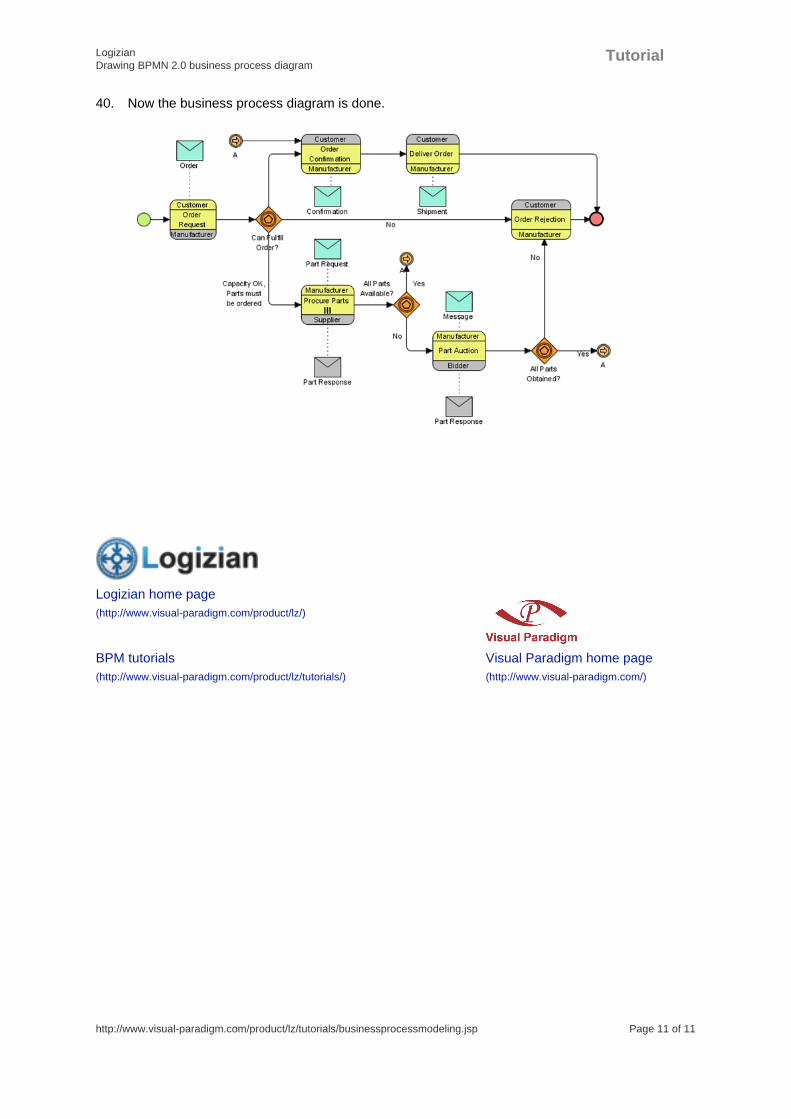
40. Now the business process diagram is done.
Logizian home page(http://www.visual-paradigm.com/product/lz/)
BPM tutorials(http://www.visual-paradigm.com/product/lz/tutorials/)
Visual Paradigm home page(http://www.visual-paradigm.com/)

LogizianProcess Simulation Example
Tutorial
http://www.visual-paradigm.com/product/lz/tutorials/simulacian.jsp Page 1 of 12
Process Simulation ExampleWritten Date : February 19, 2010
Simulation is a technique that helps business analysts simulates the execution of business processfor studying the resource consumption (e.g. Human resources, devices, etc.) throughout a process,identifying bottlenecks and improving the current business by process refinement and resourcesre-allocation. Simulacian is the tool that assists you to perform simulation. It includes not only thevisual simulation ability, but also charts generation functions. In this tutorial, we will study a businessprocess of performing body check, and make use of simulacian to find out the possible changes thatcan make the process more efficient.
1. Download the project Body Check.vpp attached with this tutorial.
2. Start Logizian.
3. Open Body Check.vpp
4. Open the business process diagram Body check process.
LogizianProcess Simulation Example
Tutorial
http://www.visual-paradigm.com/product/lz/tutorials/simulacian.jsp Page 2 of 12
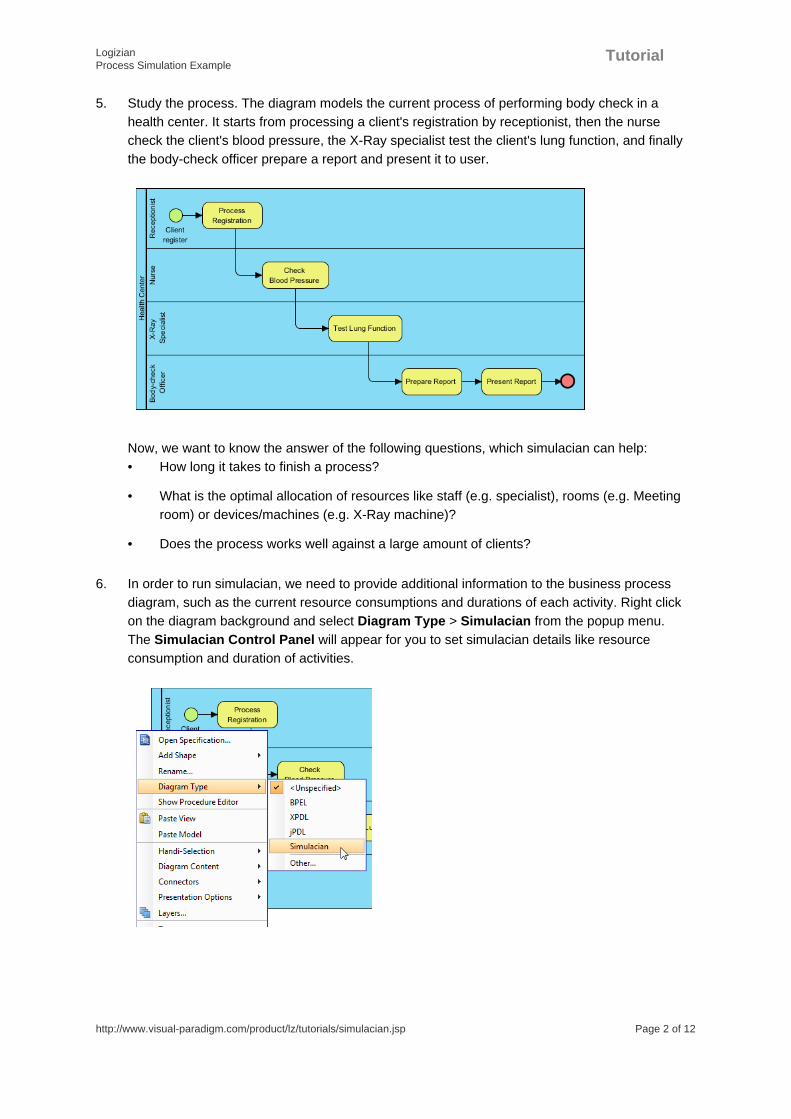
5. Study the process. The diagram models the current process of performing body check in ahealth center. It starts from processing a client's registration by receptionist, then the nursecheck the client's blood pressure, the X-Ray specialist test the client's lung function, and finallythe body-check officer prepare a report and present it to user.
Now, we want to know the answer of the following questions, which simulacian can help:• How long it takes to finish a process?
• What is the optimal allocation of resources like staff (e.g. specialist), rooms (e.g. Meetingroom) or devices/machines (e.g. X-Ray machine)?
• Does the process works well against a large amount of clients?
6. In order to run simulacian, we need to provide additional information to the business processdiagram, such as the current resource consumptions and durations of each activity. Right clickon the diagram background and select Diagram Type > Simulacian from the popup menu.The Simulacian Control Panel will appear for you to set simulacian details like resourceconsumption and duration of activities.
LogizianProcess Simulation Example
Tutorial
http://www.visual-paradigm.com/product/lz/tutorials/simulacian.jsp Page 3 of 12
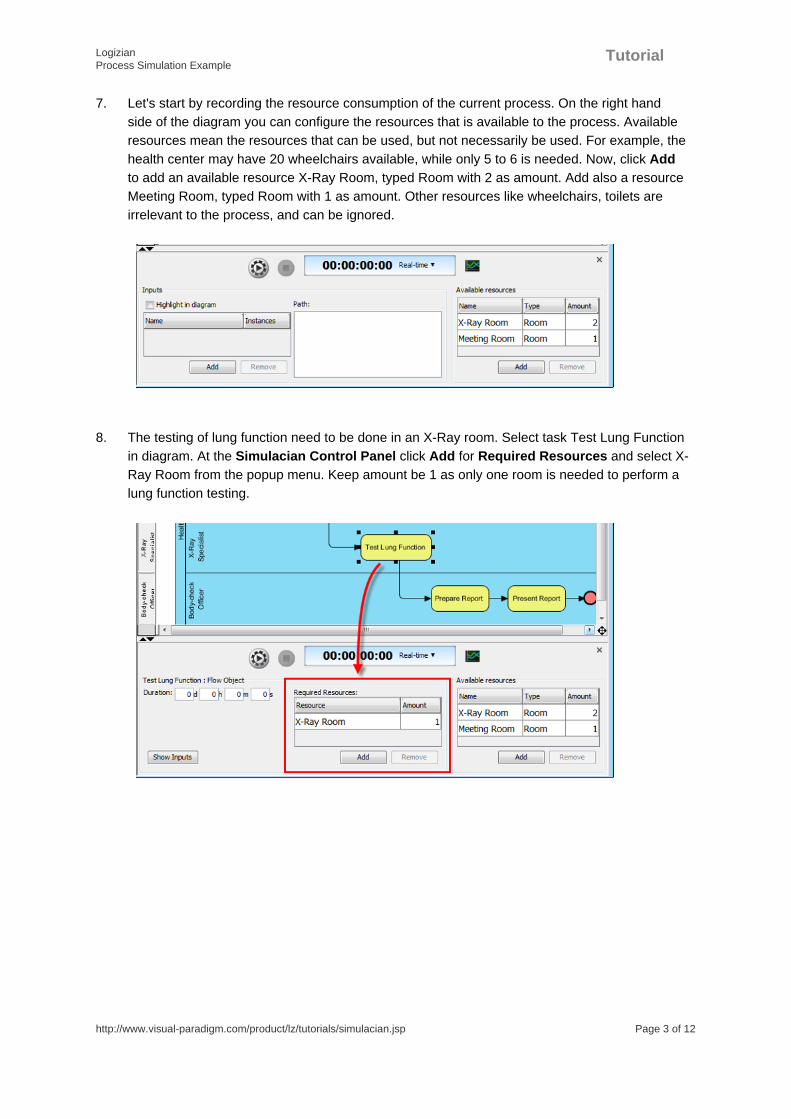
7. Let's start by recording the resource consumption of the current process. On the right handside of the diagram you can configure the resources that is available to the process. Availableresources mean the resources that can be used, but not necessarily be used. For example, thehealth center may have 20 wheelchairs available, while only 5 to 6 is needed. Now, click Addto add an available resource X-Ray Room, typed Room with 2 as amount. Add also a resourceMeeting Room, typed Room with 1 as amount. Other resources like wheelchairs, toilets areirrelevant to the process, and can be ignored.
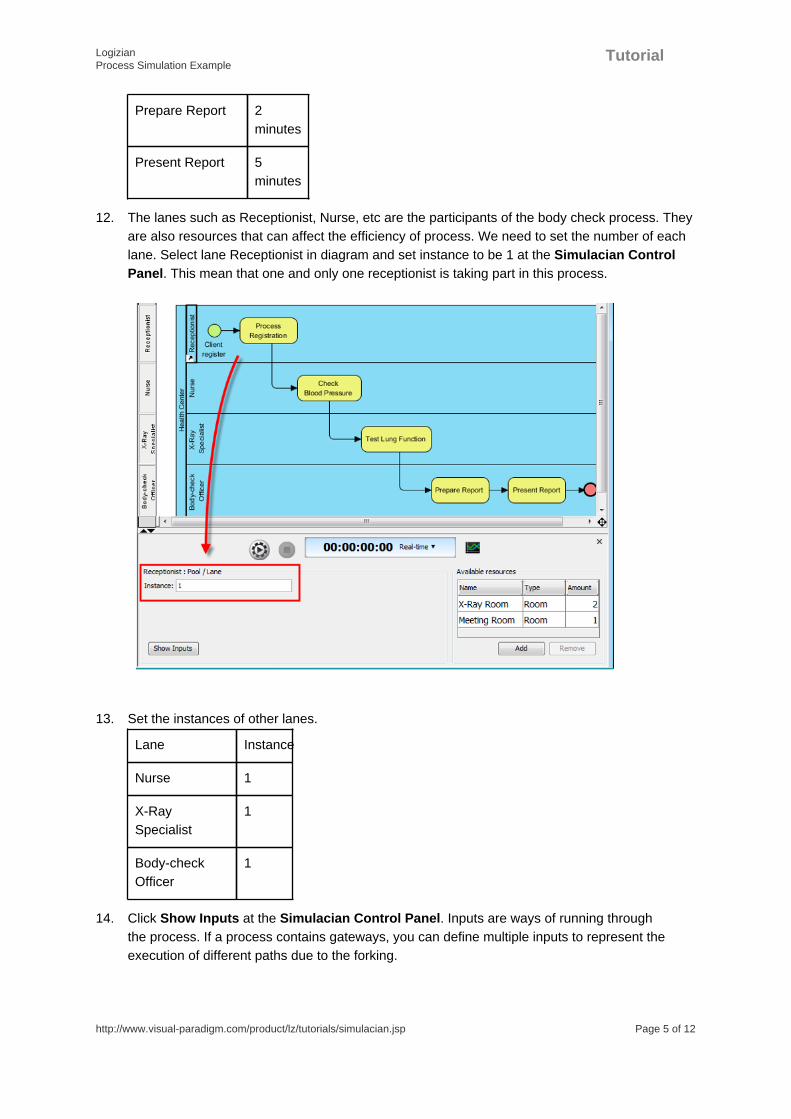
8. The testing of lung function need to be done in an X-Ray room. Select task Test Lung Functionin diagram. At the Simulacian Control Panel click Add for Required Resources and select X-Ray Room from the popup menu. Keep amount be 1 as only one room is needed to perform alung function testing.

LogizianProcess Simulation Example
Tutorial
http://www.visual-paradigm.com/product/lz/tutorials/simulacian.jsp Page 4 of 12
9. Select the task Present Report. Add Meeting Room as a required resource with 1 as amount.
10. We also need to set the duration of completing each task. Select task Process Registration.Set at the Simulacian Control Panel its duration to be 3, meaning that it takes 3 minutes tocomplete a registration process.
11. Set the duration of other tasks.
Task Duration
Check BloodPressure
2minutes
Test LungFunction
6minutes
LogizianProcess Simulation Example
Tutorial
http://www.visual-paradigm.com/product/lz/tutorials/simulacian.jsp Page 5 of 12
Prepare Report 2minutes
Present Report 5minutes
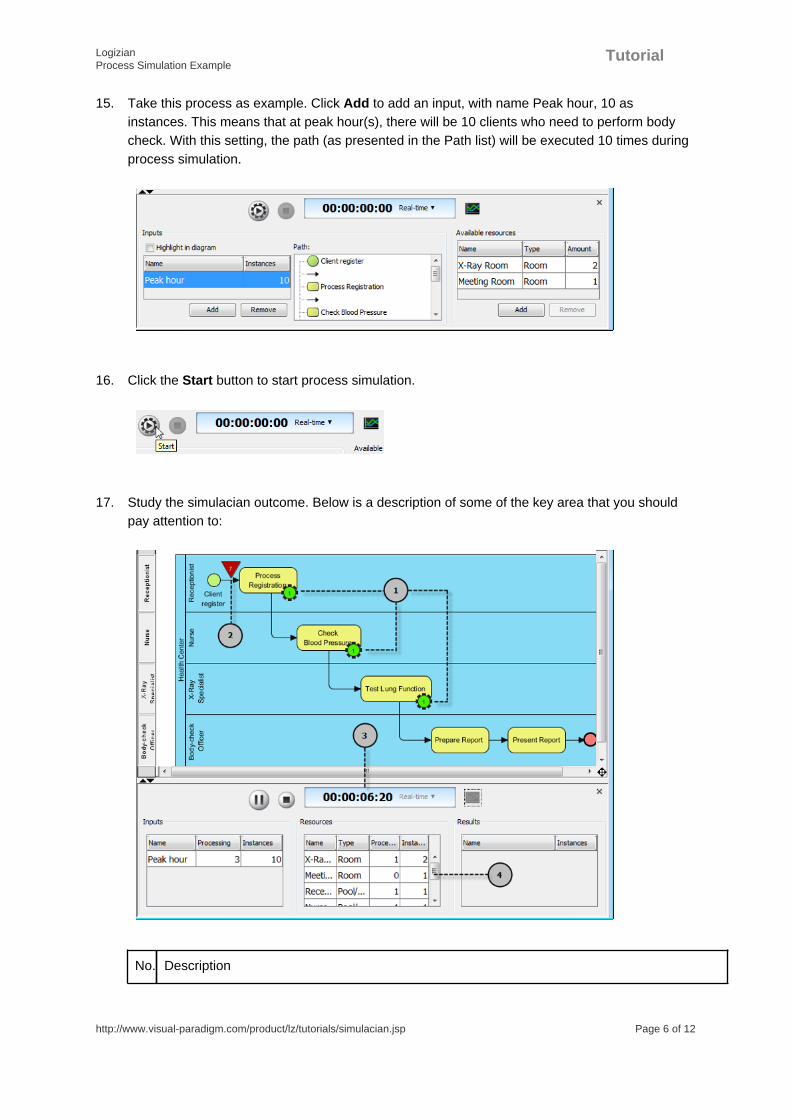
12. The lanes such as Receptionist, Nurse, etc are the participants of the body check process. Theyare also resources that can affect the efficiency of process. We need to set the number of eachlane. Select lane Receptionist in diagram and set instance to be 1 at the Simulacian ControlPanel. This mean that one and only one receptionist is taking part in this process.
13. Set the instances of other lanes.
Lane Instance
Nurse 1
X-RaySpecialist
1
Body-checkOfficer
1
14. Click Show Inputs at the Simulacian Control Panel. Inputs are ways of running throughthe process. If a process contains gateways, you can define multiple inputs to represent theexecution of different paths due to the forking.
LogizianProcess Simulation Example
Tutorial
http://www.visual-paradigm.com/product/lz/tutorials/simulacian.jsp Page 6 of 12
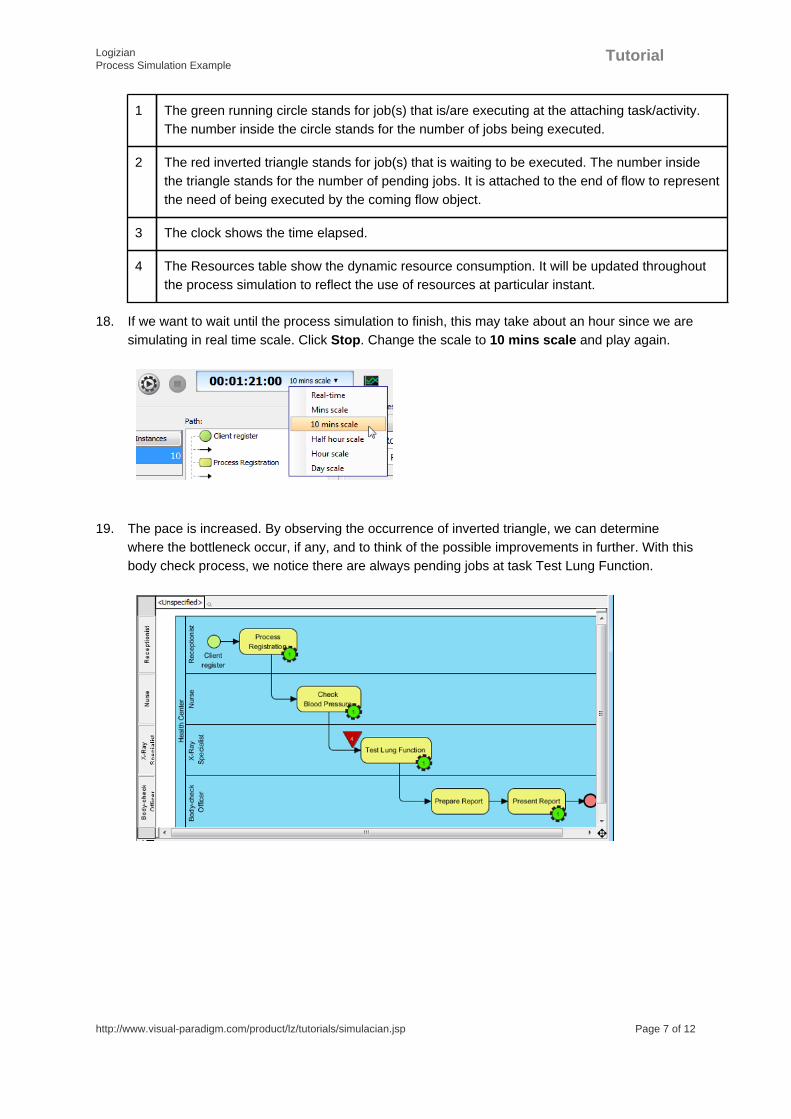
15. Take this process as example. Click Add to add an input, with name Peak hour, 10 asinstances. This means that at peak hour(s), there will be 10 clients who need to perform bodycheck. With this setting, the path (as presented in the Path list) will be executed 10 times duringprocess simulation.
16. Click the Start button to start process simulation.
17. Study the simulacian outcome. Below is a description of some of the key area that you shouldpay attention to:
No. Description
LogizianProcess Simulation Example
Tutorial
http://www.visual-paradigm.com/product/lz/tutorials/simulacian.jsp Page 7 of 12
1 The green running circle stands for job(s) that is/are executing at the attaching task/activity.The number inside the circle stands for the number of jobs being executed.
2 The red inverted triangle stands for job(s) that is waiting to be executed. The number insidethe triangle stands for the number of pending jobs. It is attached to the end of flow to representthe need of being executed by the coming flow object.
3 The clock shows the time elapsed.
4 The Resources table show the dynamic resource consumption. It will be updated throughoutthe process simulation to reflect the use of resources at particular instant.
18. If we want to wait until the process simulation to finish, this may take about an hour since we aresimulating in real time scale. Click Stop. Change the scale to 10 mins scale and play again.
19. The pace is increased. By observing the occurrence of inverted triangle, we can determinewhere the bottleneck occur, if any, and to think of the possible improvements in further. With thisbody check process, we notice there are always pending jobs at task Test Lung Function.

LogizianProcess Simulation Example
Tutorial
http://www.visual-paradigm.com/product/lz/tutorials/simulacian.jsp Page 8 of 12
20. Now, we need to decide how to improve the process. Since the bottleneck is at lung functiontesting, we need to decide how to speed it up. There are several possible actions we can do:• Reduce the duration of lung function testing
• Employ more specialist(s) to share the work load
Since the duration of proper lung function testing is fixed, the first action is impossible. We shalltake the second action.
21. Select lane X-Ray Specialist, change instance from 1 to 2.
22. Click Start to simulate again.
23. Strangely, the time it takes to finish the process remain the same, why? If you observe thesimulacian outcome, you can see that the task Test Lung Function is no longer the bottleneck,due to the addition of X-Ray specialist. However, the tasks Prepare Report and Present Reportnow become the bottleneck.

LogizianProcess Simulation Example
Tutorial
http://www.visual-paradigm.com/product/lz/tutorials/simulacian.jsp Page 9 of 12
24. Let's employ one more body check officer to help. Select lane Body-check Officer, changeinstance from 1 to 2.
25. Further to employing an officer to help, we need to reserve one more meeting room. Change theamount of available meeting room from 1 to 2.
26. Simulate again.
27. It now takes 50 minutes to complete the whole process. By comparing with the original process,the improvements reduce 30 minutes operation time in total.There are other possible solutions instead of employing more staff. For example, we cancomputerize the process by not presenting report to client, but to print it out with cleardescription on each checked item, and let the client read himself. We may also buy advanced X-Ray machines to speed up the lung function testing process. Simulacian does not recommenda solution to you, but to let you execute your idea of improvements easily through updatingdiagram content and resource allocation, and give you figures to show the effect of changes, tohelp you decide the best solution.

LogizianProcess Simulation Example
Tutorial
http://www.visual-paradigm.com/product/lz/tutorials/simulacian.jsp Page 10 of 12
28. Sometimes, just by watching the simulacian outcome is not enough in finding out the bottleneck,especially when the diagram is large, and have many, many bottlenecks. In such cases, you canproduce charts for simulacian outcome, which helps quantify resource consumption and queuingtime for each activity. Click Simulacian Charts in Simulacian Control Panel.
29. Study the chart in Completion page. The chart show the status of inputs completion againsttime. Remember we have set 10 instances to input Peak hour? From the chart you can see thecompletion of the 10 instances throughout the process simulation. As time goes by, there will bemore inputs being completed, and less inputs being processing.

LogizianProcess Simulation Example
Tutorial
http://www.visual-paradigm.com/product/lz/tutorials/simulacian.jsp Page 11 of 12
30. Open the Resource Usage page. The chart here shows the level of resource consumption.In this example, both X-Ray room and meeting room are fully used (100%) within the process,which is ideal. But if you try to add 3 to 4 available X-Ray rooms, and review the chart, you willsee that the peak usage will be less than 100% because some rooms are idles throughout thewhole process. By studying this chart, you can adjust the amount of resources to apply to theprocess.
LogizianProcess Simulation Example
Tutorial
http://www.visual-paradigm.com/product/lz/tutorials/simulacian.jsp Page 12 of 12
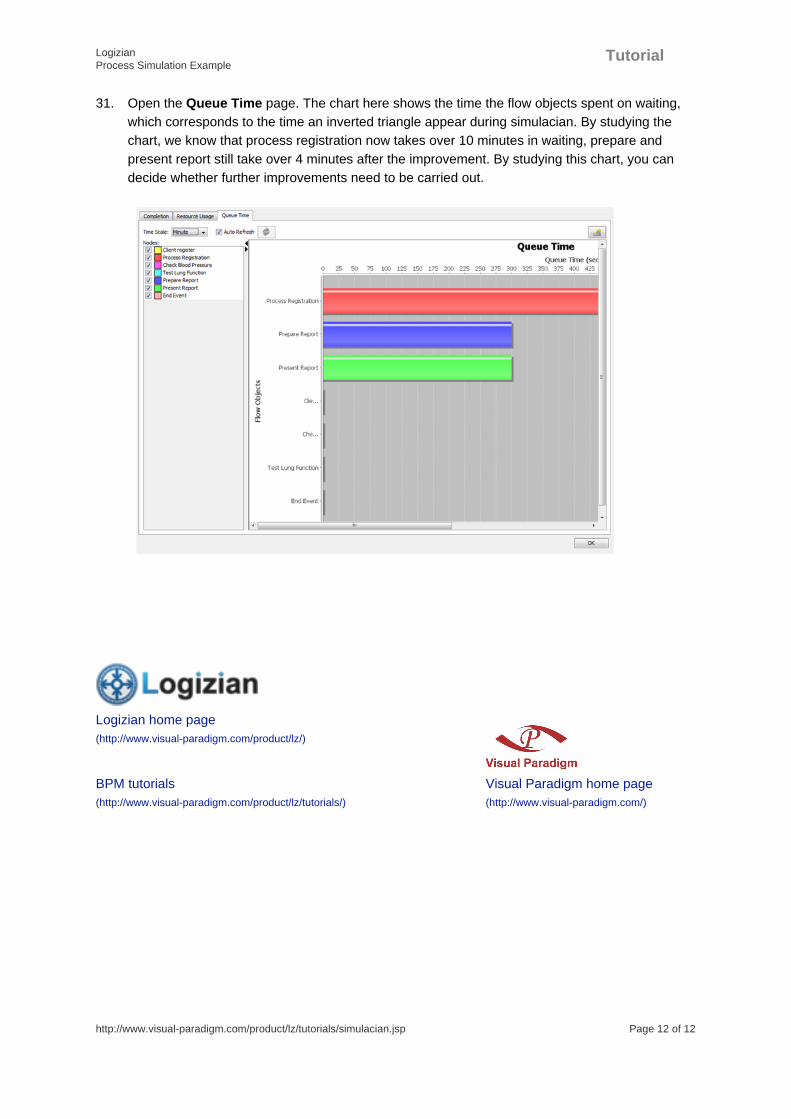
31. Open the Queue Time page. The chart here shows the time the flow objects spent on waiting,which corresponds to the time an inverted triangle appear during simulacian. By studying thechart, we know that process registration now takes over 10 minutes in waiting, prepare andpresent report still take over 4 minutes after the improvement. By studying this chart, you candecide whether further improvements need to be carried out.
Logizian home page(http://www.visual-paradigm.com/product/lz/)
BPM tutorials(http://www.visual-paradigm.com/product/lz/tutorials/)
Visual Paradigm home page(http://www.visual-paradigm.com/)

LogizianDevelop as-is and to-be business process
Tutorial
http://www.visual-paradigm.com/product/lz/tutorials/developasistobebpm.jsp Page 1 of 8
Develop as-is and to-be business processWritten Date : January 31, 2012
A business is almost always looking to maximize profitability. In the broadest sense, a businessusually aims to achieve that by trying their best to minimize cost or maximize revenue, or probablyboth. So companies are highly encouraged to improve how business runs in hopes to improveproductivity or deliver services more efficiently.
Business process improvement may come in some of the common forms below:
1. Technology adoption. For example, old-style stores perform operations by human. If wecomputerize a business for higher efficiency, it is very likely that the process will need to be re-engineered in order to reap the benefit from adding the computer system.
2. Changes in supplier/manufacturer/customer relations which require business process re-engineering. Perhaps customers are dissatisfied with the slow courier service. So you mustchange the courier company to avoid losing customers. Another case might be that the previoussupplier which used to deliver goods to you weekly cannot accommodate your new dailyschedule and leaves you no choice but to seek a new supplier that does. And it would probablycall for a process change in order to work with the new supplier.
3. Change of management direction and process obsolescence. Perhaps the management wantsto close down a department. If a process relies on that department, you have no choice but tomodify the process.
Attempting to improve a process begins with understanding how it works currently. Why not describethe process visually using graphical notation of a widely adopted industry standard? A visualrepresentation with a common ground means less confusion and saves more time for the actual re-engineering part. And that standard is called Business Process Modeling Notation (BPMN). In BPMN,the current process to be enhanced is called as-is process. After it gets re-designed, we call it to-beprocess.
Software tool we'll be usingIn this tutorial, we will be using Logizian to create BPMN-compliant business process diagrams. Itprovides a robust means to capture the current business process, design enhancement and identifythe enhancement between the current and enhanced processes.
Capture the Current Process in As-is Process

LogizianDevelop as-is and to-be business process
Tutorial
http://www.visual-paradigm.com/product/lz/tutorials/developasistobebpm.jsp Page 2 of 8
1. In the Model Explorer, right click on untitled and select Model > As-is Process.
2. In the Model Explorer, right click As-is Process and select Diagram > Business ProcessModeling > Business Process Diagram.

LogizianDevelop as-is and to-be business process
Tutorial
http://www.visual-paradigm.com/product/lz/tutorials/developasistobebpm.jsp Page 3 of 8
3. The example through which we'll demonstrate is about an online shop selling goods. Theprocess begins with the sales representative receiving a purchase order from a customer andproceeds to check stock level. If there is enough stock on hand to meet the order, the salesrepresentative will pack them. The process ends with shipping them along with an invoice.In case of insufficient stock, the sales representative will suggest the customer to amend thepurchase order.
We are not going to walk you through how to draw business process diagrams using BusinessProcess Modeling Notation (BPMN) here as we have another tutorial that covers it. We alsohave a tutorial video called Introduction to BPMN - Swimlanes that you might want to have alook.
Re-design to Enhance the Current Process in To-be ProcessLet's just say that our business has grown so much that we now have a warehouse to keep ourstocks. So we are looking to improve our current (as-is) process to best use the new resource. Andwe will show an example of modeling the enhancement below in a to-be process diagram.
LogizianDevelop as-is and to-be business process
Tutorial
http://www.visual-paradigm.com/product/lz/tutorials/developasistobebpm.jsp Page 4 of 8
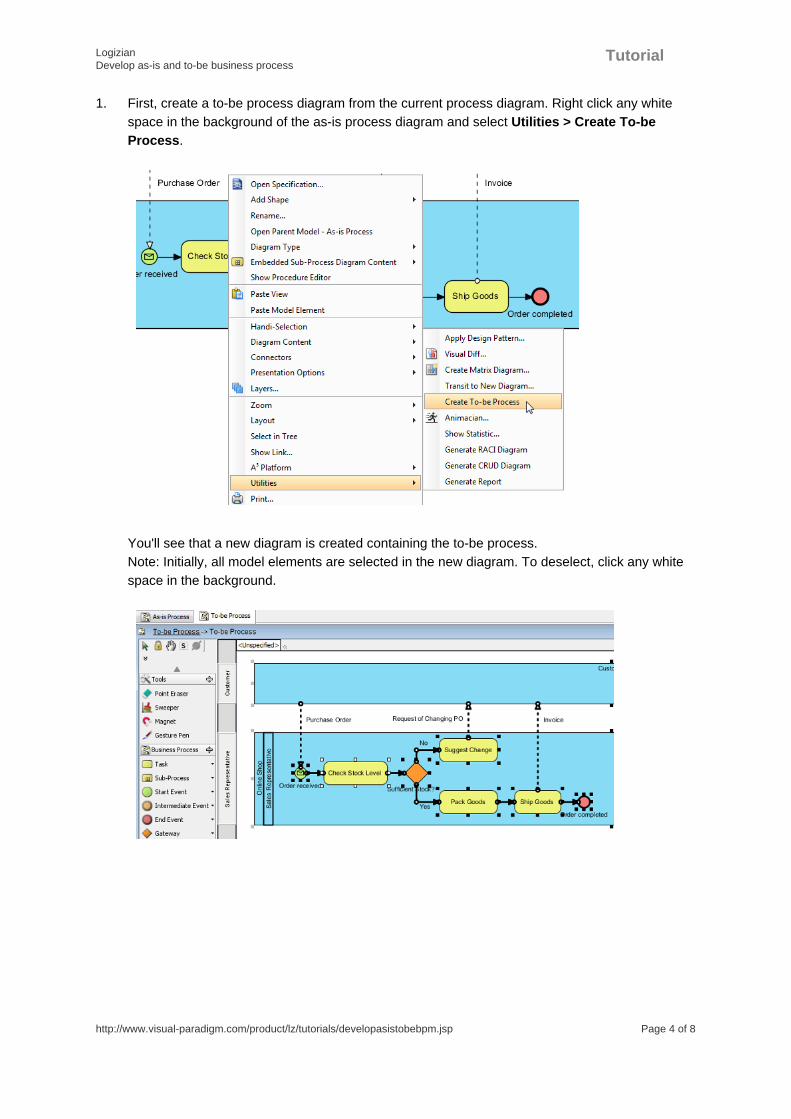
1. First, create a to-be process diagram from the current process diagram. Right click any whitespace in the background of the as-is process diagram and select Utilities > Create To-beProcess.
You'll see that a new diagram is created containing the to-be process.Note: Initially, all model elements are selected in the new diagram. To deselect, click any whitespace in the background.

LogizianDevelop as-is and to-be business process
Tutorial
http://www.visual-paradigm.com/product/lz/tutorials/developasistobebpm.jsp Page 5 of 8
2. Add a lane to Online Shop. Name it Warehouse. In the Sales Representative lane, selectPack Goods, Ship Goods and Order completed and drag them to the Warehouse lane
3. Next, we are going to insert a task between Sufficient Stock? and Pack Goods. Place yourmouse pointer over the Yes flow coming from Sufficient Stock?. Click on the bubble to showthe little cube icon. Click it to show the popup menu and select Task. Name the new taskRequest Pack Goods.
The completed to-be process diagram should look something like this.
Compare Changes in As-is Process and To-be ProcessTo compare differences between two diagrams visually, we can make use of a function called VisualDiff....
LogizianDevelop as-is and to-be business process
Tutorial
http://www.visual-paradigm.com/product/lz/tutorials/developasistobebpm.jsp Page 6 of 8
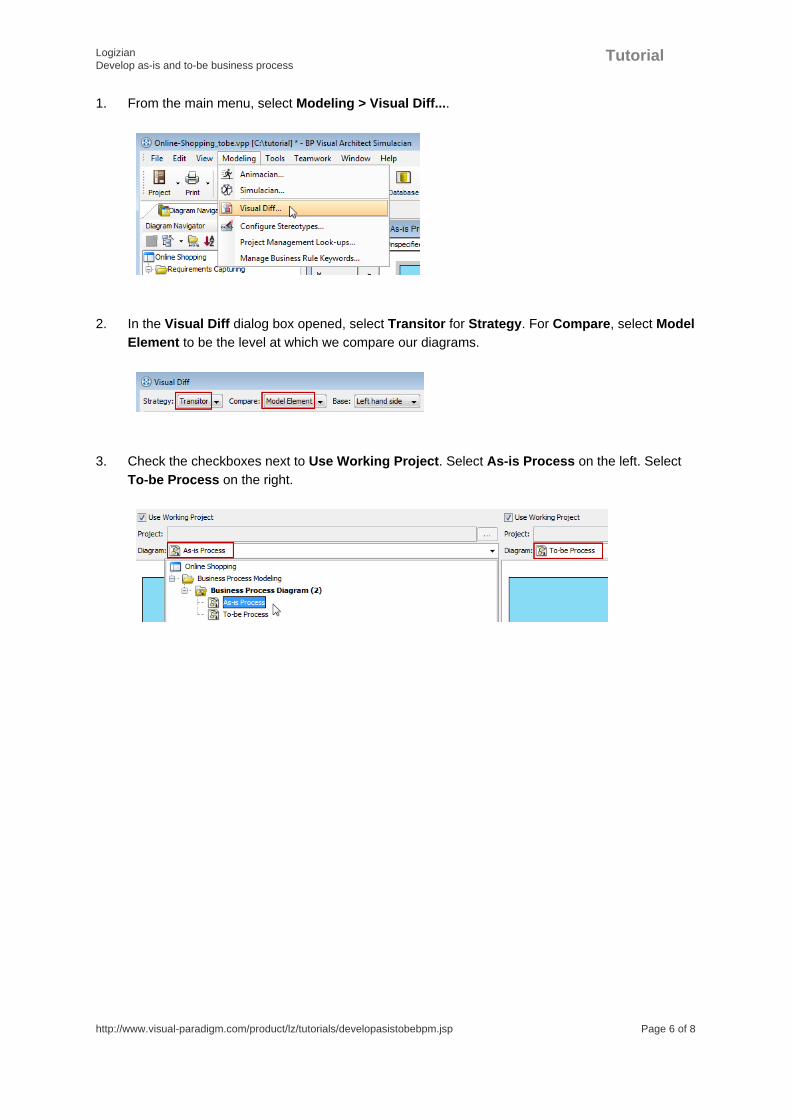
1. From the main menu, select Modeling > Visual Diff....
2. In the Visual Diff dialog box opened, select Transitor for Strategy. For Compare, select ModelElement to be the level at which we compare our diagrams.
3. Check the checkboxes next to Use Working Project. Select As-is Process on the left. SelectTo-be Process on the right.
LogizianDevelop as-is and to-be business process
Tutorial
http://www.visual-paradigm.com/product/lz/tutorials/developasistobebpm.jsp Page 7 of 8
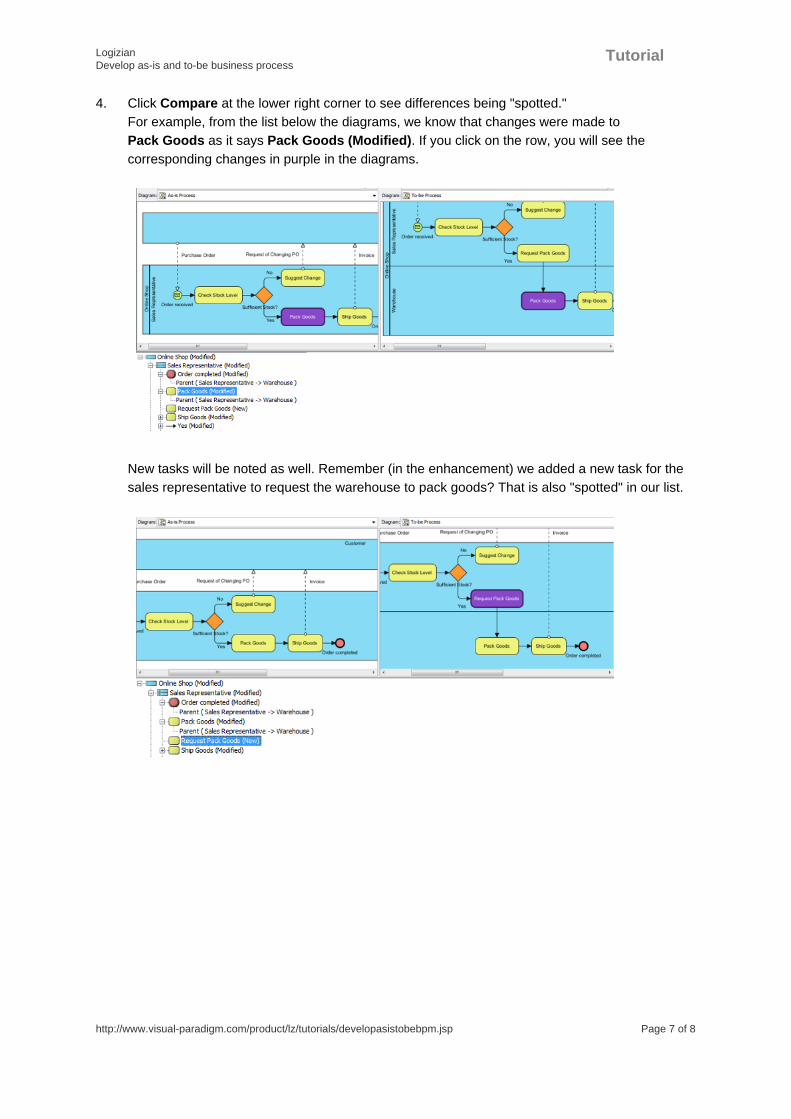
4. Click Compare at the lower right corner to see differences being "spotted."For example, from the list below the diagrams, we know that changes were made toPack Goods as it says Pack Goods (Modified). If you click on the row, you will see thecorresponding changes in purple in the diagrams.
New tasks will be noted as well. Remember (in the enhancement) we added a new task for thesales representative to request the warehouse to pack goods? That is also "spotted" in our list.
LogizianDevelop as-is and to-be business process
Tutorial
http://www.visual-paradigm.com/product/lz/tutorials/developasistobebpm.jsp Page 8 of 8
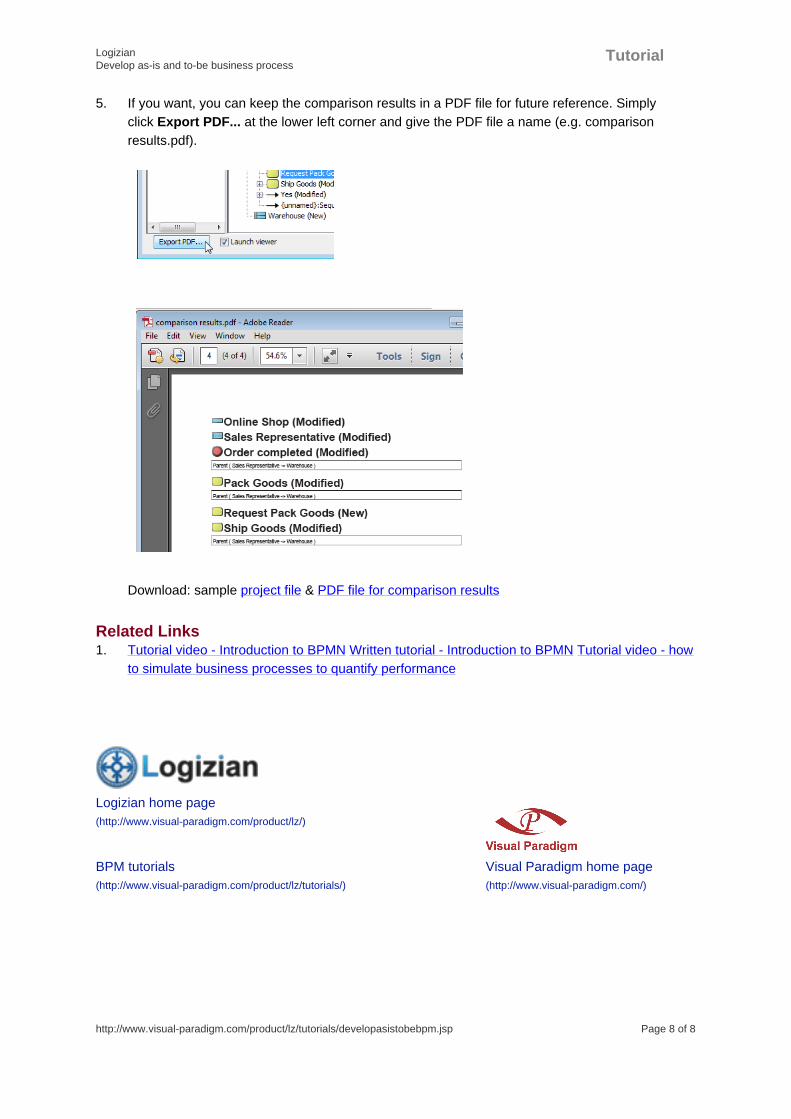
5. If you want, you can keep the comparison results in a PDF file for future reference. Simplyclick Export PDF... at the lower left corner and give the PDF file a name (e.g. comparisonresults.pdf).
Download: sample project file & PDF file for comparison results
Related Links1. Tutorial video - Introduction to BPMN Written tutorial - Introduction to BPMN Tutorial video - how
to simulate business processes to quantify performance
Logizian home page(http://www.visual-paradigm.com/product/lz/)
BPM tutorials(http://www.visual-paradigm.com/product/lz/tutorials/)
Visual Paradigm home page(http://www.visual-paradigm.com/)

Search...
Home Products LZ Tutorials Simulate Processes to Quantify Performance
What Logizian Provides What's New Tutorials Editions Resources
Relatively speaking, while it may take "little" money to design a business process, it takes a whole
lot more for implementation. So it is immensely important that we think twice to make sure that it is
worthwhile to do so beforehand. This is where computer simulation comes in to help via load and
performance testing. They give us some ideas as to how the system or process would behave
under the scenarios we defined, quantitatively, in terms of cost and time investment.
Simulate Processes to Quantify Performance
In this tutorial, we will show you how to set parameter values and create scenarios in order to run simulation. During the simulation, you will
see that the values on the time and cost meters change as the process moves along under those scenarios. At the end, you will find out the
total time and cost the process would require for completion, which give us a means to quantify the performance. If we simulate another
process design for the same goal and scenarios, we would have some metrics to compare the robustness among our different process
designs.
Modeling Software Tool
Logizian Simulacian Edition from Visual Paradigm
A Sample Business Process
As an example, we will look at the process of applying for a credit card at a fictional bank called ABC Bank. It involves the applicant, the front
desk and back office of the bank. The process begins with the front desk helping the applicant filling an application form. Completed
applications then go to the back office for verification. If the application is found to be lacking some supporting documents, the back office will
request the applicant for them. When there is sufficient information, the application will be processed. If it gets approved, a credit card will be
issued. If not, a rejection letter will be sent to the applicant for notification.
Download sample project file: Samples_Simulacian.vpp
Note: We are not going to show you how to draw the business process diagram step by step here because we have another tutorial which
covers that. If you would like to learn more about the drawing part (with BPMN), please read our tutorial of Introduction to BPMN Part I.
User Rating: / 3
January 26, 2012
Views: 2,636
PDF Link Add comments
Simulate Business Processes to Quantify Performance http://www.visual-paradigm.com/product/lz/tutorials/simulateprocesses.jsp
1 of 9 11/03/13 14:43

Steps to Set Up Process Simulation
Open the sample project file in Logizian Simulacian Edition.
Along with the business process diagram, we will be working with the simulation pane below.
If the simulation pane is not open already, from the main menu, select Modeling > Simulacian...
Set Time and Cost for Tasks
For each task, we will set the time and cost required to complete it once. For example, select the task called Assist application to fill
application form. For duration, enter 30 in the box to the left of the letter m (for 30 minutes). For cost, enter 10.0 for ten U.S. dollars.
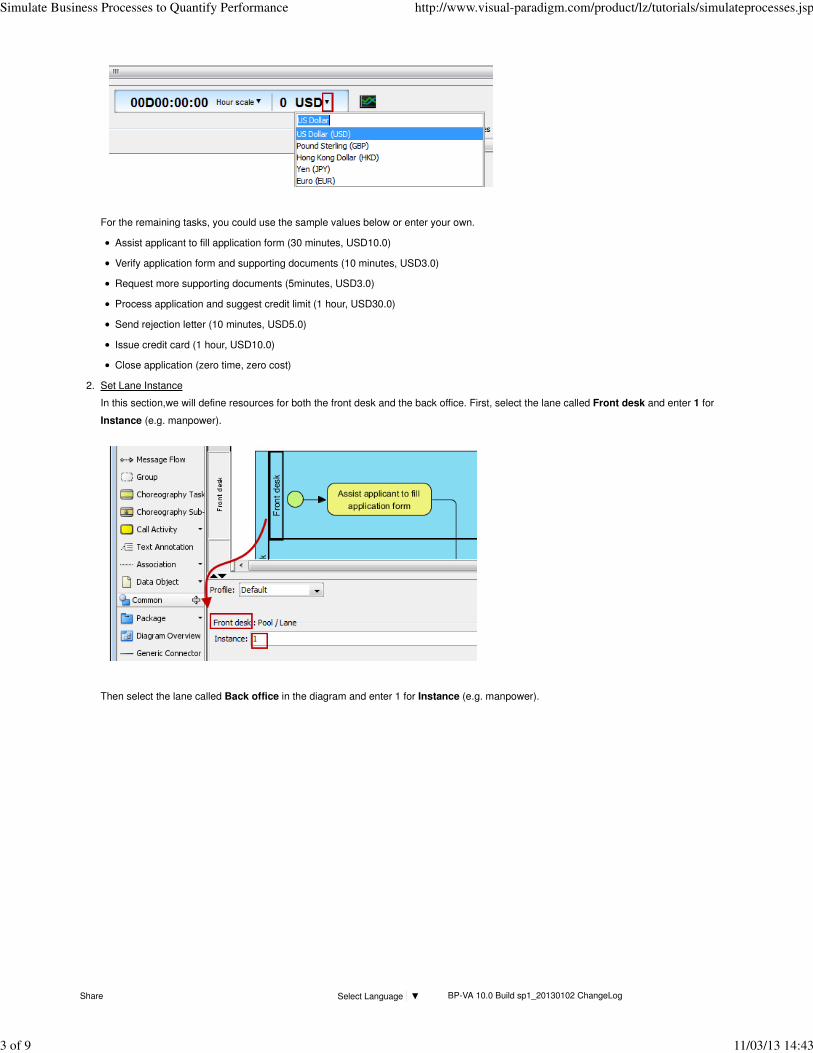
The default currency is USD. But you can always change it to tailor your need.
1.
Share Select Language ▼ BP-VA 10.0 Build sp1_20130102 ChangeLog
Simulate Business Processes to Quantify Performance http://www.visual-paradigm.com/product/lz/tutorials/simulateprocesses.jsp
2 of 9 11/03/13 14:43
For the remaining tasks, you could use the sample values below or enter your own.
Assist applicant to fill application form (30 minutes, USD10.0)
Verify application form and supporting documents (10 minutes, USD3.0)
Request more supporting documents (5minutes, USD3.0)
Process application and suggest credit limit (1 hour, USD30.0)
Send rejection letter (10 minutes, USD5.0)
Issue credit card (1 hour, USD10.0)
Close application (zero time, zero cost)
Set Lane Instance
In this section,we will define resources for both the front desk and the back office. First, select the lane called Front desk and enter 1 for
Instance (e.g. manpower).
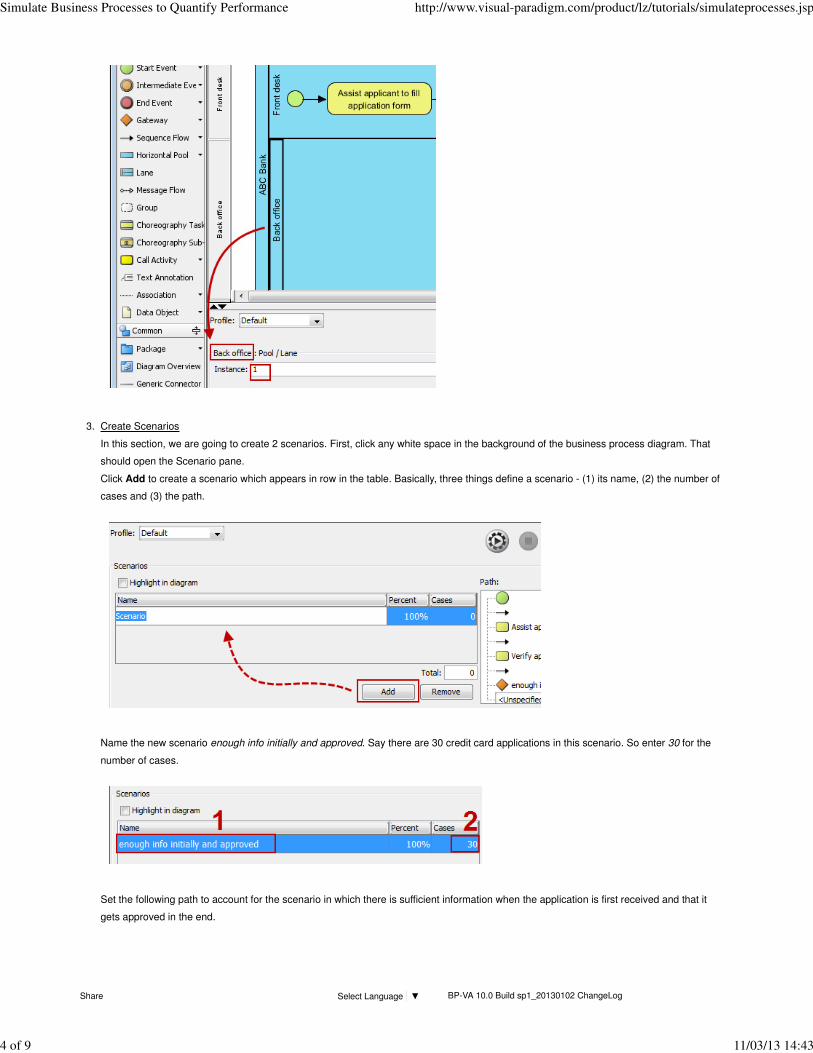
Then select the lane called Back office in the diagram and enter 1 for Instance (e.g. manpower).
2.
Share Select Language ▼ BP-VA 10.0 Build sp1_20130102 ChangeLog
Simulate Business Processes to Quantify Performance http://www.visual-paradigm.com/product/lz/tutorials/simulateprocesses.jsp
3 of 9 11/03/13 14:43
Create Scenarios
In this section, we are going to create 2 scenarios. First, click any white space in the background of the business process diagram. That
should open the Scenario pane.
Click Add to create a scenario which appears in row in the table. Basically, three things define a scenario - (1) its name, (2) the number of
cases and (3) the path.
Name the new scenario enough info initially and approved. Say there are 30 credit card applications in this scenario. So enter 30 for the
number of cases.
Set the following path to account for the scenario in which there is sufficient information when the application is first received and that it
gets approved in the end.
3.
Share Select Language ▼ BP-VA 10.0 Build sp1_20130102 ChangeLog
Simulate Business Processes to Quantify Performance http://www.visual-paradigm.com/product/lz/tutorials/simulateprocesses.jsp
4 of 9 11/03/13 14:43

Tip: If you check the checkbox next to highlight in diagram, you will see the path visually in the business process diagram in highlight
(e.g. purple) as you define it in the list.
Then create another scenario called requested more info and approved to account for applications that didn't come in with sufficient
information initially and only get processed after requesting for additional information. But in the end, they get approved.
Share Select Language ▼ BP-VA 10.0 Build sp1_20130102 ChangeLog
Simulate Business Processes to Quantify Performance http://www.visual-paradigm.com/product/lz/tutorials/simulateprocesses.jsp
5 of 9 11/03/13 14:43

Simulate
After setting up the scenarios, we are now ready to simulate them. To start it, simply click the start button.
You are free to pause the simulation any time by clicking the pause button. For example, so far the process has taken 0 days 7 hours 30
minutes 0 seconds. And a cost of USD320 has been accrued.
During the simulation, you will see 2 symbols in the diagram - red inverted triangles and green gears. Take the below diagram as an
example. There are 2 applications (after requesting and receiving additional supporting documents) now pending to be processed for a
credit limit. Meanwhile, at this very moment, there are 6 applications (that came with enough information when first received) now pending
to be processed, just like the other 2 waiting in queue. The green gear shows that there is one application currently being processed by that
task.
As the simulation ends, you can read the meter and see the total time and cost for that process (e.g. 3 days 4 hours 45 minutes 0 seconds
and USD1,870). The red inverted triangles and green gears should all have disappeared by now.
4.
Share Select Language ▼ BP-VA 10.0 Build sp1_20130102 ChangeLog
Simulate Business Processes to Quantify Performance http://www.visual-paradigm.com/product/lz/tutorials/simulateprocesses.jsp
6 of 9 11/03/13 14:43
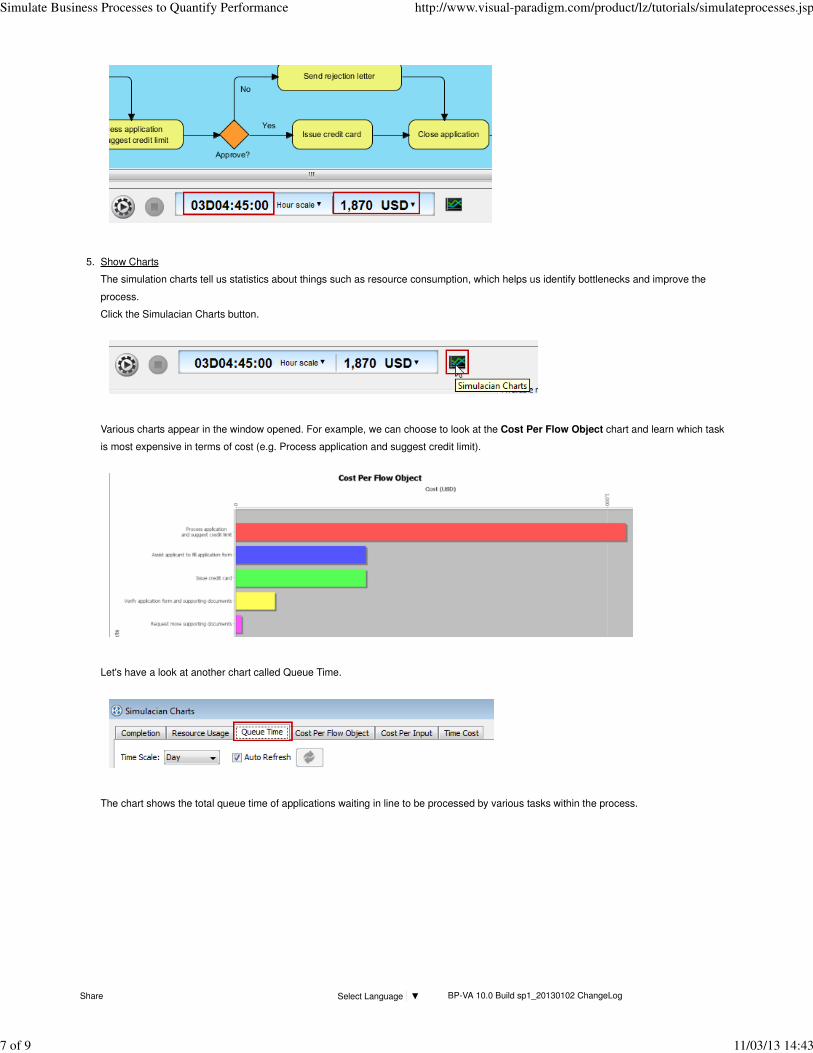
Show Charts
The simulation charts tell us statistics about things such as resource consumption, which helps us identify bottlenecks and improve the
process.
Click the Simulacian Charts button.
Various charts appear in the window opened. For example, we can choose to look at the Cost Per Flow Object chart and learn which task
is most expensive in terms of cost (e.g. Process application and suggest credit limit).
Let's have a look at another chart called Queue Time.
The chart shows the total queue time of applications waiting in line to be processed by various tasks within the process.
5.
Share Select Language ▼ BP-VA 10.0 Build sp1_20130102 ChangeLog
Simulate Business Processes to Quantify Performance http://www.visual-paradigm.com/product/lz/tutorials/simulateprocesses.jsp
7 of 9 11/03/13 14:43
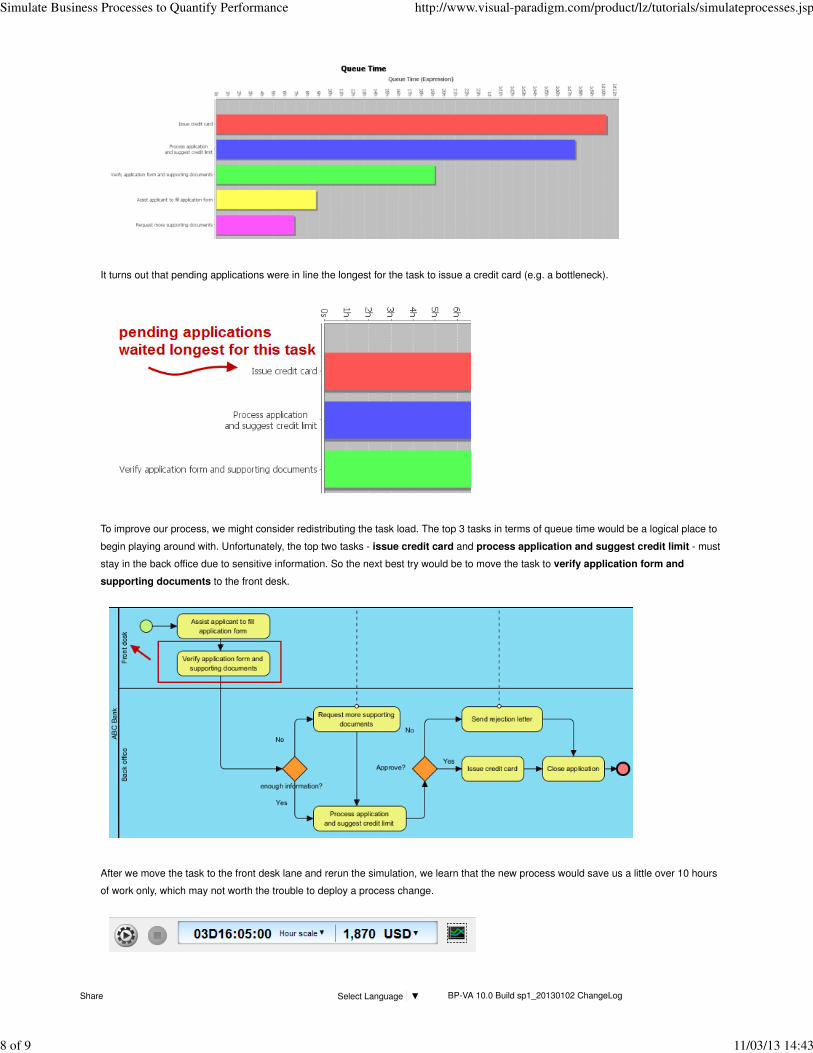
It turns out that pending applications were in line the longest for the task to issue a credit card (e.g. a bottleneck).
To improve our process, we might consider redistributing the task load. The top 3 tasks in terms of queue time would be a logical place to
begin playing around with. Unfortunately, the top two tasks - issue credit card and process application and suggest credit limit - must
stay in the back office due to sensitive information. So the next best try would be to move the task to verify application form and
supporting documents to the front desk.
After we move the task to the front desk lane and rerun the simulation, we learn that the new process would save us a little over 10 hours
of work only, which may not worth the trouble to deploy a process change.
Share Select Language ▼ BP-VA 10.0 Build sp1_20130102 ChangeLog
Simulate Business Processes to Quantify Performance http://www.visual-paradigm.com/product/lz/tutorials/simulateprocesses.jsp
8 of 9 11/03/13 14:43

Cimino – Modeling and Simulation of Business Processes using BPMN 2.0 – Tutorial 5 – 1 of 15
The process of bag manufacturing
• The figure outlines the macro processes of bag manufacturing in a workshop. First,
cutting and preparing components, where semi-finished products originate; then,
assembling and checking against quality. If products are good, they are packed and
shipped out. Otherwise corrective actions are triggered to handle error (not modeled).
• In the two exclusive gateways, the make-or-buy business decision is made, by
comparing the costs and benefits of carrying out internal or external manufacturing
of product components, via outsourcing to a third party specialist.

Cimino – Modeling and Simulation of Business Processes using BPMN 2.0 – Tutorial 5 – 2 of 15
1. Select each task, and insert duration and cost per execution.
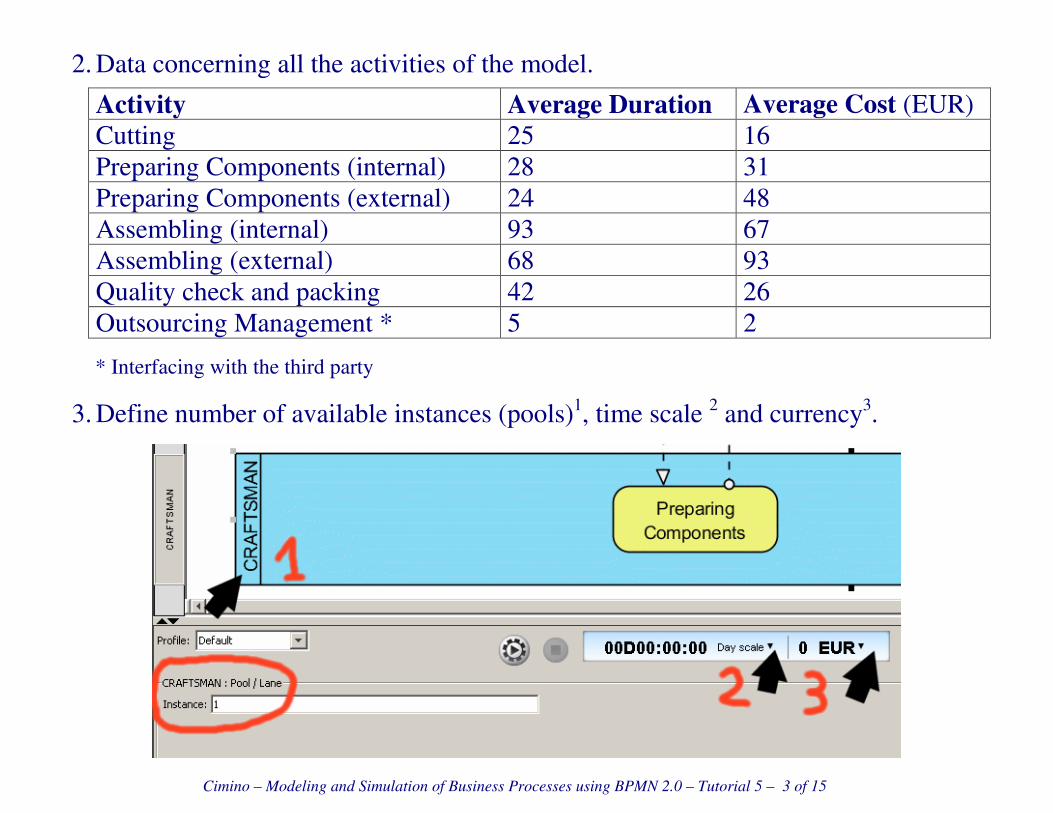
Cimino – Modeling and Simulation of Business Processes using BPMN 2.0 – Tutorial 5 – 3 of 15
2. Data concerning all the activities of the model.
Activity Average Duration Average Cost (EUR)
Cutting 25 16
Preparing Components (internal) 28 31
Preparing Components (external) 24 48
Assembling (internal) 93 67
Assembling (external) 68 93
Quality check and packing 42 26
Outsourcing Management * 5 2
* Interfacing with the third party
3. Define number of available instances (pools)1, time scale 2 and currency3.
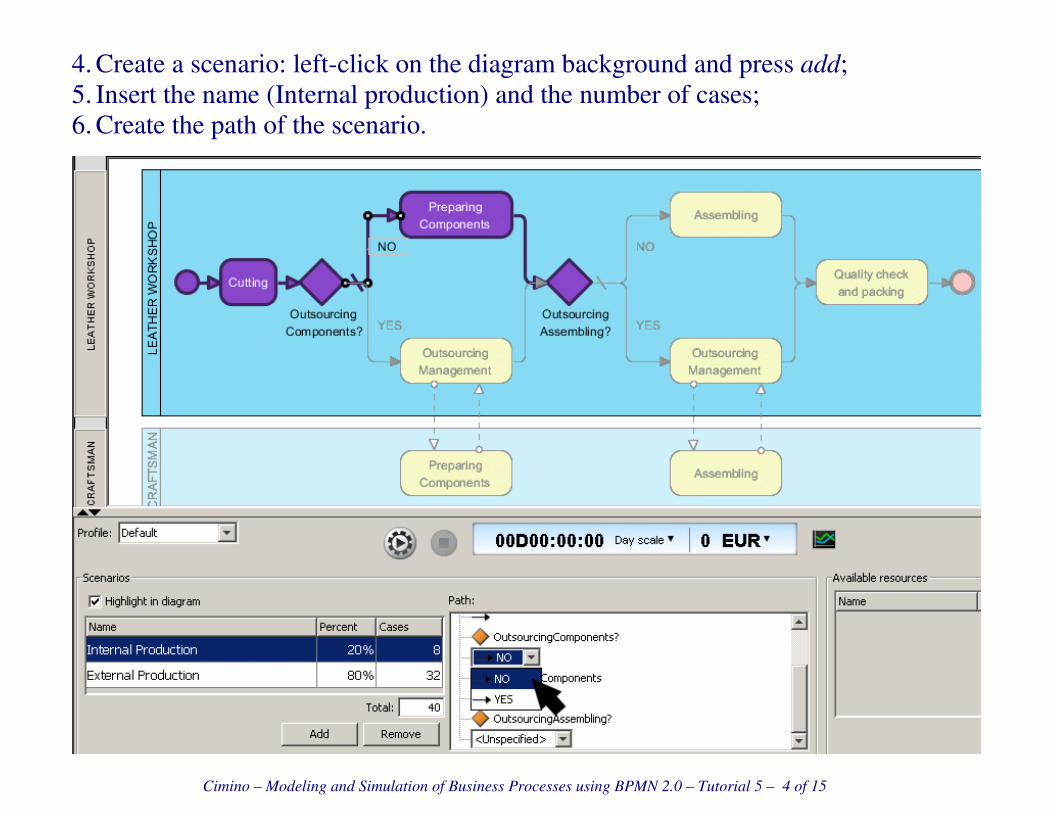
Cimino – Modeling and Simulation of Business Processes using BPMN 2.0 – Tutorial 5 – 4 of 15
4. Create a scenario: left-click on the diagram background and press add;
5. Insert the name (Internal production) and the number of cases;
6. Create the path of the scenario.
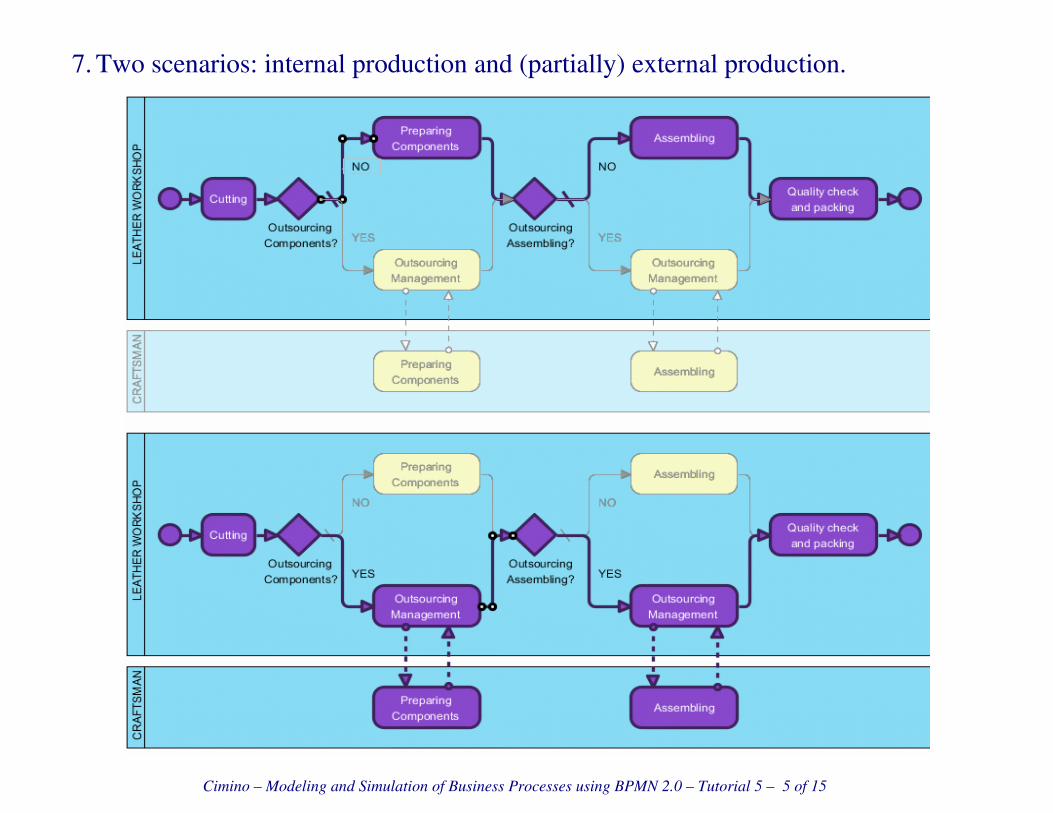
Cimino – Modeling and Simulation of Business Processes using BPMN 2.0 – Tutorial 5 – 5 of 15
7. Two scenarios: internal production and (partially) external production.

Cimino – Modeling and Simulation of Business Processes using BPMN 2.0 – Tutorial 5 – 6 of 15
8. Click the Play/Stop/Pause buttons to simulate;
9. Look at the red inverted triangles (tokens queues) and at the the green gears
(processing tokens);
10. Look at the final duration and cost;
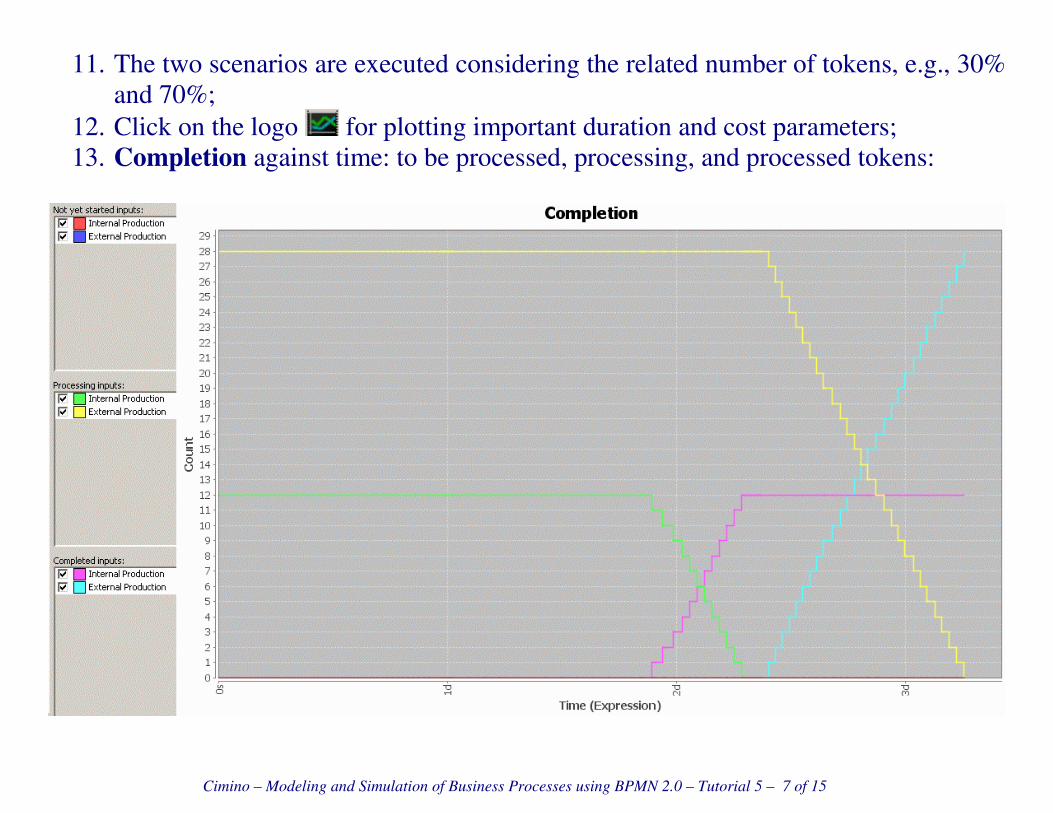
Cimino – Modeling and Simulation of Business Processes using BPMN 2.0 – Tutorial 5 – 7 of 15
11. The two scenarios are executed considering the related number of tokens, e.g., 30%
and 70%;
12. Click on the logo for plotting important duration and cost parameters;
13. Completion against time: to be processed, processing, and processed tokens:

Cimino – Modeling and Simulation of Business Processes using BPMN 2.0 – Tutorial 5 – 8 of 15
14. Resource usage against time:

Cimino – Modeling and Simulation of Business Processes using BPMN 2.0 – Tutorial 5 – 9 of 15
15. Queue time
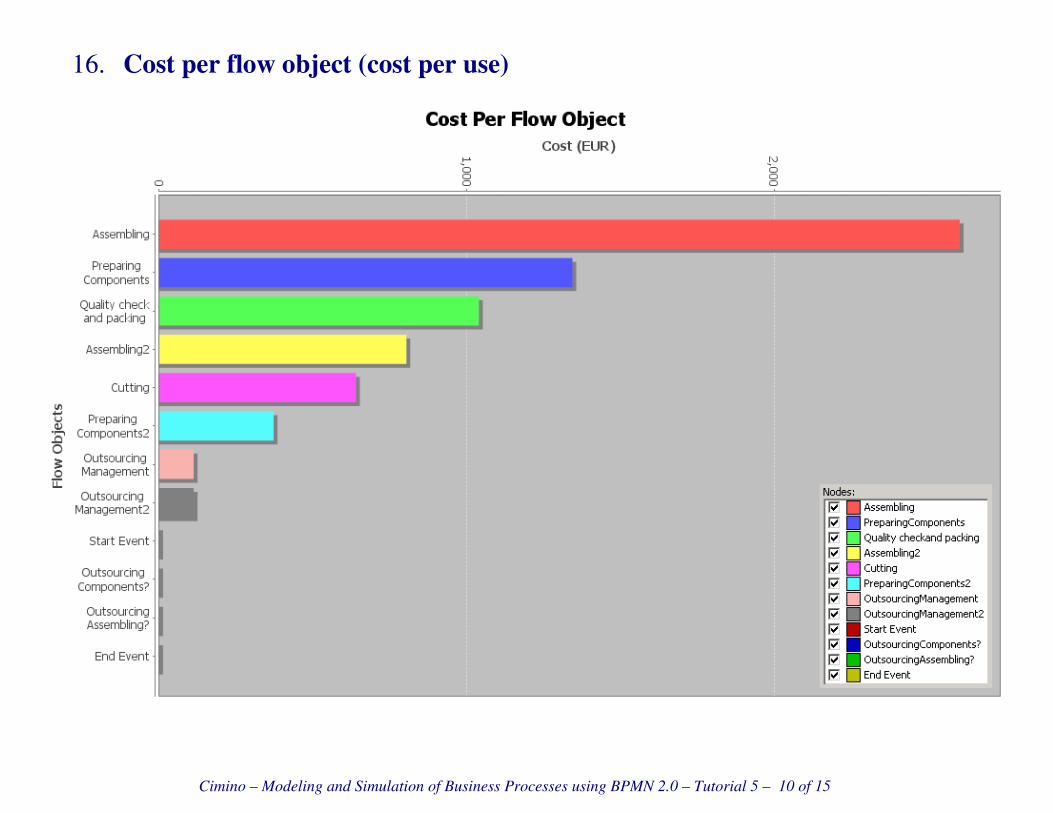
Cimino – Modeling and Simulation of Business Processes using BPMN 2.0 – Tutorial 5 – 10 of 15
16. Cost per flow object (cost per use)

Cimino – Modeling and Simulation of Business Processes using BPMN 2.0 – Tutorial 5 – 11 of 15
17. Other costs
18. Time Cost
Cimino – Modeling and Simulation of Business Processes using BPMN 2.0 – Tutorial 5 – 12 of 15
19. Exercise
Suppose to aim at producing 40 bags, by combining internal and external production
scenarios, with a single bag workshop and a single third party specialist.
Simulate:
a) a scenario of totally internal production; analyze results/plots;
b) a scenario of partially external production; analyze results/plots;
c) find a combination of the two scenarios so as to carry out the process in both less
time and cost, with respect to (a) and (b).

Cimino – Modeling and Simulation of Business Processes using BPMN 2.0 – Tutorial 5 – 13 of 15
Solution
Let x1 be the percentage of bags that are produced internally, and y(x) the total
duration of the production process of 40 bags.
a) x1=100% → 5g 5h 20' 5600€, with maximum queues on the last phases, due to
the sequential character of the workflow;
b) x1=0% → 3g 6h 52' 7640€, with maximum queues on the assembling stage,
which is a process with larger duration, with respect to the other processes;
c) by carrying out internally some units, the assembling is parallelized, thus reducing
queuing effects, and then saving total time and cost; e.g.. x1=20% → 3g 2h 38'
7232€;
d) In the context of luxury handbags production, for a given quality level that is
guaranteed by the control quality process, the total duration of the process is the
main Key Performance Indicator (KPI), rather than the total production cost;
e) Is 20% the best solution in terms of total duration? Assuming that there is a
unique minimum, it can be efficiently found by using a binary search;
f) Given x1 and x3, calculate the total duration of the process for x1, x3, and for the
center x2=(x1+x3)/2, as well as for a value very close (dx) to each of these points.
On the basis of the descent direction we can establish the position of the
optimum with respect to the center.

Cimino – Modeling and Simulation of Business Processes using BPMN 2.0 – Tutorial 5 – 14 of 15
g) e.g. if the total duration goes down on the right side of x1, and on the left sides of
x2 and x3, then the minimum is between x1 and x2.
h) By carrying out 8 simulations, it can be determined that the optimum is located at
x=12-13%, i.e., 5 bags produced internally and 35 externally, with a total
duration of 3d 16m, and a total cost of 7385€.
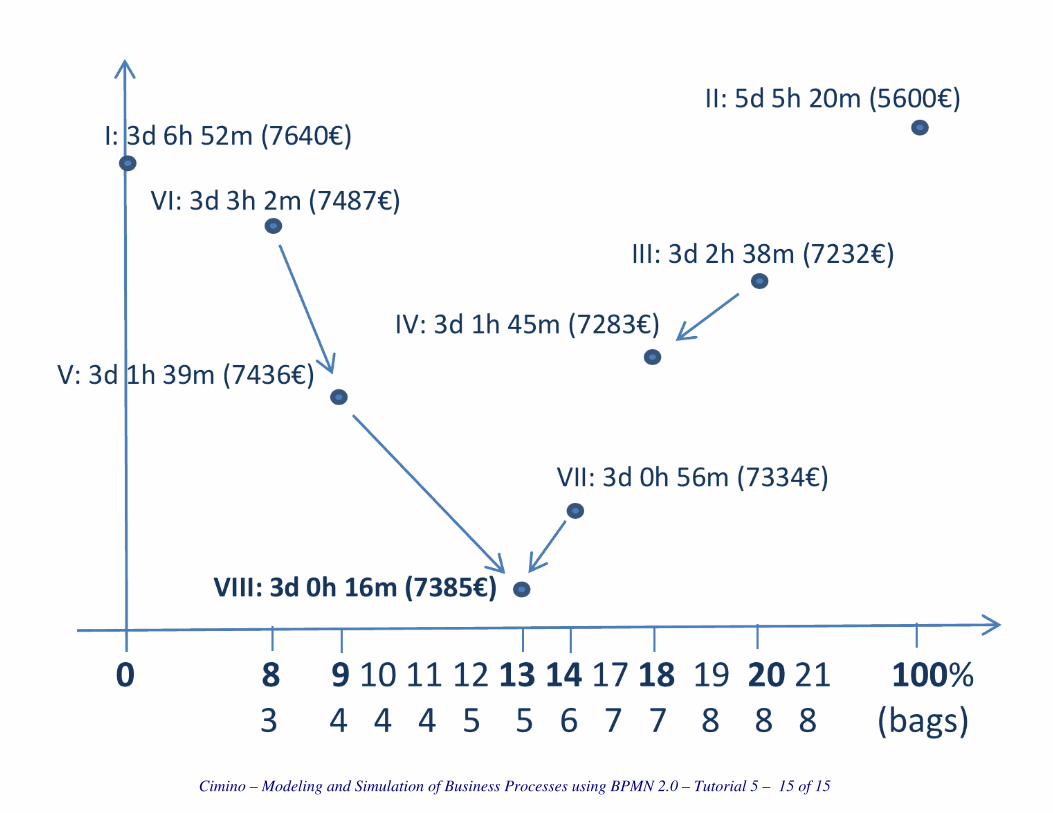
Cimino – Modeling and Simulation of Business Processes using BPMN 2.0 – Tutorial 5 – 15 of 15

Cimino – Modeling and Simulation of Business Processes using BPMN 2.0 – Tutorial 6 – 1 of 6
Selecting the best configuration for a Hospital Emergency Center
a. Consider the operation of a Hospital Emergency Center (HEC). The process begins
when a patient arrives through the Acceptation process in the Entrance Room of the
HEC, and ends when a patient is either released from the HEC or admitted into the
hospital for further treatment.
b. Patients arriving on their own, after acceptation, sign in, and then are assessed in
terms of their condition (triage). Depending on their condition, patients must then go
through the registration process and through the treatment process before being
released or admitted into the hospital.
c. Arriving patients are classified into different codes (levels), according to their
condition. With Red Code, patients are more critical than with Yellow and Green
codes. Indeed, Red Code patients are taken to an Emergency Room (ER)
immediately after acceptation. Once in the room, they undergo their treatment.
Finally, they complete the registration process before being either released or
admitted into the hospital for further treatment. Patients arriving by ambulance are
directly classified with Red Code.
d. Yellow and Green code patients must first sign in with an Administrative Clerk.
After signing in, their condition is assessed by a Triage Nurse, and then they are

Cimino – Modeling and Simulation of Business Processes using BPMN 2.0 – Tutorial 6 – 2 of 6
taken to an Emergency room. Once in the room, Yellow and Green code patients
must first complete their registration, then go on to receive their treatment, and,
finally, they are either released or admitted into the hospital for further treatment.
e. The treatment process consists of the following activities:
1. A secondary assessment performed by a nurse and a physician.
2. Laboratory tests, performed by a patient care technician.
3. The treatment itself, performed by a nurse and a physician.
f. The registration process consists of the following activities:
1. A data collection activity performed by an Administrative Clerk.
2. An additional data collection activity performed by an Administrative Clerk, in
case the patient has Worker’s Compensation Insurance.
3. A printing of the patient’s medical chart for future reference, performed by an
Administrative Clerk.
g. Finally, 90% of all patients (regardless of the assigned code) are released from the
HEC, while the remaining 10% are admitted into the hospital for further treatment.
The final release/hospital admission process consists of the following activities:
1. In case of release, an administrative clerk fills out the release papers.
2. In case of admission into the hospital, an Administrative Clerk fills out the
patient’s admission papers. The patient must then wait for a hospital bed to

Cimino – Modeling and Simulation of Business Processes using BPMN 2.0 – Tutorial 6 – 3 of 6
become available (Admission). Finally, the patient is transferred to the hospital
bed.
h. The HEC has the following resources: nurses, physicians, technicians,
administrative clerks, Medical and Administrative rooms.
i. Due to cost and layout considerations, hospital administrators have determined that
the staffing level must not exceed 7+2 nurses, 3+1 physicians, 4 technicians, and
4+4 Administrative Clerks.
j. Furthermore, the HEC has 7 medical and 13 administrative rooms available;
however, using fewer rooms would be beneficial, since other departments in the
hospital could use the additional space more profitably. The hospital wants to find
the configuration of the above resources that minimizes the total asset cost. The asset
cost includes the staff’s hourly wages and the fixed cost of each room used. We must
also make sure that the total cost is lower than 300K$ and that, on average, patients
do not spend more than 6 hours in the HEC.
k. Summary of parameters and constraints
Resource or Activity Data or Constraints
Admission 90% of all patients are released
10% are admitted for further treatment

Cimino – Modeling and Simulation of Business Processes using BPMN 2.0 – Tutorial 6 – 4 of 6
By Ambulance 5.6 % of all patients
RED code 14.8 % of all patients
Available Nurses 7+2
Available Physicians 3+1
Available Technicians 4
Available Administrative Clerks 4+4
Available rooms 20 (using fewer rooms would be beneficial)
Staff’s hourly wages ($):
Nurse: 54.10
Physician: 78.70
Technician: 36.54
Admin: 29.03
Fixed Cost of each room used ($) 55800 (Medical Room)
13200 (Administrative Room)
Max Average Time spent per patient Less than or equal to 2h 24 m
Acceptation 30s / 0.24$ (1 Admin.)
Sign in (average duration/cost) 3m 12s / 1.55$ (1 Admin.)
Triage (average duration/cost) 5m 24s / 11.95$ (1 Nurse + 1 Phys.)
Registration (average duration/cost) 9m 30s / 4.59$ (1 Admin.)
Admission (average duration/cost) 3m 42s / 1.79$ (1 Admin.)
Release (average duration/cost) 2m 12s / 1.06$ (1 Admin.)
Treatment (average duration/cost) 25m 54s / 80.69$ (2 Nurses + 1 Phys.)
Arrangement (average duration/cost) 21m 15s / 10.28$ (1 Admin.)
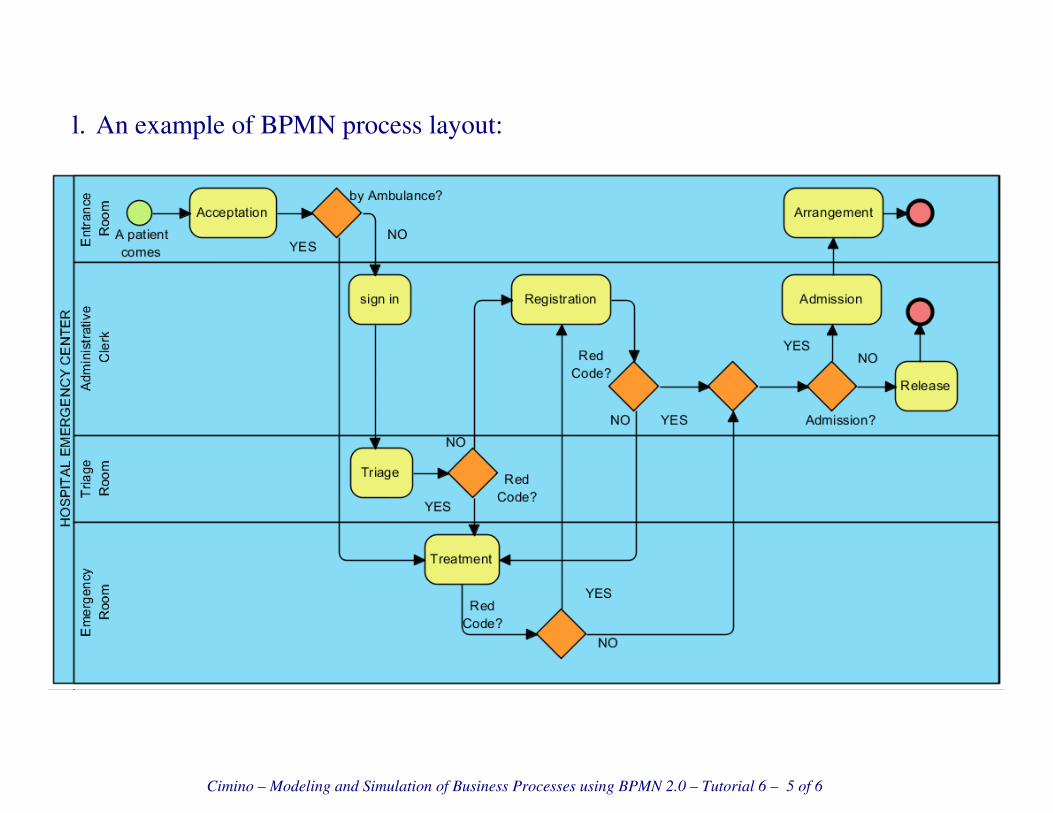
Cimino – Modeling and Simulation of Business Processes using BPMN 2.0 – Tutorial 6 – 5 of 6
l. An example of BPMN process layout:

Cimino – Modeling and Simulation of Business Processes using BPMN 2.0 – Tutorial 6 – 6 of 6
Exercise:
a. Create all scenarios according to the above constraints, for 100 patients.
b. Try the following configuration, and compute the average patient cycle time.
N. of Lanes Related Activities and required resources
1 Entrance Acceptation, Arrangement: 1 Admin Clerk + 1 Admin Room
3 Administrative
Service
Sign in, Registration, Admission, Release:
1 Adm Clerk + 1 Adm Room
1 Triage Triage: 1 Nurse + 1 Physician + 1 Medical Room
2 Emergency Treatment: 2 Nurses + 1 Physician + 1 Techn + 1 Med Room
c. Discover other configurations, able to decrease the average patient cycle time
d. Redesign some features of the model to improve the cycle time of patients. In the
new model, we assume that patients can go through the treatment process and the
registration process in parallel. That is, we assume that, while the patient is
undergoing treatment, the registration process is being done by a surrogate or
whoever is accompanying the patient. If the patient’s condition is very critical,
someone else can provide the registration data; however, if the patient’s condition
allows it, then the patient can provide the registration data during treatment.
e. Compute the Total Asset Cost for this configuration, and discover some optimal
solution that minimizes the average patient cycle time.
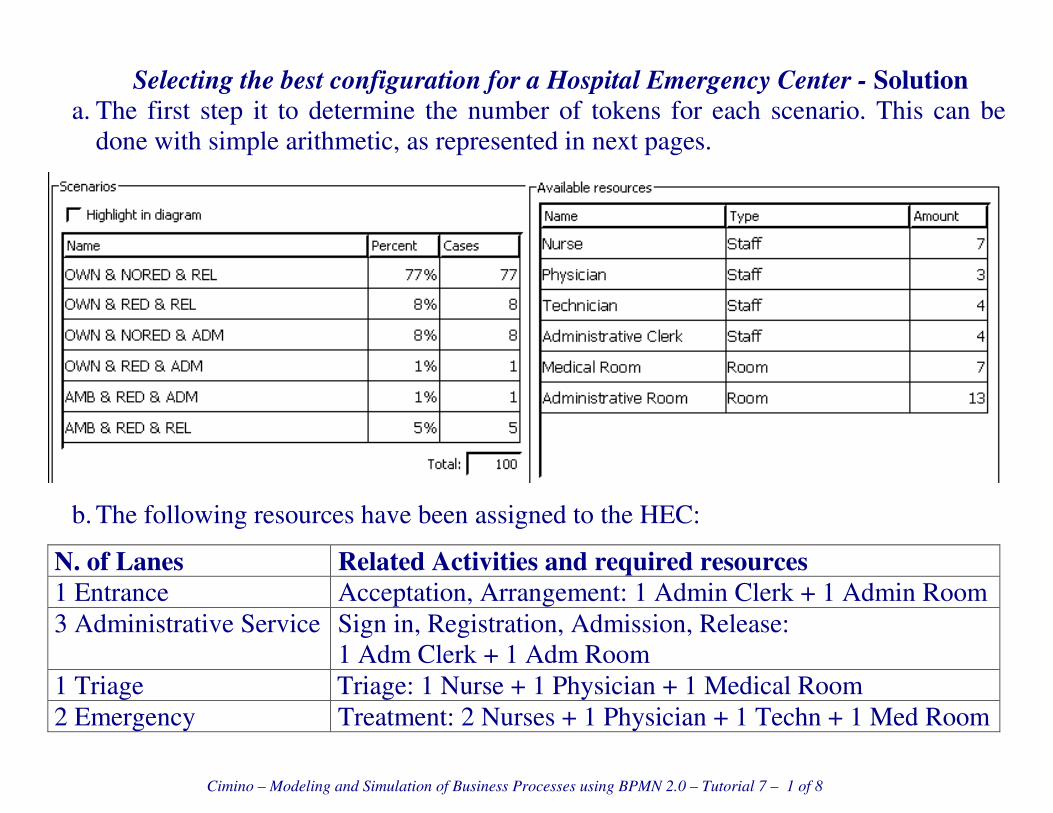
Cimino – Modeling and Simulation of Business Processes using BPMN 2.0 – Tutorial 7 – 1 of 8
Selecting the best configuration for a Hospital Emergency Center - Solution
a. The first step it to determine the number of tokens for each scenario. This can be
done with simple arithmetic, as represented in next pages.
b. The following resources have been assigned to the HEC:
N. of Lanes Related Activities and required resources
1 Entrance Acceptation, Arrangement: 1 Admin Clerk + 1 Admin Room
3 Administrative Service
Sign in, Registration, Admission, Release:
1 Adm Clerk + 1 Adm Room
1 Triage Triage: 1 Nurse + 1 Physician + 1 Medical Room
2 Emergency Treatment: 2 Nurses + 1 Physician + 1 Techn + 1 Med Room
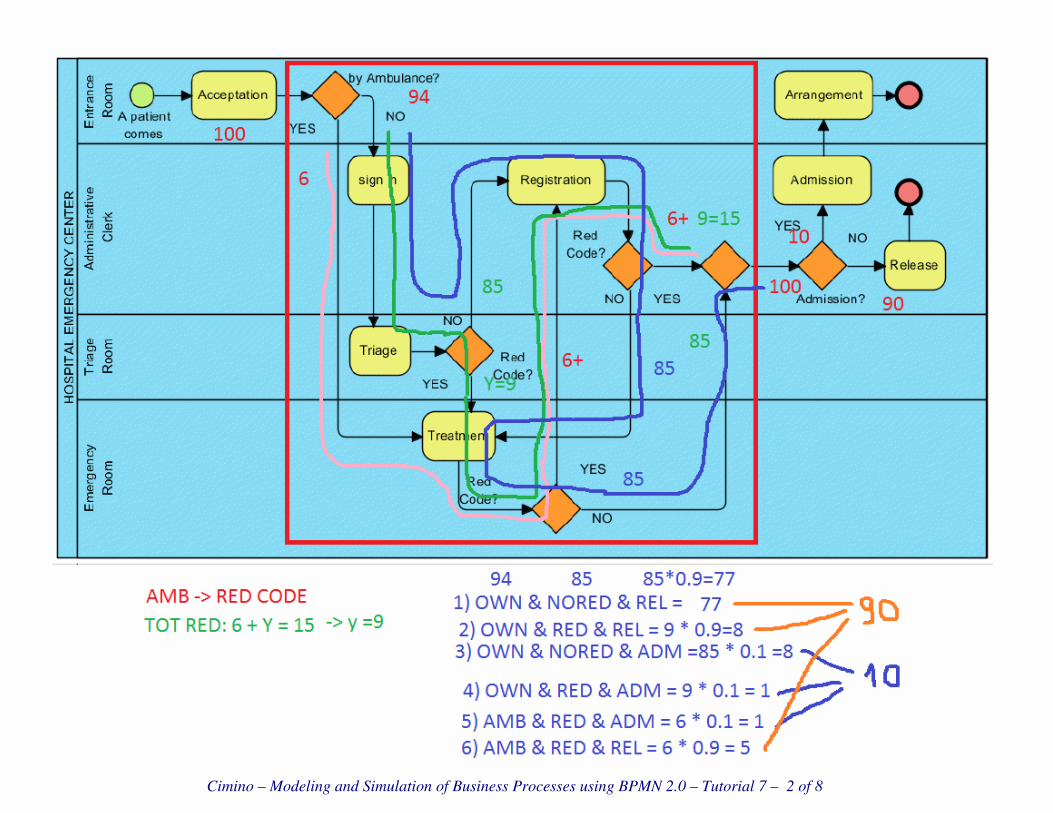
Cimino – Modeling and Simulation of Business Processes using BPMN 2.0 – Tutorial 7 – 2 of 8

Cimino – Modeling and Simulation of Business Processes using BPMN 2.0 – Tutorial 7 – 3 of 8
• Total Duration and Total Variable Cost: 21h 40m 12s 10037$
• Looking at the Completion chart, it can be assumed that the completion time for each
scenario is linearly increasing. Thus, the following completion data can be derived:
Scenario First Token
exits at
Last Token
exits at
N. of
Tokens
Average
Completion
time
OWN & NORED & REL 2h 40m 21h 40m 77 12h 10m
OWN & RED & REL 3h 25m 5h 5m 8 4h 15m
OWN & NORED & ADM 3h 35m 7h 25m 8 5h 30m
OWN & RED & ADM 4h 4h 1 4h
AMB & RED & ADM 2h 35m 2h 35m 1 2h 35m
AMB & RED & REL 2h 20m 3h 15m 5 2h 47m
AVERAGE TIME
• Using Microsoft Excel, the total average time is 10.35 hours, very higher than 2.4!
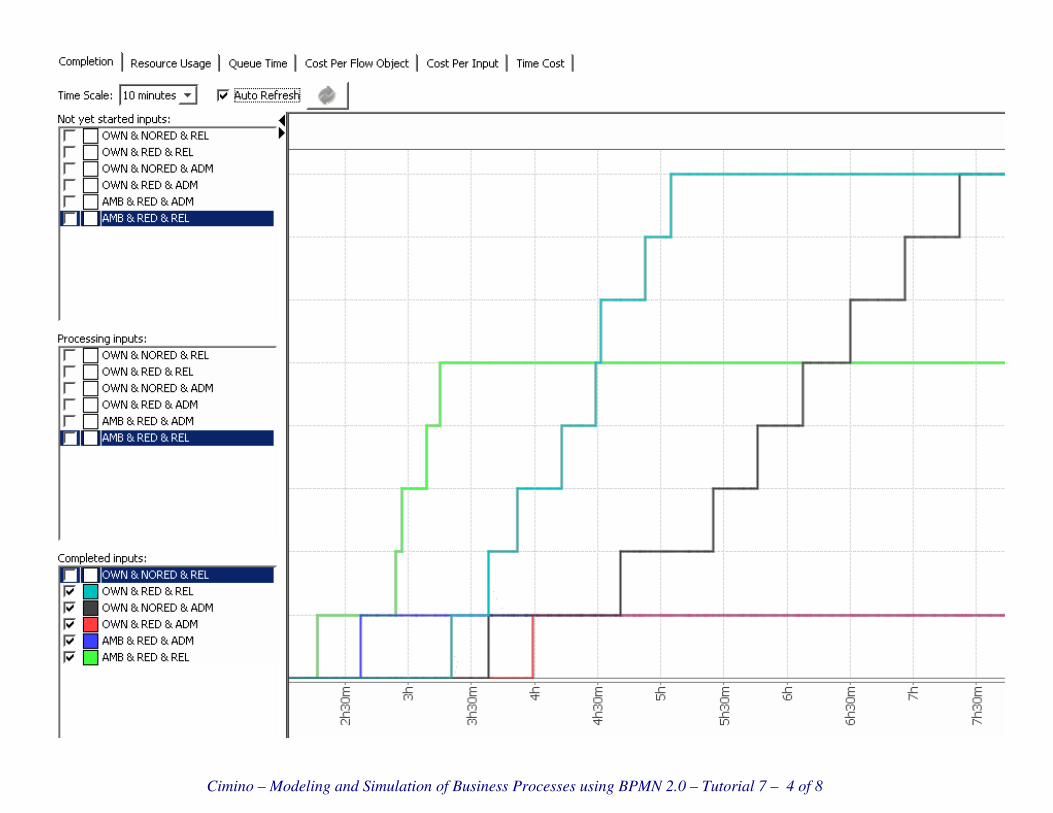
Cimino – Modeling and Simulation of Business Processes using BPMN 2.0 – Tutorial 7 – 4 of 8
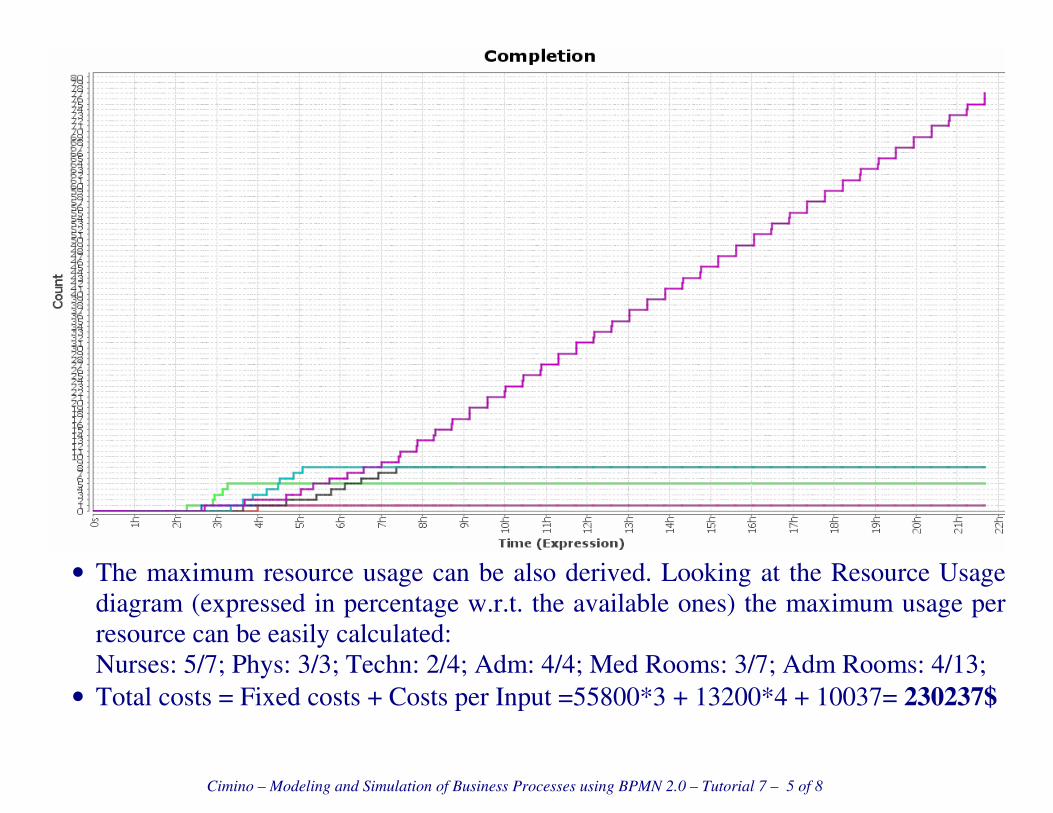
Cimino – Modeling and Simulation of Business Processes using BPMN 2.0 – Tutorial 7 – 5 of 8
• The maximum resource usage can be also derived. Looking at the Resource Usage
diagram (expressed in percentage w.r.t. the available ones) the maximum usage per
resource can be easily calculated:
Nurses: 5/7; Phys: 3/3; Techn: 2/4; Adm: 4/4; Med Rooms: 3/7; Adm Rooms: 4/13;
• Total costs = Fixed costs + Costs per Input =55800*3 + 13200*4 + 10037= 230237$

Cimino – Modeling and Simulation of Business Processes using BPMN 2.0 – Tutorial 7 – 6 of 8

Cimino – Modeling and Simulation of Business Processes using BPMN 2.0 – Tutorial 7 – 7 of 8
c. Looking at the Queue Time, it can be seen that the bottleneck is at the Treatment
activity. Let us increase the number of resource for treatment: 3 Emergency Room.
• Total Duration and Total Variable Cost: 17h 21m 12s 10037$
• Total Average Time: 8.65h
• The new Queuing situation is more balanced.

Cimino – Modeling and Simulation of Business Processes using BPMN 2.0 – Tutorial 7 – 8 of 8
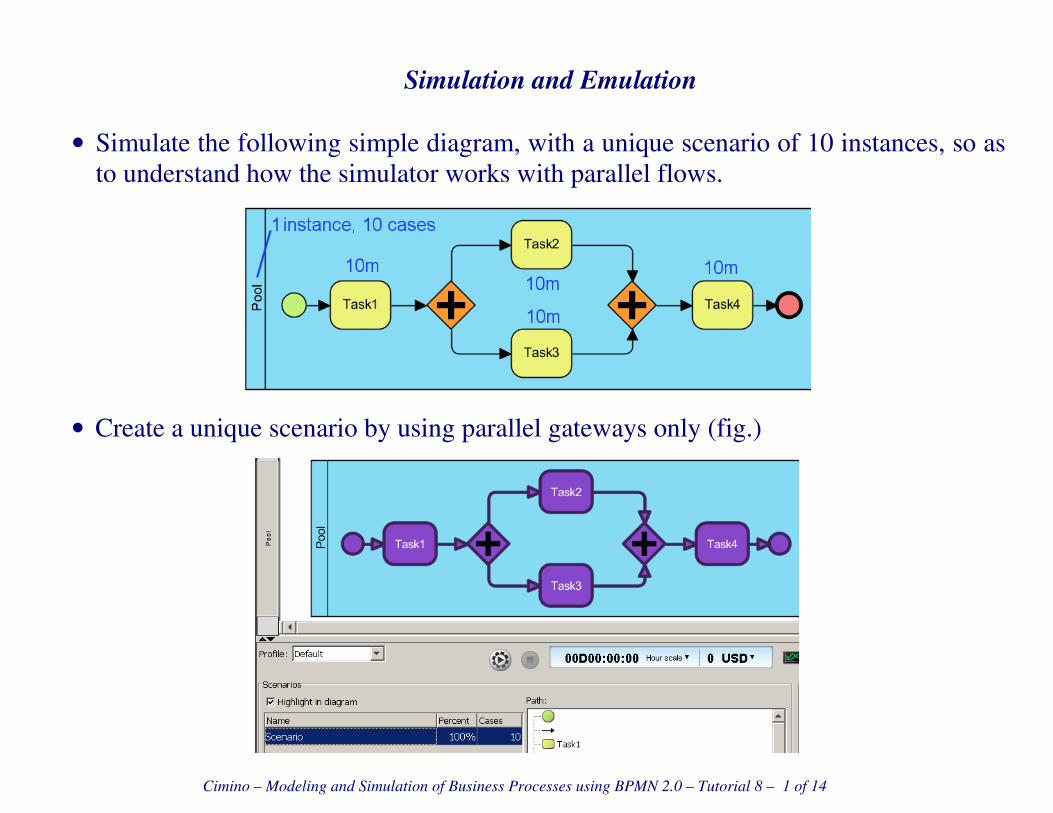
Cimino – Modeling and Simulation of Business Processes using BPMN 2.0 – Tutorial 8 – 1 of 14
Simulation and Emulation
• Simulate the following simple diagram, with a unique scenario of 10 instances, so as
to understand how the simulator works with parallel flows.
• Create a unique scenario by using parallel gateways only (fig.)
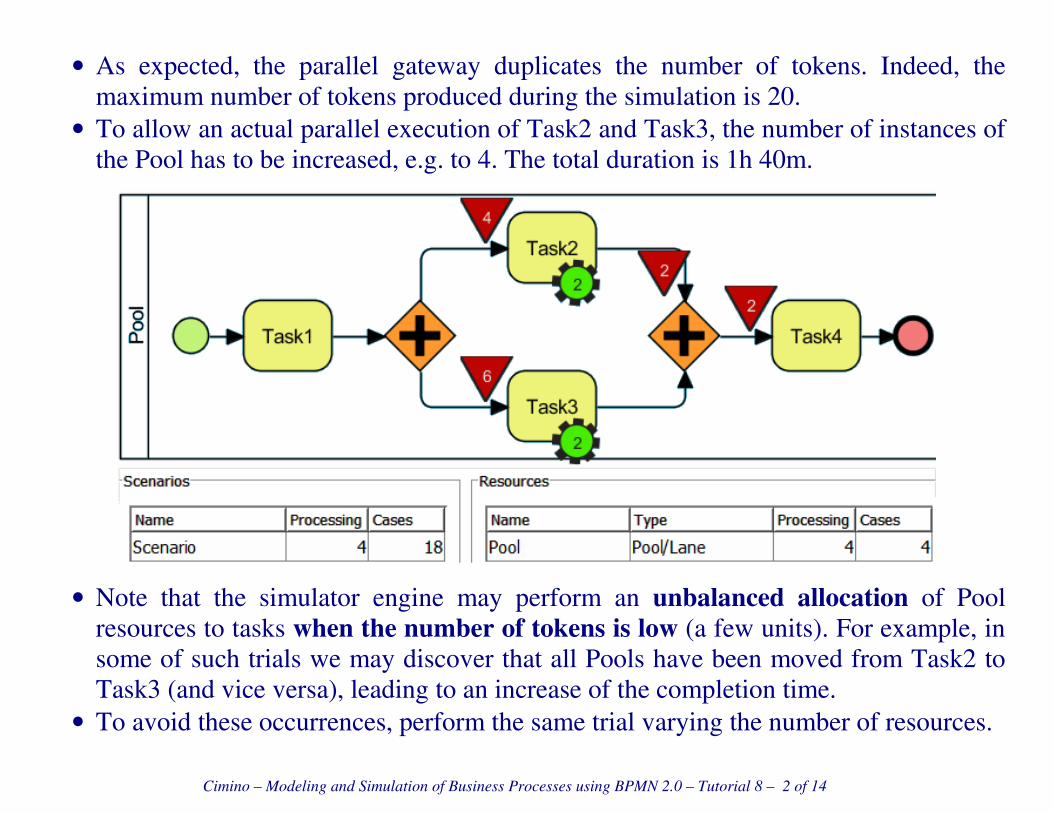
Cimino – Modeling and Simulation of Business Processes using BPMN 2.0 – Tutorial 8 – 2 of 14
• As expected, the parallel gateway duplicates the number of tokens. Indeed, the
maximum number of tokens produced during the simulation is 20.
• To allow an actual parallel execution of Task2 and Task3, the number of instances of
the Pool has to be increased, e.g. to 4. The total duration is 1h 40m.
• Note that the simulator engine may perform an unbalanced allocation of Pool
resources to tasks when the number of tokens is low (a few units). For example, in
some of such trials we may discover that all Pools have been moved from Task2 to
Task3 (and vice versa), leading to an increase of the completion time.
• To avoid these occurrences, perform the same trial varying the number of resources.

Cimino – Modeling and Simulation of Business Processes using BPMN 2.0 – Tutorial 8 – 3 of 14
• For more complex layout, simulation of parallel paths in the same scenario is not
allowed by the simulator. This means that, when creating a scenario, you are asked to
choose a path even using the parallel gateway.
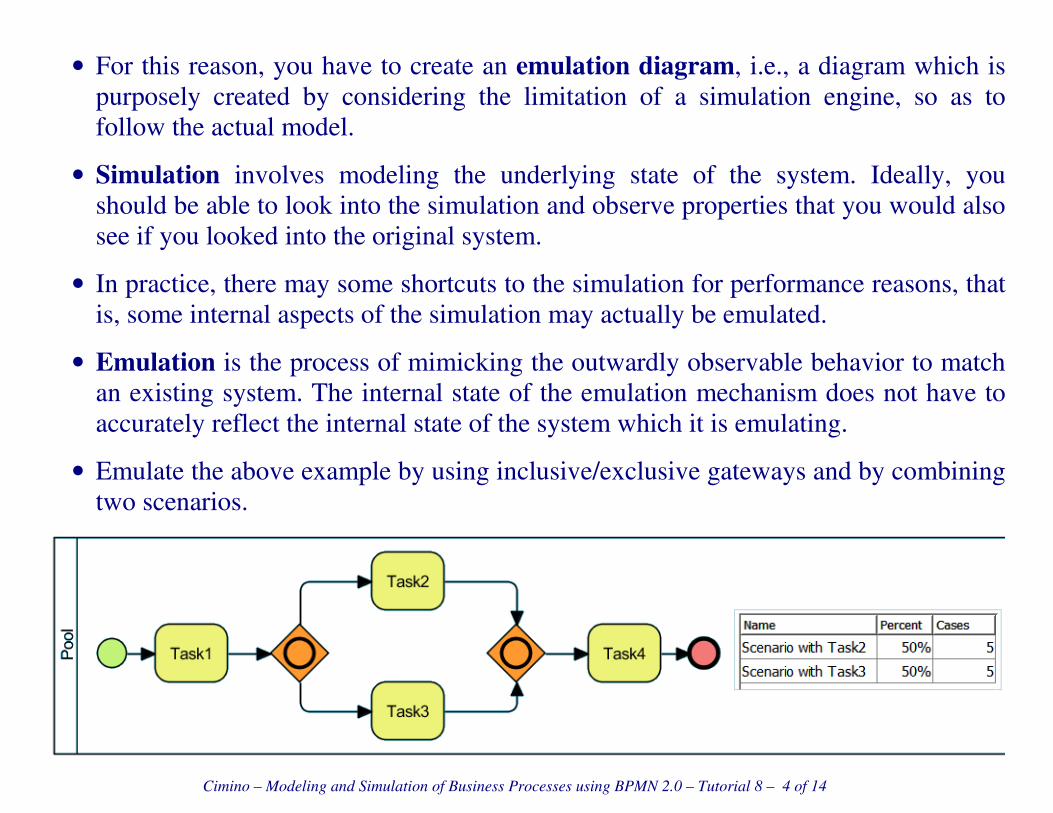
Cimino – Modeling and Simulation of Business Processes using BPMN 2.0 – Tutorial 8 – 4 of 14
• For this reason, you have to create an emulation diagram, i.e., a diagram which is
purposely created by considering the limitation of a simulation engine, so as to
follow the actual model.
• Simulation involves modeling the underlying state of the system. Ideally, you
should be able to look into the simulation and observe properties that you would also
see if you looked into the original system.
• In practice, there may some shortcuts to the simulation for performance reasons, that
is, some internal aspects of the simulation may actually be emulated.
• Emulation is the process of mimicking the outwardly observable behavior to match
an existing system. The internal state of the emulation mechanism does not have to
accurately reflect the internal state of the system which it is emulating.
• Emulate the above example by using inclusive/exclusive gateways and by combining
two scenarios.

Cimino – Modeling and Simulation of Business Processes using BPMN 2.0 – Tutorial 8 – 5 of 14
• With the emulation, the total duration is shorter, i.e., 1h 20m, because there are no
synchronization constraints between Task2 and Task3 at the merging node.

Cimino – Modeling and Simulation of Business Processes using BPMN 2.0 – Tutorial 8 – 6 of 14

Cimino – Modeling and Simulation of Business Processes using BPMN 2.0 – Tutorial 8 – 7 of 14
• When assigning multiple instances of a resource (lane), the execution of single tasks
(e.g., Task1 and Task4) is also parallelized, because the simulator allocates the
available resource to all tasks.
• In order to decide which tasks have to be parallelized, we can define two levels of
parallelism with a mirror resource, equipped with more instances, as the resource
for parallel segments. A separate base resource, with a single instance, devoted to
single task execution.
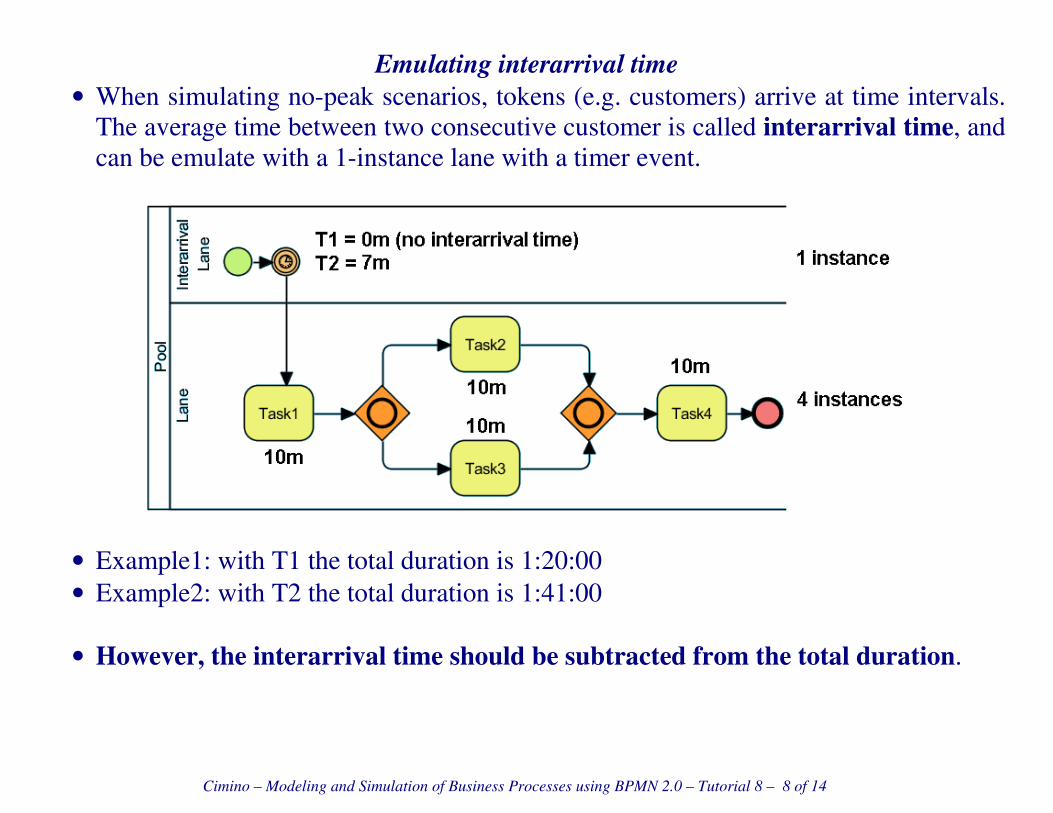
Cimino – Modeling and Simulation of Business Processes using BPMN 2.0 – Tutorial 8 – 8 of 14
Emulating interarrival time
• When simulating no-peak scenarios, tokens (e.g. customers) arrive at time intervals.
The average time between two consecutive customer is called interarrival time, and
can be emulate with a 1-instance lane with a timer event.
• Example1: with T1 the total duration is 1:20:00
• Example2: with T2 the total duration is 1:41:00
• However, the interarrival time should be subtracted from the total duration.

Cimino – Modeling and Simulation of Business Processes using BPMN 2.0 – Tutorial 8 – 9 of 14
Example 1

Cimino – Modeling and Simulation of Business Processes using BPMN 2.0 – Tutorial 8 – 10 of 14
Example 2

Cimino – Modeling and Simulation of Business Processes using BPMN 2.0 – Tutorial 8 – 11 of 14
Example 1

Cimino – Modeling and Simulation of Business Processes using BPMN 2.0 – Tutorial 8 – 12 of 14
Example 2
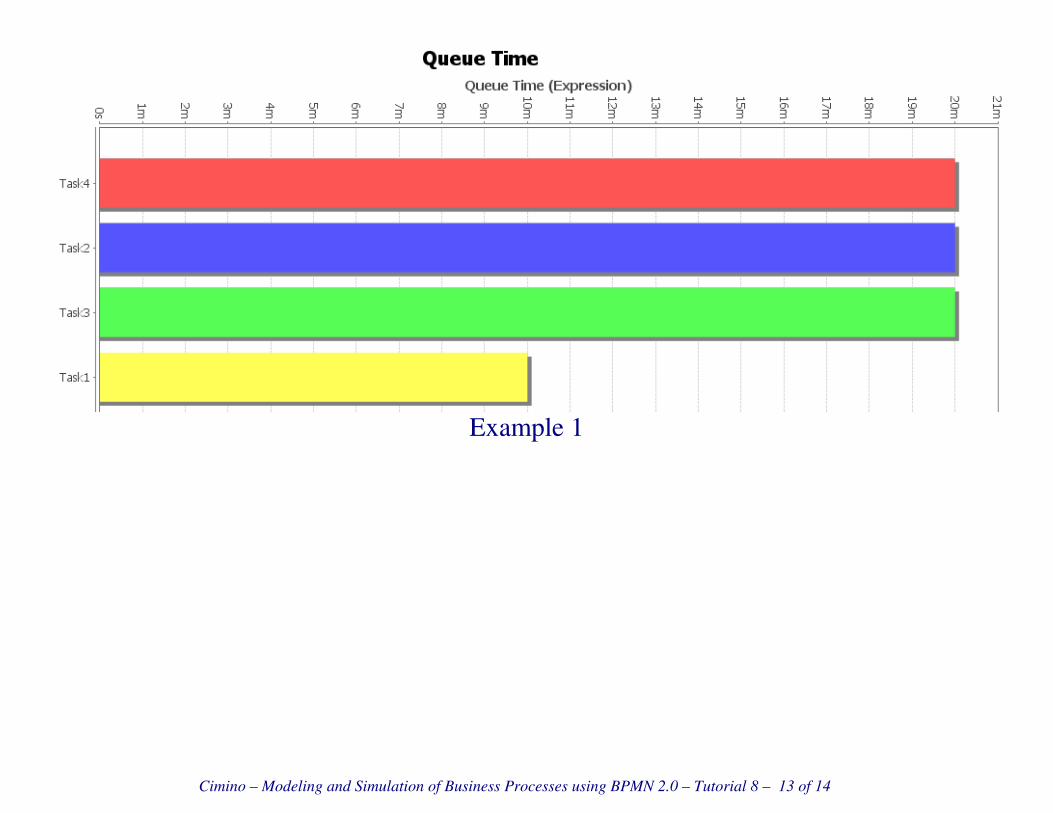
Cimino – Modeling and Simulation of Business Processes using BPMN 2.0 – Tutorial 8 – 13 of 14
Example 1
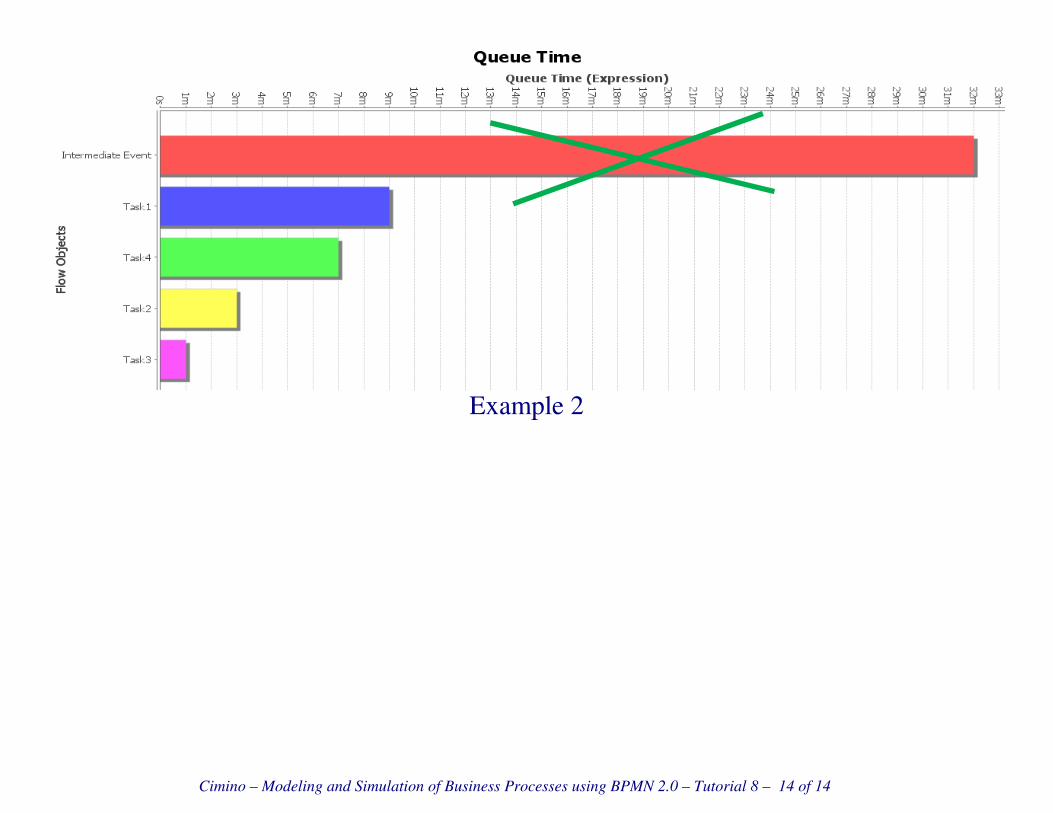
Cimino – Modeling and Simulation of Business Processes using BPMN 2.0 – Tutorial 8 – 14 of 14
Example 2
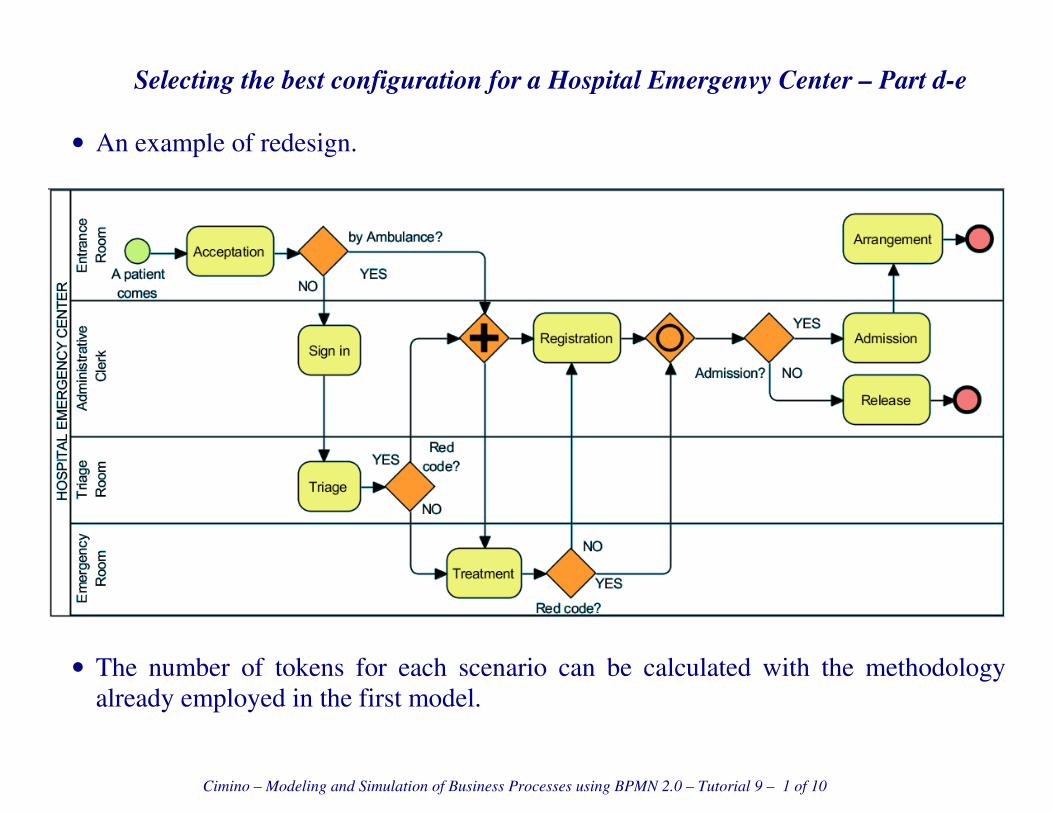
Cimino – Modeling and Simulation of Business Processes using BPMN 2.0 – Tutorial 9 – 1 of 10
Selecting the best configuration for a Hospital Emergenvy Center – Part d-e
• An example of redesign.
• The number of tokens for each scenario can be calculated with the methodology
already employed in the first model.

Cimino – Modeling and Simulation of Business Processes using BPMN 2.0 – Tutorial 9 – 2 of 10
• This model cannot be simulated, because the tool does not allow the definition of
scenarios with multiple paths at the parallel gateway, and with the inclusive merge
node. An emulation model must be performed.

Cimino – Modeling and Simulation of Business Processes using BPMN 2.0 – Tutorial 9 – 3 of 10
• An emulation model. The model is redundant, because there are two occurrences of
Registration and Treatment tasks. The activity Treatment-with-Registration is an
emulation of the parallelism between the two activities.
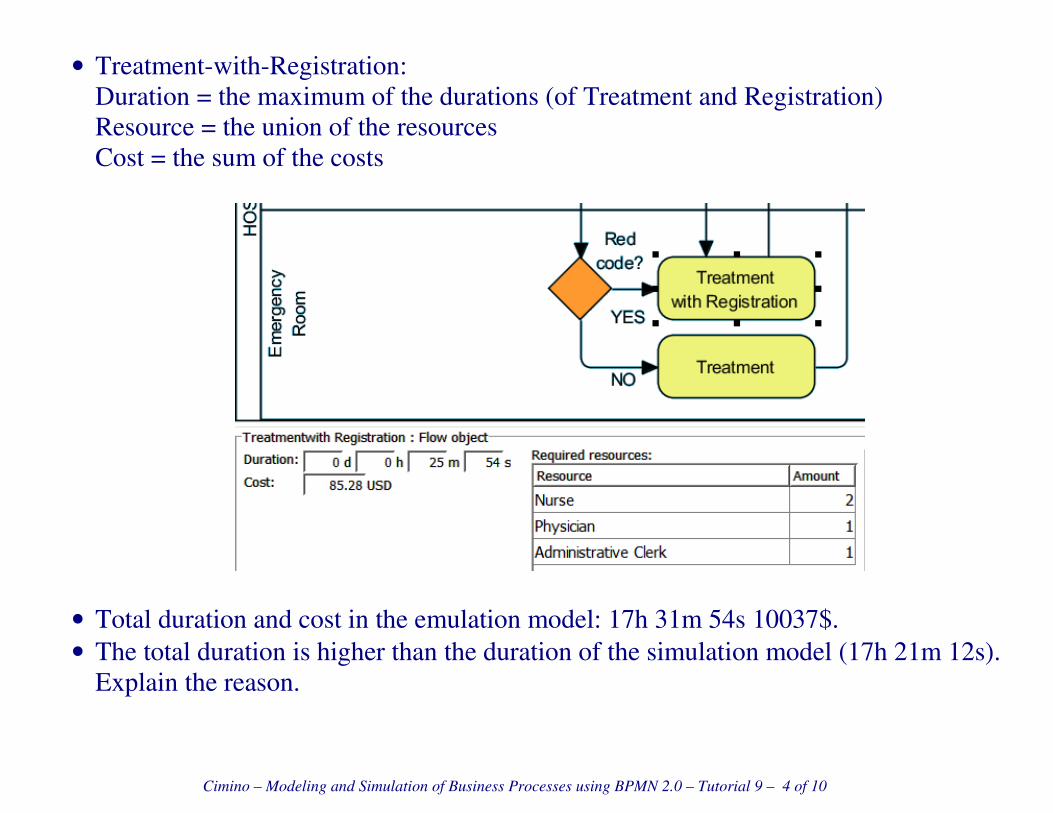
Cimino – Modeling and Simulation of Business Processes using BPMN 2.0 – Tutorial 9 – 4 of 10
• Treatment-with-Registration:
Duration = the maximum of the durations (of Treatment and Registration)
Resource = the union of the resources
Cost = the sum of the costs
• Total duration and cost in the emulation model: 17h 31m 54s 10037$.
• The total duration is higher than the duration of the simulation model (17h 21m 12s).
Explain the reason.
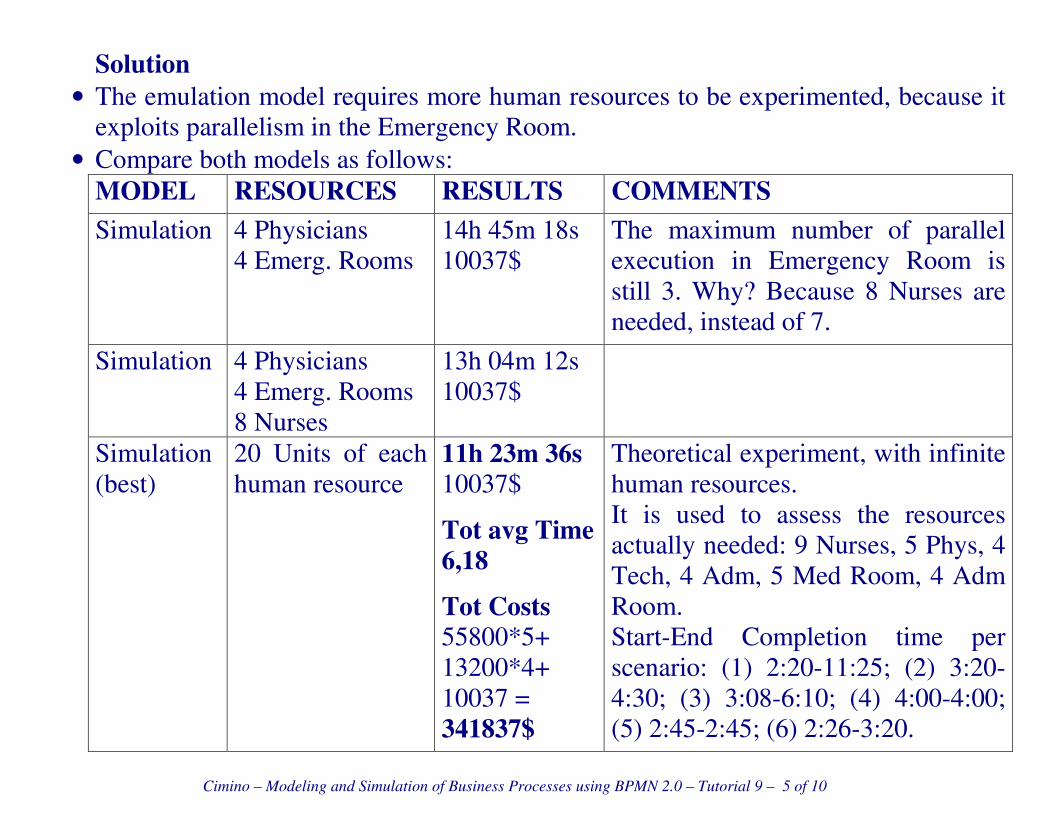
Cimino – Modeling and Simulation of Business Processes using BPMN 2.0 – Tutorial 9 – 5 of 10
Solution
• The emulation model requires more human resources to be experimented, because it
exploits parallelism in the Emergency Room.
• Compare both models as follows:
MODEL RESOURCES RESULTS COMMENTS
Simulation 4 Physicians
4 Emerg. Rooms
14h 45m 18s
10037$
The maximum number of parallel
execution in Emergency Room is
still 3. Why? Because 8 Nurses are
needed, instead of 7.
Simulation 4 Physicians
4 Emerg. Rooms
8 Nurses
13h 04m 12s
10037$
Simulation
(best)
20 Units of each
human resource
11h 23m 36s
10037$
Tot avg Time
6,18
Tot Costs
55800*5+
13200*4+
10037 =
341837$
Theoretical experiment, with infinite
human resources.
It is used to assess the resources
actually needed: 9 Nurses, 5 Phys, 4
Tech, 4 Adm, 5 Med Room, 4 Adm
Room.
Start-End Completion time per
scenario: (1) 2:20-11:25; (2) 3:20-
4:30; (3) 3:08-6:10; (4) 4:00-4:00;
(5) 2:45-2:45; (6) 2:26-3:20.
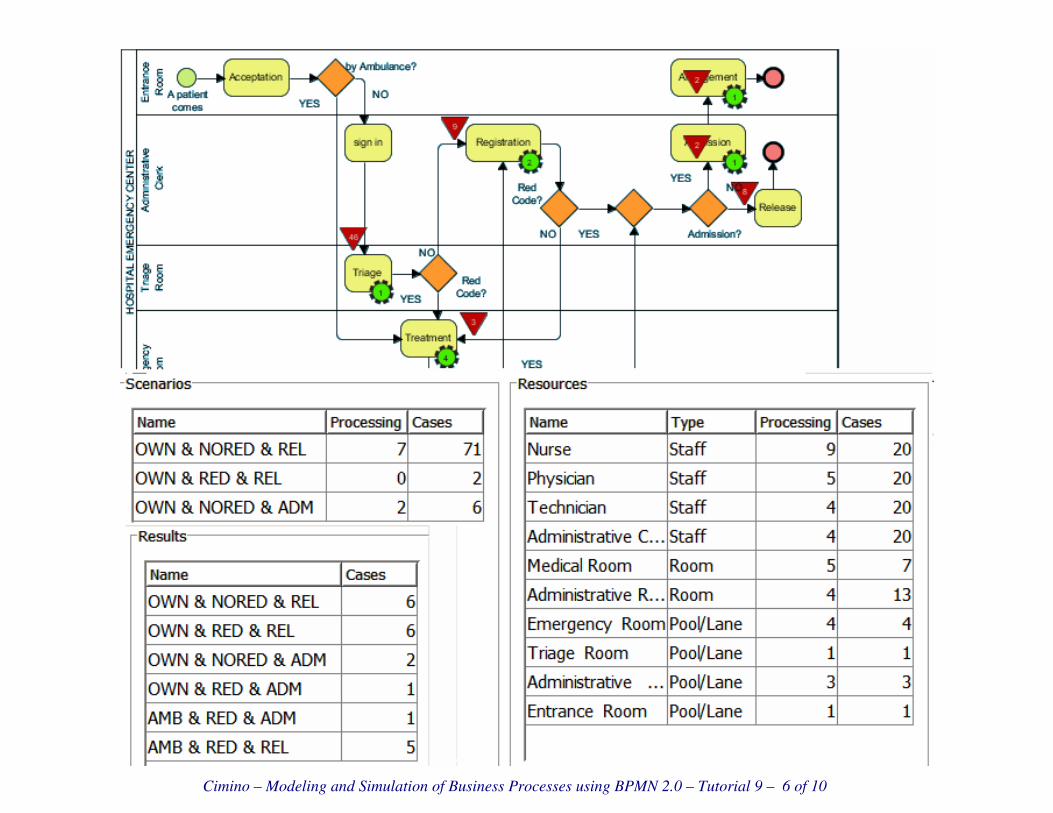
Cimino – Modeling and Simulation of Business Processes using BPMN 2.0 – Tutorial 9 – 6 of 10
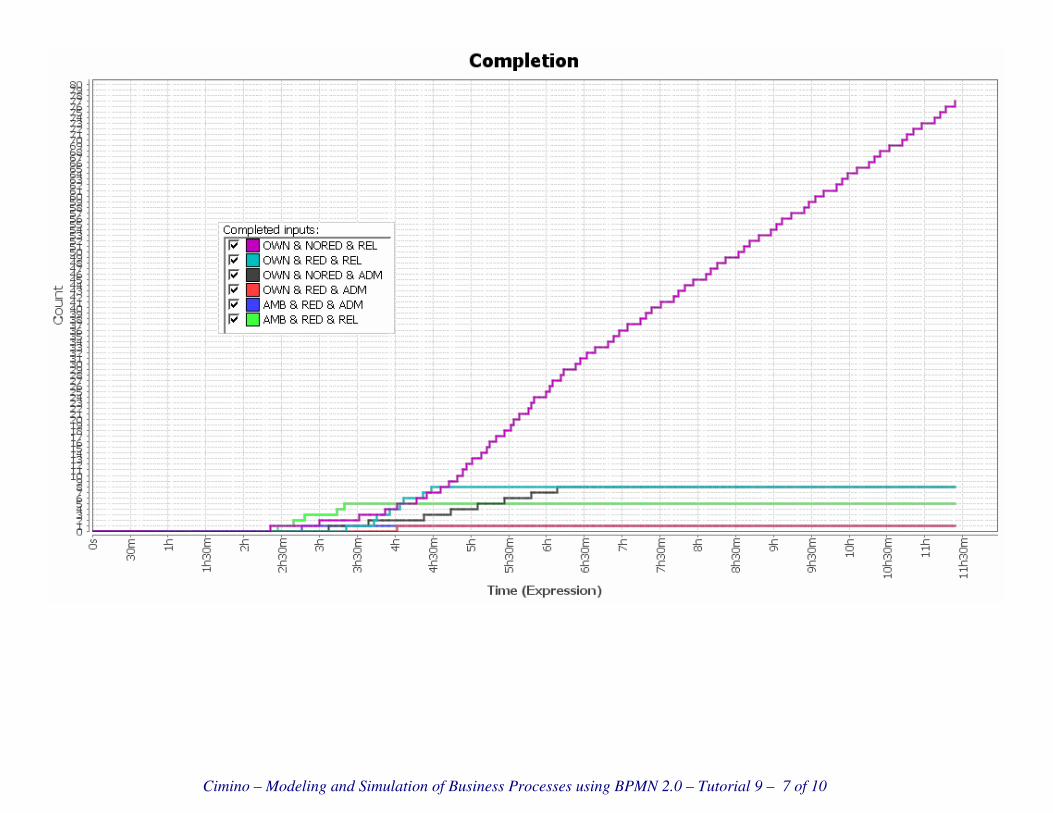
Cimino – Modeling and Simulation of Business Processes using BPMN 2.0 – Tutorial 9 – 7 of 10
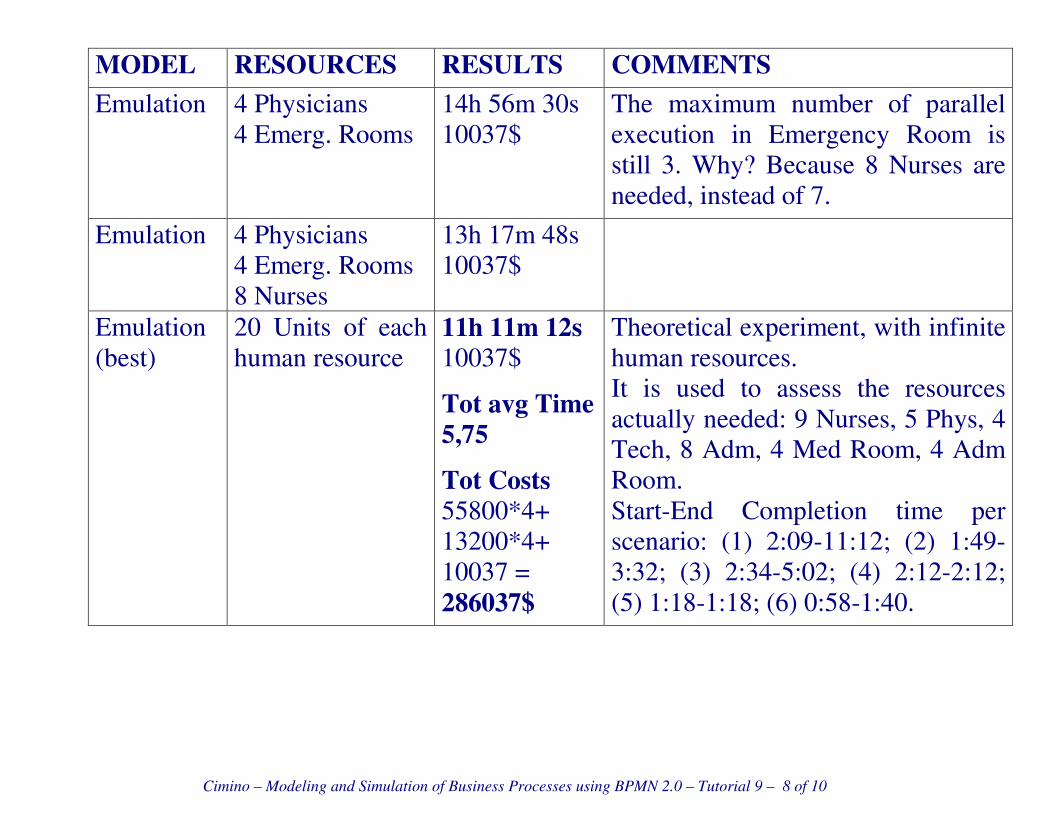
Cimino – Modeling and Simulation of Business Processes using BPMN 2.0 – Tutorial 9 – 8 of 10
MODEL RESOURCES RESULTS COMMENTS
Emulation 4 Physicians
4 Emerg. Rooms
14h 56m 30s
10037$
The maximum number of parallel
execution in Emergency Room is
still 3. Why? Because 8 Nurses are
needed, instead of 7.
Emulation 4 Physicians
4 Emerg. Rooms
8 Nurses
13h 17m 48s
10037$
Emulation
(best)
20 Units of each
human resource
11h 11m 12s
10037$
Tot avg Time
5,75
Tot Costs
55800*4+
13200*4+
10037 =
286037$
Theoretical experiment, with infinite
human resources.
It is used to assess the resources
actually needed: 9 Nurses, 5 Phys, 4
Tech, 8 Adm, 4 Med Room, 4 Adm
Room.
Start-End Completion time per
scenario: (1) 2:09-11:12; (2) 1:49-
3:32; (3) 2:34-5:02; (4) 2:12-2:12;
(5) 1:18-1:18; (6) 0:58-1:40.
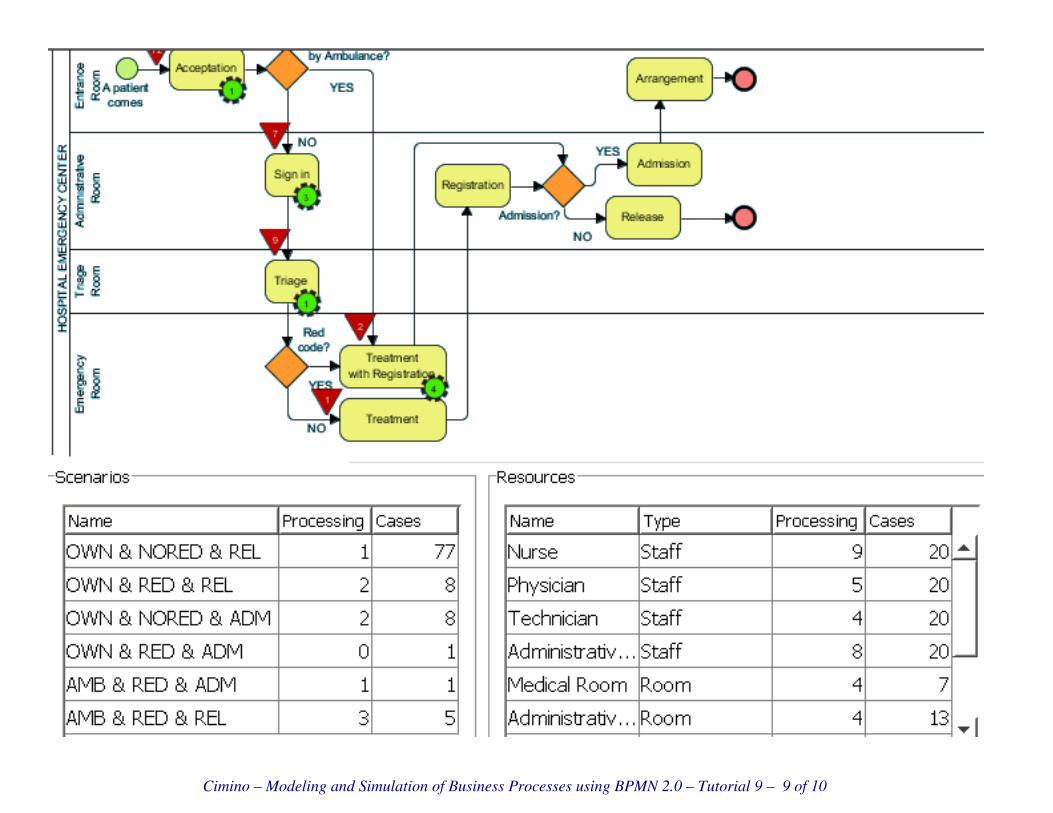
Cimino – Modeling and Simulation of Business Processes using BPMN 2.0 – Tutorial 9 – 9 of 10

Cimino – Modeling and Simulation of Business Processes using BPMN 2.0 – Tutorial 9 – 10 of 10

Cimino – Modeling and Simulation of Business Processes using BPMN 2.0 – Tutorial 10 – 1 of 18
Modeling from informal diagrams: selecting the best staffing level for a claims
process at an insurance company
• A personal claims department in an insurance company handles claims made by their
clients. Figure on the next page, is a non-BPMN process map depicting the personal
claims process in terms of swimlanes.
• The first lane corresponds to work done by a claims handler (CH) located at the
client’s local service center. Upon arrival of a claim, the assessor determines if the
client has a valid policy. If no (5% of all cases), then the case is terminated;
otherwise (95% of all cases), the assessor enters the appropriate information in the
system.
• In the second lane, an assessor located at the service center (ASC) receives data from
the claims handler. The assessor first determines if the claim is covered by the
client’s policy. If not (5% of cases), the case is terminated; otherwise (95% of cases),
the assessor approves the preliminary estimate of the damage. If the damage exceeds
$2,000 (35% of cases), the claim is sent to an assessor at headquarters for approval;
otherwise (65% of cases), it is sent directly to a Senior Assessor.

Cimino – Modeling and Simulation of Business Processes using BPMN 2.0 – Tutorial 10 – 2 of 18
• Lane 3 corresponds to the assessor at headquarters (AHQ). The assessor first
authorizes the on-site investigation of the accident. If the investigation determines
that the incident is not covered by the client’s policy (2% of cases), then the case is
terminated; otherwise (98% of cases), a final price is determined and the case is
approved.
• In lane 4, the senior assessor (SA) receives the claim, checks it, completes it, and
provides the final approval. Once the claim is approved, it is sent to documentation
control.
• Documentation control (DC), in lane 5, is in charge of processing the payment to the
client, closing the case, and, finally, filing the claim.
• The problem in this example is to find the most efficient staffing levels for each of
the five resource types. Each resource type has a maximum limit of 20 people, and
the overall headcount in the process cannot exceed 70. For 100 claims in a peak
scenario, the total duration should be lower than 200 minutes
• Perform a what-if analysis of possible solutions to this problem. To decide which
configuration best aligns with service levels and process goals, analyze the trade-offs
between headcount and total duration. Finally, consider also sensitivity: which type
of resource produces a lower difference in total duration when reduced by a unit.
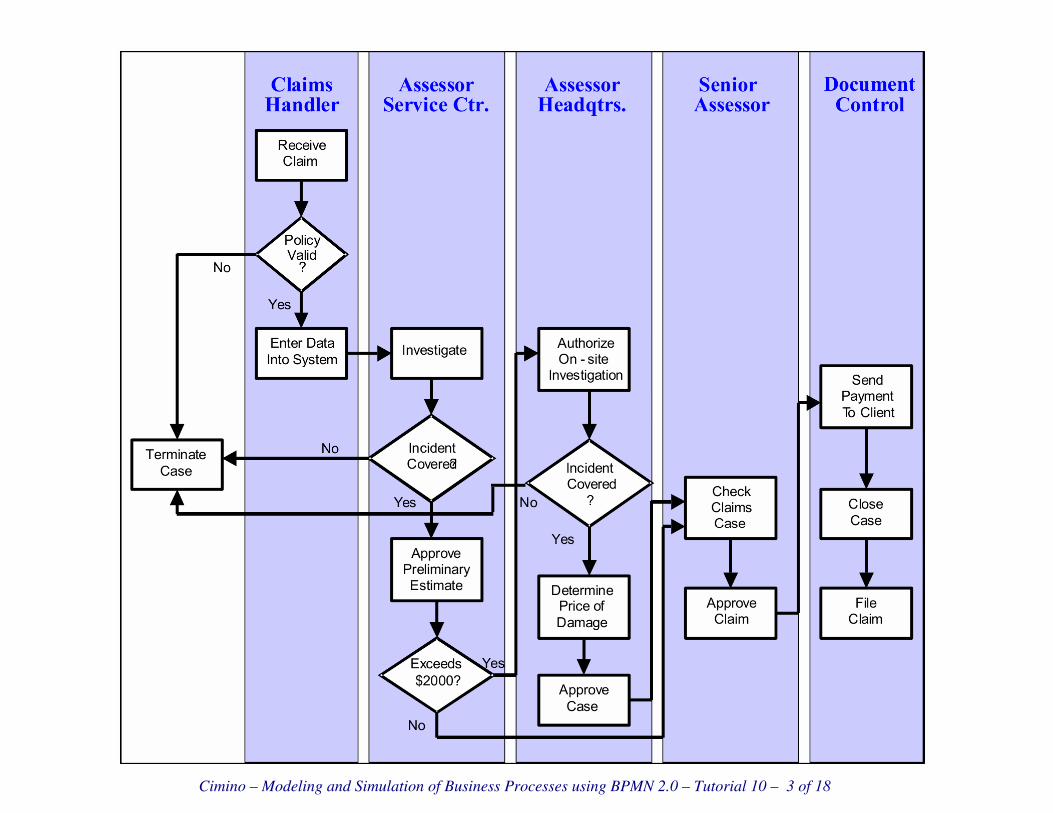
Cimino – Modeling and Simulation of Business Processes using BPMN 2.0 – Tutorial 10 – 3 of 18

Cimino – Modeling and Simulation of Business Processes using BPMN 2.0 – Tutorial 10 – 4 of 18
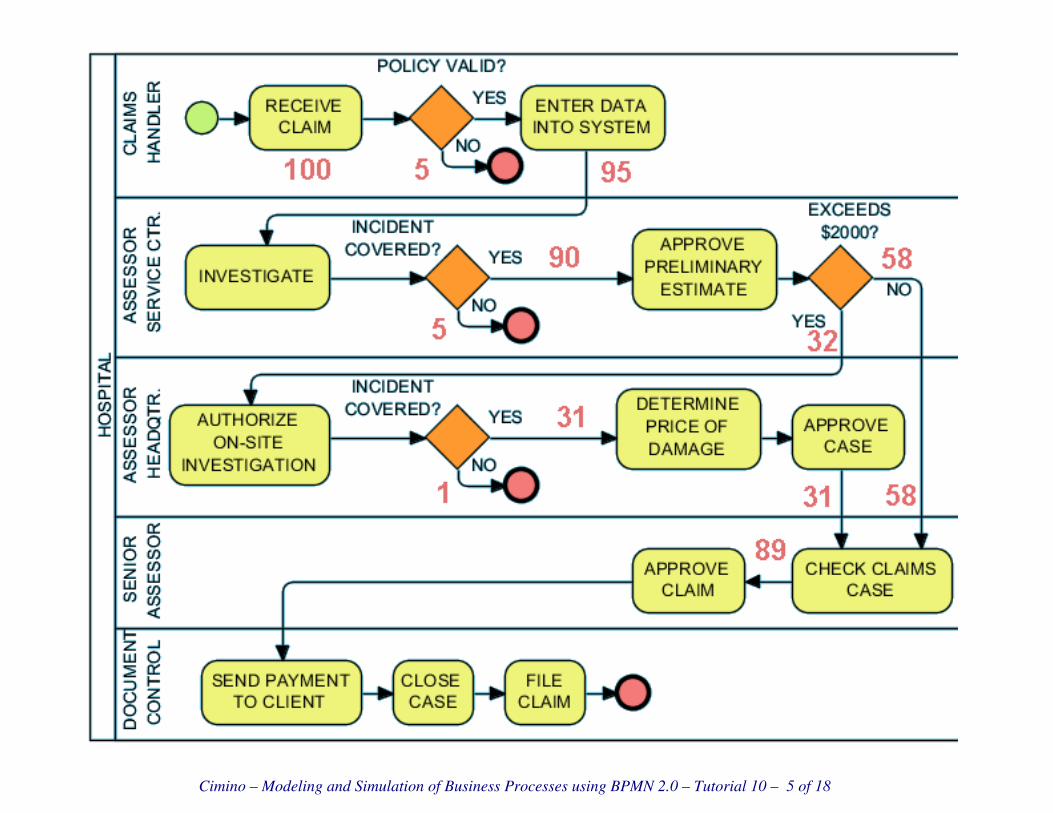
Cimino – Modeling and Simulation of Business Processes using BPMN 2.0 – Tutorial 10 – 5 of 18

Cimino – Modeling and Simulation of Business Processes using BPMN 2.0 – Tutorial 10 – 6 of 18
• Scenarios
SCENARIO N. OF CASES
1) POL-NOT-VAL 5
2) POL-VAL & INC-NOT-COV 5
3) POL-VAL & INC-COV & >2000 & INC-NOT-COV 1
4) POL-VAL & INC-COV & >2000 & INC-COV 31
5) POL-VAL & INC-COV & <2000 58
TOTAL CASES 100
• Duration
ACTIVITY AVG. DURATION
RECEIVE CLAIM 2m 12s
ENTER DATA INTO SYSTEM 10m 32s
INVESTIGATE 19m 28s
APPROVE PRELIMINARY ESTIMATE 3m 54s
AUTHORIZE ON-SITE INVESTIGATION 2m 46s
DETERMINE PRICE OF DAMAGE 37m 16s
APPROVE CASE 2m 10s
CHECK CLAIMS CASE 3m 38s
APPROVE CLAIM 1m 18s
SEND PAYMENT TO CLIENT 7m 11s
CLOSE CASE 1m 46s
FILE CLAIM 3m 22s

Cimino – Modeling and Simulation of Business Processes using BPMN 2.0 – Tutorial 10 – 7 of 18
• Optimization problem: minimize the headcount, i.e., the total number of lane
instances, under the following constraints: (i) each lane type has a maximum limit of
20; (ii) the total number of lane instances in the process cannot exceed 70; (iii) the
total duration should be lower than 200 minutes.
• An experiment with 20 instances available for all lanes (20, 20, 20, 20, 20) produces
a total duration of 3h 26m 5s (206 minutes).
• The longest queues are located in the second lane (Fig.1, investigate, approve
preliminary estimate), i.e., “Assessor Service Ctr”. Moreover, the second lane
exploits all 20 instances for a considerable amount of time (Fig.2, green line). Thus,
a reduction of the available instances of the second lane may produce a substantial
increase in the total duration. Second lane => 20 instances.
• Queues in the second lane may also depend on the inter-arrival time, which is
determined by resources in the first lane. There could be a positive effect in the
reduction of some resource in the first lane:
Inst. 19 18,17,15 16 14 13,12 11 10 9 8
Dur. 3:18:55 3:11:05
(191m)
3:12:13 3:13:17 3:15:29 3:14:55 3:12:05 3:11:59
(192m)
3:24:01
• First lane => 9 instances (9, 20, 20, 20, 20). New results are shown in Fig. 4, 5, 6.
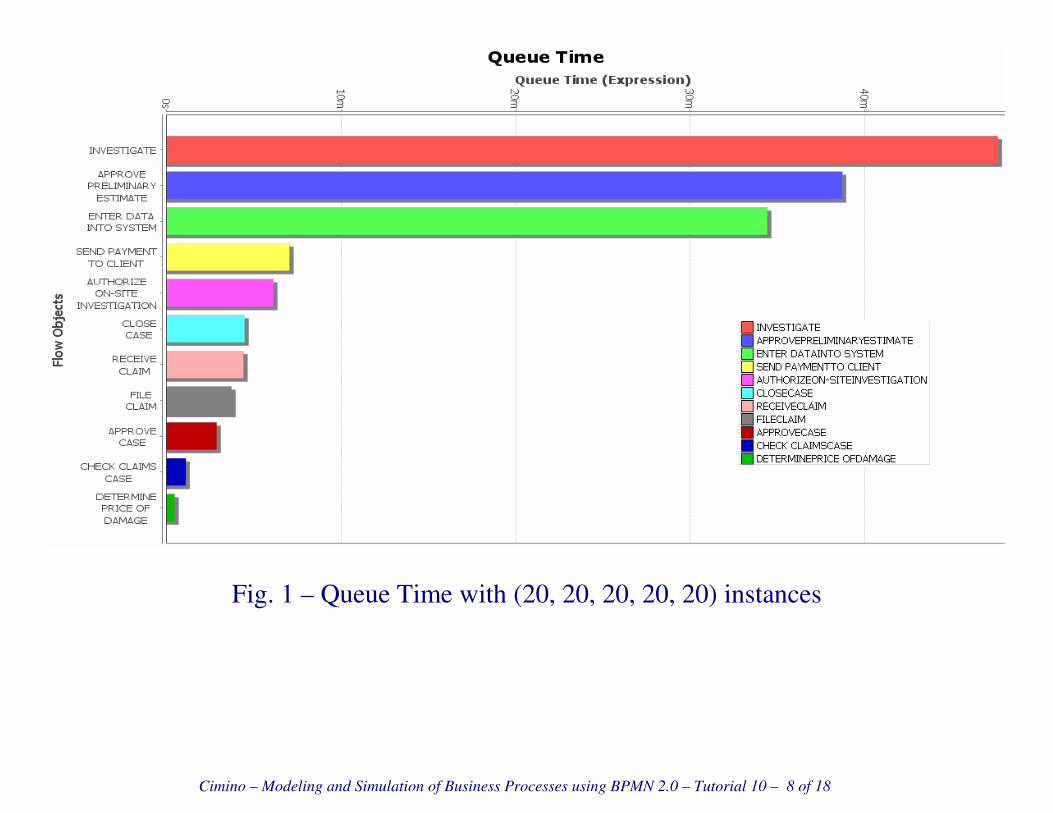
Cimino – Modeling and Simulation of Business Processes using BPMN 2.0 – Tutorial 10 – 8 of 18
Fig. 1 – Queue Time with (20, 20, 20, 20, 20) instances

Cimino – Modeling and Simulation of Business Processes using BPMN 2.0 – Tutorial 10 – 9 of 18
Fig. 2 – Resource Usage with (20, 20, 20, 20, 20) instances
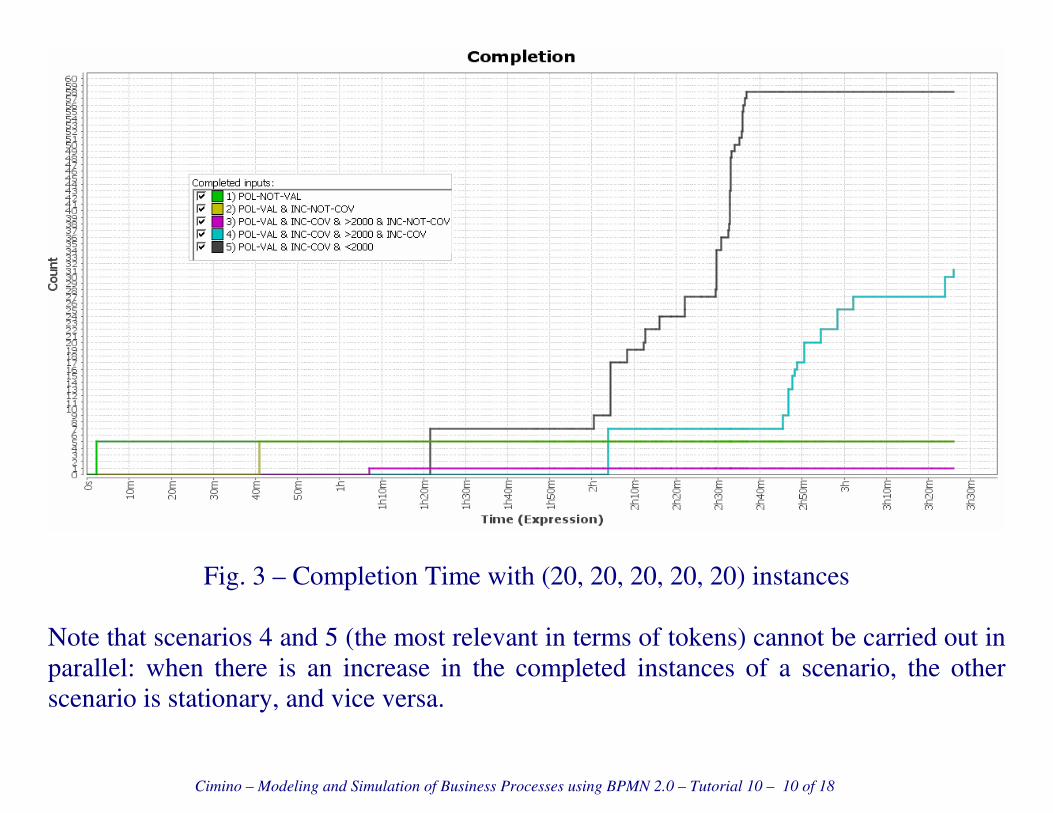
Cimino – Modeling and Simulation of Business Processes using BPMN 2.0 – Tutorial 10 – 10 of 18
Fig. 3 – Completion Time with (20, 20, 20, 20, 20) instances
Note that scenarios 4 and 5 (the most relevant in terms of tokens) cannot be carried out in
parallel: when there is an increase in the completed instances of a scenario, the other
scenario is stationary, and vice versa.

Cimino – Modeling and Simulation of Business Processes using BPMN 2.0 – Tutorial 10 – 11 of 18
Fig. 4 – Queue Time with (9, 20, 20, 20, 20) instances
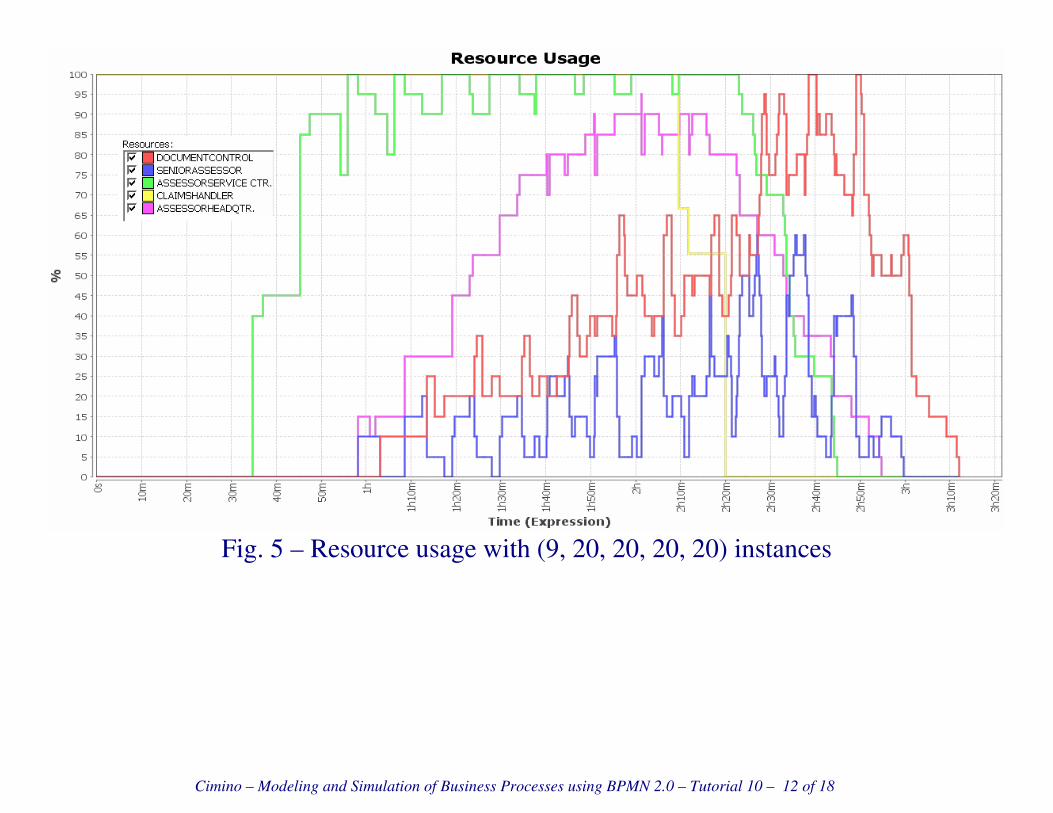
Cimino – Modeling and Simulation of Business Processes using BPMN 2.0 – Tutorial 10 – 12 of 18
Fig. 5 – Resource usage with (9, 20, 20, 20, 20) instances

Cimino – Modeling and Simulation of Business Processes using BPMN 2.0 – Tutorial 10 – 13 of 18
Fig. 6 – Completion Time with (9, 20, 20, 20, 20) instances
Note that scenarios 4 and 5 (the most relevant in terms of tokens) can be carried out in
parallel: both scenarios can increase the completed instances.
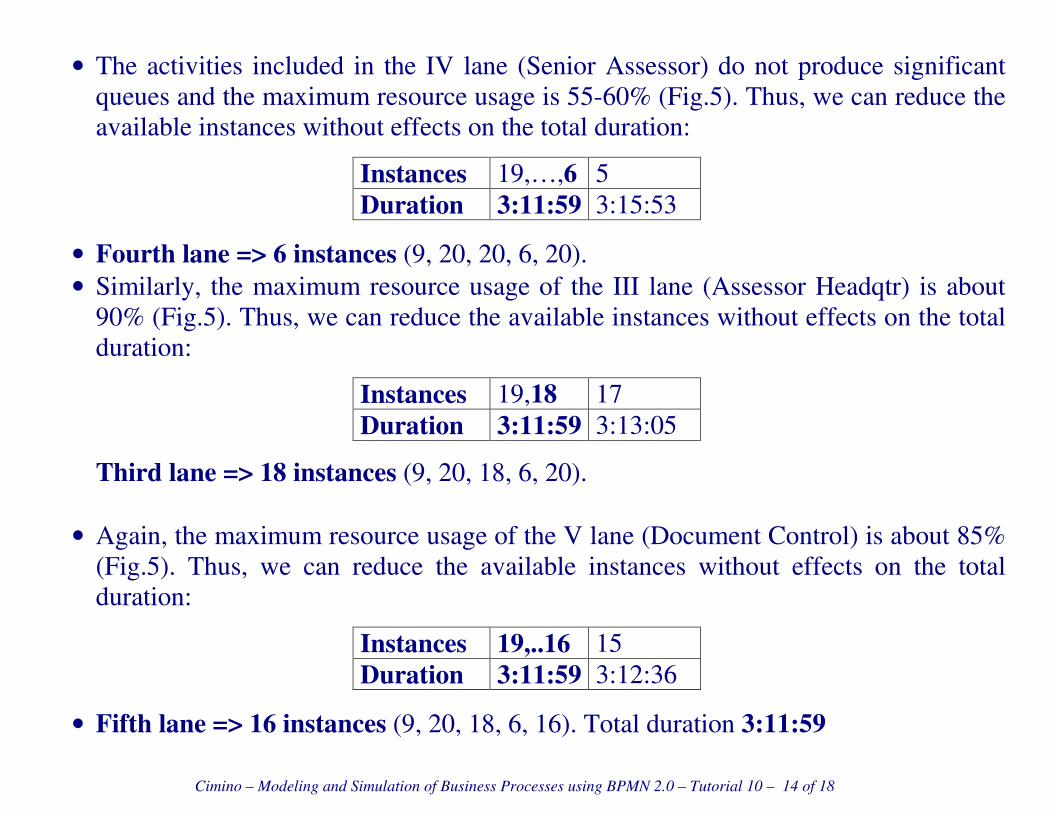
Cimino – Modeling and Simulation of Business Processes using BPMN 2.0 – Tutorial 10 – 14 of 18
• The activities included in the IV lane (Senior Assessor) do not produce significant
queues and the maximum resource usage is 55-60% (Fig.5). Thus, we can reduce the
available instances without effects on the total duration:
Instances 19,…,6 5
Duration 3:11:59 3:15:53
• Fourth lane => 6 instances (9, 20, 20, 6, 20).
• Similarly, the maximum resource usage of the III lane (Assessor Headqtr) is about
90% (Fig.5). Thus, we can reduce the available instances without effects on the total
duration:
Instances 19,18 17
Duration 3:11:59 3:13:05
Third lane => 18 instances (9, 20, 18, 6, 20).
• Again, the maximum resource usage of the V lane (Document Control) is about 85%
(Fig.5). Thus, we can reduce the available instances without effects on the total
duration:
Instances 19,..16 15
Duration 3:11:59 3:12:36
• Fifth lane => 16 instances (9, 20, 18, 6, 16). Total duration 3:11:59

Cimino – Modeling and Simulation of Business Processes using BPMN 2.0 – Tutorial 10 – 15 of 18
Fig. 7 – Queue Time with (9, 20, 18, 6, 16) = 69 instances
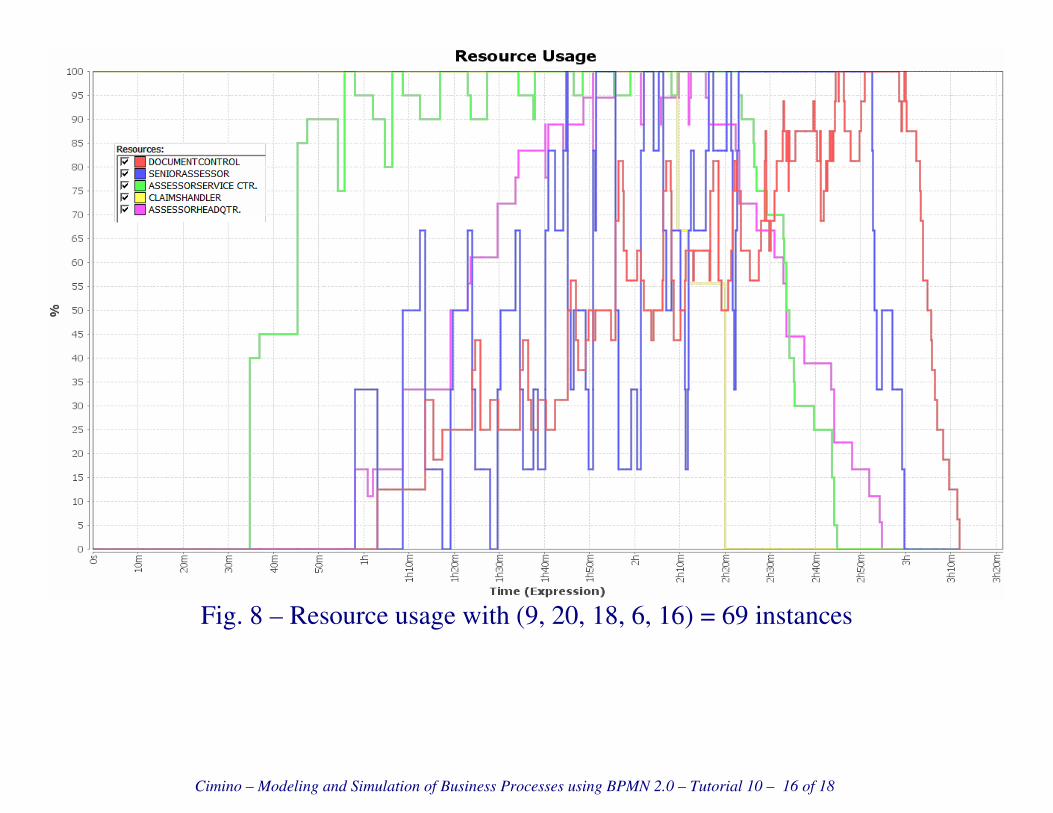
Cimino – Modeling and Simulation of Business Processes using BPMN 2.0 – Tutorial 10 – 16 of 18
Fig. 8 – Resource usage with (9, 20, 18, 6, 16) = 69 instances
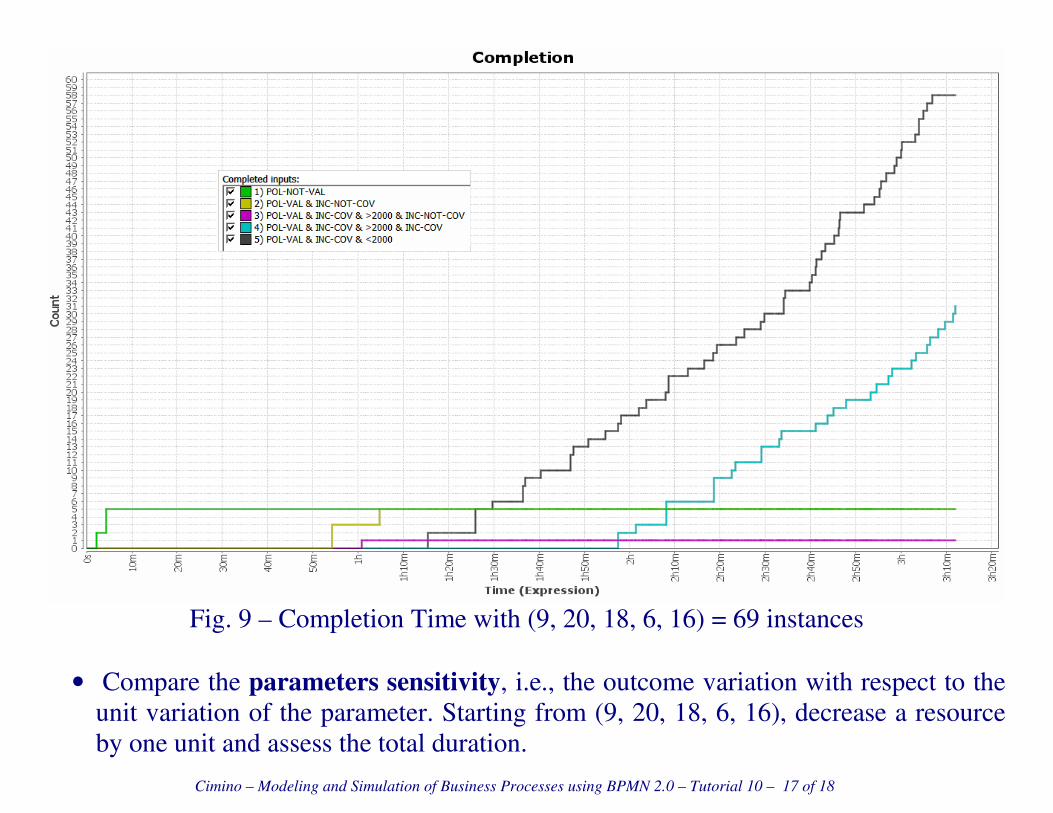
Cimino – Modeling and Simulation of Business Processes using BPMN 2.0 – Tutorial 10 – 17 of 18
Fig. 9 – Completion Time with (9, 20, 18, 6, 16) = 69 instances
• Compare the parameters sensitivity, i.e., the outcome variation with respect to the
unit variation of the parameter. Starting from (9, 20, 18, 6, 16), decrease a resource
by one unit and assess the total duration.
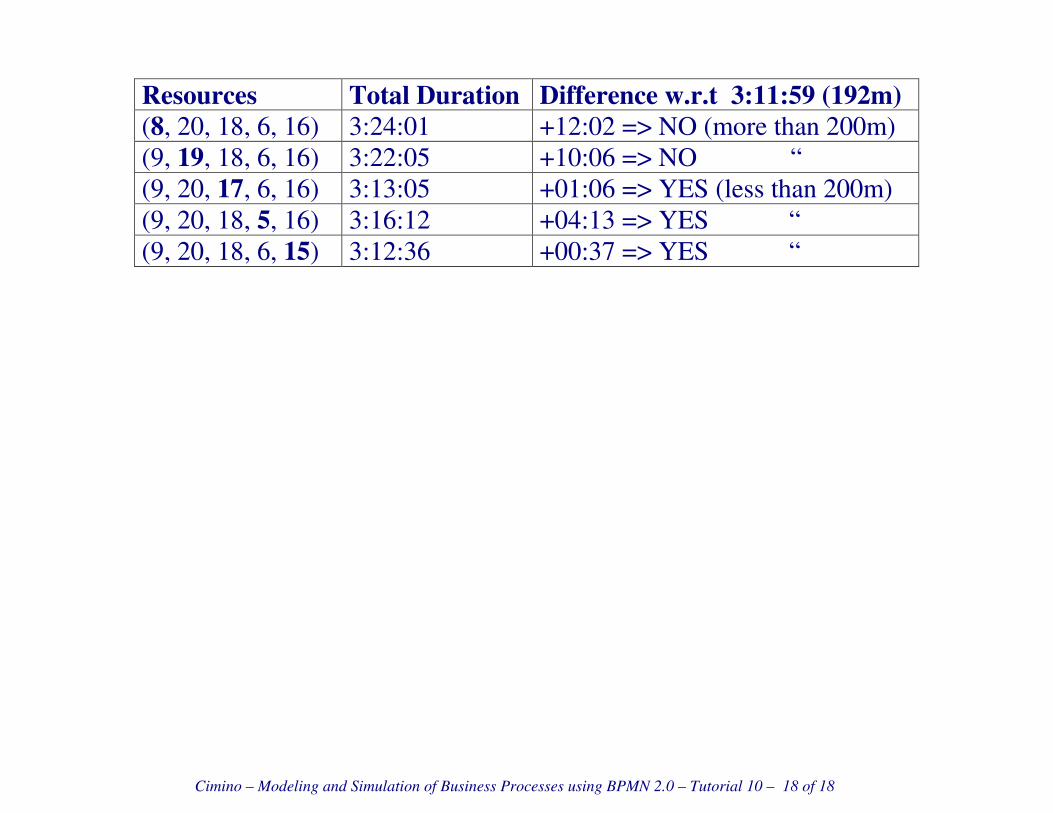
Cimino – Modeling and Simulation of Business Processes using BPMN 2.0 – Tutorial 10 – 18 of 18
Resources Total Duration Difference w.r.t 3:11:59 (192m)
(8, 20, 18, 6, 16) 3:24:01 +12:02 => NO (more than 200m)
(9, 19, 18, 6, 16) 3:22:05 +10:06 => NO “
(9, 20, 17, 6, 16) 3:13:05 +01:06 => YES (less than 200m)
(9, 20, 18, 5, 16) 3:16:12 +04:13 => YES “
(9, 20, 18, 6, 15) 3:12:36 +00:37 => YES “