lanxess cheuvreux german corporate conference final · – nbr-business has been unprofitable for...
TRANSCRIPT

LANXESS AGCheuvreux - 5th German Corporate ConferenceSchlosshotel Kronberg, January 16, 2006Matthias Zachert (CFO)
Safe Harbour Statement
This Presentation contains certain forward-looking statements, including assumptions, opinions and views of the Company or cited from third party sources. Various known and unknown risks, uncertainties and other factors could cause the actual results, financial position, development or performance of the company to differ materially from the estimations expressed or implied herein. The company does not guarantee that the assumptions underlying such forward looking statements are free from errors nor do they accept any responsibility for the future accuracy of the opinions expressed in this Presentation or the actual occurrence of the forecasted developments.No representation or warranty (express or implied) is made as to, and no reliance should be placed on, any information, including projections, estimates, targets and opinions, contained herein, and no liability whatsoever is accepted as to any errors, omissions or misstatements contained herein, and, accordingly, none of the Company or any of its parent or subsidiary undertakings or any of such person’s officers, directors or employees accepts any liability whatsoever arising directly or indirectly from the use of this document.
Chart-No. 3
1. Company Overview
2. Strategy and Restructuring
3. 9M Financials
4. Outlook and Summary
Agenda

Chart-No. 4
We have Achieved a Lot So Far And Keep Going With High Speed...
AnnualGeneralMeeting
Restructuring1st Phase
announced
Buyback of€200 m
Mandatory Convertible
Constitution Supervisory
Board
Stock Market Listing
Strategy &equitystory
presented
Issuance of€ 500m
BenchmarkBond
2nd investmentgrade rating byMoody’s: Baa3
Signing of agreementwith German unions
Restructuring 2nd Phase
Purchase agreement signed with Kemira Oyj (PAP)
Share based incentiveprograminitiatedJanuary 2005
December 2005
...and continuous strong business momentum
Sale of iSL-business(RCH)
First portfolio adjustment: Memorandum of understanding signed with AKF (FIB)
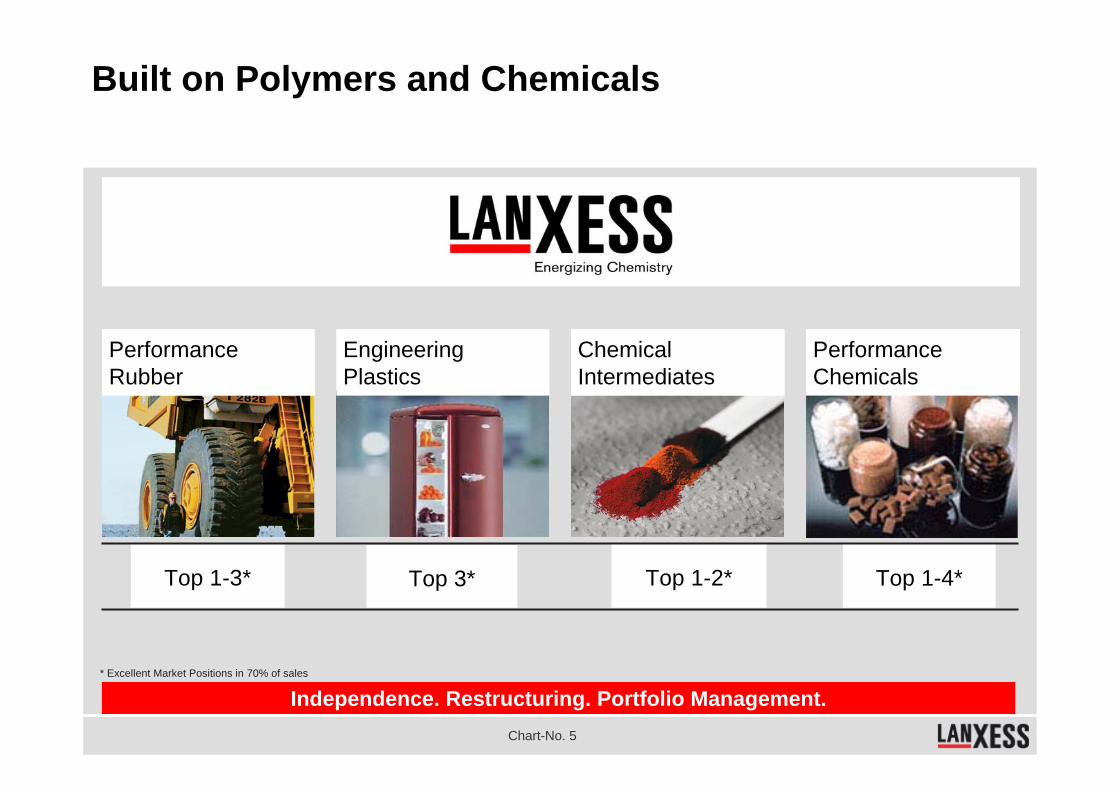
Chart-No. 5
Built on Polymers and Chemicals
PerformanceRubber
Engineering Plastics
ChemicalIntermediates
PerformanceChemicals
Top 1-4*Top 3* Top 1-2*Top 1-3*
Independence. Restructuring. Portfolio Management.* Excellent Market Positions in 70% of sales

Chart-No. 6
Asia15% Germany
24%
EMEA w/oGermany
35%
Americas26%
World Coverage
Global Presence
Asia20%
Germany51%EMEA w/o
Germany19%
Americas10%
LANXESS (21 countries)
OtherBayer Agency(~30 countries)
Sales by Region
Assets by Region Employees by RegionAsia4%
Germany51%EMEA w/o
Germany23%
Americas22%
All figures based on combined financial statements 2004
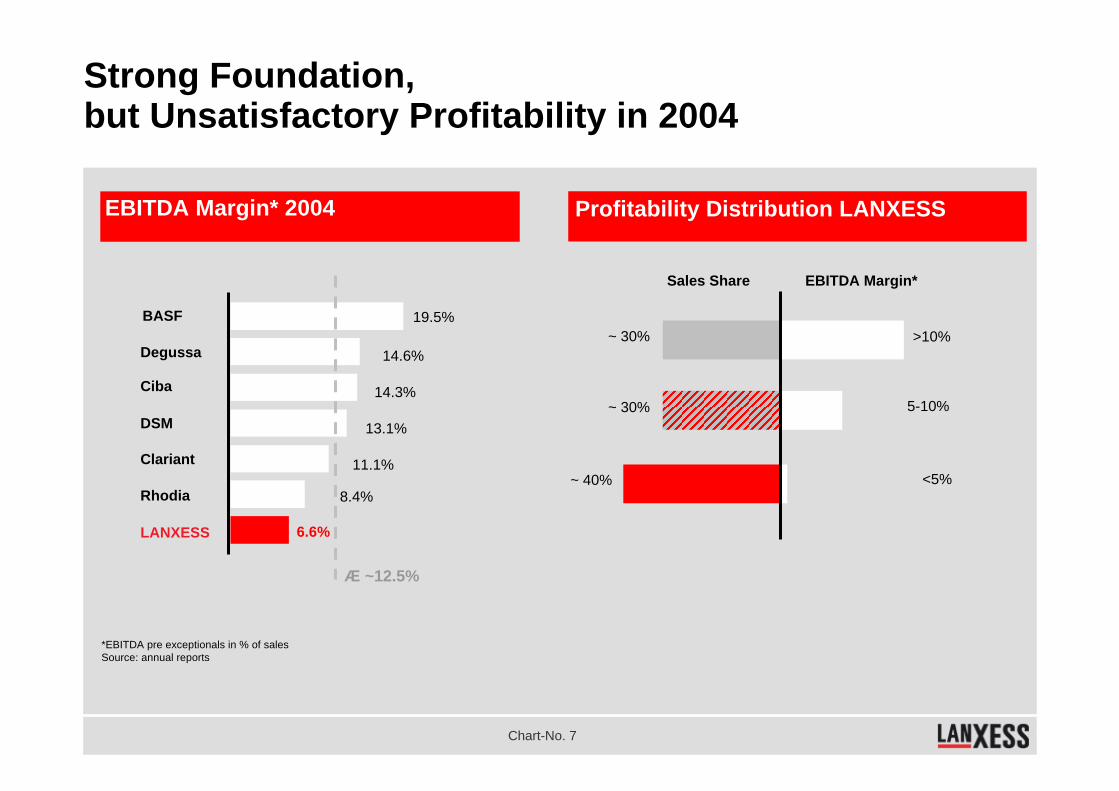
Chart-No. 7
Strong Foundation, but Unsatisfactory Profitability in 2004
EBITDA Margin* 2004 Profitability Distribution LANXESS
EBITDA Margin*Sales Share
<5%
5-10%
>10%
~ 40%
~ 30%
~ 30%BASF
14.6%
Ciba 14.3%
Degussa
13.1%DSM
19.5%
11.1%Clariant
6.6%
Rhodia 8.4%
LANXESS
*EBITDA pre exceptionals in % of salesSource: annual reports
Æ ~12.5%
Chart-No. 8
1. Company Overview
2. Strategy and Restructuring
3. 9M Financials
4. Outlook and Summary
Agenda

Chart-No. 9
“Step-by-Step Approach” to Creating Value
Short-term Mid-term Long-termEBITDA*-Margin
2. Targetedrestructuring
1. Performance improvement
Portfolio adjustments3.
Acquisitions4.
> 10%
20069-10%
< 5 %
Portfolio
Cost
Selective organic growth in profitable businesses* EBITDA pre exceptionals
Restructuring 1st Phase and 2nd Phase
Portfolioadjustment
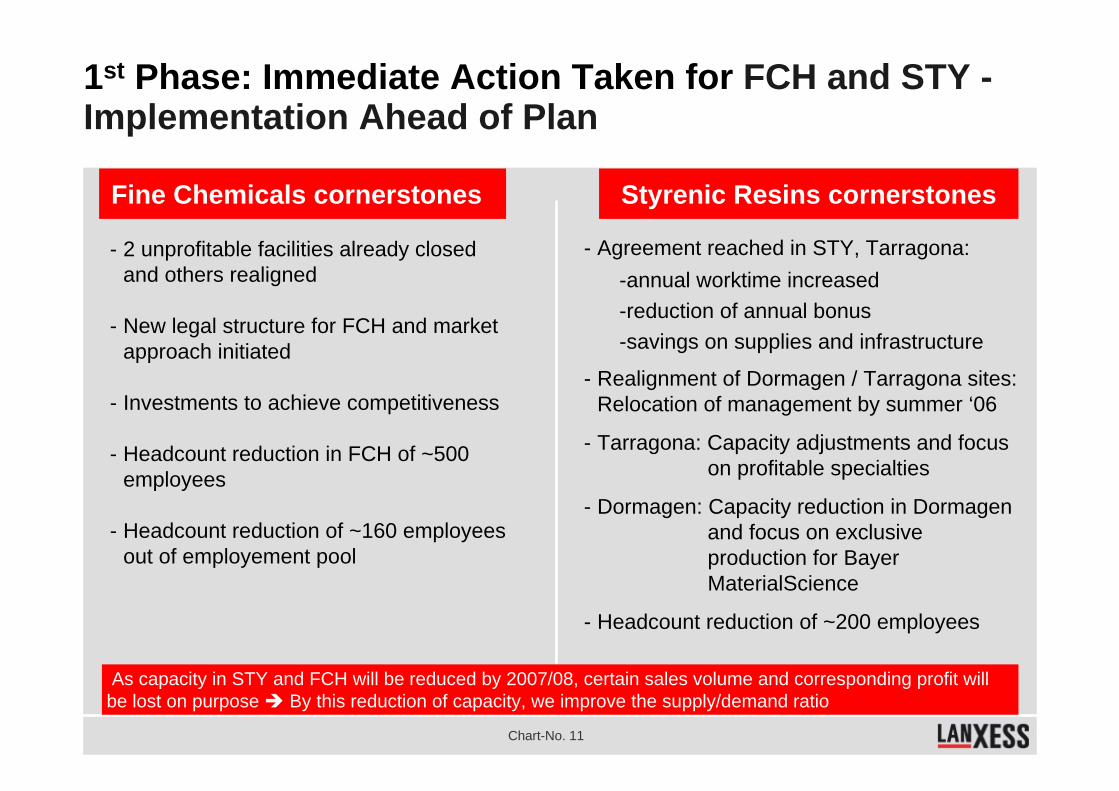
Chart-No. 11
1st Phase: Immediate Action Taken for FCH and STY -Implementation Ahead of Plan
- 2 unprofitable facilities already closed and others realigned
- New legal structure for FCH and market approach initiated
- Investments to achieve competitiveness
- Headcount reduction in FCH of ~500 employees
- Headcount reduction of ~160 employees out of employement pool
- Agreement reached in STY, Tarragona: -annual worktime increased -reduction of annual bonus-savings on supplies and infrastructure
- Realignment of Dormagen / Tarragona sites: Relocation of management by summer ‘06
- Tarragona: Capacity adjustments and focus on profitable specialties
- Dormagen: Capacity reduction in Dormagenand focus on exclusive production for Bayer MaterialScience
- Headcount reduction of ~200 employees
Fine Chemicals cornerstones Styrenic Resins cornerstones
As capacity in STY and FCH will be reduced by 2007/08, certain sales volume and corresponding profit will be lost on purpose By this reduction of capacity, we improve the supply/demand ratio
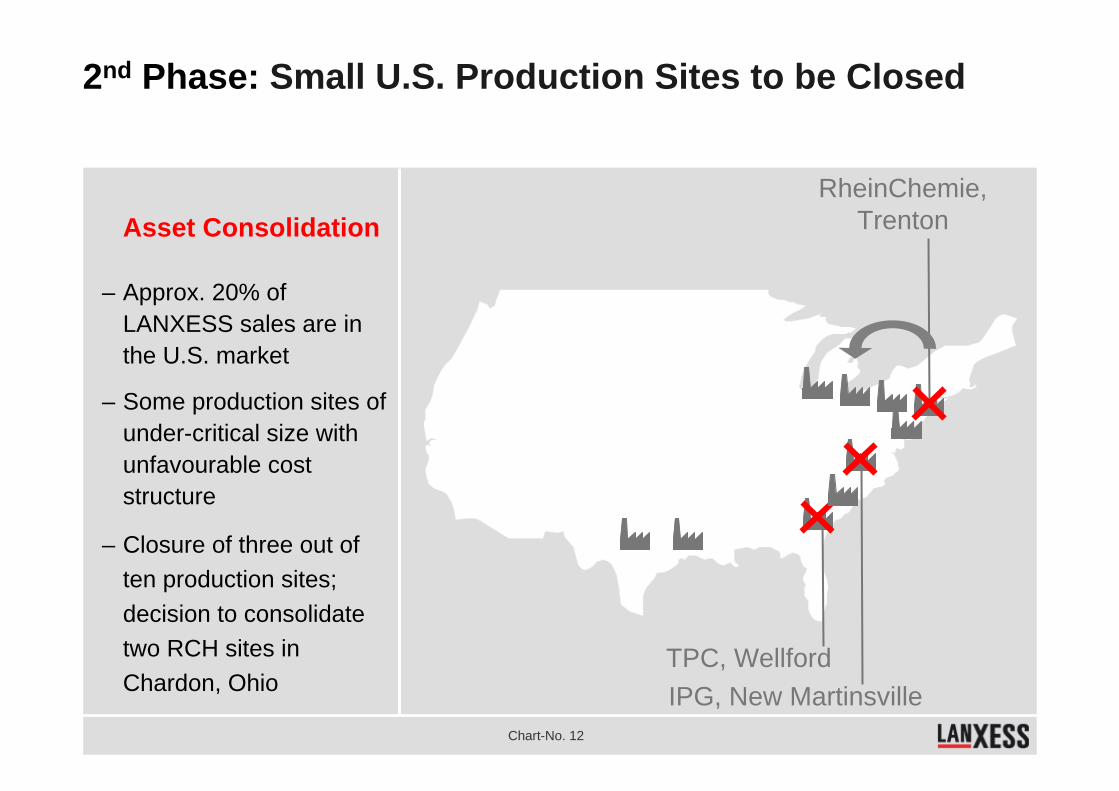
Chart-No. 12
TPC, WellfordIPG, New Martinsville
RheinChemie,Trenton
– Approx. 20% of LANXESS sales are in the U.S. market
– Some production sites of under-critical size with unfavourable cost structure
– Closure of three out of ten production sites; decision to consolidate two RCH sites inChardon, Ohio
Asset Consolidation
2nd Phase: Small U.S. Production Sites to be Closed
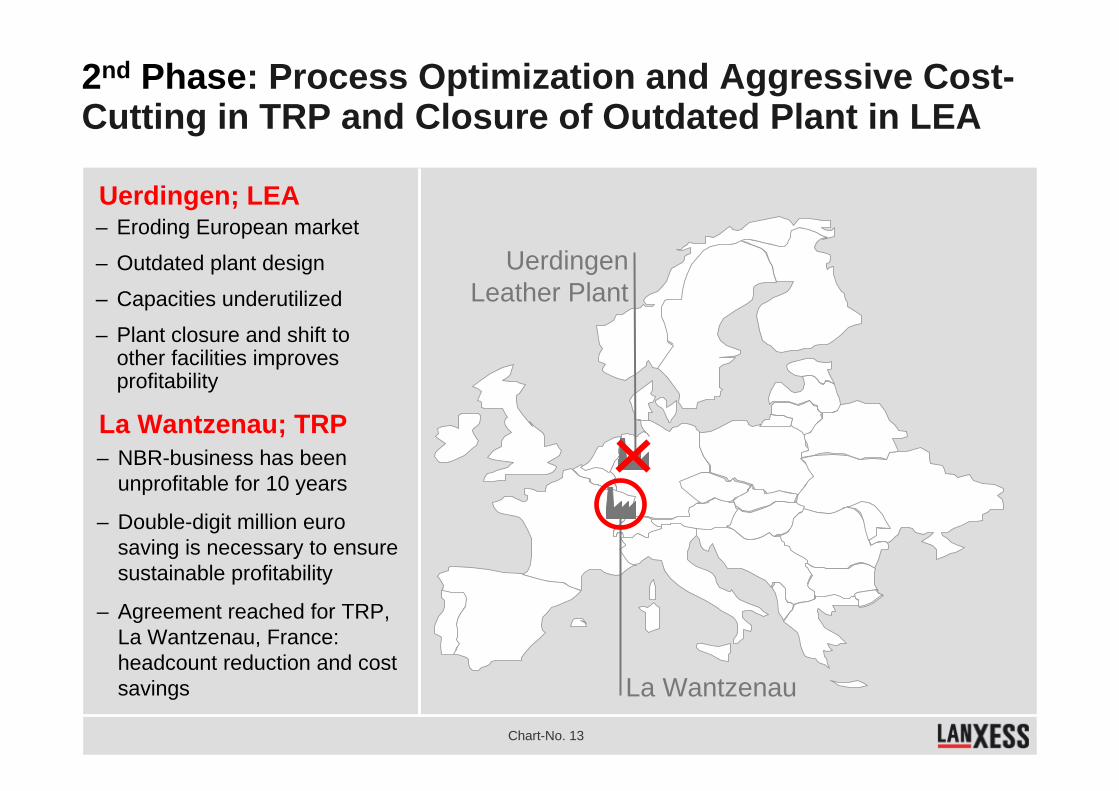
Chart-No. 13
2nd Phase: Process Optimization and Aggressive Cost-Cutting in TRP and Closure of Outdated Plant in LEA
La Wantzenau
UerdingenLeather Plant
– NBR-business has been unprofitable for 10 years
– Double-digit million euro saving is necessary to ensure sustainable profitability
– Agreement reached for TRP, La Wantzenau, France: headcount reduction and cost savings
La Wantzenau; TRP
– Eroding European market
– Outdated plant design
– Capacities underutilized
– Plant closure and shift to other facilities improves profitability
Uerdingen; LEA

Chart-No. 14
Financial Impact Due to Major Restructuring
Key Take-Aways: – €225 m total P&L expense; €250 m total cash costs– €160 m annual savings as of 2008 with EBITDA improvement of ~€120 m– Total headcount reduction: ~1,400– €132 m P&L restructuring charge in Q3 2005– ~€10 m cash out in Q3 2005
“Solidarity agreement” on top of above numbers give positive “one-time” effect of €60 m (€15 m, €20+ m and €20+ m in 2005 to 2007) - ~ €7 million effect in P&L already in Q3 2005
Phase I+II (€ m) 2005 2006 2007 2008
P&L Expenses -145 -35 -30 -15
Cash outs -40 -95 -75 -40
Cost reduction 40 90 160
EBITDA improvement 40 85 120
Headcount reduction ~340 ~670 ~400
Expected for Q4 2005: additional €10-20 m expenses, ~€30 m cash outs

Restructuring 1st Phase and 2nd Phase
Portfolioadjustment

Chart-No. 16
Fibers - First Adjustment to the Portfolio
Securing the future for the Fibers business with a strong partner
Cornerstones:− Purchase agreement with AKF signed on
December 22, 2005; transaction subject to approval of authorities
− Purchase price not disclosed
− ~280 employees in Dormagen, Germany (thereof ~170 transferred to AKF)
− ~190 employees in the Bushy Park, U.S., (thereof ~160 transferred to AKF)
Transaction cash neutral:− Financing of headcount reduction
by transaction related cash-in
− Exceptional write-off of around ~€35 m expected for Q4 2005
FIB
SCP STY
Engineering Plastics Sales by BU
Sale of Dorlastan Fibers business to Asahi Kasei Fibers planned
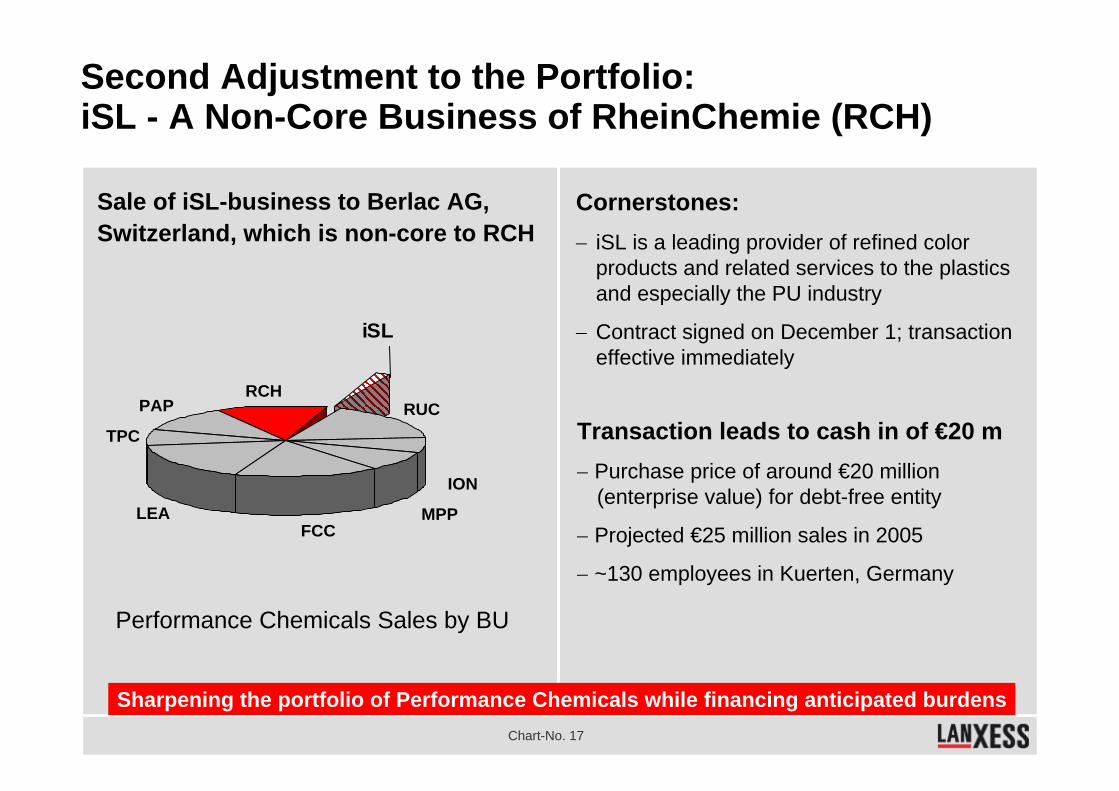
Chart-No. 17
Second Adjustment to the Portfolio:iSL - A Non-Core Business of RheinChemie (RCH)
Sharpening the portfolio of Performance Chemicals while financing anticipated burdens
Cornerstones:− iSL is a leading provider of refined color
products and related services to the plastics and especially the PU industry
− Contract signed on December 1; transaction effective immediately
Performance Chemicals Sales by BU
Sale of iSL-business to Berlac AG, Switzerland, which is non-core to RCH
MPPFCC
LEA
TPC
PAPRCH
RUC
ION
iSL
Transaction leads to cash in of €20 m− Purchase price of around €20 million
(enterprise value) for debt-free entity
− Projected €25 million sales in 2005
− ~130 employees in Kuerten, Germany

Chart-No. 18
Sale of BU Paper: Third Adjustment to the Portfolio with Kemira as Strong Partner
Sale of BU Paper at value enhancing multiples
Key Business Items:− Sales of ~€240 million in 2004 - around 2/3 of sales
consisted of toll-manufactured goods and trading goods
− EBIT-losses in 2003 and 2004
− Marginal EBITDA contribution in 2005
− 375 employees, sites in Leverkusen and Bushy Park
Transaction Cornerstones:− Purchase price of €88 million (enterprise value) on a
debt / cash-free basis
− Remnant cost for Admin, IT, etc. of around €10 million in 2006 and around €5 - €10 million in 2007
− Transaction subject to approval of anti-trust authorities
− Closing expected by end of March 2006Performance Chemicals Sales by BU
MPPFCC
LEA
TPC RCH
RUC
ION
iSL
PAP
Sale of BU Paper to Kemira:Strengthening Kemira’s leading market position by completing their product portfolio and helping to realize synergies
Chart-No. 19
1. Company Overview
2. Strategy and Restructuring
3. 9M Financials
4. Outlook and Summary
Agenda
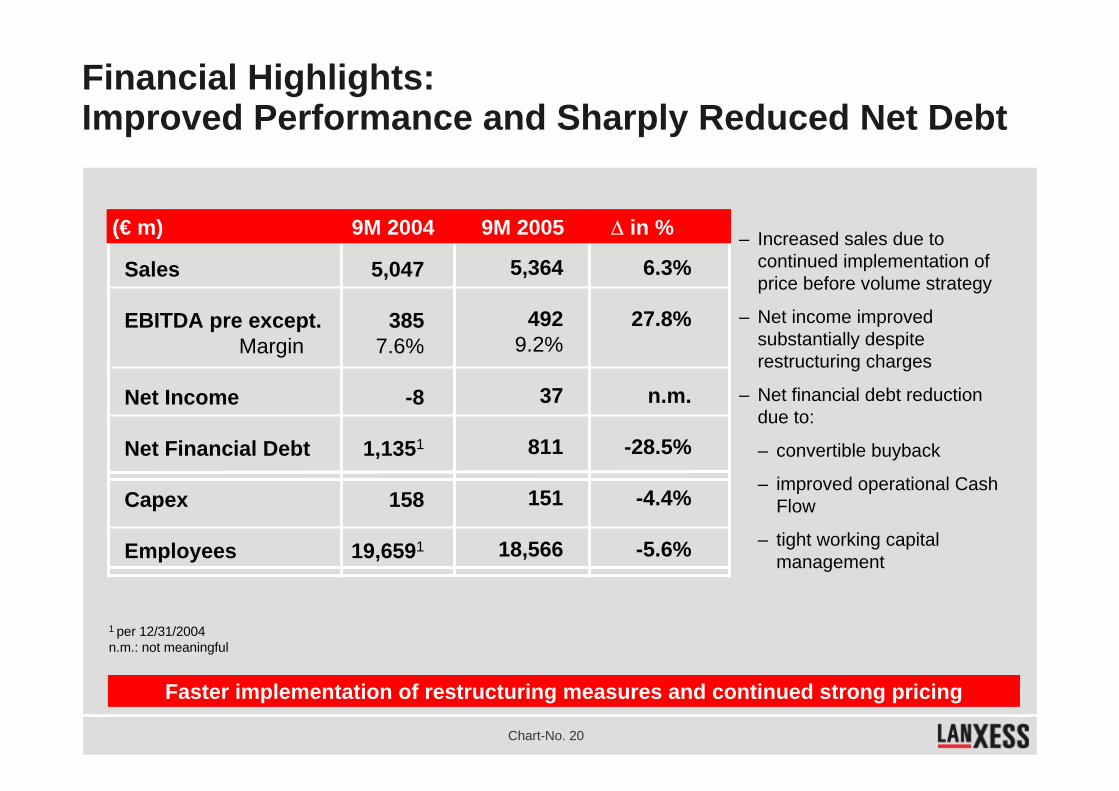
Chart-No. 20
– Increased sales due to continued implementation of price before volume strategy
– Net income improved substantially despite restructuring charges
– Net financial debt reduction due to:
– convertible buyback
– improved operational Cash Flow
– tight working capital management
Financial Highlights: Improved Performance and Sharply Reduced Net Debt
Sales
EBITDA pre except.Margin
Net Income
Net Financial Debt
Capex
Employees
5,047
3857.6%
-8
1,1351
158
19,6591
(€ m) 9M 2004 9M 2005 ∆ in %
5,364
4929.2%
37
811
151
18,566
6.3%
27.8%
n.m.
-28.5%
-4.4%
-5.6%
Faster implementation of restructuring measures and continued strong pricing
1 per 12/31/2004n.m.: not meaningful
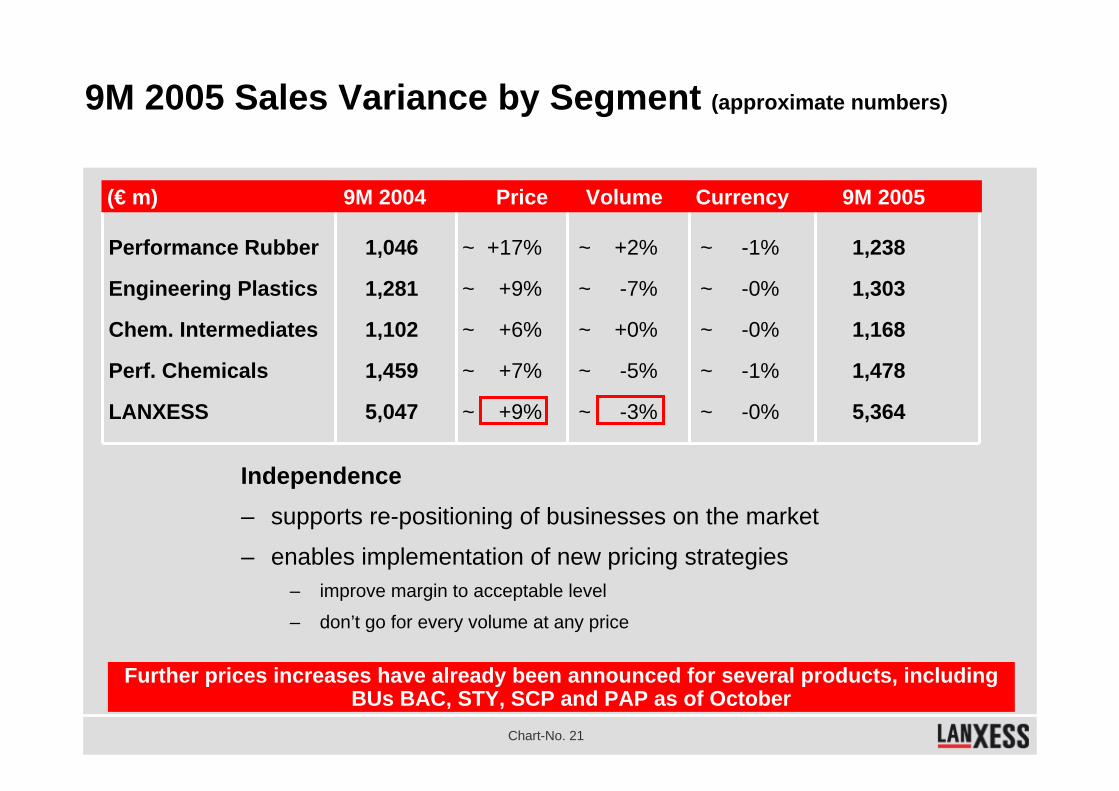
Chart-No. 21
Performance Rubber
Engineering Plastics
Chem. Intermediates
Perf. Chemicals
LANXESS
1,046
1,281
1,102
1,459
5,047
9M 2005 Sales Variance by Segment (approximate numbers)
~ +2%
~ -7%
~ +0%
~ -5%
~ -3%
(€ m) 9M 2004 Price Volume Currency 9M 2005
~ +17%
~ +9%
~ +6%
~ +7%
~ +9%
~ -1%
~ -0%
~ -0%
~ -1%
~ -0%
1,238
1,303
1,168
1,478
5,364
Further prices increases have already been announced for several products, including BUs BAC, STY, SCP and PAP as of October
Independence– supports re-positioning of businesses on the market
– enables implementation of new pricing strategies– improve margin to acceptable level
– don’t go for every volume at any price

Chart-No. 22
Non-current AssetsIntangible assets 65 60 57Property, plant & equipment 1,521 1,517 1,514Investments 85 90 93
Current AssetsInventories 1,151 1,319 1,219Trade receivables 1,137 1,212 1,119Other receivables & assets 363 395 354Liquid assets 72 178 127
Deferred taxes 172 18 56Deferred charges 11 18 22
Total assets 4,577 4,807 4,561
(€ m) Sept 30, 2005
Stockholders’ equity 1,365 1,225 1,422thereof Minority interest 14 15 17
ProvisionsPension & post empl. provisions 418 449 455Other provisions 481 583 759
LiabilitiesFinancial obligations 1,207 1,428 938
thereof Mandatory Convertible 200 211 0Trade accounts payable 820 735 637Other liabilities 190 189 200
Deferred taxes 55 152 112Deferred income 41 46 38
Total Liabilities & Equity 4,577 4,807 4,561
Dec 31, 2004 (€ m)
Balance Sheet Has Been Strengthened
June 30, 2005
Sept 30, 2005
Dec 31, 2004
June 30, 2005
The markets‘ concerns are our concerns - we therefore tackle them
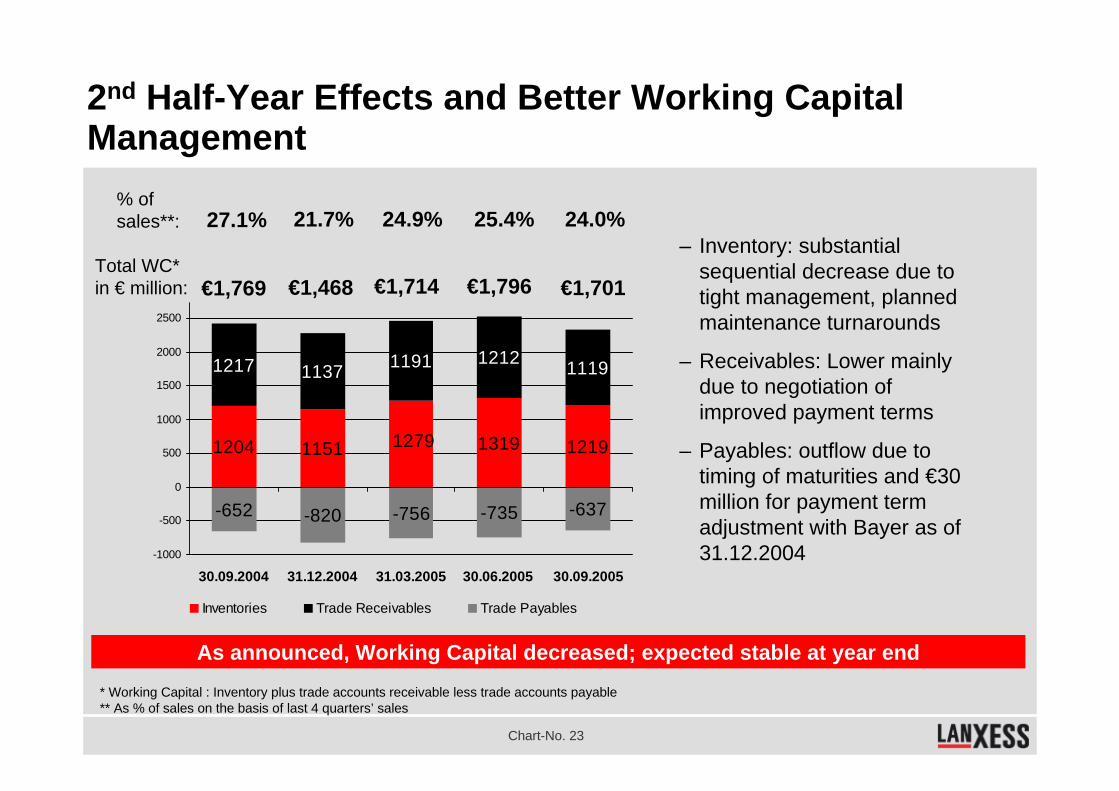
Chart-No. 23
As announced, Working Capital decreased; expected stable at year end
2nd Half-Year Effects and Better Working Capital Management
* Working Capital : Inventory plus trade accounts receivable less trade accounts payable** As % of sales on the basis of last 4 quarters’ sales
– Inventory: substantial sequential decrease due to tight management, planned maintenance turnarounds
– Receivables: Lower mainly due to negotiation of improved payment terms
– Payables: outflow due to timing of maturities and €30 million for payment term adjustment with Bayer as of 31.12.2004
1204 1151 1319 1219
1217 1137 1191 1212 1119
-652 -820 -756 -735 -637
1279
-1000
-500
0
500
1000
1500
2000
2500
30.09.2004 31.12.2004 31.03.2005 30.06.2005. 30.09.2005
Inventories Trade Receivables Trade Payables
% of sales**:
Total WC* in € million: €1,468 €1,714 €1,796 €1,701
21.7% 24.9% 25.4% 24.0%
€1,769
27.1%
Chart-No. 24
1. Company Overview
2. Strategy and Restructuring
3. Q3 Financials
4. Outlook and Summary
Agenda
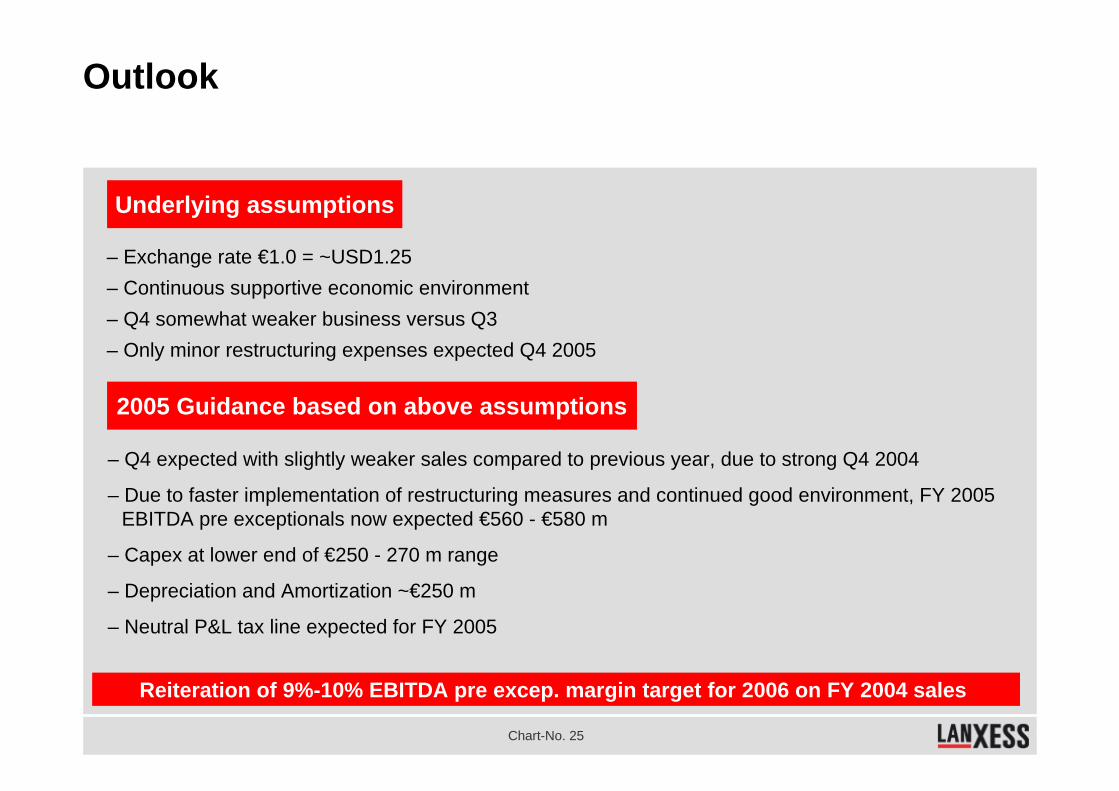
Chart-No. 25
Outlook
Underlying assumptions
2005 Guidance based on above assumptions
– Exchange rate €1.0 = ~USD1.25– Continuous supportive economic environment– Q4 somewhat weaker business versus Q3 – Only minor restructuring expenses expected Q4 2005
– Q4 expected with slightly weaker sales compared to previous year, due to strong Q4 2004
– Due to faster implementation of restructuring measures and continued good environment, FY 2005 EBITDA pre exceptionals now expected €560 - €580 m
– Capex at lower end of €250 - 270 m range
– Depreciation and Amortization ~€250 m
– Neutral P&L tax line expected for FY 2005
Reiteration of 9%-10% EBITDA pre excep. margin target for 2006 on FY 2004 sales

Chart-No. 26
Status and Way Forward
LANXESS - Promise and Delivery
Independence - Clear roles and responsibilities and committed management- Price-before-volume strategy with positive results- Strengthened finance structure
Restructuring - 1st Phase: Immediate action taken for largest loss makers - 2nd Phase: Continued restructuring in U.S. and Europe- EBITDA improvement of €120 m by 2008 p.a.
Portfolio - BU Paper: Purchase agreement signed with Kemira Oyj- BU Fibers: Purchase agreement signed with Asahi Kasei Fibers

Thank you very muchfor your attention!

Appendix

Chart-No. 29
Michael Pontzen (Head of IR) Oliver StratmannTel.: +49-214 30 43804 +49-214 30 49611Fax.: +49-214 30 959 43804 +49-214 30 959 49611Mobile: +49-175 30 43804 +49-175 30 49611
Tanja Satzer Dr. Gerd ZelesnyTel.: +49-214 30 43801 +49-214 30 71416Fax.: +49-214 30 959 43801 +49-214 30 959 71416Mobile: +49-175 30 43801 +49-175 30 71416
Please visit our website at: www.lanxess.com
Contact Details

Chart-No. 30
Full Year Results 2005 April 4, 2006
Q1 Results 2006 May 18, 2006
Q2 Results 2006 August 16, 2006
Q3 Results 2006 November 15, 2006
2nd Annual General Meeting May 31, 2006
Financial Calendar 2006

Chart-No. 31
– All BUs contributed to increased sales on the basis of improved pricing with even higher volumes in BTR, overall fully offsetting increased raw material costs
– Lower volumes due to comparison with exceptionally strong quantities in Q3 2004 - this does not represent a weakening in underlying demand
– Despite strong pricing, only slight profit increase due to higher input costs (i.e. butadiene and energy), expenses for planned maintenance and minor impact from hurricane “Rita”
Performance Rubber: All Businesses on Track
SalesEBITDepr. / Amort.EBITDAEBITDA pre except.
MarginCapex
35221113233
9.4%14
41418173539
9.4%15
Sales by BU:
(approximate numbers)
(€ m) Q3 2004 Q3 2005
BTR
PBR
TRP
414352
+23%
-6%+1%
Q3 2004 Price Volume Currency Q3 2005

Chart-No. 32
Sales by BU:
SalesEBITDepr. / Amort.EBITDAEBITDA pre except.
MarginCapex
– Improved pricing in STY and stronger volumes in SCP offset impact from weak FIB
– Only slightly improved results on the basis of sound development in STY with raised prices, supported by easing styrene input costs
– SCP somewhat burdened by costs for planned maintenance shutdown, however with solid contribution
– Restructuring is expected to further improve performance
Engineering Plastics: STY “Back in Black”
4430
131313
2.9%9
4413
111414
3.2%7
STYSCP
FIB
441443
+6%+1%
-7%
Q3 2004 Price Volume Currency Q3 2005
(approximate numbers)
(€ m) Q3 2004 Q3 2005
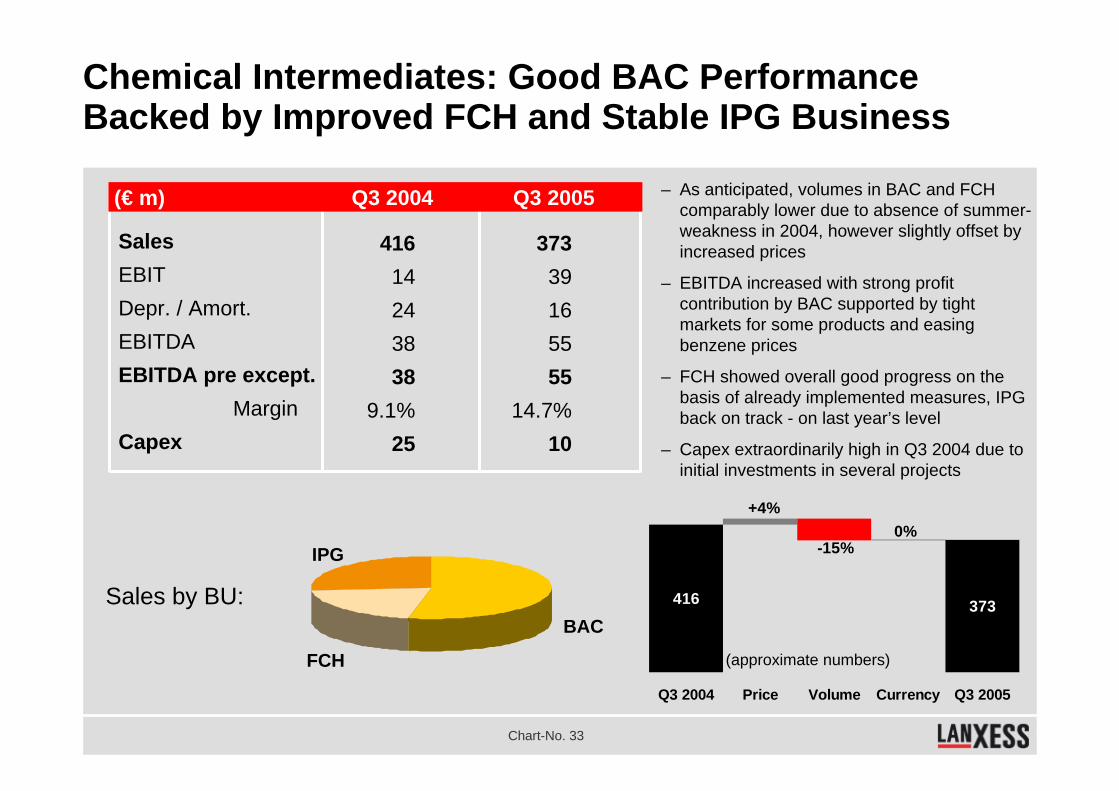
Chart-No. 33
SalesEBITDepr. / Amort.EBITDAEBITDA pre except.
MarginCapex
– As anticipated, volumes in BAC and FCH comparably lower due to absence of summer-weakness in 2004, however slightly offset by increased prices
– EBITDA increased with strong profit contribution by BAC supported by tight markets for some products and easing benzene prices
– FCH showed overall good progress on the basis of already implemented measures, IPG back on track - on last year’s level
– Capex extraordinarily high in Q3 2004 due to initial investments in several projects
Chemical Intermediates: Good BAC Performance Backed by Improved FCH and Stable IPG Business
41614243838
9.1%25
37339165555
14.7%10
BAC
FCH
IPG
373
-15%
+4%
416
0%
Q3 2004 Price Volume Currency Q3 2005
(approximate numbers)
Sales by BU:
(€ m) Q3 2004 Q3 2005
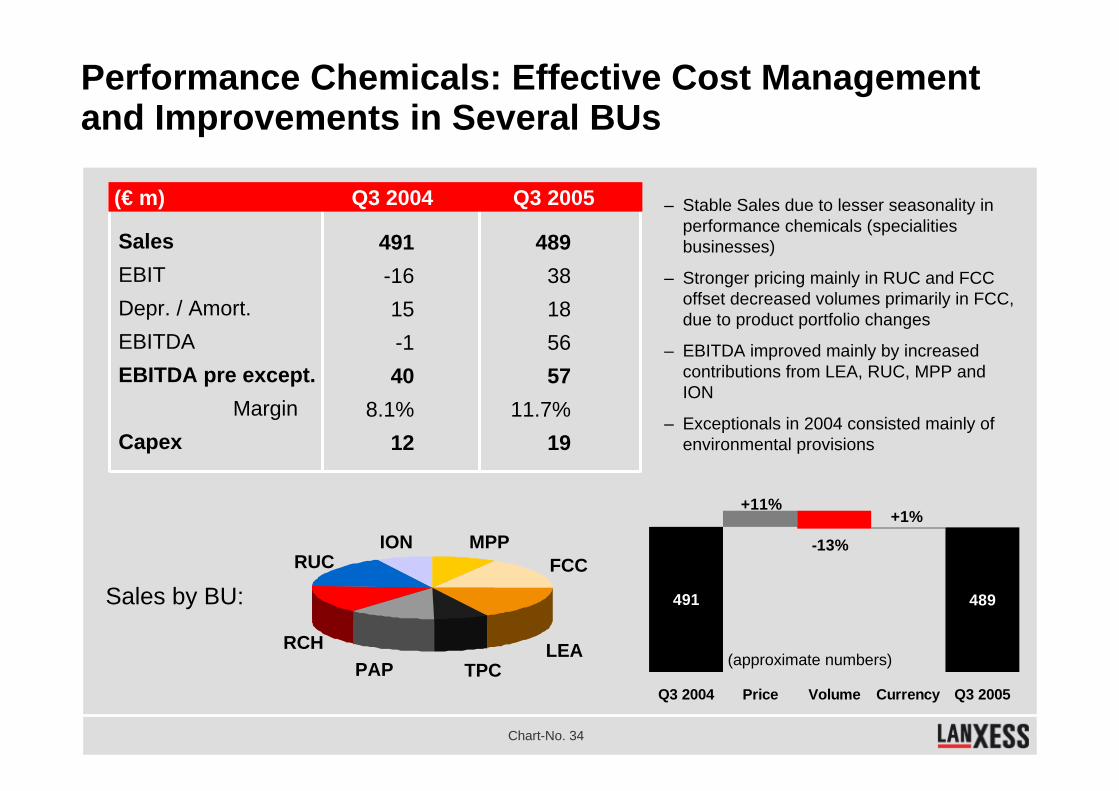
Chart-No. 34
– Stable Sales due to lesser seasonality in performance chemicals (specialities businesses)
– Stronger pricing mainly in RUC and FCC offset decreased volumes primarily in FCC, due to product portfolio changes
– EBITDA improved mainly by increased contributions from LEA, RUC, MPP and ION
– Exceptionals in 2004 consisted mainly of environmental provisions
Performance Chemicals: Effective Cost Management and Improvements in Several BUs
SalesEBITDepr. / Amort.EBITDAEBITDA pre except.
MarginCapex
491-1615-140
8.1%12
48938185657
11.7%19
MPPFCC
LEATPCPAP
RCH
RUCION
489
-13%
+11%
491
+1%
Q3 2004 Price Volume Currency Q3 2005
(approximate numbers)
Sales by BU:
(€ m) Q3 2004 Q3 2005
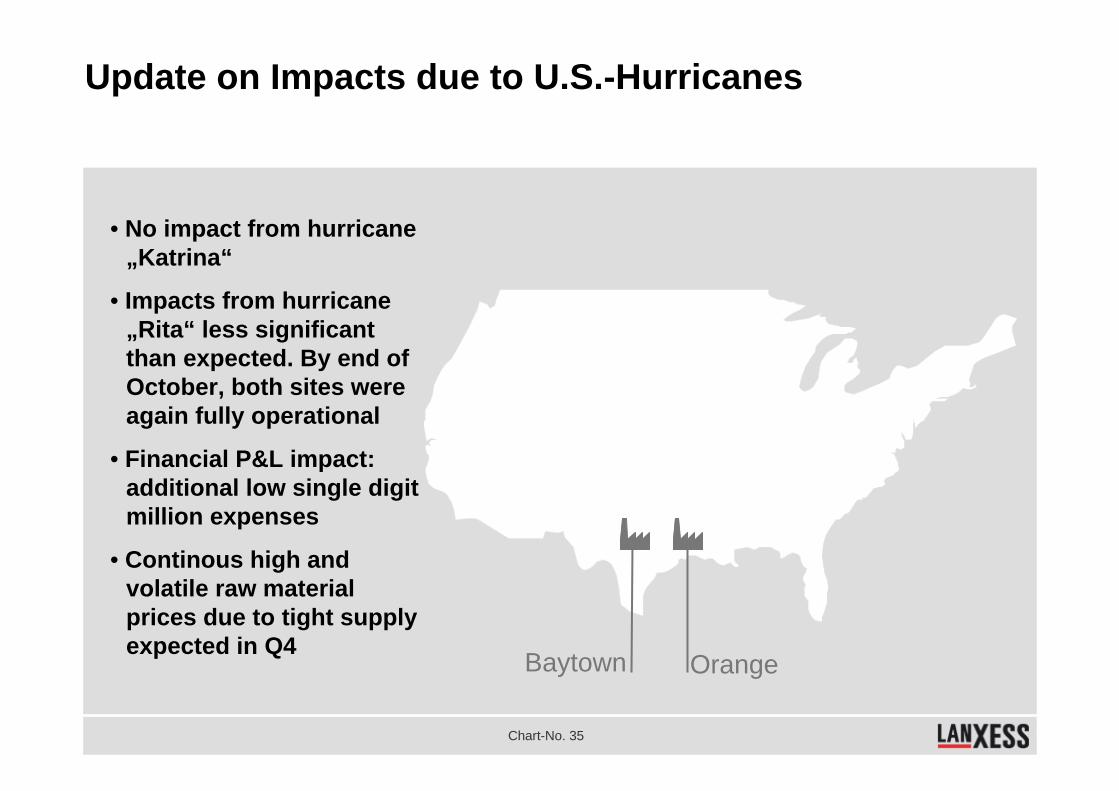
Chart-No. 35
• No impact from hurricane„Katrina“
• Impacts from hurricane „Rita“ less significant than expected. By end ofOctober, both sites were again fully operational
• Financial P&L impact: additional low single digit million expenses
• Continous high and volatile raw material prices due to tight supply expected in Q4
Update on Impacts due to U.S.-Hurricanes
OrangeBaytown

Chart-No. 36
Supportive market environment expected to continue into 2006
Business Outlook I
Performance Rubber
– No noteworthy competitive capacity additions expected to come on stream in BTR and PBR midterm - therefore supply / demand is expected to remain well balanced
– New capacity additions at the Sarnia and Zwijndrecht BTR sites in ‘06 and ‘07 are going to support our operational performance from 2007 on
– Continuous market support for “price before volume” strategy in PBR; repositioning of TRP especially by restructuring and product portfolio re-alignment
Engineering Plastics
– Volatile market environment in main customer endmarkets such as automobile and electronics expected to continue in 2006
– Improvements from restructuring being realised, site consolidation and focus on production of ABS-specialities on track
– Favourable development in SCP is fostered by growth strategy in China– Favourable contracts in place for our merchant market supply of
caprolactam
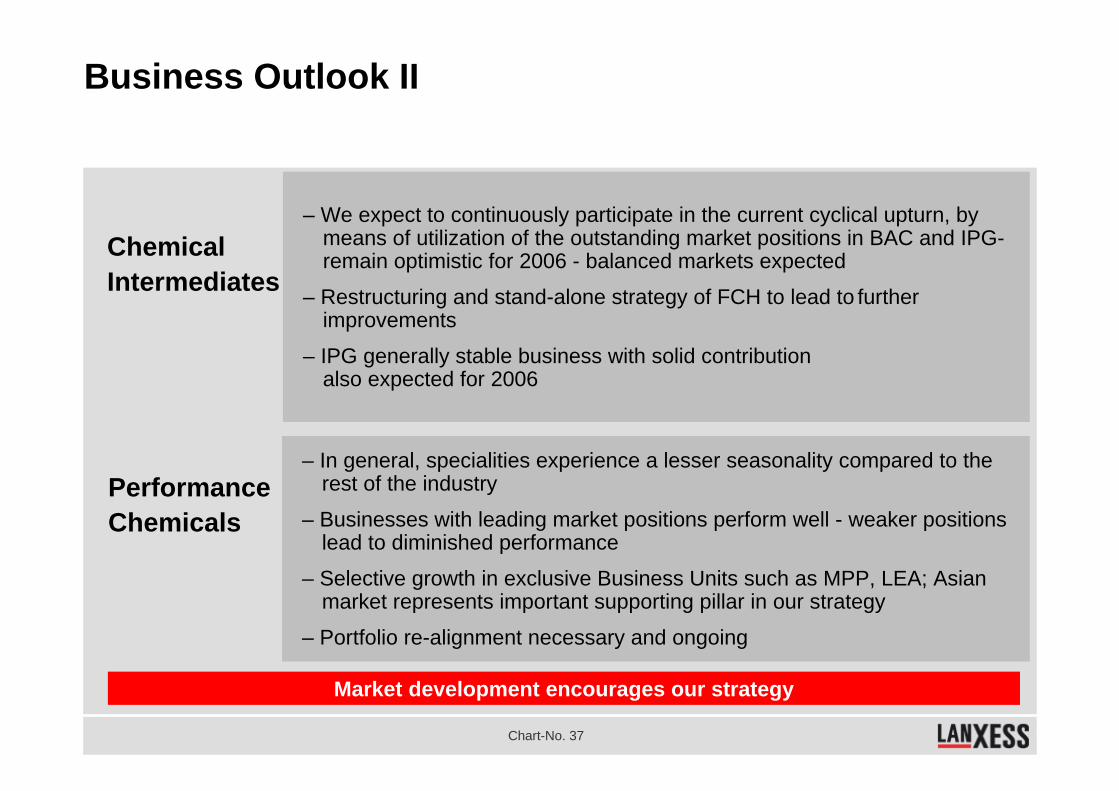
Chart-No. 37
Market development encourages our strategy
Business Outlook II
Chemical Intermediates
– In general, specialities experience a lesser seasonality compared to the rest of the industry
– Businesses with leading market positions perform well - weaker positions lead to diminished performance
– Selective growth in exclusive Business Units such as MPP, LEA; Asian market represents important supporting pillar in our strategy
– Portfolio re-alignment necessary and ongoing
Performance Chemicals
– We expect to continuously participate in the current cyclical upturn, by means of utilization of the outstanding market positions in BAC and IPG-remain optimistic for 2006 - balanced markets expected
– Restructuring and stand-alone strategy of FCH to lead to further improvements
– IPG generally stable business with solid contribution also expected for 2006

Chart-No. 38
Exceptional thereof D&A Exceptional thereof D&A
Performance Rubber 1 0 4 0
Engin. Plastics 2 2 3 3
Chemical Intermediates 7 7 2 2
Performance Chemicals 40 -1 1 0
Reconciliation 0 0 132 4
Total 50 8 142 9
– “Rubber” Litigation
Exceptional Items Incurred in Q3 2004 and 2005
(€ m) Q3 2004 Q3 2005
– Capex write-off and amendment to 2003 impairment in 2004
– Capex write-off
– Majority: Environm. provision in 2004, “Rubber” litigation 2005
– Phase I+II restructuring
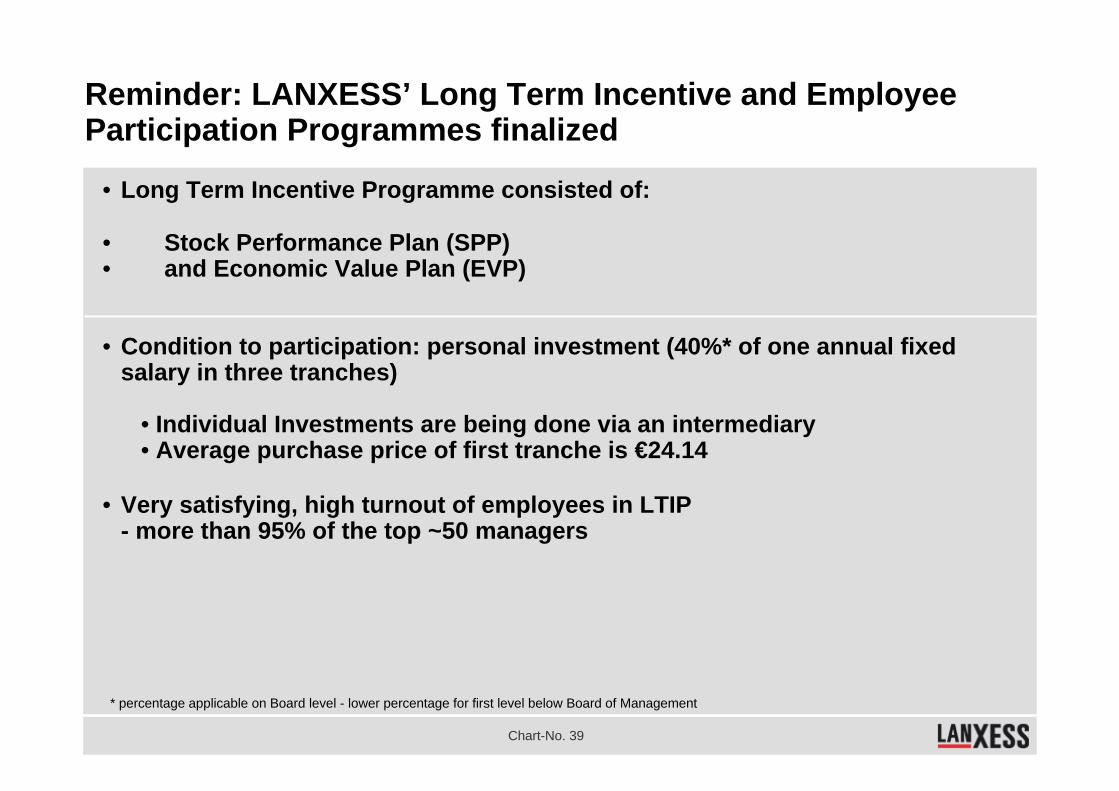
Chart-No. 39
Reminder: LANXESS’ Long Term Incentive and Employee Participation Programmes finalized
• Long Term Incentive Programme consisted of:
• Stock Performance Plan (SPP)• and Economic Value Plan (EVP)
• Condition to participation: personal investment (40%* of one annual fixed salary in three tranches)
• Individual Investments are being done via an intermediary• Average purchase price of first tranche is €24.14
• Very satisfying, high turnout of employees in LTIP - more than 95% of the top ~50 managers
* percentage applicable on Board level - lower percentage for first level below Board of Management

Chart-No. 40
LANXESS LTIP’s on Board Level: Stock Performance Plan (SPP) and Economic Value Plan (EVP)
• Condition to participation: Personal investment (40% of one annual fixed salary in three tranches)
• Stock Performance Plan (SPP) • Benchmark: Outperformance of the DJ global STOXX 600 Chemicals index
(index+10%:100% targeted payout, index+20%: cap and maximum payout)• Targeted payout*: 90% of one total annual salary (fixed and variable)• Vesting period: 3 years, following 2 years of exercise period for each tranche• Blackout periods: surrounding earnings releases and AGM• Grant price: volume weighted average of first ten trading days (€15.01 for first tranche)
• Economic Value Plan (EVP)• Benchmark: Increase of Economic Value over three years (‘04-’07, ‘05-’08, ‘06-’09)
according to business planEconomic Value = EBITDA * Multiplier, less net nebt
• Targeted payout*: 40% of one total annual salary• Vesting period: 3 years, automatic exercise after 3 years
• Accounting treatment: Value calculated by option pricing model (Black-Scholes) will be expensed over three years for each tranche.
* percentage applicable on Board level - lower percentage for first level below Board of Management
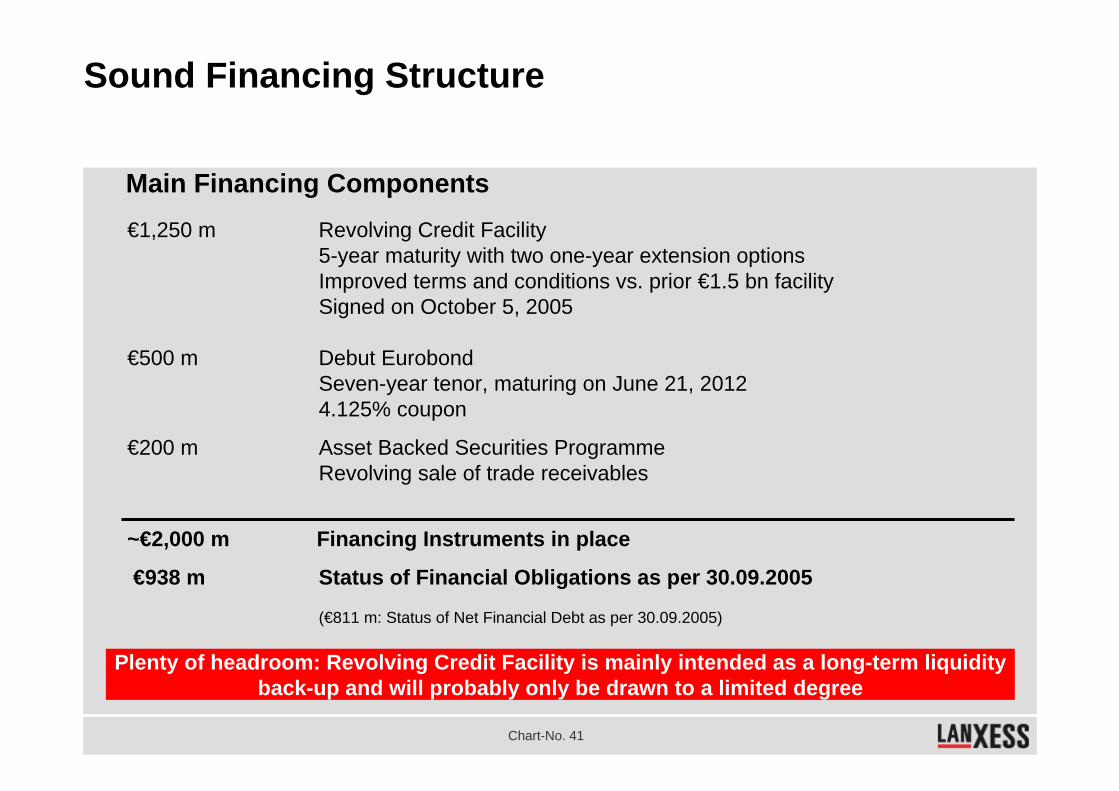
Chart-No. 41
Sound Financing Structure
Main Financing Components€1,250 m Revolving Credit Facility
5-year maturity with two one-year extension optionsImproved terms and conditions vs. prior €1.5 bn facilitySigned on October 5, 2005
€500 m Debut Eurobond Seven-year tenor, maturing on June 21, 20124.125% coupon
€200 m Asset Backed Securities ProgrammeRevolving sale of trade receivables
~€2,000 m Financing Instruments in place
€938 m Status of Financial Obligations as per 30.09.2005
(€811 m: Status of Net Financial Debt as per 30.09.2005)
Plenty of headroom: Revolving Credit Facility is mainly intended as a long-term liquidityback-up and will probably only be drawn to a limited degree

Chart-No. 42
EBIT 76 139
Income Taxes -52 -72
Depreciation & Amortization 249 217
Change in Pension Provisions -27 0
Gain/ Loss from Sale of Assets 6 -2
Change in Working Capital* -300 -161
Change in Other Net Current Assets 88 237
Cash provided by Operating Act. 40 358
Capex -158 -151
Cash Flow used in Investing Activities** 85 -140
Cash Flow used in Financing Activities -59 -162
Cash at End of Period 80 127
Improved Cash Flow: Stronger Operating Results Combined with Improved Working Capital Management
Excess Cash has been used to reduce Net Financial Debt
– Cashflow improved mainly on higher operating result
– Strong improvement in working capital, despite ~€30 million cash out for payment term adjustment with Bayer
– Continuous tight Capexmanagement
* Working Capital : Inventory plus trade accounts receivable less trade accounts payable** including Capex
(€ m) 9M 2004 9M 2005

Chart-No. 43
Quarterly Overview 2004/ 2005
Q1 Q2 H1 Q3 9M Q4 FYSales 2004 2005 2004 2005 2004 2005 2004 2005 2004 2005 2004 2004
Perf Rubber 326 392 368 432 694 824 352 414 1046 1238 385 1431Eng Plastics 407 414 431 448 838 862 443 441 1281 1303 441 1722ChemIntermed 366 389 320 406 686 795 416 373 1102 1168 385 1487Perf Chem 478 478 490 511 968 989 491 489 1459 1478 451 1910Recon 33 56 64 62 97 118 62 59 159 177 64 223Lanxess 1610 1729 1673 1859 3283 3588 1764 1776 5047 5364 1726 6773
EBITDA pre exc. 2004 2005 2004 2005 2004 2005 2004 2005 2004 2005 2004 2004Perf Rubber 32 56 49 70 81 126 33 39 114 165 9 123Eng Plastics 21 35 8 14 29 49 13 14 42 63 7 49ChemIntermed 81 65 31 59 112 124 38 55 150 179 52 202Perf Chem 55 58 43 58 98 116 40 57 138 173 14 152Recon -24 -33 -16 -38 -40 -71 -19 -17 -59 -88 -20 -79Lanxess 165 181 115 163 280 344 105 148 385 492 62 447

Chart-No. 44
Antitrust Proceedings in Bayer AG‘s former Rubber Bussiness Group
With respect to all liabilities arising out of the antitrust proceedings relating to the former Bayer rubber business, LANXESS bears 30% of such liabilities to a limit of €100 million (excl. legal defence costs and tax disadvantages). In relation to settlement agreements Bayer is entering into with several groups of plaintiffs in the US, LANXESS is making an extraordinary provision in the amount of €61 million in Q4 2005. Taken into account the €39 million of provisions already made, the maximum liability of LANXESS is now reached.
• The payments are limited to €50 million per year.
• First payments in the amount of €20 million have been made in Q1 2005. Therefore the maximum payment in Q4 2005 is €30 million.
• In dependence on the finalization of the settllement agreements Bayer is entering into, the payment of the€30 million might occur in 2007, however.
3030
50
20
Q1 2005 eQ4 2005 e2006 e2007
Expected timing of the payments in € million
There will be no further P&L impacts for LANXESS from the Bayer antitrust proceedings