language, learning, and memory in children with and
TRANSCRIPT

clinical articleJ neurosurg Pediatr 17:578–588, 2016
Premature fusion of one of the major cranial sutures (sagittal, metopic, coronal, or lambdoid), known as single-suture craniosynostosis (SSC), occurs in ap-
proximately 1 in 1700 to 1 in 2500 live births.17,42 Stud-ies of infants with SSC have shown that affected children demonstrate modest delays in motor and cognitive de-velopment relative to test norms.22,24 In the largest infant study to date, we followed children with and without SSC from infancy to age 3 years and found that children with
SSC scored from 0.25 to 0.50 standard deviations lower than unaffected control children in cognitive, language, and motor development.44–46 The few studies of older children indicate that, as a group, global intelligence for children with SSC is within the average range compared with test norms. However, there is a downward shift in the distribution of IQ scores among children with SSC, with more children than expected scoring at the lower end of the distribution and fewer scoring above average.9,15,24,43
abbreviations CCC-2 = Children’s Communication Checklist-2; CGH = comparative genomic hybridization; CMS = Children’s Memory Scale; NEPSY-II = NEPSY-II: A Developmental Neuropsychological Assessment; PDI = Psychomotor Development Index; SES = socioeconomic status; SIDI = Social Interaction Difference Index; SSC = single-suture craniosynostosis; Token Test-II = Token Test for Children, Second Edition; WISC-IV = Wechsler Intelligence Scale for Children-IV; WPT = Wonderlic Personnel Test.submitted April 17, 2015. accePted September 11, 2015.include when citing Published online January 1, 2016; DOI: 10.3171/2015.9.PEDS15238.
Language, learning, and memory in children with and without single-suture craniosynostosisKathleen a. Kapp-simon, Phd,1,2 erin wallace, Phd,3 brent r. collett, Phd,3,4 mary michaeleen cradock, Phd,5 canice e. crerand, Phd,6,7 and matthew l. speltz, Phd3,4
1Cleft-Craniofacial Center, Shriners Hospitals for Children, Chicago; and 2Craniofacial Center, Department of Surgery, University of Illinois at Chicago, Illinois; 3Seattle Children’s Research Institute; and 4Department of Psychiatry and Behavioral Medicine, University of Washington School of Medicine, Seattle, Washington; 5Department of Psychology, St. Louis Children’s Hospital, St. Louis, Missouri; 6Center for Biobehavioral Health, The Research Institute at Nationwide Children’s Hospital; and 7Departments of Pediatrics and Plastic Surgery, The Ohio State University College of Medicine, Columbus, Ohio
obJective The language and memory functions of children with and without single-suture craniosynostosis (SSC) were compared at school age (mean 7.45 years, standard deviation [SD] 0.54 years). The children in this cohort were originally recruited in infancy and prior to cranial surgery for those with SSC.methods Individual evaluations of 179 school-aged children with SSC and 183 controls were conducted (70% of the original cohort) using standardized measures of language, learning, and memory. Parents participated in an interview about specialized education interventions and school progress. Parents and teachers completed questionnaires about language development.results Children with SSC (cases) obtained lower scores than controls on all measures. The adjusted differences in language, learning, and memory scores were modest, with SD ranging from 0.0 to −0.4 (p values ranged from 0.001 to 0.99). Censored normal regression was used to account for intervention services received prior to the school-age evalu-ation; this increased case-control differences (SD range 0.1 to −0.5, p value range 0.001 to 0.50). Mean scores for cases in each SSC diagnostic group were lower than those for controls, with the greatest differences observed among children with unilateral coronal craniosynostosis.conclusions Children with SSC continue to show poorer performance than controls on language, learning, and memory tasks at early elementary school age, even when controlling for known confounders, although mean differences are small. Multidisciplinary care, including direct psychological assessment, for children with SSC should extend through school age with a specific focus on language and conceptual learning, as these are areas of potential risk. Future research is needed to investigate language, memory, and learning for this population during the middle to high school years.http://thejns.org/doi/abs/10.3171/2015.9.PEDS15238Key words craniosynostosis; language; learning; memory; neuropsychological functioning; craniofacial
©AANS, 2016J neurosurg Pediatr Volume 17 • May 2016578
Unauthenticated | Downloaded 12/10/21 08:27 PM UTC
single-suture craniosynostosis, language, learning, and memory
J neurosurg Pediatr Volume 17 • May 2016 579
These findings, along with studies of related neuropsy-chological functions, have led researchers to suggest that children with SSC are at greater risk of learning problems than unaffected peers.20,22,24,31,36,43 However, it is not yet clear which specific areas of learning are at greatest risk.
Language and memory are specific skills that are criti-cal for academic success, and several studies have report-ed that some children with SSC—perhaps one-third or more—have deficits in this area.4,23,26,34,41 However, other studies have found little evidence of language or memory deficits in children with SSC,6,15 or have reported much smaller percentages of affected children.8,9,48 Furthermore, most investigations of these outcomes have not used con-trol groups to adjust for the potentially strong influence of socioeconomic variables on language and other specific skills.16
In the present study, we examined language and memo-ry skills in children with SSC relative to demographically similar, unaffected controls, using a broad, standardized battery of clinician-administered tests, as well as parent and teacher report measures. The study builds on previ-ously published work from this cohort when the subjects were infants, and on a recent paper showing modest dif-ferences between children with SSC and unaffected con-trols on measures of global intelligence and academic achievement at elementary school age.43 We hypothesized that children with SSC would score lower than unaffected children on measures of language and memory. Based on previous studies showing subgroup differences among cases,9,43 we also explored differences as a function of su-ture fusion location. In secondary analyses, we examined the effects of early interventions (e.g., speech and language therapy, special education services) on case-control differ-ences, and whether findings were altered when accounting for possible attrition bias and the exclusion of cases with known or probable genetic mutations.
methodsstudy design
Data are derived from our fourth evaluation of children with SSC (cases) and a comparison group of unaffected children (controls) who were part of a multisite longitu-dinal study of neurobehavioral development (see Starr et al.45 for details regarding study design and recruitment). Participants were initially enrolled between January 2002 and December 2006, prior to cranioplasty surgery for the case participants. Approximately 90% of the children were 7 years of age and in first or second grade at the time of the current evaluation.
CasesPatients were referred to this study by their surgeon or
pediatrician at the time of diagnosis and prior to surgical intervention. Study sites included Seattle Children’s Hos-pital (Washington); Northwestern University, enrolling children through Children’s Memorial Hospital (Illinois), and, after January 2006, Children’s Hospital of Philadel-phia (Pennsylvania); Children’s Health Care of Atlanta (Georgia); and St. Louis Children’s Hospital (Missouri).
Eligible infants included those who 1) had isolated sag-
ittal, metopic, unilateral coronal, or unilateral lambdoid craniosynostosis; 2) had yet to undergo cranial vault sur-gery; and 3) were ≤ 30 months of age at the time of recruit-ment. Premature infants (< 34 weeks); infants with a major medical or neurological condition (e.g., cardiac defects, cerebral palsy, etc.); and infants with more than 3 extra-cranial minor malformations30 or any other major malfor-mation were excluded. For patients for whom parents gave consent, we collected biospecimens and analyzed genetic data by array comparative genomic hybridization (CGH) and candidate and gene resequencing (for details see Cun-ningham et al.14). Children with SSC who had a genetic variant (including a known or probable causal mutation for craniosynostosis) were eligible if they had no pheno-typic features of a known syndrome and otherwise met all inclusion criteria.
We enrolled 270 cases (84% of those eligible), 4 of which were later found to be ineligible. Among the 266 infants seen at baseline, 182 children (68%) had a school-age study visit and at least 1 valid outcome score among the measures described below. Mean age at surgery was 9.1 months. Most children underwent surgery by age 12 months (80%) and almost all children by 24 months (98%). Three patients with metopic SSC had not undergone cra-nioplasty by age 7 years and were excluded from the cur-rent analyses. Results of genetic testing were available for 173 of 179 cases participating in the school age evaluation.
ControlsInfants were eligible as controls if they had no known
craniofacial anomaly and met none of the exclusion cri-teria for cases. Controls were recruited through pediatric practices, birthing centers, and announcements in publi-cations of interest to parents of newborns. Controls were frequency-matched to cases on potential demographic confounders, including child age at enrollment and sex, family socioeconomic status (SES; assessed via the Hol-lingshead Index21), and race/ethnicity.
Among the 257 controls seen at baseline, 183 (71%) were assessed at the school age visit and had at least 1 valid outcome score.
measuresWechsler Intelligence Scale for Children-IV
The Vocabulary and Similarities subtests from the Wechsler Intelligence Scale for Children-IV (WISC-IV)50 Verbal Comprehension Index were used to assess word knowledge and verbal reasoning. Based on these scores, a composite prorated standard score was generated using the WISC-IV scoring software. The Verbal Comprehension Index has a norm-referenced mean of 100 and SD of 15.
Children’s Memory ScaleTwo subtests from the Children’s Memory Scale
(CMS),11 Stories and Word Lists, were administered to as-sess immediate, delayed, and delayed recognition memory. For the Stories subtest, children are asked to repeat a story verbatim and receive credit for story elements remem-bered and story themes articulated. For the Word Lists subtest, children are asked to remember a list of 14 unre-
Unauthenticated | Downloaded 12/10/21 08:27 PM UTC

K. a. Kapp-simon et al.
J neurosurg Pediatr Volume 17 • May 2016580
lated words over 5 trials. After each trial, the words missed on the previous trial are repeated, and the child is asked to recall the entire list. A learning score is calculated based on the child’s progress in learning the list of words. Both subtests have a delayed recall component that assesses memory after a delay of 30–35 minutes. Following the de-layed recall, children are given choices and asked to indi-cate if that information was presented previously (delayed recognition). For each subtest, scaled scores are generated with a norm-referenced mean of 10 and SD of 3.
NEPSY-II: A Developmental Neuropsychological Assessment Verbal fluency was assessed by administering the
NEPSY-II: A Developmental Neuropsychological Assess-ment (NEPSY-II)25 Word Generation subtest. Children are asked to provide as many words within a category (se-mantic) or that begin with a specific letter (initial letter) as they are able within a specified time frame. Standardized scores with a mean of 10 and SD of 3 are generated sepa-rately for the semantic and initial letter subscales.
Token Test for Children, Second Edition The Token Test for Children, Second Edition (Token
Test-II)33 assesses receptive language, sequential memory, syntax, and prepositional concepts. Children are asked to follow up to 46 commands of increasing difficulty. A single standardized score with a mean of 100 and SD of 15 is generated for this test.
Children’s Communication Checklist-2Parents and teachers completed the Children’s Com-
munication Checklist-2 (CCC-2),7 a measure of children’s communication skills that assesses a child’s competence in using language based on syntax, morphology, seman-tics, and pragmatics of communication. The General Communication Composite score is a summary measure of a child’s communication skills and has a mean standard score of 100 with an SD of 15. The Social Interaction Dif-ference Index (SIDI) helps determine if a child has a prag-matic or language disorder. Children with low scores (less than −10) on the SIDI may show pragmatic deficits due to poor nonverbal communication, initiation skills, or social relatedness while children with high SIDI scores (greater than +10) are suspect for a language disorder. Absolute values of the SIDI were used in analyses to detect differ-ences at either end of the scale.
Wonderlic Personnel TestThe Wonderlic Personnel Test (WPT)51 is a timed,
norm-referenced screening measure of general intelli-gence in adolescents and adults. The WPT has good re-liability and correlates well with clinician-administered measures (e.g., the Wechsler scales). The WPT was ad-ministered to mothers of participating children, allowing us to control for maternal IQ in case versus control group comparisons.
Caregiver InterviewPrimary caregivers completed a semistructured inter-
view to collect information on child medical history, in-
cluding diagnosis of hearing loss, speech and language de-lays, and learning problems. When relevant, we collected information on interventions that children received in the community, including early intervention services (e.g., speech and language therapy or hearing-impaired services), occupational or physical therapy, behavioral interventions, response to intervention services, or special education.
ProceduresWe obtained informed consent for each enrolled sub-
ject following the protocols approved by the institutional review boards of each participating institution.
All testing sessions were video-recorded, and all test administrations were independently scored by a second psychometrist. Scoring errors were recorded, and dis-agreements between psychometrists were resolved by one of the psychologist investigators (K.K.S., B.R.C., or M.L.S.). Resolved scores were used for all analyses. Among all administrations of the measures reported here, 84% of the WISC-IV administrations were error free, as were 77% of CMS, 84% of the NEPSY-II, and 92% of the Token Test. All standardized tests demonstrated accept-able reliability and validity.7,11,25,33,50,51
A caregiver interview was used to update family dem-ographic information and medical history and to provide information on interventions that the child was currently receiving or had received since their last assessment at age 3 (e.g., speech or language therapy). In keeping with ethi-cal standards for the use of psychometric tests in research with minors,27 parents were offered a written summary of their child’s test results; they were encouraged to share this information with their child’s pediatrician or teacher.
statistical analysisThe distributions of demographic characteristics and
language, learning, and memory scores were calculated separately for cases and controls. Because approximately one-third of the children from the original study were lost to attrition, we also compared the demographic and neurodevelopmental characteristics of children seen at the school-age visit to those lost to follow-up.
Linear regression with robust standard errors was used to estimate differences in language, learning, and memory scores between cases and controls, with corresponding 95% confidence intervals. All analyses were adjusted for the child’s age at assessment (in months, continuous), sex, family SES21 (composite score, continuous), and mater-nal IQ (continuous, measured at baseline by the WPT). We used logistic regression with robust standard errors to compare the proportion of cases and controls report-ing a current or prior history of speech or language ther-apy, hearing problems, hearing services, or a diagnosis of a language disorder. Because both negative and positive SIDI scores can indicate communication problems, SIDI scores were converted to absolute values for all analyses.
We also evaluated whether language, learning, and memory scores differed by the site of the affected suture (sagittal, metopic, unilateral coronal, and unilateral lamb-doid synostosis) using linear regression with robust stan-dard errors and with controls considered the referent cat-
Unauthenticated | Downloaded 12/10/21 08:27 PM UTC

single-suture craniosynostosis, language, learning, and memory
J neurosurg Pediatr Volume 17 • May 2016 581
egory. Overall group differences were tested using Wald tests.
Several sensitivity analyses were performed. To ex-plore the impact of selection bias due to study attrition, we repeated the primary analyses using inverse probability weighting.40 This method places greater weight on obser-vations from subjects seen at school age who are similar in terms of baseline characteristics to those of children lost to follow-up. Weights were estimated based on fac-tors observed at baseline in all subjects, including date of birth, sex, race/ethnicity, prematurity (< 38 weeks’ gesta-tion, coded yes/no), case status, suture diagnosis, parents’ marital status, maternal IQ, study site, and scores from the Bayley Scales of Infant Development-2 (Psychomotor Development Index [PDI]) and the Preschool Language Scale-3 (auditory comprehension) completed at baseline.45 Finally, we repeated the primary analyses after excluding 19 children with SSC in whom known or probable causal mutations for craniosynostosis were detected through ar-ray comparative genomic hybridization and candidate and gene resequencing.14
We used censored normal regression to account for the possible effects of interim intervention on subsequent scores. We accounted for a number of interventions that may influence language, learning, and memory skills, including early developmental therapy; participation in state/county programs that monitor infant development; language, vision, and hearing therapy; physical or occu-pational therapy; mental health services; and special ed-ucation services. This approach assumes that the scores of children who received intervention services are “left-censored.” In other words, while it is unknown what the child’s “true score” would have been without intervention, it is assumed to be at least as low as their observed scores with intervention.
All analyses were performed using Stata version 12 (StataCorp LP).
resultsOne hundred seventy-nine patients and 183 controls
were seen at the early elementary school visit. Mean age at the time of the assessment for the patients was 7.5 years (range 6.9–9.5 years) and for controls was 7.4 years (range 7.0–11.1 years). Ninety-three percent of participants were in first or second grade. Children in both the case and con-trol groups were predominantly male, identified as white or non-Hispanic ethnicity, and were of middle to upper SES (Hollingshead Categories I–II).21 Maternal IQ was slightly lower in patients (mean 106.0, SD 13.6) than con-trols (mean 109.7, SD 12.7), but the difference was not sta-tistically significant (Table 1).
Thirty-one percent of patients and 29% of controls were lost to follow-up. Compared with children seen at school age, children who were lost to follow-up had lower Bayley PDI and maternal IQ scores at study baseline and were of lower SES (44% Hollingshead Categories III–V21 vs 24% in participating subjects).
case-control differencesLanguage, learning, and memory scores were consis-
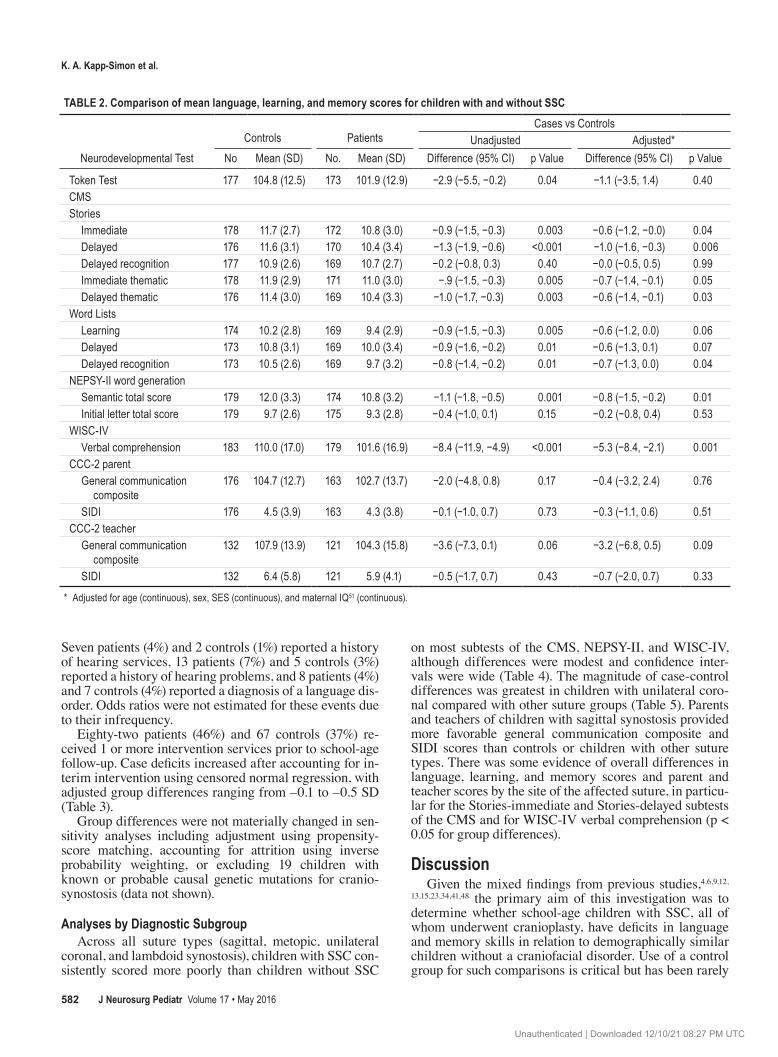
tently lower in patients than controls, although adjusted case-control differences were modest in magnitude and ranged from 0.0 to –0.4 SD (Table 2). The largest rela-tive case-control differences were for the WISC-IV Verbal Comprehension Index and the CMS, where scores in chil-dren with SSC were –0.2 to –0.3 SDs lower than in chil-dren without SSC in 8 of 9 subtests (p values range 0.001–0.07). Case-control differences were similar in magnitude (–0.2 to –0.3 SD) for NEPSY-II Word Generation–Initial Letter and the CCC-2-Teacher General Communication Composite, but were less than –0.1 SD for the Token Test-II, the NEPSY-II Initial Letter, and Parent CCC-2.
Forty-five patients (25%) and 36 controls (20%) re-ported prior or current speech or language therapy. After adjustment, patients were more likely than controls to un-dergo speech or language therapy, but these results may be due to chance (adjusted OR 1.42, 95% CI 0.85–2.38).
table 1. demographic characteristics of children with and without ssc evaluated at age 7 years*
Controls Patients
Characteristic (n = 183) (n = 179)Age in years <7.5 145 (79.2) 122 (68.2) ≥7.5 38 (20.8) 57 (31.8)Sex F 68 (37.2) 66 (36.9) M 115 (62.8) 113 (63.1)Grade† <1 3 (1.6) 3 (1.7) 1–2 171 (93.4) 164 (91.6) ≥3 9 (4.9) 9 (5.0)Race/ethnicity Nonwhite‡ 47 (25.7) 37 (20.7) White 136 (74.3) 142 (79.3)SES I (highest) 53 (29.0) 42 (23.5) II 103 (56.3) 82 (45.8) III 14 (7.7) 33 (18.4) IV 10 (5.5) 20 (11.2) V (lowest) 3 (1.6) 2 (1.1)Mean WPT (SD)§ 25.0 (6.5) 23.0 (6.9)Site Seattle 72 (39.3) 74 (41.3) Chicago¶ 76 (41.5) 63 (35.2) St. Louis 9 (4.9) 18 (10.1) Atlanta 26 (14.2) 24 (13.4)
* Values are number of children (%) unless otherwise indicated.† Grade level missing for 3 cases.‡ Includes Hispanic/Latino ethnicity, Asian/Pacific Islander, Black/African American, and mixed races or ethnicities.§ Timed score; mean scores converted to the Wechsler Adult Intelligence Scale42 were 109.7 in controls (SD 12.7) and 106.0 in patients (SD 13.6).¶ Includes children from Philadelphia, who were assessed by staff from the Chicago site.
Unauthenticated | Downloaded 12/10/21 08:27 PM UTC
K. a. Kapp-simon et al.
J neurosurg Pediatr Volume 17 • May 2016582
Seven patients (4%) and 2 controls (1%) reported a history of hearing services, 13 patients (7%) and 5 controls (3%) reported a history of hearing problems, and 8 patients (4%) and 7 controls (4%) reported a diagnosis of a language dis-order. Odds ratios were not estimated for these events due to their infrequency.
Eighty-two patients (46%) and 67 controls (37%) re-ceived 1 or more intervention services prior to school-age follow-up. Case deficits increased after accounting for in-terim intervention using censored normal regression, with adjusted group differences ranging from –0.1 to –0.5 SD (Table 3).
Group differences were not materially changed in sen-sitivity analyses including adjustment using propensity-score matching, accounting for attrition using inverse probability weighting, or excluding 19 children with known or probable causal genetic mutations for cranio-synostosis (data not shown).
analyses by diagnostic subgroupAcross all suture types (sagittal, metopic, unilateral
coronal, and lambdoid synostosis), children with SSC con-sistently scored more poorly than children without SSC
on most subtests of the CMS, NEPSY-II, and WISC-IV, although differences were modest and confidence inter-vals were wide (Table 4). The magnitude of case-control differences was greatest in children with unilateral coro-nal compared with other suture groups (Table 5). Parents and teachers of children with sagittal synostosis provided more favorable general communication composite and SIDI scores than controls or children with other suture types. There was some evidence of overall differences in language, learning, and memory scores and parent and teacher scores by the site of the affected suture, in particu-lar for the Stories-immediate and Stories-delayed subtests of the CMS and for WISC-IV verbal comprehension (p < 0.05 for group differences).
discussionGiven the mixed findings from previous studies,4,6,9,12,
13,15,23,34,41,48 the primary aim of this investigation was to determine whether school-age children with SSC, all of whom underwent cranioplasty, have deficits in language and memory skills in relation to demographically similar children without a craniofacial disorder. Use of a control group for such comparisons is critical but has been rarely
table 2. comparison of mean language, learning, and memory scores for children with and without ssc
Neurodevelopmental TestControls Patients
Cases vs ControlsUnadjusted Adjusted*
No Mean (SD) No. Mean (SD) Difference (95% CI) p Value Difference (95% CI) p Value
Token Test 177 104.8 (12.5) 173 101.9 (12.9) −2.9 (−5.5, −0.2) 0.04 −1.1 (−3.5, 1.4) 0.40CMSStories Immediate 178 11.7 (2.7) 172 10.8 (3.0) −0.9 (−1.5, −0.3) 0.003 −0.6 (−1.2, −0.0) 0.04 Delayed 176 11.6 (3.1) 170 10.4 (3.4) −1.3 (−1.9, −0.6) <0.001 −1.0 (−1.6, −0.3) 0.006 Delayed recognition 177 10.9 (2.6) 169 10.7 (2.7) −0.2 (−0.8, 0.3) 0.40 −0.0 (−0.5, 0.5) 0.99 Immediate thematic 178 11.9 (2.9) 171 11.0 (3.0) −.9 (−1.5, −0.3) 0.005 −0.7 (−1.4, −0.1) 0.05 Delayed thematic 176 11.4 (3.0) 169 10.4 (3.3) −1.0 (−1.7, −0.3) 0.003 −0.6 (−1.4, −0.1) 0.03Word Lists Learning 174 10.2 (2.8) 169 9.4 (2.9) −0.9 (−1.5, −0.3) 0.005 −0.6 (−1.2, 0.0) 0.06 Delayed 173 10.8 (3.1) 169 10.0 (3.4) −0.9 (−1.6, −0.2) 0.01 −0.6 (−1.3, 0.1) 0.07 Delayed recognition 173 10.5 (2.6) 169 9.7 (3.2) −0.8 (−1.4, −0.2) 0.01 −0.7 (−1.3, 0.0) 0.04NEPSY-II word generation Semantic total score 179 12.0 (3.3) 174 10.8 (3.2) −1.1 (−1.8, −0.5) 0.001 −0.8 (−1.5, −0.2) 0.01 Initial letter total score 179 9.7 (2.6) 175 9.3 (2.8) −0.4 (−1.0, 0.1) 0.15 −0.2 (−0.8, 0.4) 0.53WISC-IV Verbal comprehension 183 110.0 (17.0) 179 101.6 (16.9) −8.4 (−11.9, −4.9) <0.001 −5.3 (−8.4, −2.1) 0.001CCC-2 parent General communication
composite176 104.7 (12.7) 163 102.7 (13.7) −2.0 (−4.8, 0.8) 0.17 −0.4 (−3.2, 2.4) 0.76
SIDI 176 4.5 (3.9) 163 4.3 (3.8) −0.1 (−1.0, 0.7) 0.73 −0.3 (−1.1, 0.6) 0.51CCC-2 teacher General communication
composite132 107.9 (13.9) 121 104.3 (15.8) −3.6 (−7.3, 0.1) 0.06 −3.2 (−6.8, 0.5) 0.09
SIDI 132 6.4 (5.8) 121 5.9 (4.1) −0.5 (−1.7, 0.7) 0.43 −0.7 (−2.0, 0.7) 0.33
* Adjusted for age (continuous), sex, SES (continuous), and maternal IQ51 (continuous).
Unauthenticated | Downloaded 12/10/21 08:27 PM UTC

single-suture craniosynostosis, language, learning, and memory
J neurosurg Pediatr Volume 17 • May 2016 583
undertaken in previous research on this topic. The absence of a demographic control is substantially limiting, as SES is a strong predictor of language outcomes. For example, Fernald et al.16 found that by age 5 years the language skills of children from lower socioeconomic backgrounds were delayed by approximately 2 years in comparison with more socially advantaged peers. Similarly we have previously reported sex differences on the neurocognitive measures used in this test battery,13 with males in both the case and control groups scoring lower than females from both groups on most measures. Thus, failing to adjust for sex, SES, and other demographic confounding variables may yield misleading results and variation across studies, depending on the population sampled. A secondary aim was to investigate the possibility of differences in lan-guage and memory functions by suture location, an issue that has been infrequently addressed in previous studies.
On direct assessment using standardized tests, 77% of children with SSC and 89% of the controls in our sample obtained a Verbal Comprehension Index standard score of ≥ 90. In other words, the majority of children in both groups demonstrated verbal comprehension skills within the low average range or higher relative to test norms.
The average scores for children with SSC were lower than those of unaffected controls for every language and mem-ory test administered, though differences were sometimes quite small. These findings were robust when adjusting for potential demographic and other confounding variables (e.g., maternal IQ) and possible attrition bias, and were magnified when adjusting for the effects of developmental interventions received. These findings are similar to those from our previous study on global cognitive functioning and academic skills reported by Speltz et al.43 and mea-sures of executive functioning and attention as reported by Collett et al.12 As in the current study, group differences on measures of IQ and academic achievement were modest, though children with SSC scored lower than unaffected controls on every measure given. Tests of spelling and reading achievement yielded the smallest differences, with tests of Full-Scale IQ and math achievement indicating larger differences that were educationally important (e.g., patients underperformed in comparison with controls by about one-third of a standard deviation; differences on all measures increased after controlling for early intervention services received).43 Collett et al.12 also found that children with SSC scored lower than controls on most measures, though again the magnitude of these differences was small and, with the exception of inhibitory control, most differ-ences were statistically insignificant.
In the present study, parent reports revealed the smallest differences in performance between the case and control participants. Parents of both groups reported very similar language skills as indicated by the general language com-posite score of the CCC-2, which was less than a half point lower for case than for control participants after adjusting for sociodemographic differences. Teacher-reported dif-ferences in performance were larger than parent-reported differences, but were still relatively small (SD 0.2). Teach-er-reported differences were primarily related to slightly lower scores on the social relations, scripted language, nonverbal communication, and initiation subtests. It is unclear if these very subtle differences between case and control participants have any meaningful impact on the day-to-day functioning of the children, as the average SIDI is well within the expected range for both groups.
The differences in expressive and receptive language that we observed at age 3 years45 persisted at age 7 years when direct assessment of child functioning rather than parent or teacher report was used as the measuring stick. Although mean scores were within the average range, chil-dren with SSC performed worse on both subtests of the WISC-IV measuring verbal comprehension (i.e., the abil-ity to define words and the ability to identify similarities between words). Poorer performance among children with SSC was also seen on a task of semantic verbal fluency, a measure of language planning and processing.
We assessed verbal memory skills in several different ways. The 2 groups demonstrated equivalent performanc-es on the Token Test-II, which measured the children’s ability to follow commands of increasing difficulty imme-diately after hearing them. In contrast, children with SSC performed less well on verbal learning tasks and when asked to repeat a short story. Children with SSC were less efficient with new learning, remembered fewer facts from
table 3. differences between children with and without ssc adjusted for intervention participation
Neurodevelopmental Test
Adjusted, w/ Censored Normal Regression*
Difference (95% CI) p Value
Token Test −2.5 (−5.8, 0.7) 0.12CMS Stories Immediate −1.1 (−1.9, −0.3) 0.008 Delayed −1.5 (−2.4, −0.6) 0.001 Delayed recognition −0.4 (−1.1, 0.4) 0.30 Immediate thematic −1.1 (−1.9, −0.3) 0.01 Delayed thematic −1.3 (−2.2, −0.4) 0.004Word Lists Learning −1.1 (−1.9, −0.2) 0.01 Delayed −1.2 (−2.1, −0.3) 0.01 Delayed recognition −1.2 (−2.0, −0.4) 0.005NEPSY-II word generation Semantic total score −1.5 (−2.3, −0.6) 0.001 Initial letter total score −0.8 (−1.5, −0.1) 0.03WISC-IV Verbal comprehension −7.2 (−11.2, −3.2) 0.001CCC-2 parent General communication composite −2.2 (−6.1, 1.6) 0.25 SIDI −0.8 (−1.7, 0.0) 0.05CCC-2 teacher General communication composite −4.2 (−9.4, 1.1) 0.12 SIDI −0.5 (−2.0, 1.0) 0.50
* Adjusted for age (continuous), sex, SES (continuous), and maternal IQ51 (continuous); 82 (46%) of 177 patients and 67 (37%) of 183 controls received 1 or more interventions; information on interventions missing in 2 cases.
Unauthenticated | Downloaded 12/10/21 08:27 PM UTC

K. a. Kapp-simon et al.
J neurosurg Pediatr Volume 17 • May 2016584
the stories, and were less skilled at identifying themes within the stories, suggesting that they were less able to integrate the information they heard. Verbal learning and story memory were poorer both immediately after presen-tation and after a short delay. Verbal memory did not dif-fer between cases and controls when children were given choices about story facts.
When examining differences in performance among children with different suture fusions, we found that chil-dren from each suture group obtained lower scores than control participants on each of the tests assessing language and memory for which significant case-control differences were present. The differences in performance were quite small when comparing children with sagittal, metopic, and unilateral lambdoid synostosis to control participants but meaningful for a number of measures comparing children with unilateral coronal synostosis to control participants. For example, compared with control participants, children with unilateral coronal synostosis had poorer verbal com-prehension skills, lower scores on story memory and iden-tification of story themes, and lower language scores based on their parents’ and teachers’ reports compared with con-trol children. We have previously reported on differences in performance by suture group, identifying children with
unilateral coronal and unilateral lambdoid synostosis as at greatest risk.13,43 A report by Chieffo et al.9 is the only other study to date that has directly assessed and compared the performance of school-aged children with different suture involvement in the same study, although these authors only included children with sagittal and unilateral coronal syn-ostosis.9 Similar to our findings, Chieffo et al.9 reported poorer verbal fluency and working memory for children with unilateral coronal synostosis compared with children with sagittal SSC and the control participants.
As this was an observational study, primarily designed to determine the relative outcomes of children with and without SSC, we did not make any attempt to influence treatment decisions or randomize subjects by age or type of surgery. Rather, we tracked children as they received care typical of the setting in which they were seen. As such, the study’s design is limited in its ability to eluci-date the mechanisms by which SSC or factors associ-ated with SSC (e.g., surgery and anesthesia exposure35) have led to the group differences observed here and elsewhere.4,6,9,13,15,23,34,41,48 The etiology of the neurodevel-opmental consequences and correlates of SSC remains unclear, with some hypotheses focusing on the effects of the fused suture on brain development1–3,47,49 and others
table 4. distribution of mean language, learning, and memory scores for children with ssc by suture
Neurodevelopmental Test
ControlsType of SSC
Sagittal Metopic Unicoronal LambdoidNo. Mean (SD) No. Mean (SD) No. Mean (SD) No. Mean (SD) No. Mean (SD)
Token Test 177 104.8 (12.5) 74 102.8 (11.1) 44 101.8 (15.9) 43 100.8 (12.7) 12 101.5 (13.4)CMSStories Immediate 178 11.7 (2.7) 74 11.1 (2.8) 43 11.4 (2.7) 45 9.9 (3.0) 10 9.8 (3.9) Delayed 176 11.6 (3.1) 74 10.8 (3.1) 42 10.8 (3.3) 44 9.4 (3.5) 10 10.0 (4.2) Delayed recognition 177 10.9 (2.6) 74 10.9 (2.7) 42 11.0 (2.8) 43 10.2 (2.7) 10 9.6 (2.1) Immediate thematic 178 11.9 (2.9) 74 11.1 (3.0) 43 11.4 (2.7) 44 10.3 (3.0) 10 10.9 (4.6) Delayed thematic 176 11.4 (3.0) 74 10.6 (3.1) 42 10.5 (3.1) 43 9.7 (3.5) 10 10.3 (4.1)Word Lists Learning 174 10.2 (2.8) 74 9.6 (2.8) 43 9.3 (3.2) 43 9.3 (3.2) 9 8.4 (2.1) Delayed 173 10.8 (3.1) 74 10.4 (3.2) 43 9.7 (3.7) 42 9.4 (3.5) 10 10.5 (2.7) Delayed recognition 173 10.5 (2.6) 74 9.5 (3.2) 43 9.7 (3.4) 42 10.0 (3.2) 10 9.3 (2.8)NEPSY-II word generation Semantic total score 179 12.0 (3.3) 72 11.1 (3.0) 45 10.7 (2.9) 45 10.6 (3.6) 12 10.8 (4.5) Initial letter total score 179 9.7 (2.6) 73 9.5 (2.7) 45 9.3 (2.9) 45 9.4 (2.8) 12 8.3 (3.5)WISC-IV Verbal comprehension 183 110.0 (17.0) 76 104.7 (13.5) 45 102.2 (19.4) 46 96.0 (17.1) 12 102.0 (21.8)CCC-2 parent General communication composite 176 104.7 (12.7) 70 104.9 (13.4) 41 100.5 (13.3) 40 100.8 (14.5) 10 103.2 (13.2) SIDI 176 4.5 (3.9) 70 3.8 (3.1) 41 4.1 (3.6) 40 5.1 (4.7) 10 5.4 (5.3)CCC-2 teacher General communication composite 132 107.9 (13.9) 55 107.3 (14.0) 29 100.7 (14.9) 27 102.6 (20.3) 10 103.1 (12.3) SIDI 132 6.4 (5.8) 55 4.6 (3.3) 29 6.6 (3.8) 27 6.8 (4.6) 10 8.7 (5.5)
Unauthenticated | Downloaded 12/10/21 08:27 PM UTC

single-suture craniosynostosis, language, learning, and memory
J neurosurg Pediatr Volume 17 • May 2016 585
tabl
e 5.
com
paris
on o
f mea
n la
ngua
ge, le
arni
ng, a
nd m
emor
y sco
res f
or ch
ildre
n wi
th an
d wi
thou
t ssc
, by s
utur
e
Neur
odev
elopm
enta
l Tes
t
Comp
ariso
n & M
ean D
iffere
nce*
p Va
lue†
Sagit
tal S
SC vs
Con
trol
Meto
pic S
SC vs
Con
trol
Unila
t Cor
onal
SSC
vs C
ontro
lLa
mboid
vs C
ontro
lDi
ffere
nce (
95%
CI)
p Valu
eDi
ffere
nce (
95%
CI)
p Valu
eDi
ffere
nce (
95%
CI)
p Valu
eDi
ffere
nce (
95%
CI)
p Valu
e
Toke
n Tes
t0.0
9 (−2
.8, 3
.0)0.9
8−0
.3 (−
4.9, 4
.2)0.
88−3
.7 (−7
.4, 0.
1)0.0
5−1
.6 (−1
0.1, 7
.0)0.7
20.
39CM
S St
ories
Im
media
te−0
.2 (−
0.9, 0
.5)
0.52
−0.0
(0.9,
0.9)
0.98
−1.7
(−2.6
, −0.7
)<0
.001
−1.6
(−4.1
, 1.0)
0.22
0.01
De
layed
−0.5
(−1.3
, 0.4)
0.26
−0.5
(−1.6
, 0.6)
0.34
−2.1
(−3.2
, −1.0
)<0
.001
−1.5
(−4.3
, 1.4)
0.31
0.01
De
layed
reco
gnitio
n0.
3 (−0
.4, 1.
0)0.4
80.
3 (−0
.6, 1
.1)0.
57−0
.5 (−
1.3, 0
.4)0.
30−1
.1 (−2
.6, 0
.4)0.1
50.
34
Imme
diate
them
atic
−0.4
(−1.2
, 0.4)
0.27
−0.2
(−1.1
, 0.8)
0.74
−1.4
(−2.4,
−0.4
)0.0
1−0
.7 (−3
.7, 2.
2)0.6
40.0
9
Delay
ed th
emati
c−0
.4 (−1
.3, 0
.4)0.
27−0
.6 (−1
.6, 0
.5)
0.28
−1.3
(−2.
5, −0
.1)0.0
3−1
.0 (−3
.6, 1
.7)0.4
80.
21W
ord L
ists
Le
arnin
g−0
.4 (−1
.2, 0
.3)0.
26−0
.6 (−1
.6, 0
.3)0.1
8−0
.7 (−1
.8, 0
.5)
0.25
−1.3
(−2.
9, 0.
3)0.1
10.
32
Delay
ed−0
.3 (−
1.1, 0
.6)0.
50−0
.8 (−
2.0, 0
.3)0.1
5−1
.2 (−
2.3,
−0.0
3)0.0
40.0
4 (−1
.8, 1
.9)0.9
60.
25
Delay
ed re
cogn
ition
−0.6
(−1.5
, 0.3)
0.10
−0.6
(−1.6
, 0.4)
0.26
−0.6
(−1.7,
0.4)
0.24
−0.9
(−2.8
, 1.0)
0.36
0.35
NEPS
Y-II w
ord g
ener
ation
Se
manti
c tot
al sc
ore
−0.6
(−1.5
, 0.3)
0.17
−0.8
(−1.7
, −0.0
5)0.0
6−1
.2 (−
2.3,
−0.1)
0.03
−0.9
(−3.5
, 1.7)
0.48
0.13
In
itial le
tter t
otal
scor
e−0
.1 (−
0.8,
0.7)
0.89
−0.1
(−1.0,
0.8)
0.77
−0.2
(−1.0
, 0.7)
0.67
−1.2
(−3.1
, 0.7)
0.21
0.79
WIS
C-IV
Ve
rbal
comp
rehe
nsion
−2.3
(−5.7
, 1.1)
0.18
−3.6
(−8.
6, 1.4
)0.1
6−1
1.5 (−
16.9,
−6.
2)<0
.001
−4.5
(−18
.1, 9.
0)0.
510.0
01CC
C-2 p
aren
t
Gene
ral c
ommu
nicati
on co
mpos
ite1.8
(−1.8
, 5.3)
0.33
−2.3
(−6.
6, 2.0
)0.
30−2
.5 (−
7.2, 2
.2)0.
29−0
.2 (−
7.9, 7
.6)0.9
70.4
0
SIDI
−0.7
(−1.7,
0.2)
0.13
−0.5
(−1.7
, 0.8)
0.46
0.3 (
−1.3
, 1.9)
0.68
1.1 (−
1.9, 4
.1)0.4
80.4
2CC
C-2 t
each
er
Gene
ral c
ommu
nicati
on co
mpos
ite0.
2 (−4
.1, 4.
3)0.9
6−5
.4 (−1
1.1, 0
.4)0.0
7−6
.1 (−1
4.0, 1
.9)0.1
4−6
.5 (−
14.4,
1.4)
0.11
0.13
SI
DI−2
.0 (−3
.4, −
0.6)
0.01
0.1 (−
1.7, 1
.8)0.9
50.4
(−1.9
, 2.7)
0.73
2.5 (
−1.0,
6.0)
0.16
0.003
* Ad
juste
d for
age (
cont
inuou
s), se
x, SE
S (co
ntinu
ous),
and m
atern
al IQ
(con
tinuo
us).
† Th
e p va
lue fo
r diff
eren
ces a
cros
s gro
ups.
Unauthenticated | Downloaded 12/10/21 08:27 PM UTC

K. a. Kapp-simon et al.
J neurosurg Pediatr Volume 17 • May 2016586
emphasizing preexisting neuropathology that may affect both brain and cranium.5,19 These studies provide some ev-idence that changes in brain morphology present prior to surgery persist after surgery.2 There is also evidence that changes in auditory functioning, potentially related to later language and literacy development,29,37 are present prior to surgical intervention for infants with SSC.19 Functional changes in brain circuitry known to be associated with language and number processing, memory retrieval, and reading have been identified in older children with sagittal SSC who underwent surgery as infants.5 Further research examining brain morphology and function prior to and af-ter cranioplasty is needed to clarify these issues.
Previous studies have proposed that variables related to surgery, including age at surgery,24,36,39,45 duration of anes-thesia exposure,35 and surgical approach used,20 may affect outcomes. However, these results are mixed and warrant further investigation in prospective studies that account for the effects of multiple variables in combination. For example, if suture fusion leads to neurodevelopmental def-icits via constriction on brain growth or increased intra-cranial pressure, earlier surgery should be advantageous. However, age at surgery is potentially confounded with numerous other variables that might be associated with development, such as family SES, initial severity, surgi-cal approach used, and duration. For example, surgeries at younger ages may well provide optimal benefits in terms of earlier suture release,20,39 but less mature brains may be more susceptible to the neurotoxicity associated with an-esthesia exposure.38 In our own work, we have found little association between surgery age and neurodevelopmental outcomes measured both in infancy45 and at school age12 when controlling for potential confounding variables such as maternal IQ, SES, and involved suture. Work is cur-rently under way in our lab to further disentangle these multiple and complex associations with neurodevelopmen-tal outcomes.
The current research has at least 2 limitations that are important to note. First, in keeping with good ethical prac-tice, we provided parents of both patients and controls with feedback about their children’s performance at each visit, which may have influenced the number of children from each group receiving special education services prior to the early elementary school evaluation. This may be espe-cially true for control children, who would not otherwise have been screened for developmental delays. However, we used the same protocol for providing feedback to chil-dren in both groups, and our censored normal regression analyses suggest that, if anything, the differences between case and control performance would have increased with-out intervention. A second limitation is the relatively high sociodemographic profile of the participants, both those originally enrolled and more markedly for those who par-ticipated in the school-age assessment. Inverse probability weighting analysis, which used baseline data for available case and control participants to evaluate attrition bias, did not result in significantly different regression outcomes. However, while inverse probability weighting attempts to match for characteristics that influence outcomes such as maternal IQ, family SES, and ethnicity, it cannot control for the less tangible factors that influence a family’s will-
ingness to participate in up to 4 extensive evaluations. It is very possible that children from lower SES groups would demonstrate increased risk over those included in the cur-rent study.
This study also has several important strengths includ-ing the examination of learning, language, and memory skills through multiple, direct assessments as well as par-ent and teacher reports, and the comparison of children with SSC to unaffected control children with adjustment for potential confounders (e.g., maternal IQ, demograph-ic characteristics). Although this is a “clinic-based” rather than a “population-based” study, we reassessed children who were identified in infancy regardless of whether they continued to be followed up by the craniofacial team or not; this increases the generalizability of our findings to a broader range of children with SSC. In addition, recruit-ment in early infancy minimizes enrollment bias associ-ated with infants’ developmental status (i.e., compared with older children with SSC who might be more likely to participate in research when there are developmental concerns). Finally, we employed sensitivity analyses to ac-count for the possible effects of attrition bias and devel-opmental interventions that participants received in their communities.
conclusionsOur data provide evidence of modest differences be-
tween cases and controls in language and memory consis-tent with those that have been reported in the literature for children with SSC. These small differences do not appear to be particularly apparent in the day-to-day functioning of children with SSC as reported by parents or teachers, with the possible exception of children with unilateral coronal synostosis. However, among a sizable subgroup of children with SSC, there is evidence of poorer func-tioning on direct assessment, particularly on tasks that require consolidation of learning and memory. These find-ings may have implications for increasing problems with school performance as these children mature. The chil-dren in this study are still young, age 7 years on average, and therefore continued maturation of the neural pathways that support language, learning, and memory development are expected.10,28 If there is a primary disruption in brain networks, as suggested by the preliminary work of Al-dridge et al.,1–3 Beckett et al.,5 and Hashim et al.,19 or if an-esthesia exposure affects brain development,35,38 problems with language and memory may become more apparent and have a greater effect on learning as children approach middle- and high-school age due to possible ongoing dis-ruption of neural networks as they age.
Our findings have implications for the clinical manage-ment of children with SSC. Multidisciplinary care, includ-ing direct psychological/neuropsychological assessment, is indicated for children with SSC of elementary-school age, as problems with language and conceptual learning may not be evident until children face greater academic challenges. This recommendation is in keeping with that put forth in the recently developed craniosynostosis care guidelines.32 The current study identifies children with unilateral coronal synostosis as having the greatest vul-
Unauthenticated | Downloaded 12/10/21 08:27 PM UTC

single-suture craniosynostosis, language, learning, and memory
J neurosurg Pediatr Volume 17 • May 2016 587
nerability in the areas of language, memory, and learning; however, selective screening of children with all SSC di-agnosis is indicated, as some children in each diagnostic group were at risk. Neurodevelopmental assessment at 18 months of age may help identify those children requir-ing closer follow-up through school age.18 Finally, future research is needed to investigate language, memory, and learning for this population during the middle to high school years.
acknowledgmentsWe thank Sharman Conner, Claudia Crilly Bellucci, and Dr.
Lauren Buono for their assistance in data collection. We thank the parent and child participants who gave so willingly of their time and energy to this research. This research was supported by the National Institute of Dental and Craniofacial Research under Grant 5R01DE013813-10 (Dr. Speltz served as the head principal investigator).
references 1. Aldridge K, Kane AA, Marsh JL, Panchal J, Boyadjiev SA,
Yan P, et al: Brain morphology in nonsyndromic unicoronal craniosynostosis. Anat Rec A Discov Mol Cell Evol Biol 285:690–698, 2005
2. Aldridge K, Kane AA, Marsh JL, Yan P, Govier D, Richts-meier JT: Relationship of brain and skull in pre- and postop-erative sagittal synostosis. J Anat 206:373–385, 2005
3. Aldridge K, Marsh JL, Govier D, Richtsmeier JT: Central nervous system phenotypes in craniosynostosis. J Anat 201:31–39, 2002
4. Becker DB, Petersen JD, Kane AA, Cradock MM, Pilgram TK, Marsh JL: Speech, cognitive, and behavioral outcomes in nonsyndromic craniosynostosis. Plast Reconstr Surg 116:400–407, 2005
5. Beckett JS, Brooks ED, Lacadie C, Vander Wyk B, Jou RJ, Steinbacher DM, et al: Altered brain connectivity in sagittal craniosynostosis. J Neurosurg Pediatr 13:690–698, 2014
6. Bellew M, Liddington M, Chumas P, Russell J: Preoperative and postoperative developmental attainment in patients with sagittal synostosis: 5-year follow-up. J Neurosurg Pediatr 7:121–126, 2011
7. Bishop DVM: Children’s Communication Checklist-2 (CCC-2). San Antonio, TX: Pearson, 2006
8. Boltshauser E, Ludwig S, Dietrich F, Landolt MA: Sagit-tal craniosynostosis: cognitive development, behaviour, and quality of life in unoperated children. Neuropediatrics 34:293–300, 2003
9. Chieffo D, Tamburrini G, Massimi L, Di Giovanni S, Giansanti C, Caldarelli M, et al: Long-term neuropsychologi-cal development in single-suture craniosynostosis treated early. J Neurosurg Pediatr 5:232–237, 2010
10. Clayden JD, Jentschke S, Muñoz M, Cooper JM, Chadwick MJ, Banks T, et al: Normative development of white matter tracts: similarities and differences in relation to age, gender, and intelligence. Cereb Cortex 22:1738–1747, 2012
11. Cohen M: Children’s Memory Scale (CMS). San Antonio, TX: The Psychological Corporation, 1997
12. Collett BR, Kapp-Simon KA, Wallace E, Cradock MM, Buono L, Speltz ML: Attention and executive function in children with and without single-suture craniosynostosis. Child Neuropsychol [epub ahead of print], 2015
13. Cradock MM, Gray KE, Kapp-Simon KA, Collett BR, Buono LA, Speltz ML: Sex differences in the neurodevelopment of school-age children with and without single-suture cranio-synostosis. Childs Nerv Syst 31:1103–1111, 2015
14. Cunningham ML, Horst JA, Rieder MJ, Hing AV, Stan-
away IB, Park SS, et al: IGF1R variants associated with isolated single suture craniosynostosis. Am J Med Genet A 155A:91–97, 2011
15. Da Costa AC, Walters I, Savarirayan R, Anderson VA, Wren-nall JA, Meara JG: Intellectual outcomes in children and ado-lescents with syndromic and nonsyndromic craniosynostosis. Plast Reconstr Surg 118:175–183, 2006
16. Fernald A, Marchman VA, Weisleder A: SES differences in language processing skill and vocabulary are evident at 18 months. Dev Sci 16:234–248, 2013
17. French LR, Jackson IT, Melton LJ III: A population-based study of craniosynostosis. J Clin Epidemiol 43:69–73, 1990
18. Gray KE, Kapp-Simon KA, Starr JR, Collett BR, Wallace ER, Speltz ML: Predicting developmental delay in a longi-tudinal cohort of preschool children with single-suture cra-niosynostosis: is neurobehavioral assessment important? Dev Med Child Neurol 57:456–462, 2015
19. Hashim PW, Brooks ED, Persing JA, Reuman H, Naples A, Travieso R, et al: Direct brain recordings reveal impaired neural function in infants with single-suture craniosynosto-sis: a future modality for guiding management? J Craniofac Surg 26:60–63, 2015
20. Hashim PW, Patel A, Yang JF, Travieso R, Terner J, Losee JE, et al: The effects of whole-vault cranioplasty versus strip craniectomy on long-term neuropsychological outcomes in sagittal craniosynostosis. Plast Reconstr Surg 134:491–501, 2014
21. Hollingshead HB: Four factor index of social status. Yale J Sociology 8:21–51, 2011
22. Kapp-Simon KA, Speltz ML, Cunningham ML, Patel PK, Tomita T: Neurodevelopment of children with single suture craniosynostosis: a review. Childs Nerv Syst 23:269–281, 2007
23. Kelleher MO, Murray DJ, McGillivary A, Kamel MH, All-cutt D, Earley MJ: Behavioral, developmental, and education-al problems in children with nonsyndromic trigonocephaly. J Neurosurg 105 (5 Suppl):382–384, 2006
24. Knight SJ, Anderson VA, Spencer-Smith MM, Da Costa AC: Neurodevelopmental outcomes in infants and children with single-suture craniosynostosis: a systematic review. Dev Neuropsychol 39:159–186, 2014
25. Korkman M, Kirk U, Kemp S: NEPSY-II: A Developmental Neuropsychological Assessment, ed 2. San Antonio, TX: The Psychological Corporation, 2007
26. Korpilahti P, Saarinen P, Hukki J: Deficient language acqui-sition in children with single suture craniosynostosis and deformational posterior plagiocephaly. Childs Nerv Syst 28:419–425, 2012
27. Lefaivre MJ, Chambers CT, Fernandez CV: Offering parents individualized feedback on the results of psychological test-ing conducted for research purposes with children: ethical issues and recommendations. J Clin Child Adolesc Psychol 36:242–252, 2007
28. Lenroot RK, Giedd JN: The structural development of the human brain as measured longitudinally with magnetic reso-nance imaging, in Coch D, Fischer KW, Dawson G (eds): Hu-man Behavior, Learning, and the Developing Brain: Typi-cal Development. New York: Guilford Press, 2007, pp 50-73
29. Leppänen PH, Hämäläinen JA, Salminen HK, Eklund KM, Guttorm TK, Lohvansuu K, et al: Newborn brain event-relat-ed potentials revealing atypical processing of sound frequen-cy and the subsequent association with later literacy skills in children with familial dyslexia. Cortex 46:1362–1376, 2010
30. Leppig KA, Werler MM, Cann CI, Cook CA, Holmes LB: Predictive value of minor anomalies. I. Association with ma-jor malformations. J Pediatr 110:531–537, 1987
31. Magge SN, Westerveld M, Pruzinsky T, Persing JA: Long-term neuropsychological effects of sagittal craniosynostosis on child development. J Craniofac Surg 13:99–104, 2002
Unauthenticated | Downloaded 12/10/21 08:27 PM UTC

K. a. Kapp-simon et al.
J neurosurg Pediatr Volume 17 • May 2016588
32. McCarthy JG, Warren SM, Bernstein J, Burnett W, Cunning-ham ML, Edmond JC, et al: Parameters of care for cranio-synostosis. Cleft Palate Craniofac J 49 Suppl:1S–24S, 2012
33. McGhee RL, Ehrler DJ, Disimoni F: Token Test for Chil-dren-Second Edition Austin, TX: Pro-Ed, 2007
34. Mendonca DA, White N, West E, Dover S, Solanki G, Ni-shikawa H: Is there a relationship between the severity of metopic synostosis and speech and language impairments? J Craniofac Surg 20:85–89, 2009
35. Naumann HL, Haberkern CM, Pietila KE, Birgfeld CB, Starr JR, Kapp-Simon KA, et al: Duration of exposure to cranial vault surgery: associations with neurodevelopment among children with single-suture craniosynostosis. Paediatr An-aesth 22:1053–1061, 2012
36. Patel A, Yang JF, Hashim PW, Travieso R, Terner J, Mayes LC, et al: The impact of age at surgery on long-term neuro-psychological outcomes in sagittal craniosynostosis. Plast Reconstr Surg 134:608e–617e, 2014
37. Plakas A, van Zuijen T, van Leeuwen T, Thomson JM, van der Leij A: Impaired non-speech auditory processing at a pre-reading age is a risk-factor for dyslexia but not a predic-tor: an ERP study. Cortex 49:1034–1045, 2013
38. Rappaport BA, Suresh S, Hertz S, Evers AS, Orser BA: An-esthetic neurotoxicity—clinical implications of animal mod-els. N Engl J Med 372:796–797, 2015
39. Renier D, Lajeunie E, Arnaud E, Marchac D: Management of craniosynostoses. Childs Nerv Syst 16:645–658, 2000
40. Robins JM, Rotnitzky A, Zhao LP: Estimation of regression coefficients when some regressors are not always observed. J Am Stat Assoc 89:846–866, 1994
41. Shipster C, Hearst D, Somerville A, Stackhouse J, Hayward R, Wade A: Speech, language, and cognitive development in children with isolated sagittal synostosis. Dev Med Child Neurol 45:34–43, 2003
42. Shuper A, Merlob P, Grunebaum M, Reisner SH: The inci-dence of isolated craniosynostosis in the newborn infant. Am J Dis Child 139:85–86, 1985
43. Speltz ML, Collett BR, Wallace ER, Starr JR, Cradock MM, Buono L, et al: Intellectual and academic functioning of school-age children with single-suture craniosynostosis. Pe-diatrics 135:e615–e623, 2015
44. Speltz ML, Kapp-Simon K, Collett B, Keich Y, Gaither R, Cradock MM, et al: Neurodevelopment of infants with single-suture craniosynostosis: presurgery comparisons with case-matched controls. Plast Reconstr Surg 119:1874–1881, 2007
45. Starr JR, Collett BR, Gaither R, Kapp-Simon KA, Cra-dock MM, Cunningham ML, et al: Multicenter study of
neurodevelopment in 3-year-old children with and without single-suture craniosynostosis. Arch Pediatr Adolesc Med 166:536–542, 2012
46. Starr JR, Kapp-Simon KA, Cloonan YK, Collett BR, Cra-dock MM, Buono L, et al: Presurgical and postsurgical assessment of the neurodevelopment of infants with single-suture craniosynostosis: comparison with controls. J Neuro-surg 107 (2 Suppl):103–110, 2007
47. Thompson DN, Malcolm GP, Jones BM, Harkness WJ, Hay-ward RD: Intracranial pressure in single-suture craniosynos-tosis. Pediatr Neurosurg 22:235–240, 1995
48. Virtanen R, Korhonen T, Fagerholm J, Viljanto J: Neurocog-nitive sequelae of scaphocephaly. Pediatrics 103:791–795, 1999
49. Wall SA, Thomas GP, Johnson D, Byren JC, Jayamohan J, Magdum SA, et al: The preoperative incidence of raised in-tracranial pressure in nonsyndromic sagittal craniosynostosis is underestimated in the literature. J Neurosurg Pediatr 14:674–681, 2014
50. Wechsler D: Wechsler Intelligence Scale for Children (WISC-IV). San Antonio, TX: Harcourt Assessment, 2003
51. Wonderlic E: Wonderlic Personnel Test and Scholastic Level Exam User’s Manual. Libertyville, IL: Wonderlic, Inc., 1999
disclosuresThe authors report no conflict of interest concerning the materi-als or methods used in this study or the findings specified in this paper.
author contributionsConception and design: Kapp-Simon, Speltz. Acquisition of data: Kapp-Simon, Cradock, Crerand, Speltz. Analysis and interpreta-tion of data: Kapp-Simon, Wallace, Speltz. Drafting the article: Kapp-Simon. Critically revising the article: all authors. Reviewed submitted version of manuscript: all authors. Approved the final version of the manuscript on behalf of all authors: Kapp-Simon. Statistical analysis: Wallace. Study supervision: Kapp-Simon, Speltz.
correspondenceKathleen A. Kapp-Simon, Cleft-Craniofacial Clinic, Shriners Hospital for Children, 2211 N. Oak Park Ave., Chicago, IL 60707. email: [email protected].
Unauthenticated | Downloaded 12/10/21 08:27 PM UTC