landscape visualisation and climate change: the · pdf filelandscape visualisation and climate...
TRANSCRIPT
Landscape visualisation and climate change: the potential
for influencing perceptions and behaviour
Stephen R.J. Sheppard
Collaborative for Advanced Landscape Planning (CALP), Department of Forest Resources and Landscape Architecture,
University of British Columbia, 2045-2424 Main Mall, Vancouver, BC, Canada V6T 1Z4
Abstract
The urgent need to mitigate and adapt to climate change is becoming more widely understood in scientific and policy circles, but public
awareness lags behind. The potential of visual communication to accelerate social learning and motivate implementation of the substantial
policy, technological, and life-style changes needed, has begun to be recognised. In particular, realistic landscape visualisations may offer
special advantages in rapidly advancing peoples’ awareness of climate change and possibly affecting behaviour and policy, by bringing certain
possible consequences of climate change home to people in a compelling manner. However, few such applications are yet in use, the
theoretical basis for the effectiveness of visualisations in this role has not been clearly established, and there are ethical concerns elicited by
adopting a persuasive approach which deliberately engages the emotions with visual imagery. These questions and policy implications are
discussed in the context of a theoretical framework on the effects of landscape visualisation on a spectrum of responses to climate change
information, drawing in part on evidence from other applications of landscape visualisation. The author concludes that the persuasive use of
visualisations, together with other approaches, may be effective, is justified, and could be vital in helping communicate climate change
effectively, given ethical standards based on disclosure, drama, and defensibility.
# 2005 Elsevier Ltd. All rights reserved.
Keywords: Visualisation; Climate change; Visual communications; Carbon consciousness; Behavioural response
www.elsevier.com/locate/envsci
Environmental Science & Policy 8 (2005) 637–654
1. Introduction
This paper addresses the potential role of realistic
visualisation tools in rapidly increasing peoples’ awareness
of climate change and possibly affecting behaviour and
policy, together with associated ethical dilemmas.
1.1. The need for increased public awareness and policy
response on climate change
Evidence of climate change and its impacts on society and
the environment have becomegenerally accepted by scientists
(Pearce et al., 1996; IPCC, 2001), along with the importance
of mitigating and adapting to climate change (Fawcett et al.,
2002; Adger, 2003). However, public awareness and policy
changes are lagging behind. Boardman and Palmer (2003)
found low levels of ‘carbon consciousness’ among European
consumers and businesses, and Lorenzoni and Langford
E-mail address: [email protected].
1462-9011/$ – see front matter # 2005 Elsevier Ltd. All rights reserved.
doi:10.1016/j.envsci.2005.08.002
(2001) reported that the majority of their study participants
were not concerned about climate change.Many authors have
addressed the substantial gap between the possession of
environmental knowledge or behavioural intent and actual
pro-environmental behaviour (e.g. Kollmuss and Agyeman,
2002). In some countries, organisations such as the UK
Climate Impacts Programme (UKCIP, 2000a) have been set
up to address this gap through education and communication.
Tickell (2002) has summarised the difficulties in com-
municating climate change (discussed further below), and
warned that it may require a calamity to induce people and
governments to take the necessary radical actions. The
principal question therefore becomes: what are the most
effective ways to stimulate climate change mitigation and
adaptation behaviours in society before crises occur, and
reduce harm to the environment and society? The main
hypothesis examined in this paper is that certain kinds of
visual communication (i.e. realistic landscape visualisations)
which attempt to look into the future and which engage the
emotions, may substantially enhance awareness-building on
S.R.J. Sheppard / Environmental Science & Policy 8 (2005) 637–654638
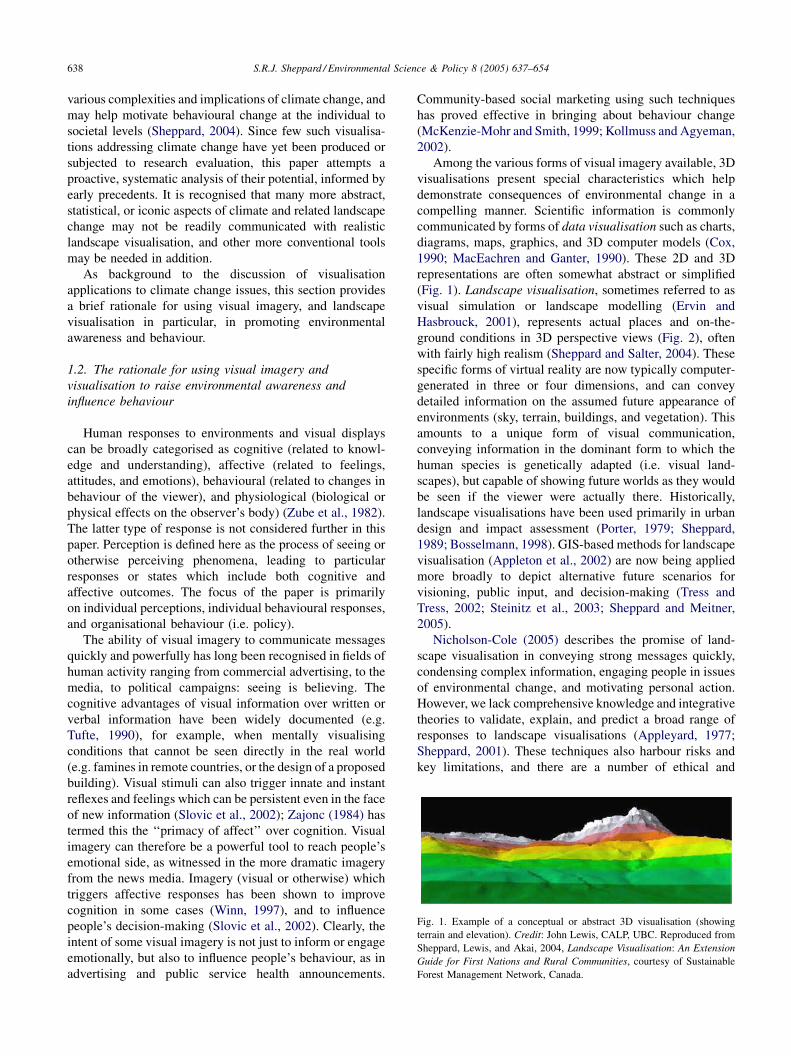
Fig. 1. Example of a conceptual or abstract 3D visualisation (showing
terrain and elevation). Credit: John Lewis, CALP, UBC. Reproduced from
Sheppard, Lewis, and Akai, 2004, Landscape Visualisation: An Extension
Guide for First Nations and Rural Communities, courtesy of Sustainable
Forest Management Network, Canada.
various complexities and implications of climate change, and
may help motivate behavioural change at the individual to
societal levels (Sheppard, 2004). Since few such visualisa-
tions addressing climate change have yet been produced or
subjected to research evaluation, this paper attempts a
proactive, systematic analysis of their potential, informed by
early precedents. It is recognised that many more abstract,
statistical, or iconic aspects of climate and related landscape
change may not be readily communicated with realistic
landscape visualisation, and other more conventional tools
may be needed in addition.
As background to the discussion of visualisation
applications to climate change issues, this section provides
a brief rationale for using visual imagery, and landscape
visualisation in particular, in promoting environmental
awareness and behaviour.
1.2. The rationale for using visual imagery and
visualisation to raise environmental awareness and
influence behaviour
Human responses to environments and visual displays
can be broadly categorised as cognitive (related to knowl-
edge and understanding), affective (related to feelings,
attitudes, and emotions), behavioural (related to changes in
behaviour of the viewer), and physiological (biological or
physical effects on the observer’s body) (Zube et al., 1982).
The latter type of response is not considered further in this
paper. Perception is defined here as the process of seeing or
otherwise perceiving phenomena, leading to particular
responses or states which include both cognitive and
affective outcomes. The focus of the paper is primarily
on individual perceptions, individual behavioural responses,
and organisational behaviour (i.e. policy).
The ability of visual imagery to communicate messages
quickly and powerfully has long been recognised in fields of
human activity ranging from commercial advertising, to the
media, to political campaigns: seeing is believing. The
cognitive advantages of visual information over written or
verbal information have been widely documented (e.g.
Tufte, 1990), for example, when mentally visualising
conditions that cannot be seen directly in the real world
(e.g. famines in remote countries, or the design of a proposed
building). Visual stimuli can also trigger innate and instant
reflexes and feelings which can be persistent even in the face
of new information (Slovic et al., 2002); Zajonc (1984) has
termed this the ‘‘primacy of affect’’ over cognition. Visual
imagery can therefore be a powerful tool to reach people’s
emotional side, as witnessed in the more dramatic imagery
from the news media. Imagery (visual or otherwise) which
triggers affective responses has been shown to improve
cognition in some cases (Winn, 1997), and to influence
people’s decision-making (Slovic et al., 2002). Clearly, the
intent of some visual imagery is not just to inform or engage
emotionally, but also to influence people’s behaviour, as in
advertising and public service health announcements.
Community-based social marketing using such techniques
has proved effective in bringing about behaviour change
(McKenzie-Mohr and Smith, 1999; Kollmuss and Agyeman,
2002).
Among the various forms of visual imagery available, 3D
visualisations present special characteristics which help
demonstrate consequences of environmental change in a
compelling manner. Scientific information is commonly
communicated by forms of data visualisation such as charts,
diagrams, maps, graphics, and 3D computer models (Cox,
1990; MacEachren and Ganter, 1990). These 2D and 3D
representations are often somewhat abstract or simplified
(Fig. 1). Landscape visualisation, sometimes referred to as
visual simulation or landscape modelling (Ervin and
Hasbrouck, 2001), represents actual places and on-the-
ground conditions in 3D perspective views (Fig. 2), often
with fairly high realism (Sheppard and Salter, 2004). These
specific forms of virtual reality are now typically computer-
generated in three or four dimensions, and can convey
detailed information on the assumed future appearance of
environments (sky, terrain, buildings, and vegetation). This
amounts to a unique form of visual communication,
conveying information in the dominant form to which the
human species is genetically adapted (i.e. visual land-
scapes), but capable of showing future worlds as they would
be seen if the viewer were actually there. Historically,
landscape visualisations have been used primarily in urban
design and impact assessment (Porter, 1979; Sheppard,
1989; Bosselmann, 1998). GIS-based methods for landscape
visualisation (Appleton et al., 2002) are now being applied
more broadly to depict alternative future scenarios for
visioning, public input, and decision-making (Tress and
Tress, 2002; Steinitz et al., 2003; Sheppard and Meitner,
2005).
Nicholson-Cole (2005) describes the promise of land-
scape visualisation in conveying strong messages quickly,
condensing complex information, engaging people in issues
of environmental change, and motivating personal action.
However, we lack comprehensive knowledge and integrative
theories to validate, explain, and predict a broad range of
responses to landscape visualisations (Appleyard, 1977;
Sheppard, 2001). These techniques also harbour risks and
key limitations, and there are a number of ethical and

S.R.J. Sheppard / Environmental Science & Policy 8 (2005) 637–654 639
Fig. 2. Visualisations of landscapes can now be modelled in detail and realistically rendered, as in this depiction of two forest management alternatives after 38
years of plan implementation. Credit: Ken Fairhurst, Mike Meitner, Ryan Gandy, and Duncan Cavens, CALP, UBC. Courtesy of CANFOR.
professional issues raised by attempts to influence behaviour
using visual imagery. It is therefore important to consider
carefully available evidence and theoretical arguments for
the effectiveness and ethics of using visualisation on climate
change issues, in order to avoid false expectations, critique
the inevitable use of visualisations of climate change, and
guide further research.
1.3. Scope and structure of paper
These issues are discussed in the context of an initial
theoretical framework on the possible effects of landscape
visualisations on human responses to climate change; thus,
Section 2 addresses the question: ‘‘Can landscape visualisa-
tion deliver on improving awareness and stimulating action
on climate change?’’ Section 3 examines dilemmas relating
to such use, essentially addressing the question: ‘‘Should we
use landscape visualisations to engage the emotions and
influence behaviour, and if so, how?’’ Possible approaches
are described involving ethical standards for use of
visualisations in a persuasive role on climate change,
resulting policy implications, and research priorities.
Visualisation can have multiple roles in society: in
entertainment, planning and decision-support, education,
and research on public perceptions. In this paper, the focus is
on visualisations as awareness-building tools and potential
change agents in fostering action by both the general public
and policy-makers, although with more emphasis on
individual behaviour. In the context of climate change,
the most urgent applications address the need for
behavioural change to mitigate climate change, though
the ideas discussed in this paper apply equally to adaptation
priorities.
While the focus is on landscape visualisation, it is
understood that in reality a combination of techniques and
influences will be required to effect societal change on
climate change; the attempt made here is to articulate the
additional or value-added contributions of visualisation
within the toolset. In the rest of this paper, the term
‘visualisation’ refers to landscape visualisation, unless
otherwise noted.
2. A theoretical framework for the impact of
visualisation on awareness, attitudes, andbehaviour in relation to climate change
This section addresses the issue of whether landscape
visualisation can be expected to impact awareness,
individual behaviour, and policy. We briefly consider
theoretical concepts, available evidence, and experience
from professional practice, relating to people’s responses to
general environmental issues presented via landscape
visualisation. Then, we consider how this knowledge on
visualisation can be applied to the question of people’s
responses to climate change.
2.1. Human responses to landscape visualisations
Some of the potential benefits promised by landscape
visualisation techniques in the arena of awareness-building,
behaviour change, and environmental decision-making can
be summarised as in Table 1. These benefits include both
self-evident capabilities (e.g. the ability to depict alternative
future scenarios side by side) and theorised influences on
people’s responses (e.g. increased engagement and per-
ceived salience). However, despite the widespread use of
landscape visualisations in planning and design, findings on
responses to them are generally not scientifically docu-
mented or comprehensive (Sheppard, 2001; Lange, 2001;
S.R.J. Sheppard / Environmental Science & Policy 8 (2005) 637–654640
Table 1
Potentially beneficial attributes of landscape visualisation for promoting environmental awareness and actiona
Integration of science
and intuition
The combination of the predictive capabilities of modelling and GIS with the intuitive and experientially rich
media of photography and realistic representation, with meaningful socio-cultural associations for communities
that may help strengthen more informed perspectives in decision-making
Engagement of lay-people The attractiveness of virtual reality and its novel applications to conventional planning problems may be helpful
in getting multiple stakeholders to engage in public processes (Sheppard and Meitner, 2005; Nicholson-Cole, 2005)
Personal salience The ability to localize and ground the information by detailed depiction of recognisable and well-known sites as they
would be seen by local residents or users, as opposed to a detached plan or aerial view or an expert’s conceptualisation
Presentation of choices
for the future
The ability to present alternative futures side-by-side and over time, posing ‘what-if’ questions (Steinitz et al., 2003)
in the search for preferred or acceptable environmental solutions over the long term
Flexibility of tool Digital visualisation techniques can be modified or customized to emphasize important information or condense
complex details, to fit the presentation to the needs and capabilities of the user (Sheppard, 2005)
a Potential disadvantages of landscape visualisation are discussed in the text in Section 3.1.
Sheppard and Salter, 2004), and there is clear potential for
offsetting disadvantages (discussed below).
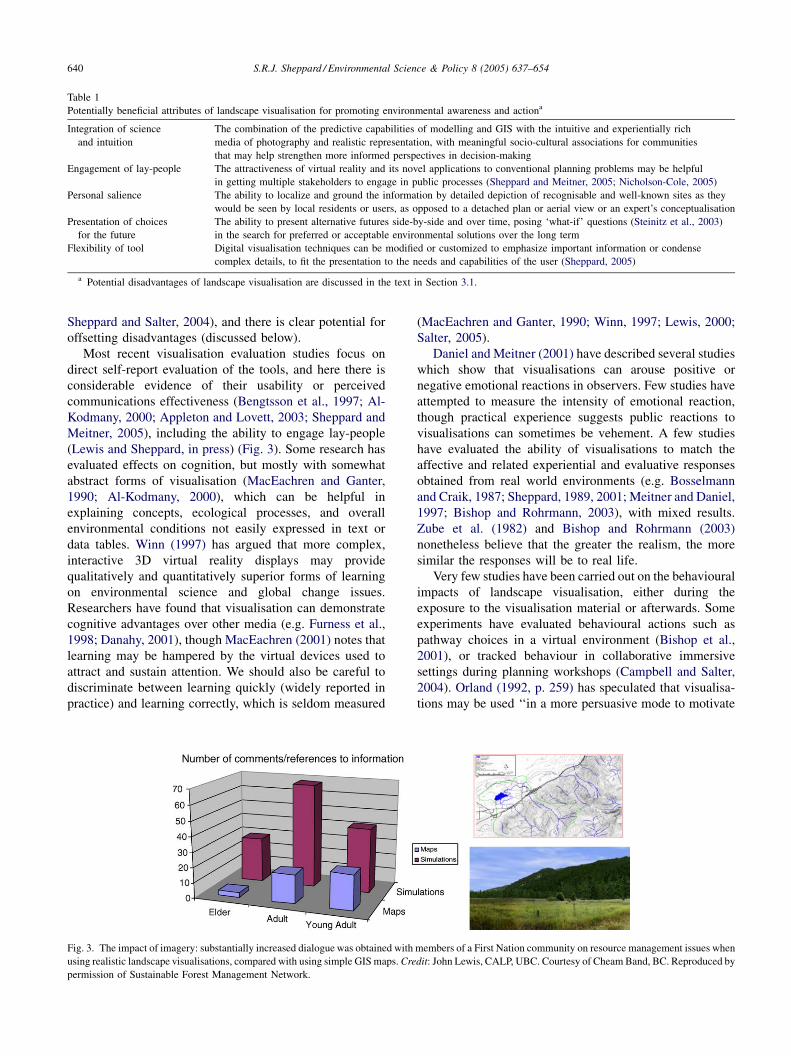
Most recent visualisation evaluation studies focus on
direct self-report evaluation of the tools, and here there is
considerable evidence of their usability or perceived
communications effectiveness (Bengtsson et al., 1997; Al-
Kodmany, 2000; Appleton and Lovett, 2003; Sheppard and
Meitner, 2005), including the ability to engage lay-people
(Lewis and Sheppard, in press) (Fig. 3). Some research has
evaluated effects on cognition, but mostly with somewhat
abstract forms of visualisation (MacEachren and Ganter,
1990; Al-Kodmany, 2000), which can be helpful in
explaining concepts, ecological processes, and overall
environmental conditions not easily expressed in text or
data tables. Winn (1997) has argued that more complex,
interactive 3D virtual reality displays may provide
qualitatively and quantitatively superior forms of learning
on environmental science and global change issues.
Researchers have found that visualisation can demonstrate
cognitive advantages over other media (e.g. Furness et al.,
1998; Danahy, 2001), though MacEachren (2001) notes that
learning may be hampered by the virtual devices used to
attract and sustain attention. We should also be careful to
discriminate between learning quickly (widely reported in
practice) and learning correctly, which is seldom measured
Fig. 3. The impact of imagery: substantially increased dialogue was obtained with
using realistic landscape visualisations, compared with using simple GISmaps.Cre
permission of Sustainable Forest Management Network.
(MacEachren and Ganter, 1990; Winn, 1997; Lewis, 2000;
Salter, 2005).
Daniel and Meitner (2001) have described several studies
which show that visualisations can arouse positive or
negative emotional reactions in observers. Few studies have
attempted to measure the intensity of emotional reaction,
though practical experience suggests public reactions to
visualisations can sometimes be vehement. A few studies
have evaluated the ability of visualisations to match the
affective and related experiential and evaluative responses
obtained from real world environments (e.g. Bosselmann
and Craik, 1987; Sheppard, 1989, 2001; Meitner and Daniel,
1997; Bishop and Rohrmann, 2003), with mixed results.
Zube et al. (1982) and Bishop and Rohrmann (2003)
nonetheless believe that the greater the realism, the more
similar the responses will be to real life.
Very few studies have been carried out on the behavioural
impacts of landscape visualisation, either during the
exposure to the visualisation material or afterwards. Some
experiments have evaluated behavioural actions such as
pathway choices in a virtual environment (Bishop et al.,
2001), or tracked behaviour in collaborative immersive
settings during planning workshops (Campbell and Salter,
2004). Orland (1992, p. 259) has speculated that visualisa-
tions may be used ‘‘in a more persuasive mode to motivate
members of a First Nation community on resource management issues when
dit: John Lewis, CALP, UBC. Courtesy of CheamBand, BC. Reproduced by

S.R.J. Sheppard / Environmental Science & Policy 8 (2005) 637–654 641
people to do something about the impact being represented,’’
as happens with photography, film, and television media.
McKenzie-Mohr and Smith (1999) provide numerous
examples of visual information which, with other commu-
nity-based social marketing techniques, can influence
sustainable behaviour or adaptation if they are vivid,
personal, and concrete.
Interactions between cognitive, affective, and beha-
vioural responses may help explain visual triggers to
behavioural responses. Slovic et al. (2002, p. 398) state that
‘‘many theorists have given affect a direct and primary role
in motivating behaviour.’’ They review evidence that more
vivid and sensational narratives associated with feelings
rather than cognition have more influence on risk
behaviours. This suggests that introducing compelling
visual evidence that is readily translatable into personal
risks or implications can be more successful in strengthening
motivations to change behaviour than cognitive information
alone. Maiteny (2002) argues that behavioural change to
support sustainability can only take place when the
individual has gone through a deep-rooted personal
transformation, as in experiential learning processes.
Sheppard (2004) and Nicholson-Cole (2005) speculate that
the strength and symbolic emotive content of visualisation
imagery may motivate people to act in a more sustainable
manner. However, it must be recognised that both the forms
of and causal influences on environmentally significant
behaviour are very complex, varying with pre-determined
attitudes, individual capability, context, etc. (Stern, 2000),
and therefore the effectiveness of any form of external
intervention such as visualisations, on their own, may be
limited by other factors.
There is also the important issue of how the use of
visualisation could influence relevant policy, either directly
through presentations to key decision-makers and policy-
makers or indirectly through public opinion and collective
individual actions. Again, however, there is little scientific
information on such policy responses in the visualisation
literature. There is some evidence from perception studies
using visualisation which indicate differing levels of
acceptability of various resource management scenarios
(e.g. Sheppard and Meitner, 2005; Ribe, 2005), although the
practical linkages between judgements of unacceptability in
research and actual policy impacts in the real world have not
been widely demonstrated. Professional practice does
provide anecdotal examples suggesting sometimes profound
effects of visualisation on government behaviour: for
example, computer visualisations of potential housing
development under the Official Community Plan in Maple
Ridge, BC, when shown to members of the city council,
caused such surprise and negative reaction that the council
initiated a process to develop sustainable community plans
with a very different footprint.
Overall, many dimensions of visualisation use and
subsequent human response (especially behavioural) are
not well understood, and we should be wary of generalizing
too broadly (Bosselmann and Craik, 1987). There would
however seem to be advantages in engagement and
cognition, with some evidence of emotional arousal and
the potential to affect behaviour on environmental issues.
2.2. Applications of landscape visualisation to the
problem of climate change
So, can visualisation, in combination with other
information sources/media, affect human responses to
climate change? To address this question systematically,
we need to consider the specific context of society’s
perceptions of climate change, before developing a
conceptual framework of how visualisation may relate to
these perceptions.
2.2.1. Perceptions of climate change
The potential for visualisation in relation to climate
change can be considered in terms of:
� p
erceptual characteristics and difficulties relating toclimate change itself;
� p
otential and observed responses of people and agenciesto climate change, and observed gaps between awareness
and behaviour;
� e
arly precedents for responses to imagery and visualisa-tion of climate change-related phenomena.
The characteristics of climate change make it difficult to
see directly. Carbon dioxide and even the carbon source
itself is effectively invisible. There is potential to recognise
some quite tangible visual or landscape-related effects of
climate change, such as sea-level rise, flooding, or drought (a
typology of such effects is provided below). However,
Tickell (2002) has described the problems of communicat-
ing change which occurs over long time periods and which
carries uncertain and uncomfortable future consequences.
Winn (1997) and Nicholson-Cole (2005) have described the
scale, complexity, and abstraction of climate change as
challenges to communication. This is exacerbated by
problems of media coverage, ranging from down-playing
the issue (Monbiot, 2004) to ‘‘inappropriate use of model
predictions, inaccurate representations of physical pro-
cesses, false associations of unrelated phenomena, and use
of emotion-laden language’’ (Furness et al., 1998, p. 19). It is
also difficult to relate global or national figures on climate
change to local scales (Furness et al., 1998), and there are as
yet few reliable predictions for local climate effects or
spatially explicit consequences at high levels of resolution,
other than for sea-level rise. It is therefore difficult for
individuals to relate their actions (good or bad) to the larger
context of climate change (Sheppard, 2004; Nicholson-Cole,
2005).
Information has begun to flow on the nature of
conceptualisations of and human responses to climate
change. Several researchers report evidence of persistent

S.R.J. Sheppard / Environmental Science & Policy 8 (2005) 637–654642
Fig. 4. Computer visualisations of simulated summer-averaged sea-ice
thickness at the South Pole over a 150 year period, where white represents
the thickest ice and the red line depicts the maximum extent of 1cm thick
sea-ice. Credit: Copyright, # 2002, University Corporation for Atmo-
spheric Research, http://www.vets.ucar.edu/vg/seaice/index.shtml. Scienti-
fic credits: Mark Holland, CGD/NCAR; Cecilia Bitz, U. Washington; Bruce
Briegleb, CGD/NCAR; Elizabeth Hunke, LANL; Bill Lipscomb, LANL;
RichardMoritz, U.Washington; Julie Schramm, CGD/NCAR. Visualization
credits: Fred Clare, NCAR/SCD; John Clyne, NCAR/SCD; Tim Scheitlin,
NCAR/SCD. (For interpretation of the references to colour in this figure
legend, the reader is referred to the web version of the article.)
misconceptions of climate change, e.g. confusing clean air
or ozone-layer issues with climate change (e.g. Furness
et al., 1998; Boardman and Palmer, 2003). Kollmuss and
Agyeman (2002) and Lorenzoni and Langford (2001)
describe various types of barrier or gaps between percep-
tions/intentions and behaviour conducive to climate change
mitigation, including gaps in cognition and awareness
(ignorance), gaps between knowledge and action, and gaps
between intent and action. Lorenzoni and Langford (2001)
identify different perspectives that people adopt when
confronted by climate change issues, including denial,
doubt, disinterest, and engagement. Other responses include
confusion, pessimism, guilt, frustration, and, more rarely,
motivation to change behaviour (Kollmuss and Agyeman,
2002; Maiteny, 2002). Nicholson-Cole (2005) found that a
sample of Norfolk residents expressed their feelings about
climate change in a somewhat negative but abstract, distant
sense, though personal experiences and impacts on local
environments were a common feature of people’s visual
conceptions of climate change. Her results highlight the
influence of popular visual media on the mental imagery of
climate change that respondents held (Nicholson-Cole,
2005), and suggest, in particular, that respondents were most
emotionally affected by national and local imagery, rather
than global. Gaps in behavioural motivation seemed to be
related to difficulties in personalising climate change
(Nicholson-Cole, 2005); respondents felt that they needed
to understand the personal implications of climate change
and be regularly reminded if they were to act. However, it
should be noted that these findings represent self-report data
on behavioural intent, and not actual measured behaviour.
In the context of climate change, visual communications
are beginning to be used to accelerate social learning, and
the possibility of their motivating the substantial policy,
technological, and life-style changes needed has begun to be
recognised. Cohen (1997) used GIS and remote sensing
imagery with other information to communicate climate
change scenarios to Canadian stakeholders, who reported
that the scenarios made a difference in their visions of the
future and potential interventions in policy debates.
Scientific agencies provide animated 3D visualisations of
modelled climate change phenomena seen from space, such
as changes in sea ice over time (Fig. 4), on the web; similar
visualisations of the ‘ozone hole’ are commonly credited
with helping to spur legislation to ban fluorocarbons. New
books on climate change highlight the impacts of climate
change as illustrated with vivid landscape photography of
changing iconic landscapes such as snow-capped volcanoes
and glaciers (Lynas, 2004). There has been much debate
over the recent film entitled ‘‘The Day After Tomorrow’’
which dramatically depicts fictionalized climate change
events (http://www.nydailynews.com/entertainment/story/
189422p-163828c.html). Lowe et al. (2005) found that
the film, which included spectacular ‘realistic’ visualisations
of weather extremes and sea-level rise threatening the
characters, did result in changes in attitude towards climate
change, with significantly more concern, anxiety, and
motivation to change behaviour, though the latter effect
was short-lived. It appeared, however, that the disaster film
genre, overly dramatic special effects, and the failure to
distinguish fact from fiction amid the high realism, led to
low credibility of the film itself, making inferences for more
scientifically based visualisation difficult to draw.
S.R.J. Sheppard / Environmental Science & Policy 8 (2005) 637–654 643
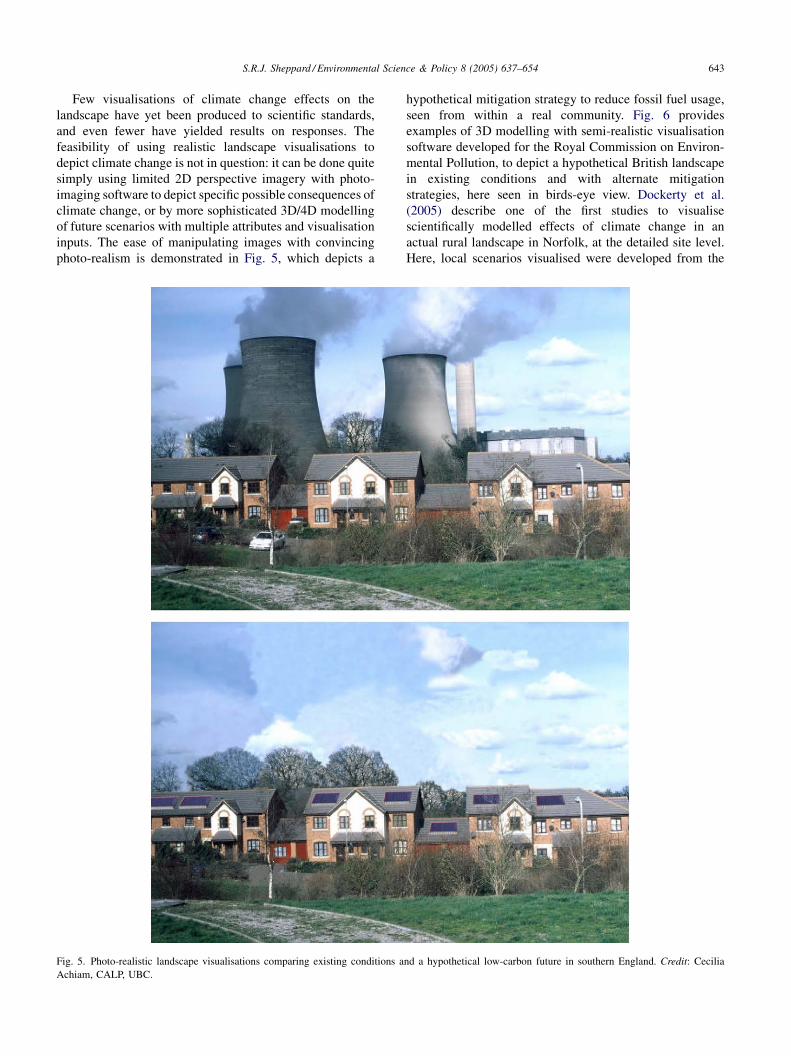
Few visualisations of climate change effects on the
landscape have yet been produced to scientific standards,
and even fewer have yielded results on responses. The
feasibility of using realistic landscape visualisations to
depict climate change is not in question: it can be done quite
simply using limited 2D perspective imagery with photo-
imaging software to depict specific possible consequences of
climate change, or by more sophisticated 3D/4D modelling
of future scenarios with multiple attributes and visualisation
inputs. The ease of manipulating images with convincing
photo-realism is demonstrated in Fig. 5, which depicts a
Fig. 5. Photo-realistic landscape visualisations comparing existing conditions a
Achiam, CALP, UBC.
hypothetical mitigation strategy to reduce fossil fuel usage,
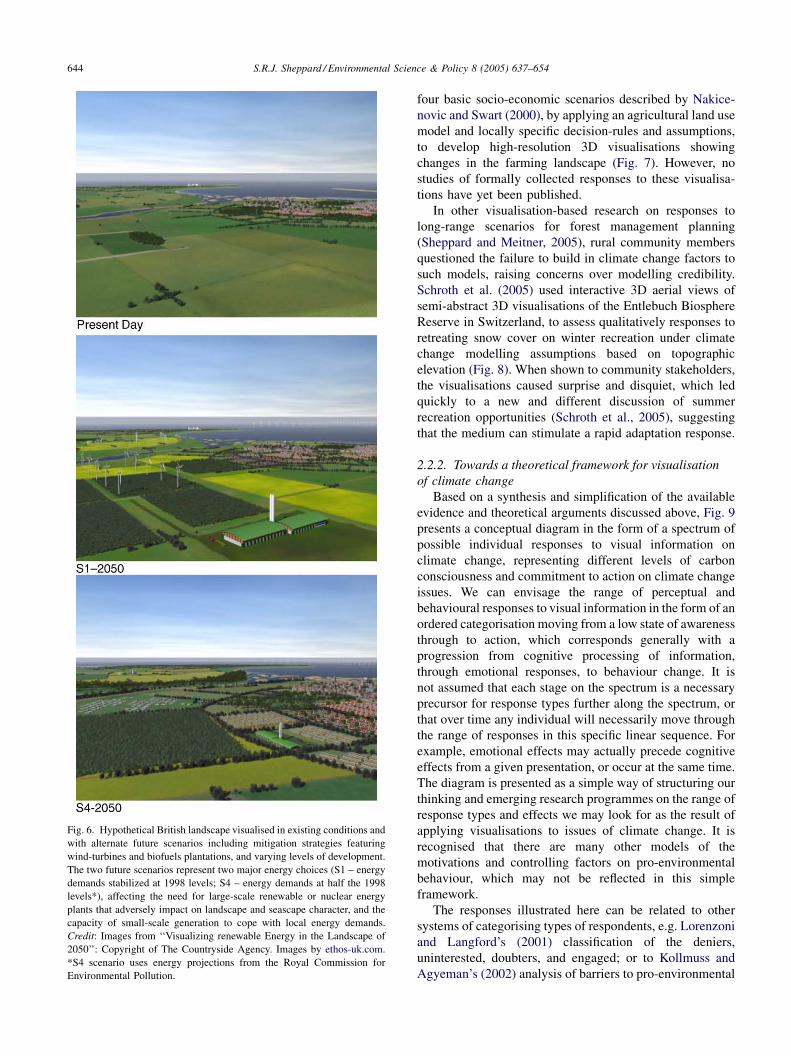
seen from within a real community. Fig. 6 provides
examples of 3D modelling with semi-realistic visualisation
software developed for the Royal Commission on Environ-
mental Pollution, to depict a hypothetical British landscape
in existing conditions and with alternate mitigation
strategies, here seen in birds-eye view. Dockerty et al.
(2005) describe one of the first studies to visualise
scientifically modelled effects of climate change in an
actual rural landscape in Norfolk, at the detailed site level.
Here, local scenarios visualised were developed from the
nd a hypothetical low-carbon future in southern England. Credit: Cecilia
S.R.J. Sheppard / Environmental Science & Policy 8 (2005) 637–654644
Fig. 6. Hypothetical British landscape visualised in existing conditions and
with alternate future scenarios including mitigation strategies featuring
wind-turbines and biofuels plantations, and varying levels of development.
The two future scenarios represent two major energy choices (S1 – energy
demands stabilized at 1998 levels; S4 – energy demands at half the 1998
levels*), affecting the need for large-scale renewable or nuclear energy
plants that adversely impact on landscape and seascape character, and the
capacity of small-scale generation to cope with local energy demands.
Credit: Images from ‘‘Visualizing renewable Energy in the Landscape of
2050’’: Copyright of The Countryside Agency. Images by ethos-uk.com.
*S4 scenario uses energy projections from the Royal Commission for
Environmental Pollution.
four basic socio-economic scenarios described by Nakice-
novic and Swart (2000), by applying an agricultural land use
model and locally specific decision-rules and assumptions,
to develop high-resolution 3D visualisations showing
changes in the farming landscape (Fig. 7). However, no
studies of formally collected responses to these visualisa-
tions have yet been published.
In other visualisation-based research on responses to
long-range scenarios for forest management planning
(Sheppard and Meitner, 2005), rural community members
questioned the failure to build in climate change factors to
such models, raising concerns over modelling credibility.
Schroth et al. (2005) used interactive 3D aerial views of
semi-abstract 3D visualisations of the Entlebuch Biosphere
Reserve in Switzerland, to assess qualitatively responses to
retreating snow cover on winter recreation under climate
change modelling assumptions based on topographic
elevation (Fig. 8). When shown to community stakeholders,
the visualisations caused surprise and disquiet, which led
quickly to a new and different discussion of summer
recreation opportunities (Schroth et al., 2005), suggesting
that the medium can stimulate a rapid adaptation response.
2.2.2. Towards a theoretical framework for visualisation
of climate change
Based on a synthesis and simplification of the available
evidence and theoretical arguments discussed above, Fig. 9
presents a conceptual diagram in the form of a spectrum of
possible individual responses to visual information on
climate change, representing different levels of carbon
consciousness and commitment to action on climate change
issues. We can envisage the range of perceptual and
behavioural responses to visual information in the form of an
ordered categorisation moving from a low state of awareness
through to action, which corresponds generally with a
progression from cognitive processing of information,
through emotional responses, to behaviour change. It is
not assumed that each stage on the spectrum is a necessary
precursor for response types further along the spectrum, or
that over time any individual will necessarily move through
the range of responses in this specific linear sequence. For
example, emotional effects may actually precede cognitive
effects from a given presentation, or occur at the same time.
The diagram is presented as a simple way of structuring our
thinking and emerging research programmes on the range of
response types and effects we may look for as the result of
applying visualisations to issues of climate change. It is
recognised that there are many other models of the
motivations and controlling factors on pro-environmental
behaviour, which may not be reflected in this simple
framework.
The responses illustrated here can be related to other
systems of categorising types of respondents, e.g. Lorenzoni
and Langford’s (2001) classification of the deniers,
uninterested, doubters, and engaged; or to Kollmuss and
Agyeman’s (2002) analysis of barriers to pro-environmental
S.R.J. Sheppard / Environmental Science & Policy 8 (2005) 637–654 645
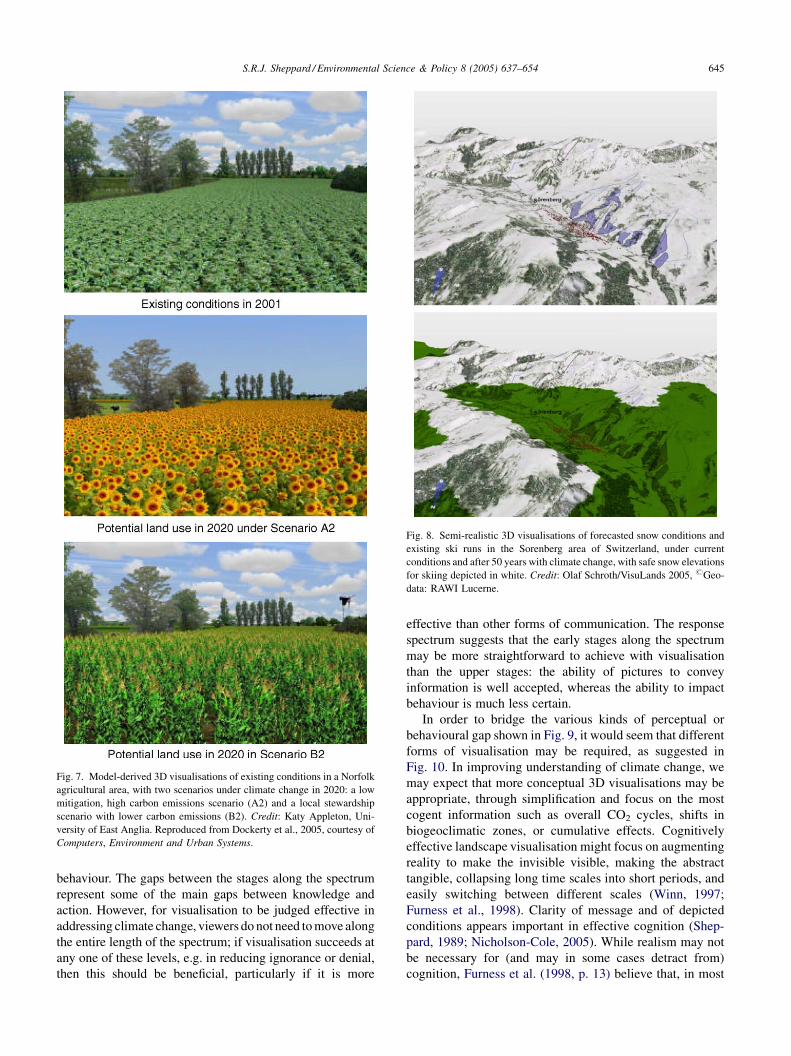
Fig. 7. Model-derived 3D visualisations of existing conditions in a Norfolk
agricultural area, with two scenarios under climate change in 2020: a low
mitigation, high carbon emissions scenario (A2) and a local stewardship
scenario with lower carbon emissions (B2). Credit: Katy Appleton, Uni-
versity of East Anglia. Reproduced from Dockerty et al., 2005, courtesy of
Computers, Environment and Urban Systems.
Fig. 8. Semi-realistic 3D visualisations of forecasted snow conditions and
existing ski runs in the Sorenberg area of Switzerland, under current
conditions and after 50 years with climate change, with safe snow elevations
for skiing depicted in white. Credit: Olaf Schroth/VisuLands 2005, #Geo-
data: RAWI Lucerne.
behaviour. The gaps between the stages along the spectrum
represent some of the main gaps between knowledge and
action. However, for visualisation to be judged effective in
addressing climate change, viewers do not need tomove along
the entire length of the spectrum; if visualisation succeeds at
any one of these levels, e.g. in reducing ignorance or denial,
then this should be beneficial, particularly if it is more
effective than other forms of communication. The response
spectrum suggests that the early stages along the spectrum
may be more straightforward to achieve with visualisation
than the upper stages: the ability of pictures to convey
information is well accepted, whereas the ability to impact
behaviour is much less certain.
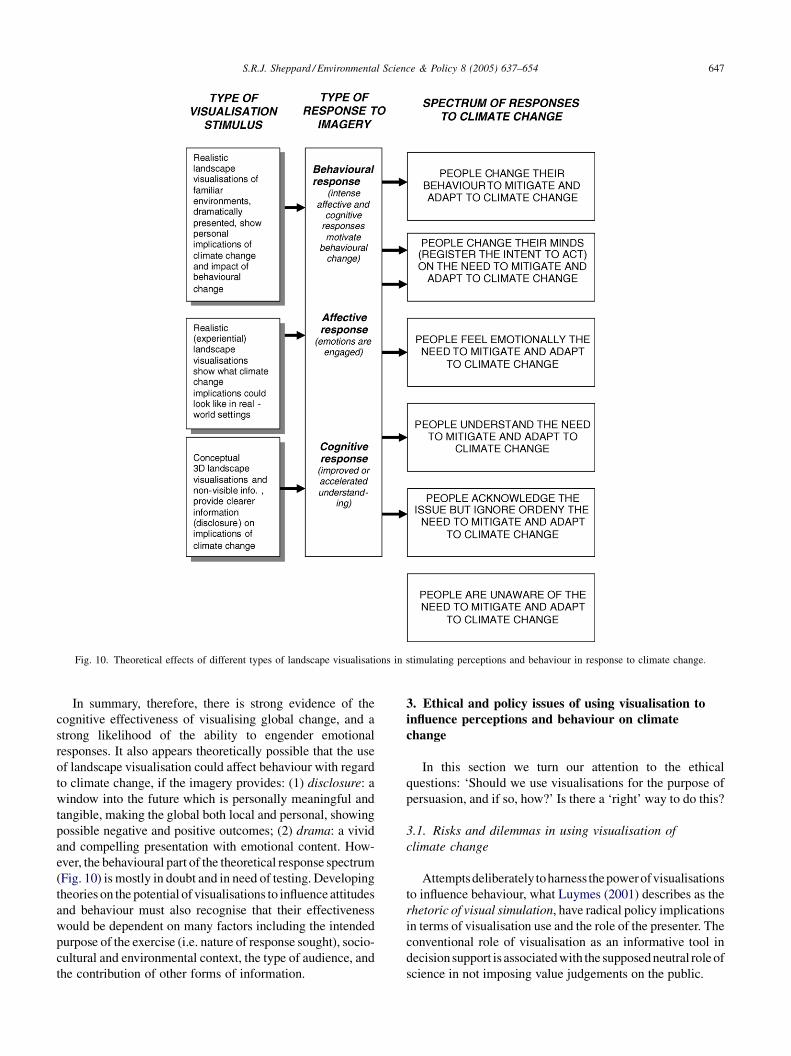
In order to bridge the various kinds of perceptual or
behavioural gap shown in Fig. 9, it would seem that different
forms of visualisation may be required, as suggested in
Fig. 10. In improving understanding of climate change, we
may expect that more conceptual 3D visualisations may be
appropriate, through simplification and focus on the most
cogent information such as overall CO2 cycles, shifts in
biogeoclimatic zones, or cumulative effects. Cognitively
effective landscape visualisation might focus on augmenting
reality to make the invisible visible, making the abstract
tangible, collapsing long time scales into short periods, and
easily switching between different scales (Winn, 1997;
Furness et al., 1998). Clarity of message and of depicted
conditions appears important in effective cognition (Shep-
pard, 1989; Nicholson-Cole, 2005). While realism may not
be necessary for (and may in some cases detract from)
cognition, Furness et al. (1998, p. 13) believe that, in most

S.R.J. Sheppard / Environmental Science & Policy 8 (2005) 637–654646
Fig. 9. A theoretical spectrum of human responses to visual information on
climate change.
cases, ‘‘. . . realistic representation will lead to more direct
and more robust knowledge construction.’’ Experience has
already shown that the novelty or interest in computer
visualisations can attract people and engage them in
collaborative learning processes (Winn, 1997; Campbell
and Salter, 2004; Sheppard and Meitner, 2005).
In order to reach the emotional side of viewers, the
following additional attributes of visualisation would appear
to be important:
� R
ealism, in the sense of photo-realistic or ‘lifelike’imagery in re-creating experiential qualities (Appleyard,
1977) and making abstract concepts ‘concrete’’ (McKen-
zie-Mohr and Smith, 1999).
� D
epicting personally relevant environments, such as localand recognisable neighbourhoods (Nicholson-Cole,
2005), or iconic, well-known landscape symbols to which
people can relate (Sheppard, 2004). It is well known in the
environmental psychology literature that familiar land-
scapes tend to be associated with stronger and more
positive affective responses (e.g. Kaplan and Herbert,
1988), and as noted above, people seem most affected by
personal implications of climate change (McKenzie-
Mohr and Smith, 1999; Nicholson-Cole, 2005).
� I
mmediacy: near-term conditions (Lorenzoni and Lang-ford, 2001) or possibly longer term conditions made to
seem nearer term through speeding up time, combined
with meaningful future considerations such as their
neighbourhood as seen by the viewers’ grand-children.
� C
ontaining images of people, animals, or other symbolswith strong affective content (Nicholson-Cole, 2005).
� D
emonstrating the future consequences of people’sactions or inactions (Furness et al., 1998).
In theory, behaviour change may require emotional and
cognitive attributes described above, but intensified to be
vivid, memorable, and transformative (McKenzie-Mohr and
Smith, 1999; Maiteny, 2002): ‘‘a compelling virtual
environment will likely heighten (people’s) motivation to
act responsibly’’ (Furness et al., 1998, p. 28). Both Winn
(1997) and Furness et al. (1998) argue that vivid and
compelling visualisations can be obtained through a range of
techniques, notably:
� i
mmersion in a virtual environment: large images andpanoramic ‘wrap-around’ displays can increase the sense
of presence (Furness et al., 1998), engagement (Apple-
yard, 1977), and intensity of experience (Sheppard et al.,
2001);
� d
ynamic or animated imagery that increases enthusiasmand engagement (e.g. Dykes, 2000) and/or provides
freedom of virtual movement for the viewer (Orland and
Uusitalo, 2001);
� i
nteractivity with the displayed data in real-time, toincrease engagement (Orland and Uusitalo, 2001; Camp-
bell and Salter, 2004; Schroth et al., 2005).
Beyond media attributes, the content of the climate
change message also appears critical if behaviour is to be
influenced. McKenzie-Mohr and Smith (1999) argue that
messages which emphasize environmental losses due to
inaction are consistently more persuasive than those which
simply emphasize benefits of action; such threats should be
combined with positive implications of action to overcome
the barrier of helplessness which might otherwise afflict
viewers (Kollmuss and Agyeman, 2002). Nicholson-Cole
(2005) stresses the importance of tailoring the visualisation
material to the target audience in light of the variability in
human responses: this can be interpreted as identifying the
most applicable stage on the response spectrum for the target
audience in selecting the appropriate visualisation stimulus.
A more systematic discussion of approaches to the content
of visualisations addressing aspects of climate change is
provided in Section 3.2.
S.R.J. Sheppard / Environmental Science & Policy 8 (2005) 637–654 647
Fig. 10. Theoretical effects of different types of landscape visualisations in stimulating perceptions and behaviour in response to climate change.
In summary, therefore, there is strong evidence of the
cognitive effectiveness of visualising global change, and a
strong likelihood of the ability to engender emotional
responses. It also appears theoretically possible that the use
of landscape visualisation could affect behaviour with regard
to climate change, if the imagery provides: (1) disclosure: a
window into the future which is personally meaningful and
tangible, making the global both local and personal, showing
possible negative and positive outcomes; (2) drama: a vivid
and compelling presentation with emotional content. How-
ever, the behavioural part of the theoretical response spectrum
(Fig. 10) is mostly in doubt and in need of testing. Developing
theories on the potential of visualisations to influence attitudes
and behaviour must also recognise that their effectiveness
would be dependent on many factors including the intended
purpose of the exercise (i.e. nature of response sought), socio-
cultural and environmental context, the type of audience, and
the contribution of other forms of information.
3. Ethical and policy issues of using visualisation toinfluence perceptions and behaviour on climate
change
In this section we turn our attention to the ethical
questions: ‘Should we use visualisations for the purpose of
persuasion, and if so, how?’ Is there a ‘right’ way to do this?
3.1. Risks and dilemmas in using visualisation of
climate change
Attemptsdeliberately toharness thepowerofvisualisations
to influence behaviour, what Luymes (2001) describes as the
rhetoric of visual simulation, have radical policy implications
in terms of visualisation use and the role of the presenter. The
conventional role of visualisation as an informative tool in
decisionsupport is associatedwith the supposedneutral roleof
science in not imposing value judgements on the public.
S.R.J. Sheppard / Environmental Science & Policy 8 (2005) 637–654648
Arguments for a more deliberate attempt to use
visualisation to influence the public or impact government
policy emphasize the need to forestall an actual crisis in the
environment as an over-riding imperative. A persuasive
approach should not necessarily be equated with inaccurate
or distorted visualisations: visualisations properly prepared
can simply disclose the truth, which may itself be
persuasive. In fact, it could be argued that visualisations
which disclose possible futures are less misleading than not
using them, and there may be an obligation to disclose the
truth to those who cannot or will not see. Luymes (2001) has
advocated the use of powerful visualisation tools to shape
public values on sustainability. History is replete with
examples of the inability of cultures to foresee the impact of
their actions or inaction: e.g. the use of DDT, fluorocarbons,
and indeed carbon emissions. Precedents do exist for other
kinds of long-term predictions and disclosure of con-
sequences, including environmental impact assessment,
multiple-rotation forest modelling, and biodiversity model-
ling in response to climate change (Berry et al., 2002). There
is also an argument that scientifically produced visualisa-
tions are needed to counter the misinformation propagated
by entertainment media such as the recent film ‘‘The Day
After Tomorrow,’’ while utilizing a similar medium. More
generally, Michaelis (2003) has argued for a government
strategy to change public behaviour on greenhouse gas
emissions through a process of leadership, dialogue, and
facilitation: there would appear to be strong role for
visualisation in helping project ‘‘visions for a sustainable
way of living’’ (Michaelis, 2003, p. S143).
This author concludes that the persuasive use of
visualisations, together with other tools and approaches,
is justified if they can be effective, and may even be vital in
communicating climate change urgently. We should take the
perceptual leap and seek to engage the public’s emotions.
This seems worth doing even if behaviour does not change
immediately, by engaging people to think more seriously
about the future and showing them they have a choice among
alternative futures. This at least would remove the first
barrier of ignorance on the response spectrum of carbon
consciousness and action (Fig. 9).
Once the decision is taken that a policy of persuasive use
of powerful visual imagery can be justified in the fight
against climate change, a second tier of issues becomes
evident. What risks do we take in such usage, how can they
be minimized, and are the resulting risks worth taking?
There are many process decisions and constraints in the
production of any realistic simulated landscape imagery, and
many different problems can result (Sheppard, 1989). There
is space here only for a brief discussion of some of these, as
follows:
1. T
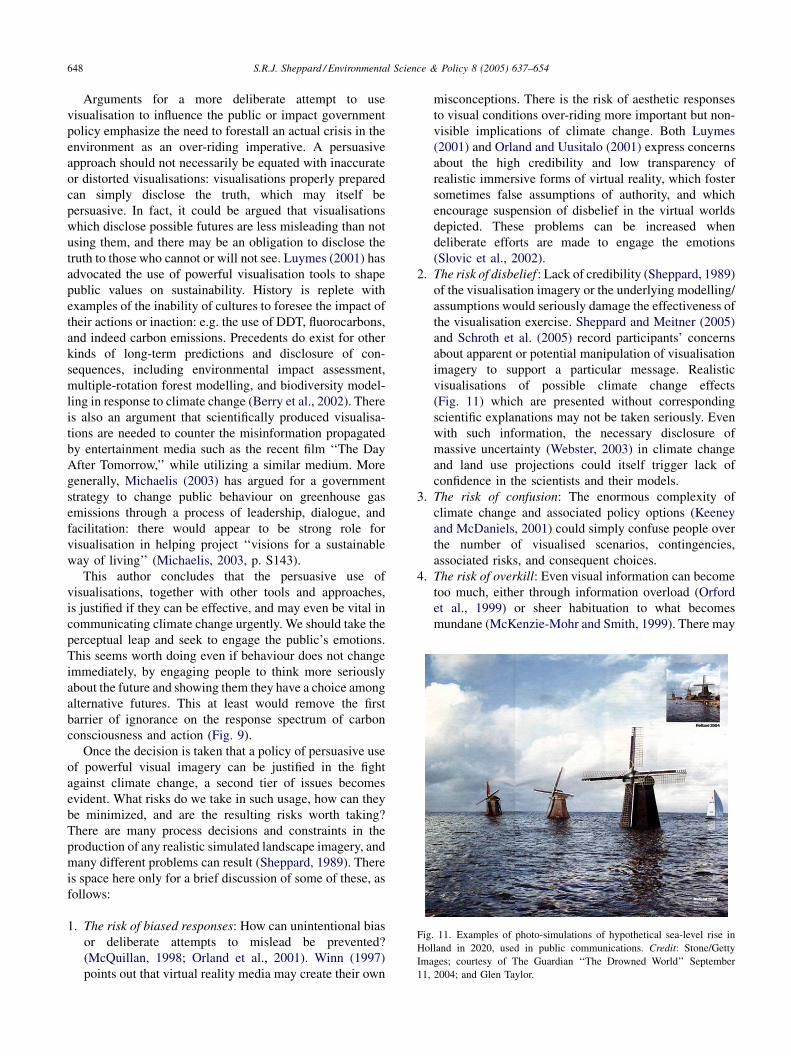
Fig. 11. Examples of photo-simulations of hypothetical sea-level rise inHolland in 2020, used in public communications. Credit: Stone/Getty
Images; courtesy of The Guardian ‘‘The Drowned World’’ September
11, 2004; and Glen Taylor.
he risk of biased responses: How can unintentional bias
or deliberate attempts to mislead be prevented?
(McQuillan, 1998; Orland et al., 2001). Winn (1997)
points out that virtual reality media may create their own
misconceptions. There is the risk of aesthetic responses
to visual conditions over-riding more important but non-
visible implications of climate change. Both Luymes
(2001) and Orland and Uusitalo (2001) express concerns
about the high credibility and low transparency of
realistic immersive forms of virtual reality, which foster
sometimes false assumptions of authority, and which
encourage suspension of disbelief in the virtual worlds
depicted. These problems can be increased when
deliberate efforts are made to engage the emotions
(Slovic et al., 2002).
2. T
he risk of disbelief : Lack of credibility (Sheppard, 1989)of the visualisation imagery or the underlying modelling/
assumptions would seriously damage the effectiveness of
the visualisation exercise. Sheppard and Meitner (2005)
and Schroth et al. (2005) record participants’ concerns
about apparent or potential manipulation of visualisation
imagery to support a particular message. Realistic
visualisations of possible climate change effects
(Fig. 11) which are presented without corresponding
scientific explanations may not be taken seriously. Even
with such information, the necessary disclosure of
massive uncertainty (Webster, 2003) in climate change
and land use projections could itself trigger lack of
confidence in the scientists and their models.
3. T
he risk of confusion: The enormous complexity ofclimate change and associated policy options (Keeney
and McDaniels, 2001) could simply confuse people over
the number of visualised scenarios, contingencies,
associated risks, and consequent choices.
4. T
he risk of overkill: Even visual information can becometoo much, either through information overload (Orford
et al., 1999) or sheer habituation to what becomes
mundane (McKenzie-Mohr and Smith, 1999). There may

S.R.J. Sheppard / Environmental Science & Policy 8 (2005) 637–654 649
be different desired levels of stimulus and response
intensity for different purposes, e.g. multiple iterative
exposures to promote better learning versus single sharp
exposures for shock value. Winn (1997) has raised the
fear of the virtual reality medium itself being ‘over-
hyped’ and losing effectiveness.
5. T
he risk of upsetting people: There are differing views onthe desirability and effectiveness of emotional content
(such as fear or unease), leading to negative or defensive
reactions to the issue (Nicholson-Cole, 2005), versus
judicious use to trigger behavioural change (McKenzie-
Mohr and Smith, 1999). Furness et al. (1998) note that
students who become personally engaged in serious
consideration of global change may become very
distressed, raising conflicts between the goal of
‘truthfulness’ and the desire not to upset people.
6. T
he risk of perpetuating the problem by encouragingacceptance of climate change: What if the visualisation
imagery is valid but simply too subtle to influence
attitudes, or depicts positive imagery that may result from
some aspect of a given climate change scenario?
Dockerty et al. (2005) have generated landscape
visualisations for Norfolk (Fig. 7) showing what some
may consider to be attractive fields of sunflowers which
would replace the existing agricultural crops.
3.2. Ethical standards and policy implications
Given the issues just raised, how should we embark upon
a policy of deliberate use of visualisations to influence
attitudes and behaviour on climate change? The following
sections briefly explore three topics key to the ethical
implementation of visualisations of climate change.
3.2.1. Defensible methodologies for preparing
visualisations
An obvious starting point would be to develop guidelines
for uses of visualisation related to climate change,
appropriate to the needs of public motivation and
decision-making. This would address the principal missing
ingredient beyond disclosure and drama for effective
visualisation of climate change: defensibility. If there is
no overall scientific or logical underpinning of the
visualisations, they are unlikely to change peoples’ minds
or convince policy-makers suspicious of new media.
However, there is little guidance on how much
manipulation or selectivity should be allowed to create
the appropriate kinds of drama while avoiding the pitfalls
described in Section 3.1. What accuracy or response validity
standards can be applied when visualisations represent
predictions of unknowable futures? Should accuracy be
measured against likelihood or feasibility of occurrence, or
as veracity to the modelled outcomes? Towhat degree would
existing conventions developed for typical uses of landscape
visualisation in design and planning apply to the special
circumstances of climate change mitigation and adaptation?
Sheppard (2001, 2005) has proposed a code of ethics for
visualisation which identifies the following principles or
criteria that may be relevant to climate change applications:
accuracy of visualisation relative to expected conditions;
representativeness of views in space and time; visual clarity
of presentations; interest and engagement of the audience/
users; legitimacy or accountability of the visualisation,
including transparency of data and of the production
process, and delivery of visualisations by a trusted source
(Sheppard and Meitner, 2005; Nicholson-Cole, 2005); and
accessibility of the visualisations to the public and potential
users.
Other ethical and policy issues of particular concern to
climate change are likely to include:
� R
epresenting uncertainty, e.g. through presentationdevices (Dockerty et al., 2005) or through multiple
alternative visualisations per given scenario as a form of
sensitivity testing (Appleyard, 1977; Sheppard, 2001,
2004).
� D
own-scaling from global, regional, or even local climatechange scenarios: we need robust ways of developing
decision rules for visualising the detailed landscape
conditions necessary for personal engagement and local
recognition, but based on very broad land use or
environmental scenarios with limited resolution data-sets
(e.g. UKCIP, 2000b; Dockerty et al., 2005).
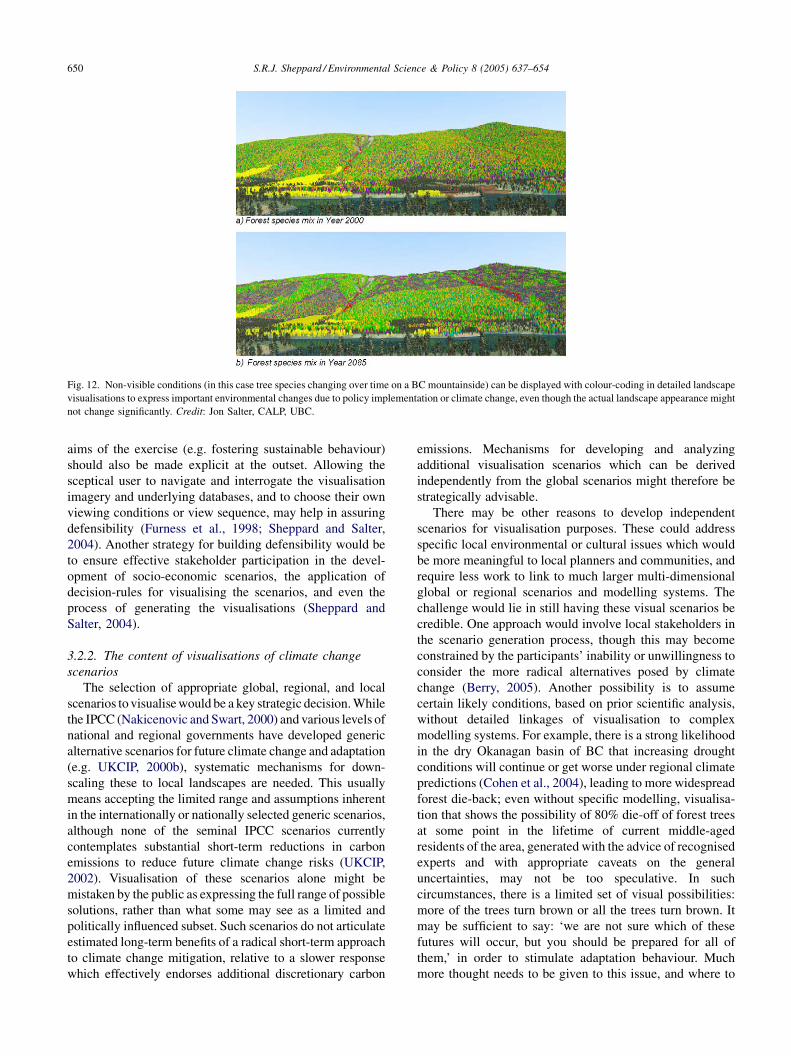
� P
resentation of non-visible conditions (in the visualisa-tion and with other media) to mediate and augment the
visible aspects of climate change, through a blend
(Fig. 12) of realism (in this case, individual trees on
the hillside) and abstraction (e.g. false colour).
� P
ermissible types of drama, including dramatic contentsuch as forest die-back or the effects of extreme storms,
dramatic viewing conditions such as animated ‘fly-bys’
and unusual lighting, or dramatic display formats such as
stereo vision, big screens, and panoramic angles of view.
One defensible policy on permissible drama would
perhaps be that a defined ‘reality’ remains the guide: for
example, animated large-screen panoramic imagery of a
future landscape may be both dramatic and legitimate if it
conveys the expected appearance at the actual image size
and angle of view with which it would be seen in the
neighbourhood, but not if it exaggerated the effects of
climate change, gave a magnified view of the landscape
features affected, or selectively left out key elements.
However, the type of decision or response required does
need to be taken into account, and cognitive awareness, as
suggested in Fig. 10, may require the very types of omission
or abstraction that could be misleading with the experiential
response. Ensuring that multiple media are used, retaining
the cognitive information along with the realistic experi-
ential media (e.g. 3D landscape models augmented with
draped polygons and labels) may reduce the risk, together
with disclosing anymanipulation of suppression of data. The
S.R.J. Sheppard / Environmental Science & Policy 8 (2005) 637–654650
Fig. 12. Non-visible conditions (in this case tree species changing over time on a BC mountainside) can be displayed with colour-coding in detailed landscape
visualisations to express important environmental changes due to policy implementation or climate change, even though the actual landscape appearance might
not change significantly. Credit: Jon Salter, CALP, UBC.
aims of the exercise (e.g. fostering sustainable behaviour)
should also be made explicit at the outset. Allowing the
sceptical user to navigate and interrogate the visualisation
imagery and underlying databases, and to choose their own
viewing conditions or view sequence, may help in assuring
defensibility (Furness et al., 1998; Sheppard and Salter,
2004). Another strategy for building defensibility would be
to ensure effective stakeholder participation in the devel-
opment of socio-economic scenarios, the application of
decision-rules for visualising the scenarios, and even the
process of generating the visualisations (Sheppard and
Salter, 2004).
3.2.2. The content of visualisations of climate change
scenarios
The selection of appropriate global, regional, and local
scenarios to visualisewould be a key strategic decision.While
the IPCC (Nakicenovic and Swart, 2000) and various levels of
national and regional governments have developed generic
alternative scenarios for future climate change and adaptation
(e.g. UKCIP, 2000b), systematic mechanisms for down-
scaling these to local landscapes are needed. This usually
means accepting the limited range and assumptions inherent
in the internationally or nationally selected generic scenarios,
although none of the seminal IPCC scenarios currently
contemplates substantial short-term reductions in carbon
emissions to reduce future climate change risks (UKCIP,
2002). Visualisation of these scenarios alone might be
mistaken by the public as expressing the full range of possible
solutions, rather than what some may see as a limited and
politically influenced subset. Such scenarios do not articulate
estimated long-term benefits of a radical short-term approach
to climate change mitigation, relative to a slower response
which effectively endorses additional discretionary carbon
emissions. Mechanisms for developing and analyzing
additional visualisation scenarios which can be derived
independently from the global scenarios might therefore be
strategically advisable.
There may be other reasons to develop independent
scenarios for visualisation purposes. These could address
specific local environmental or cultural issues which would
be more meaningful to local planners and communities, and
require less work to link to much larger multi-dimensional
global or regional scenarios and modelling systems. The
challenge would lie in still having these visual scenarios be
credible. One approach would involve local stakeholders in
the scenario generation process, though this may become
constrained by the participants’ inability or unwillingness to
consider the more radical alternatives posed by climate
change (Berry, 2005). Another possibility is to assume
certain likely conditions, based on prior scientific analysis,
without detailed linkages of visualisation to complex
modelling systems. For example, there is a strong likelihood
in the dry Okanagan basin of BC that increasing drought
conditions will continue or get worse under regional climate
predictions (Cohen et al., 2004), leading to more widespread
forest die-back; even without specific modelling, visualisa-
tion that shows the possibility of 80% die-off of forest trees
at some point in the lifetime of current middle-aged
residents of the area, generated with the advice of recognised
experts and with appropriate caveats on the general
uncertainties, may not be too speculative. In such
circumstances, there is a limited set of visual possibilities:
more of the trees turn brown or all the trees turn brown. It
may be sufficient to say: ‘we are not sure which of these
futures will occur, but you should be prepared for all of
them,’ in order to stimulate adaptation behaviour. Much
more thought needs to be given to this issue, and where to
S.R.J. Sheppard / Environmental Science & Policy 8 (2005) 637–654 651
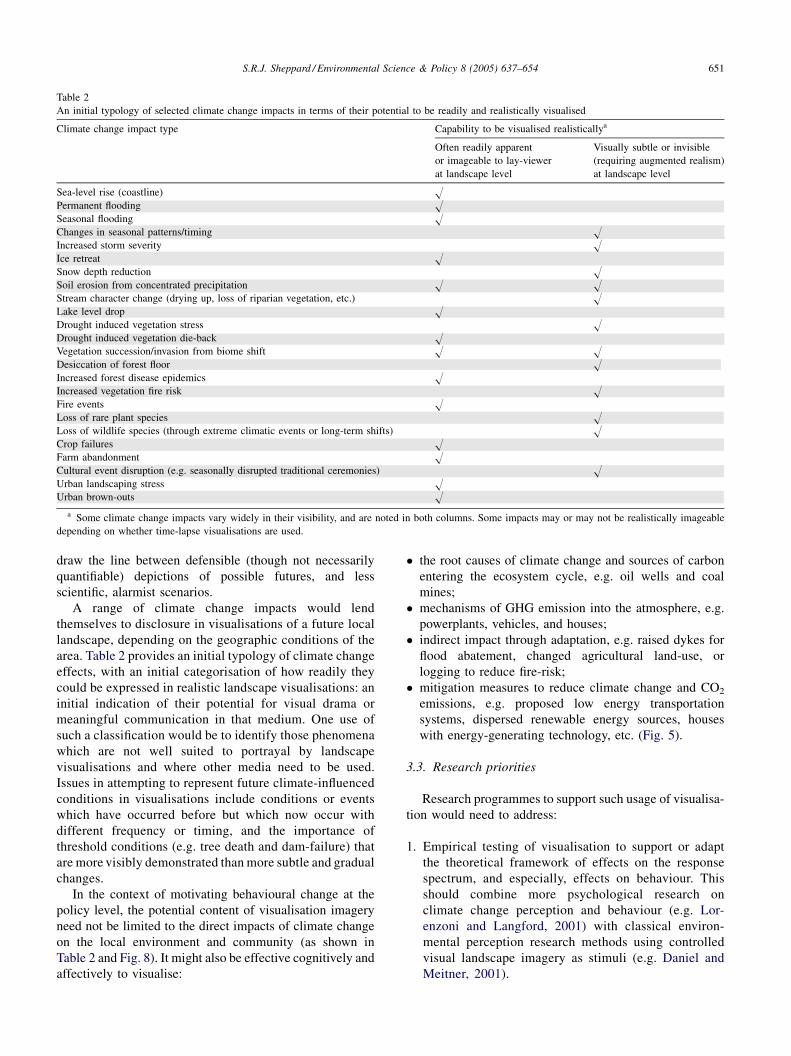
Table 2
An initial typology of selected climate change impacts in terms of their potential to be readily and realistically visualised
Climate change impact type Capability to be visualised realisticallya
Often readily apparent
or imageable to lay-viewer
at landscape level
Visually subtle or invisible
(requiring augmented realism)
at landscape level
Sea-level rise (coastline) HPermanent flooding HSeasonal flooding HChanges in seasonal patterns/timing HIncreased storm severity HIce retreat HSnow depth reduction HSoil erosion from concentrated precipitation H HStream character change (drying up, loss of riparian vegetation, etc.) HLake level drop HDrought induced vegetation stress HDrought induced vegetation die-back HVegetation succession/invasion from biome shift H HDesiccation of forest floor HIncreased forest disease epidemics HIncreased vegetation fire risk HFire events HLoss of rare plant species HLoss of wildlife species (through extreme climatic events or long-term shifts) HCrop failures HFarm abandonment HCultural event disruption (e.g. seasonally disrupted traditional ceremonies) HUrban landscaping stress HUrban brown-outs H
a Some climate change impacts vary widely in their visibility, and are noted in both columns. Some impacts may or may not be realistically imageable
depending on whether time-lapse visualisations are used.
draw the line between defensible (though not necessarily
quantifiable) depictions of possible futures, and less
scientific, alarmist scenarios.
A range of climate change impacts would lend
themselves to disclosure in visualisations of a future local
landscape, depending on the geographic conditions of the
area. Table 2 provides an initial typology of climate change
effects, with an initial categorisation of how readily they
could be expressed in realistic landscape visualisations: an
initial indication of their potential for visual drama or
meaningful communication in that medium. One use of
such a classification would be to identify those phenomena
which are not well suited to portrayal by landscape
visualisations and where other media need to be used.
Issues in attempting to represent future climate-influenced
conditions in visualisations include conditions or events
which have occurred before but which now occur with
different frequency or timing, and the importance of
threshold conditions (e.g. tree death and dam-failure) that
are more visibly demonstrated than more subtle and gradual
changes.
In the context of motivating behavioural change at the
policy level, the potential content of visualisation imagery
need not be limited to the direct impacts of climate change
on the local environment and community (as shown in
Table 2 and Fig. 8). It might also be effective cognitively and
affectively to visualise:
� t
he root causes of climate change and sources of carbonentering the ecosystem cycle, e.g. oil wells and coal
mines;
� m
echanisms of GHG emission into the atmosphere, e.g.powerplants, vehicles, and houses;
� i
ndirect impact through adaptation, e.g. raised dykes forflood abatement, changed agricultural land-use, or
logging to reduce fire-risk;
� m
itigation measures to reduce climate change and CO2emissions, e.g. proposed low energy transportation
systems, dispersed renewable energy sources, houses
with energy-generating technology, etc. (Fig. 5).
3.3. Research priorities
Research programmes to support such usage of visualisa-
tion would need to address:
1. E
mpirical testing of visualisation to support or adaptthe theoretical framework of effects on the response
spectrum, and especially, effects on behaviour. This
should combine more psychological research on
climate change perception and behaviour (e.g. Lor-
enzoni and Langford, 2001) with classical environ-
mental perception research methods using controlled
visual landscape imagery as stimuli (e.g. Daniel and
Meitner, 2001).
S.R.J. Sheppard / Environmental Science & Policy 8 (2005) 637–654652
2. E
xploration of ethical issues through policy debate andinitial case studies developed especially to illuminate
these difficult questions.
3. S
cientific monitoring of real-world projects or processesof long-term planning, resource modelling, and climate
change adaptation, where these address alternative
futures as mediated by landscape visualisation-based
tools or related visual imagery. This would track actual
consequences of the use of visualisations on learning and
behaviour.
Such a combined programmewould help to identify some
of the underlying triggers for attitudinal or behavioural
change on climate change policy and life-styles, as well as
risks and benefits of particular visualisation approaches. It
would also be instructive to evaluate the effect of
visualisations relative to other policy and communication
tools.
Visualisation research could be built into ongoing studies
focused on people’s reactions to possible climate change
strategies and mitigation approaches, e.g. alternative
technologies for house construction and energy sources
(Fawcett et al., 2002). With an appropriate research design,
landscape visualisations (e.g. Fig. 5) being used as
surrogates for real world conditions in determining
preferences or acceptability of possible climate change
strategies could provide additional research results on the
performance/effects of alternative visualisation methods.
Research programmes which are using landscape visualisa-
tion stimuli for perception research on planning issues could
also be retuned to address climate change issues.
4. Conclusions
There is an alarming gap between awareness and action on
climate change. Fawcett et al. (2002) admit that ‘‘Appropriate
policy on energy use and carbon emissions would only have a
small part to play in the social revolution which would be
needed to achieve voluntary acceptance of reduced con-
sumption levels’’ (p. 80). Emerging techniques of landscape
visualisation promise considerable improvements over other
media in communicating some climate change issues,
fostering social learning, and possibly in influencing popular
perceptions and behaviour on climate change. There is
considerable evidence of the effectiveness of visualisation as a
planning tool and its ability to enhance cognition, but less
research has taken place on responses to realistic landscape
visualisations, especially their behavioural impacts.However,
experience in practice suggests that landscape visualisations
can sometimes have substantial effects on policy, and there is
evidence with other visual media of behavioural effects
through engaging emotional responses.
New immersive and interactive systems offer attractive
possibilities for engagement, awareness building, and
reaching the emotions of the viewer; however, there are
ethical concerns including unrecognised bias in using such
tools. Despite these issues, the rhetoric of visualisation
(Luymes, 2001), applied deliberately and defensibly as a
persuasive force, may be vital in helping to accelerate social
learning, engage the emotions, influence individual beha-
viour, and project the rationale for policy change. The
hypothetical mechanism is realistically and dramatically to
bring home the impacts of future climate change scenarios to
people in their back yard or in other meaningful and iconic
landscapes: ‘making climate change personal.’
A theoretical framework is needed for examining
responses to visualisations of climate change, addressing
their ability to influence people’s hearts, minds, and
behaviour. One possible framework has been outlined in
this paper. However, even if the theorised effects of
visualisation on behaviour are not established and the
framework presented here is not borne out, there may be
advantages in using visualisation to stimulate awareness and
deliberative discourse. We should test carefully every
potentially powerful weapon in the fight against climate
change, especially those which promise rapid results.
Visualisation tools are potentially too powerful either to
be ignored or used without careful consideration. The hope
is that the dilemmas of whether and how to use visualisations
proactively as agents of learning and behavioural change,
can be resolved through development of ethical standards
incorporating the ‘3 Ds’ of visualising climate change:
disclosure, drama, and defensibility.
Acknowledgments
I would like to acknowledge the initial inspiration for this
paper and the subsequent review from Dr. David Little of
Arthur D. Little Limited. Dr. Russ Parsons also provided
helpful comments on early drafts. I would like to thank
Green College and the Environmental Change Institute at
Oxford University, and members of The Zuckerman Institute
for Connective Environmental Research (ZICER) at Uni-
versity of East Anglia, for providing venues and/or vital
information contributing to the development of this paper.
Thanks also to Cecilia Achiam for her graphics and
guidance, and to the many CALP members who have
supported me. The preparation of the manuscript was
supported in part by sabbatical funding from the Sustainable
Forest Management Network, Canada.
References
Adger, W.N., 2003. Social capital, collective action, and adaptation to
climate change. Econ. Geogr. 79 (4), 387–404.
Al-Kodmany, K., 2000. GIS in the urban landscape: reconfiguring neigh-
bourhood planning and design processes. Landsc. Res. 25 (1), 5–28.
Appleton, K., Lovett, A., Sunnenberg, G., Dockerty, T., 2002. Rural land-
scape visualisation from GIS databases: a comparison of approaches,
options, and problems. Comput. Environ. Urban Syst. 26, 201–211.

S.R.J. Sheppard / Environmental Science & Policy 8 (2005) 637–654 653
Appleton, K., Lovett, A., 2003. GIS-based visualisation of rural landscapes:
defining ‘sufficient’ realism for environmental decision-making.
Landsc. Urban Plann. 65, 117–131.
Appleyard, D., 1977. Understanding professional media: issues, theory, and a
research agenda. In: Altman, I., Wohlwill, J.F. (Eds.), Human Behavior
and Environment, vol. 1. Plenum Press, New York, NY, pp. 43–88.
Bengtsson, P., Johansson, C.R., Akselsson, K.R., 1997. Planning working
environment and production by using paper drawings and computer
animation. Ergonomics 40, 334–347.
Berry, P.M., 2005. Personal communication.
Berry, P.M., Dawson, T.P., Harrison, P.A., Pearson, R.G., 2002. Modelling
potential impacts of climate change on the bioclimatic envelope of
species in Britain and Ireland. Global Ecol. Biogeogr. 11 (6), 453–462.
Bishop, I.D., Rohrmann, B., 2003. Subjective responses to simulated and
real environments: a comparison. Landsc. Urban Plann. 65, 261–277.
Bishop, I.D., Ye, W.S., Karadaglis, C., 2001. Experiential approaches to
perception response in virtual worlds. Landsc. Urban Plann. 54, 115–
123.
Boardman, B., Palmer, J., 2003. 4CE—Consumer Choice and Carbon
Consciousness: Electricity Disclosure in Europe. 4CE Final Report.
Environmental Change Institute, Oxford, UK, 81 pp.
Bosselmann, P., 1998. Representation of Places: Reality and Realism in City
Design. University of California Press, Berkeley, CA.
Bosselmann, P., Craik, K.H., 1987. Perceptual simulations of environments.
In: Bechtel, R.B., Marcus, R.W., Michelson, W. (Eds.), Methods in
Environmental and Behaviour Research. Van Nostrand Reinhold, New
York, NY (Chapter 5).
Campbell, D.C., Salter, J., 2004. The Digital Workshop: Exploring the
Effectiveness of Interactive Visualisations and Real-Time Data Analysis
in Enhancing Participation in Planning Processes. Report Submitted to
Forestry Innovation Investment Forestry Research Programme, Deliver-
able #5. Collaborative for Advanced Landscape Planning, UBC, Van-
couver, BC, 32 pp.
Cohen, S.J., 1997. Scientist–stakeholder collaboration in integrated assess-
ment of climate change: lessons from a case study of Northwest Canada.
Environ. Model. Assess. 2, 281–293.
Cohen, S.J., Nielsen, D., Welbourn, R. (Eds.), 2004. Expanding the Dia-
logue on Climate Change and Water Management in the Okanagan
Basin, BC. Final Report, Environment Canada, Agriculture and Agri-
Food Canada and University of British Columbia. Project A463/433.
Submitted to the Adaptation Liaison Office, Climate Change Impacts
and Adaptation Directorate, Natural Resources Canada, Ottawa, 300 pp.
Cox, D.J., 1990. The art of scientific visualization. Acad. Comput. 46, 20–
56.
Danahy, J.W., 2001. Technology for dynamic viewing and peripheral vision
in landscape visualization. Landsc. Urban Plann. 54, 125–137.
Daniel, T.C., Meitner, M.J., 2001. Representational validity of landscape
visualizations: the effect of graphical realism on perceived scenic beauty
of forest vistas. J. Environ. Psychol. 21 (1), 61–72.
Dockerty, T., Lovett, A., Sunnenberg, G., Appleton, K., Parry, M., 2005.
Visualising the potential impacts of climate change on rural landscapes.
Comput. Environ. Urban Syst. 29 (3), 297–320.
Dykes, J., 2000. An approach to virtual environments for visualization using
linked geo-referenced panoramic imagery. Comput. Environ. Urban
Syst. 24, 127–152.
Ervin, S.M., Hasbrouck, H.H., 2001. Landscape Modeling: Digital Tech-
niques for Landscape Visualization. McGraw-Hill, New York, NY.
Fawcett, T., Hurst, A., Boardman, B., 2002. Carbon UK. Industrial Sustain-
able Development Group, Environmental Change Institute, University
of Oxford, Oxford, UK, 65 pp.
Furness III, T.A., Winn, W., Yu, R., 1998. The impact of three dimensional
immersive virtual environments on modern pedagogy: global change,
VR and learning. In: Proceedings of Workshops in Seattle, Washington,
and Loughborough, England in May and June 1997. Human Interface
Technology Lab, University of Washington, Seattle, WA available
online at http://www.hitl.washington.edu/publications/r-97-32/, rtf file
accessed June 1, 2004.
IPCC (Intergovernmental Panel on Climate Change), 2001. Climate Change
2001: Impacts, Adaptation and Vulnerability. Summary for Policy-
makers. World Meteorological Organisation, Geneva.
Kaplan, R., Herbert, E.J., 1988. Familiarity and preference: a cross-cultural
analysis. In: Nasar, J.L. (Ed.), Environmental Aesthetics: Theory,
Research, and Applications. Cambridge University Press, New York,
NY, pp. 379–389.
Keeney, R.L., McDaniels, T.L., 2001. A framework to guide thinking about
climate change policies. Risk Anal. 21 (6), 989–1000.
Kollmuss, A., Agyeman, J., 2002. Mind the gap: why do people act
environmentally and what are the barriers to pro-environment
behaviour? Environ. Educ. Res. 8 (3), 239–260.
Lange, E., 2001. The limits of realism: perceptions of virtual landscapes.
Landsc. Urban Plann. 54, 163–182.
Lewis, J.L., 2000. Ancient values, new technology: emerging methods for
integrating cultural values in forest management. Unpublished M.Sc.
Thesis. Faculty of Forestry, UBC, Vancouver, BC.
Lewis, J.L., Sheppard, S.R.J. Culture and communication: can landscape
visualisation improve forest management consultation with indigenous
communities? Landsc. Urban Plann., in press.
Lorenzoni, I., Langford, I.H., 2001. Climate change now and in the future: a
mixed methodological study of public perceptions in Norwich (UK).
CSERGE Working Paper ECM 01-05. CSERGE, Norwich, UK.
Lowe, T., Brown, K., Dessai, S., de Franca Doria, M., Haynes, K., Vincent,
K.,March 2005. Does tomorrow ever come?Disaster narrative and public
perceptions of climate change. Tyndall Centre for Climate Change
Research Working Paper 72. University of East Anglia, Norwich.
Luymes, D., 2001. The Rhetoric of Visual Simulation in Forest Design:
Some Research Directions. International Union of Forest Research
Organizations (IUFRO) Research Series. CABI International, Wall-
ingford, UK, pp. 191–204 (Chapter 13).
Lynas, M., 2004. High Tide: News from a Warming World. Flamingo,
Oxford, UK.
MacEachren, A.M., 2001. Cartography and GIS: extending collaborative
tools to support virtual teams. Prog. Hum. Geogr. 25 (3), 431–444.
MacEachren, A.M., Ganter, J.H., 1990. A pattern identification approach to
cartographic visualization. Cartographica 27 (2), 64–81.
Maiteny, P.T., 2002. Mind in the gap: summary of research exploring ‘inner’
influences on pro-sustainability learning and behaviour. Environ. Educ.
Res. 8 (3), 299–306.
McKenzie-Mohr, D., Smith, W., 1999. Fostering Sustainable Behavior: An
Introduction to Community-Based Social Marketing. New Society
Publishers, Gabriola Island, Canada.
McQuillan, A.G., 1998. Honesty and foresight in computer visualizations. J.
Forestry 96 (6), 15–16.
Meitner, M., Daniel, T., 1997. The effects of animation and interactivity on
the validity of human responses to forest data visualizations. In: Orland,
B. (Ed.), Proceedings of Data Visualization’97, St. Louis, MO.
Michaelis, L., 2003. Sustainable consumption and greenhouse gas mitiga-
tion. Climate Policy 3S1, S135–S146.
Monbiot, G., 2004. Beware the fossil fools. In: The Guardian, Tuesday,
April 27, accessed June 8, http://www.guardian.co.uk/comment/story/
0,3604,1204194,00.html.
Nakicenovic, N., Swart, R. (Eds.), 2000. Emissions Scenarios 2000: Special
Report of the Intergovernmental Panel on Climate Change. Cambridge
University Press, Cambridge, UK.
Nicholson-Cole, S.A., 2005. Representing climate change futures: a critique
on the use of images for visual communication. Comput. Environ. Urban
Syst. 29 (3), 255–273.
Orford, S., Harris, R., Dorling, D., 1999. Geography: information visualisa-
tion in the social sciences. Soc. Sci. Comput. Rev. 17 (3), 289–304.
Orland, B., 1992. Evaluating regional changes on the basis of local
expectations: a visualisation dilemma. Landsc. Urban Plann. 21,
257–259.
Orland, B., Budthimedhee, K., Uusitalo, J., 2001. Considering virtual
worlds as representations of landscape realities and as tools for land-
scape planning. Landsc. Urban Plann. 54 (1–4), 139–148.

S.R.J. Sheppard / Environmental Science & Policy 8 (2005) 637–654654
Orland, B., Uusitalo, J., 2001. Immersion in a virtual forest: some implica-
tions. In: Sheppard, S.R.J., Harshaw, H.W. (Eds.), Forests and Land-
scapes: Linking Sustainability, Ecology, and Aesthetics. International
Union of Forest Research Organizations (IUFRO) Research Series.-
CABI International, Wallingford, UK, (Chapter 14), pp. 205–224.
Pearce, D.W., Cline, W.R., Achanta, A.N., Frankenhauser, S., Pachauri,
R.K., Tol, R.S., Vellinga, P., 1996. The social costs of climate change:
greenhouse damage and the benefits of control. In: Bruce, J.P., Lee, H.,
Haites, E.F. (Eds.), Climate Change 1995: Economic and Social
Dimensions of Climate Change. Cambridge University Press, Cam-
bridge, UK.
Porter, T., 1979. How Architects Visualize. Van Nostrand Reinhold, New
York, NY.
Ribe, R., 2005. Aesthetic perceptions of green-tree retention harvests in
vista views: The interaction of cut level, retention pattern and harvest
shape. Landsc. Urban Plann. 73 (4), 277–293.
Salter, J.D., 2005. Designing and testing a prototypical landscape informa-
tion interface for lay-people. Unpublished Masters Thesis. Faculty of
Forestry, University of British Columbia, Vancouver.
Schroth, O., Lange, E., Schmid, W.A., 2005. From information to participa-
tion: applying interactive features in landscape visualizations. Paper
presented at Our Shared Landscape Conference, Ascona, Switzerland,
May 2–6.
Sheppard, S.R.J., 1989. Visual Simulation: A User’s Guide for Architects,
Engineers, and Planners. Van Nostrand Reinhold, New York.
Sheppard, S.R.J., 2001. Guidance for crystal ball gazers: developing a code
of ethics for landscape visualization. Landsc. Urban Plann. 54 (1–4),
183–199.
Sheppard, S.R.J., 2004. Making Unsustainability Obvious to the Public.
Green College Environmental Seminar Presentation, Oxford, 4 Febru-
ary.
Sheppard, S.R.J., 2005. Validity, reliability, and ethics in visualization. In:
Bishop, I., Lange, E. (Eds.), Visualization in Landscape and Environ-
mental Planning. Taylor and Francis, London, (Chapter 5), pp. 79–97.
Sheppard, S.R.J., Cavens, D., Salter, J., Meitner, M., 2001. Seeing the big
picture: the benefits of digital landscape immersion. In: Proceedings of
the LANDTECH ASLA/CSLA Annual Meeting, 24 September 2001,
Montreal, Canada. (CD-ROM).
Sheppard, S.R.J., Meitner, M.J., 2005. Using multi-criteria analysis and
visualisation for sustainable forest management planning with stake-
holder groups. Forest Ecol. Manage. 207 (1–2), 171–187.
Sheppard, S.R.J., Salter, J., 2004. The role of visualization in forest
planning. In: Encyclopedia of Forest Sciences, Academic Press/Else-
vier, Oxford, UK, pp. 486–498.
Slovic, P., Finucane, M., Peters, E., MacGregor, D.G., 2002. The affect
heuristic. In: Gilovich, T., Griffin, D., Kahneman, D. (Eds.), Heuristics
and Biases: The Psychology of Intuitive Judgement. Cambridge Uni-
versity Press, New York, NY, (Chapter 23), pp. 397–420.
Steinitz, C., Rojo, H.M.A., Bassett, S., Flaxman, M., Goode, T., Maddock
III, T., Mouat, D., Peiser, R., Shearer, A., 2003. Alternative Futures for
Changing Landscapes: The Upper San Pedro River Basin in Arizona and
Sonora. Island Press, Washington, DC.
Stern, P.C., 2000. Toward a coherent theory of environmentally significant
behaviour. J. Soc. Issues 56 (3), 407–424.
Tickell, C., 2002. Communicating climate change. Science 297, 737
(Editorial).
Tress, B., Tress, G., 2002. Scenario visualisation for participatory landscape
planning: a study from Denmark. Landsc. Urban Plann. 982, 1–18.
Tufte, E.R., 1990. Envisioning Information. Graphics Press, Cheshire, CT.
UKCIP (Climate Impacts Programme), Mackenzie Hedger, M., Gawith,
M., Brown, I., Connell, R., Downing, T.E. (Eds.), 2000a. Climate
Change: Assessing the Impacts—Identifying Responses: The First 3
Years of the UK Climate Impacts Programme. UKCIP, Oxford, UK, 123
pp.
UKCIP (Climate Impacts Programme), 2000b. Socio-Economic Scenarios
for Climate Change Impact Assessment: AGuide to their Use in the UK
Climate Impacts Programme. UKCIP, Oxford, UK, 123 pp.
UKCIP (Climate Impacts Programme), 2002. Climate Change Scenarios for
the United Kingdom: The UKCIP02 Scientific Report. UKCIP, Oxford,
UK, 112 pp.
Webster, M., 2003. Communicating climate change uncertainty to policy-
makers and the public: and editorial comment. Climatic Change 61, 1–8.
Winn, W., 1997. The Impact of Three-Dimensional Immersive Virtual
Environments on Modern Pedagogy. HITL Technical Report R-97-
15. Human Interface Technology Laboratory, University ofWashington,
Seattle, WA.
Zajonc, R.B., 1984. On the primacy of affect. Am. Psychol. 39 (2), 117–123.
Zube, E.H., Sell, J.L., Taylor, J.G., 1982. Landscape perception: research,
application, and theory. Landsc. Plann. 9, 1–33.
Stephen Sheppard teaches in sustainable landscape planning, aesthetics,
and visualisation in the Faculty of Forestry and Landscape Architecture
programme at the University of British Columbia. He received a BA/MA in
agricultural and forest sciences at Oxford, an MSc in forestry at UBC, and a
PhD in environmental planning at UC, Berkeley. He directs the Collabora-
tive for Advanced Landscape Planning (CALP), an interdisciplinary
research group using perception-testing and immersive/interactive visuali-
sation to support public awareness and collaborative planning on sustain-
ability issues. He has over 25 years’ experience in environmental
assessment and public participation internationally. He has written or co-
written two books on visual simulation, and co-edited ‘‘Forests and Land-
scapes: Linking Ecology, Sustainability, and Aesthetics,’’ vol. 6, in the
IUFRO Research Series. He is currently contributing to the BC chapter of
Canada’s National Assessment of climate change impacts and adaptation.
Current research interests lie in perceptions of climate change, the
aesthetics of sustainability, and visualisation theory and ethics.