landscape management research conference and...
TRANSCRIPT

TURFGRASS RESEARCH CONFERENCE AND FIELD DAY
September 15, 1998
LANDSCAPE MANAGEMENT RESEARCH CONFERENCE
AND FIELD DAY September 16, 1998
University of California, Riverside Cooperative Extension
Dept. of Botany and Plant Sciences Agricultural Operations
&
TURFGRASS RESEARCH CONFERENCE AND FIELD DAY
TUESDAY, SEPTEMBER 15, 1998
i
TURFGRASS RESEARCH CONFERENCE AND FIELD DAY TUESDAY, SEPTEMBER 15, 1998
TABLE OF CONTENTS AND CONFERENCE SCHEDULE
8:00 a.m. Registration 8:50 Welcome and Announcements Victor Gibeault 9:00 Best Management Practices for Tall Fescue Irrigation and Nutrition in
Southern California ......................................................................... 1 William Richie 9:20 Bentgrass Variety Trials at Three Southern California Locations ............ 5 Janet Hartin 9:40 What Happened to the Grass in the Retractable Roof Stadium? ............ 10 Stephen Cockerham 10:00 Fate of Pesticides in Turf ................................................................ 11 Marylynn Yates 10:20 BREAK 11:00 Maintaining Putting Green Soil Aeration and Leaching Capability Dur-
ing the Summer ............................................................................. 12 Robert Green 11:20 Unraveling the Secret Life of the Sting Nematode ............................... 15 Ole Becker 11:40 Sustainable Turfgrass Selection and Culture ...................................... 16 Victor Gibeault 12 noon LUNCH 12:45 p.m. Drive Your Own Car to Agricultural Experiment Station 1:30 Organizational Comments Stop #1 Tall Fescue Irrigation and Nutrition Field Study ................................... 29 Grant Klein Stop #2 Sports Turf Under Limited Light ....................................................... 34 Steve Ries Stop #3 Irrigation Management for Mixed Landscapes .................................... 35 Dennis Pittenger Stop #4 Influence of Season on the Success of Zoysiagrass Stolonization ......... 38 George Riechers Stop #5 Kyllinga Identification and Management ............................................ 39 David Cudney Stop #6 Effects of Organic Matter Topdressing on Kentucky Bluegrass ............. 42 Marcella Grebus
1
BEST MANAGEMENT PRACTICES FOR TALL FESCUE IRRIGATION AND NUTRITION IN SOUTHERN CALIFORNIA
William E. Richie1, Grant J. Klein1, Janet S. Hartin2, Victor A. Gibeault1, and Robert L. Green1
1Dept. of Botany and Plant Sciences, University of California, Riverside, CA 92521-0124 2University of California Cooperative Extension, San Bernardino and Los Angeles Counties
777 E. Rialto Avenue, San Bernardino, CA 92415
Urban landscapes, including areas planted with turfgrass, offer numerous functional, recrea-tional, and aesthetic benefits. Several functional benefits include excellent soil erosion and dust stabilization; improved recharge and quality protection of groundwater; enhanced entrap-ment and biodegradation of synthetic organic compounds; heat dissipation and temperature modification; reduced noise, glare, and visual pollution problems; and lowered fire hazard via open green-turfed firebreaks (Beard and Green, 1994). The estimated $2,184,000,000 spent annually on turfgrass maintenance in California also is a significant benefit to the state’s econ-omy. This estimate is based on a published figure for 1982 (Cockerham and Gibeault, 1985) and corrected for inflation (multiplier=1.54) and for population increase (multiplier=1.34). Although the establishment and maintenance of quality, functional turfgrass is justifiable, de-veloping and implementing best management practices (BMPs) also is important for the respon-sible use and protection of natural resources. Currently, there is considerable interest in developing and implementing turfgrass BMPs for ad-dressing 1) water conservation, 2) the potential contamination of runoff water and groundwa-ter with applied nutrients, especially NO3-N, and pesticides, 3) the potential contamination of surface water with sediment and nutrients during turfgrass construction, 4) the potential devel-opment of pest populations with increasing resistance to chemical control, 5) the potentially negative impacts of chemical management on beneficial soil and nontarget organisms, 6) the potentially toxic effects of applied chemicals to nontarget plants and animals, 7) the potential loss or degradation of native habitat during construction and turfgrass maintenance, and 8) the amount of landscape waste, including grass clippings, that is dumped in landfills (Balogh et al., 1992). Considering the number of issues listed above, there are probably numerous research and edu-cation opportunities for developing and implementing turfgrass BMPs in California. Though each environmental issue is individually important for turfgrass management, the use (conser-vation) of irrigation water on urban landscapes, including turfgrass, is the most general driving force in California. Considering this point, coupled with the interest of CDFA/FREP in the im-provement of crop-water management and fertilizer-use efficiency, we developed a research and education project concerning the BMPs for efficient use of irrigation water and N fertility on tall fescue, currently the most widely planted turfgrass species in California. Our rationale in developing the specific protocols of the project are founded on three assumptions listed be-low: 1. Future landscape water-use budgets will not exceed 100% of reference evapotranspiration
(ETo) per square foot of landscape area (CUWCC, 1998).
This research is funded in part by the 1) State of California, Department of Food and Agriculture, Fertilizer Research and Education Program, and 2) The Metropolitan Water District of Southern California.
Proceedings of the UCR Turfgrass and Landscape Management Research Conference and Field Day, September 1998

2
2. Fertilization of turfgrasses, according to established cultural strategies, presents a negligible potential for nutrient elements to pass through the root zone into the groundwater or be transported by runoff water into surface waters. This has been confirmed by a number of studies or reviews (Beard and Green, 1994; Cohen et al., 1990; Geron et al., 1993; Gold et al., 1990; Gross et al., 1990; Harrison et al., 1993; Miltner et al., 1996; Morton et al., 1988; Petrovic, 1990; Watschke and Mumma, 1989). However, turfgrass managers will need to give special attention to fertilization practices when 1) there is a potential for heavy rainfall, 2) the turfgrass is immature and the soil is disturbed, such as during establishment, and 3) root absorption of nutrients is low because of dormancy or stress.
3. Although excessive application rates of water-soluble N fertilizers on turfgrass followed by
over-watering on sandy soils has been shown to cause NO3-N leaching (Brown et al., 1982; Snyder et al., 1984), this situation would be less likely to occur during the implementation of annual landscape water-use budgets at 80% to 100% ETo.
In light of these assumptions regarding the management of tall fescue, we believe that the most pertinent crop-water management/N-fertility use efficiency project would involve the de-velopment of a balanced irrigation and N-fertility program which takes into consideration both the forthcoming limitations on landscape water-use budgets and optimal annual N rates for tall fescue performance in terms of visual turfgrass quality and drought stress tolerance, growth (clipping yields), and N uptake. Previous research on tall fescue, maintained in the southern inland valley weather conditions of Riverside, showed that an irrigation amount of not less than 85% ETo would be required to maintain minimally acceptable visual turfgrass quality during the warm season (Gibeault et al., 1996). Actually, even more irrigation water would be required by typical inland tall fescue landscapes because a higher visual quality may be desired, and the irrigation distribution uni-formity of the research plots is probably 20% higher than that of most landscape irrigation sys-tems. It should be noted that a substantial amount of landscape irrigation water is used by in-land locations. Thus, there is a need to test irrigating tall fescue at a defined annual amount (80% historical ETo plus rain) with increased irrigation during the warm season to improve grass performance, and then proportionally adjusting the cool-season irrigation amount downward to make up for the addition of warm-season irrigation. Secondly, there is a need to test annual N-fertility levels in conjunction with water conserva-tion. Previous research on turfgrass has shown a significant influence of the annual N-fertility level on water use and drought stress tolerance (Carroll, 1943; Feldhake et al., 1983; Krog-man, 1967; Mantell, 1966; Sills and Carrow, 1983; Schmidt and Breuninger, 1981). Annual N-fertility levels that are either too low or too high significantly reduce turfgrass drought stress tolerance and therefore are not efficient. Seasonal timing and rate of N-fertilizer applications also can significantly influence the degree of turfgrass drought stress tolerance. Generally, slow-to-moderate growth 4 to 6 weeks prior to drought conditions is required to develop improved drought stress tolerance. The utilization of a higher proportion of slow-release N-fertilizer sources and the application of lower amounts of N per application can facilitate slower growth and result in a higher degree of turfgrass drought stress tolerance. Although this discussion is centered on N, a proper balance of all plant nutrients is required.
Proceedings of the UCR Turfgrass and Landscape Management Research Conference and Field Day, September 1998
3
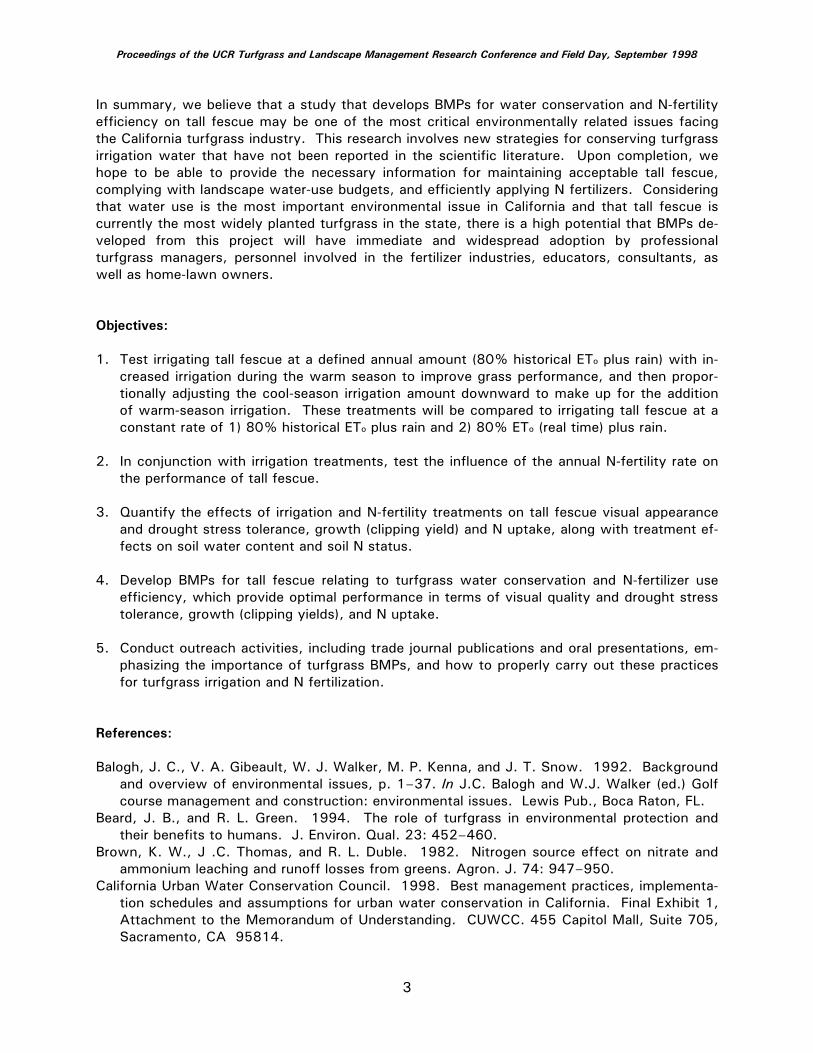
In summary, we believe that a study that develops BMPs for water conservation and N-fertility efficiency on tall fescue may be one of the most critical environmentally related issues facing the California turfgrass industry. This research involves new strategies for conserving turfgrass irrigation water that have not been reported in the scientific literature. Upon completion, we hope to be able to provide the necessary information for maintaining acceptable tall fescue, complying with landscape water-use budgets, and efficiently applying N fertilizers. Considering that water use is the most important environmental issue in California and that tall fescue is currently the most widely planted turfgrass in the state, there is a high potential that BMPs de-veloped from this project will have immediate and widespread adoption by professional turfgrass managers, personnel involved in the fertilizer industries, educators, consultants, as well as home-lawn owners. Objectives: 1. Test irrigating tall fescue at a defined annual amount (80% historical ETo plus rain) with in-
creased irrigation during the warm season to improve grass performance, and then propor-tionally adjusting the cool-season irrigation amount downward to make up for the addition of warm-season irrigation. These treatments will be compared to irrigating tall fescue at a constant rate of 1) 80% historical ETo plus rain and 2) 80% ETo (real time) plus rain.
2. In conjunction with irrigation treatments, test the influence of the annual N-fertility rate on
the performance of tall fescue. 3. Quantify the effects of irrigation and N-fertility treatments on tall fescue visual appearance
and drought stress tolerance, growth (clipping yield) and N uptake, along with treatment ef-fects on soil water content and soil N status.
4. Develop BMPs for tall fescue relating to turfgrass water conservation and N-fertilizer use
efficiency, which provide optimal performance in terms of visual quality and drought stress tolerance, growth (clipping yields), and N uptake.
5. Conduct outreach activities, including trade journal publications and oral presentations, em-
phasizing the importance of turfgrass BMPs, and how to properly carry out these practices for turfgrass irrigation and N fertilization.
References: Balogh, J. C., V. A. Gibeault, W. J. Walker, M. P. Kenna, and J. T. Snow. 1992. Background
and overview of environmental issues, p. 1–37. In J.C. Balogh and W.J. Walker (ed.) Golf course management and construction: environmental issues. Lewis Pub., Boca Raton, FL.
Beard, J. B., and R. L. Green. 1994. The role of turfgrass in environmental protection and their benefits to humans. J. Environ. Qual. 23: 452–460.
Brown, K. W., J .C. Thomas, and R. L. Duble. 1982. Nitrogen source effect on nitrate and ammonium leaching and runoff losses from greens. Agron. J. 74: 947–950.
California Urban Water Conservation Council. 1998. Best management practices, implementa-tion schedules and assumptions for urban water conservation in California. Final Exhibit 1, Attachment to the Memorandum of Understanding. CUWCC. 455 Capitol Mall, Suite 705, Sacramento, CA 95814.
Proceedings of the UCR Turfgrass and Landscape Management Research Conference and Field Day, September 1998

4
Carroll, J. C. 1943. Effects of drought, temperature and nitrogen on turfgrass. Plant Physiol. 18: 19–36.
Cockerham, S. T., and V. A. Gibeault. 1985. The size, scope, and importance of the turfgrass industry, p. 7–12. In V. A. Gibeault and S.T. Cockerham (ed.) Turfgrass water conserva-tion. Univ. of California, Div. of Agric. and Natural Resources, Publ. No. 21405, Riverside, CA.
Cohen, S. Z., S. Nickerson, R. Maxey, A. Dupuy, Jr., and J. A. Senita. 1990. A groundwater monitoring study for pesticides and nitrates associated with golf courses on Cape Cod. Groundwater Monit. Rev. (Winter): 160–173.
Feldhake, C. M., R. F. Danielson, and J. D. Butler. 1983. Turfgrass evapotranspiration. I. Fac-tors influencing rate in urban environments. Agron. J. 75: 824–830.
Geron, C. A., T. K. Danneberger, S. J. Traina, T. J. Logan, and J. R. Street. 1993. The ef-fects of establishment methods and fertilization practices on nitrate leaching from turfgrass. J. Environ. Qual. 22: 119–125.
Gibeault, V. A., R. L. Green, D. R. Pittenger, and W. E. Richie. 1996. Third-year progress re-port: participation in a turf, shrub, and groundcover landscape water conservation research study. Progress report to the Metropolitan Water District of Southern California, December 1996. Univ. of California, Riverside, CA.
Gold, A. J., W. R. De Ragon, W. M. Sullivan, and J.L. Lemunyon. 1990. Nitrate-nitrogen losses to groundwater from rural and suburban land uses. J. Soil Water Conserv. 45: 305–310.
Gross, C. M., J. S. Angle, R. L. Hill, and M. S. Welterlen. 1991. Runoff and sediment losses from tall fescue under simulated rainfall. J. Environ. Qual. 20: 604–607.
Harrison, S. A., T. J. Watschke, R. O. Mumma, A. R. Jarrett, and G. W. Hamilton. 1993. Nu-trient and pesticide concentrations in water from chemically treated turfgrass, p. 191–207. In K.D. Racke and A.R. Leslie (ed.) Pesticides in urban environments: fate and significance. ACS Symp. Ser. 522.
Krogman, K. K. 1967. Evapotranspiration by irrigated grass as related to fertilizer. Can. J. Plant Sci. 47: 281–287.
Mantell, A. 1966. Effect of irrigation frequency and nitrogen fertilization on growth and water use of a kikuyugrass lawn (Pennisetum clandestinum Hochst). Agron. J. 58: 559–561.
Miltner, E. B., B. E. Branham, E. A. Paul, and P. E. Rieke. 1996. Leaching and mass balance of 15N-labeled urea applied to a Kentucky bluegrass turf. Crop Sci. 36: 1427–1433.
Morton, T. G., A. J. Gold, and W. M. Sullivan. 1988. Influence of overwatering and fertiliza-tion on nitrogen loss from home lawns. J. Environ. Qual. 17: 124–130.
Petrovic, A.M. 1990. The fate of nitrogenous fertilizers applied to turfgrass. J. Environ. Qual. 19: 1–14.
Schmidt, R. E., and J. M. Breuninger. 1981. The effects of fertilization on recovery of Ken-tucky bluegrass turf from summer droughts, p. 333–340. In R.W. Sheard (ed.) Proc. 4th Int. Turfgrass Res. Conf. Guelph, July 1981, Univ. of Guelph, Guelph, ON, Canada.
Sills, M. J., and R. N. Carrow. 1983. Turfgrass growth, N use, and water use under soil com-paction and N fertilization. Agron. J. 75: 488–492.
Synder, G. H., B. J. Augustin, and J. M. Davidson. 1984. Moisture sensor controlled irrigation for reducing N leaching in bermudagrass turf. Agron. J. 76: 964–969.
Watschke, T. L., and R. O. Mumma. 1989. The effect of nutrients and pesticides applied to turf on the quality of runoff and percolating water. Pennsylvania State Univ. Environ. Re-sources Res. Inst. ER 8904, University Park, PA.
Proceedings of the UCR Turfgrass and Landscape Management Research Conference and Field Day, September 1998
5
BENTGRASS VARIETY TRIALS AT THREE SOUTHERN CALIFORNIA LOCATIONS Robert L. Green1, Grant J. Klein1, Jess Evans1, Janet S. Hartin2, J. Michael Henry3, David
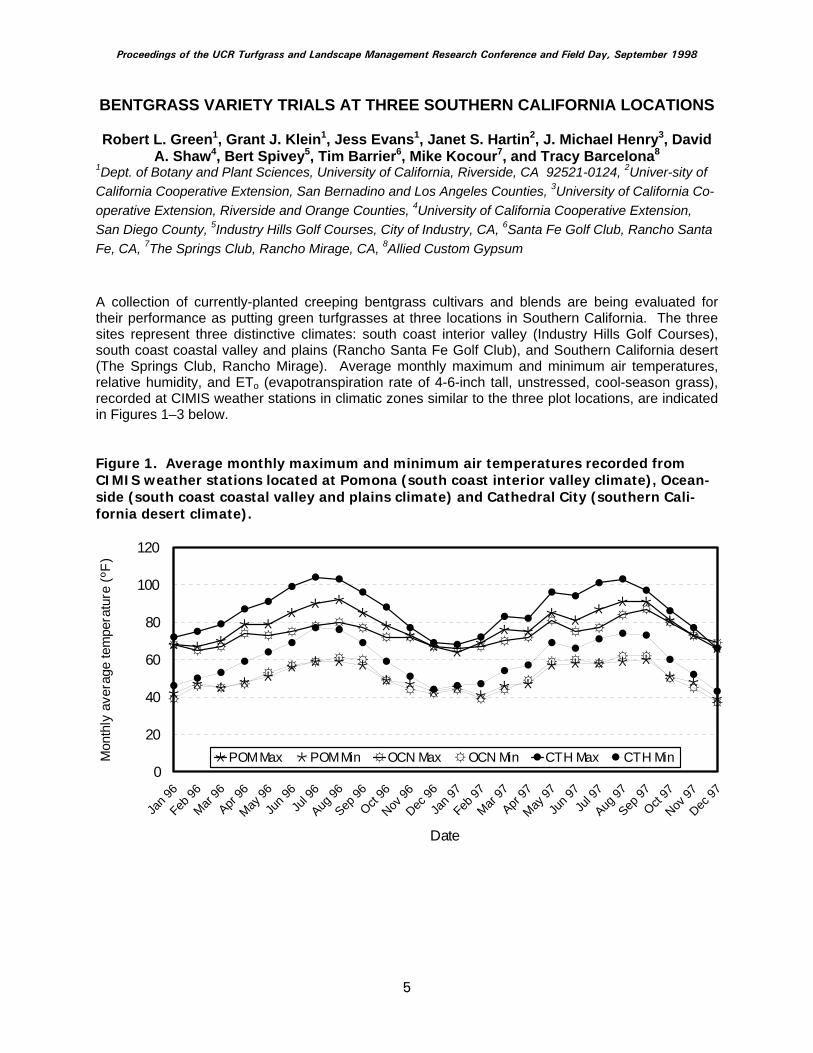
A. Shaw4, Bert Spivey5, Tim Barrier6, Mike Kocour7, and Tracy Barcelona8 1Dept. of Botany and Plant Sciences, University of California, Riverside, CA 92521-0124, 2Univer-sity of California Cooperative Extension, San Bernadino and Los Angeles Counties, 3University of California Co-operative Extension, Riverside and Orange Counties, 4University of California Cooperative Extension, San Diego County, 5Industry Hills Golf Courses, City of Industry, CA, 6Santa Fe Golf Club, Rancho Santa Fe, CA, 7The Springs Club, Rancho Mirage, CA, 8Allied Custom Gypsum A collection of currently-planted creeping bentgrass cultivars and blends are being evaluated for their performance as putting green turfgrasses at three locations in Southern California. The three sites represent three distinctive climates: south coast interior valley (Industry Hills Golf Courses), south coast coastal valley and plains (Rancho Santa Fe Golf Club), and Southern California desert (The Springs Club, Rancho Mirage). Average monthly maximum and minimum air temperatures, relative humidity, and ETo (evapotranspiration rate of 4-6-inch tall, unstressed, cool-season grass), recorded at CIMIS weather stations in climatic zones similar to the three plot locations, are indicated in Figures 1–3 below. Figure 1. Average monthly maximum and minimum air temperatures recorded from CIMIS weather stations located at Pomona (south coast interior valley climate), Ocean-side (south coast coastal valley and plains climate) and Cathedral City (southern Cali-fornia desert climate).
Jan 9
6
Feb 96
Mar 96
Apr 96
May 96
Jun 9
6Ju
l 96
Aug 96
Sep 96
Oct 96
Nov 96
Dec 96
Jan 9
7
Feb 97
Mar 97
Apr 97
May 97
Jun 9
7Ju
l 97
Aug 97
Sep 97
Oct 97
Nov 97
Dec 97
Date
0
20
40
60
80
100
120
Mon
thly
ave
rage
tem
pera
ture
(ºF
)
POM Max POM Min OCN Max OCN Min CTH Max CTH Min
Proceedings of the UCR Turfgrass and Landscape Management Research Conference and Field Day, September 1998
6
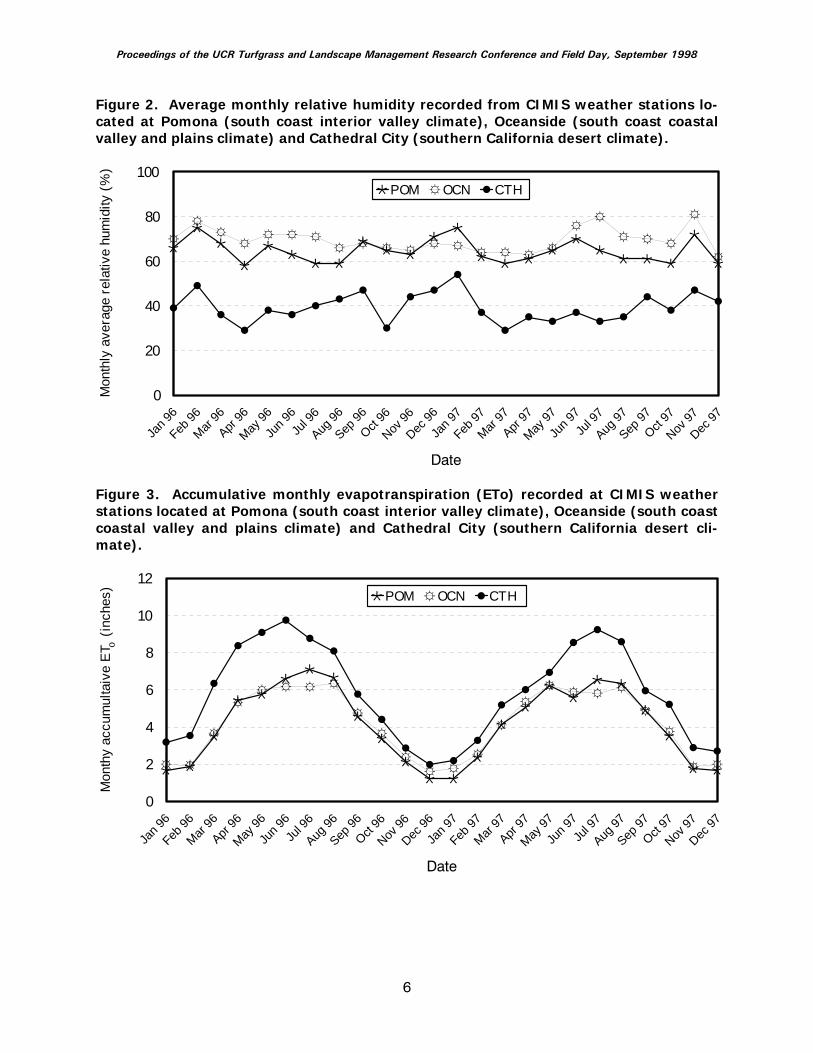
Figure 2. Average monthly relative humidity recorded from CIMIS weather stations lo-cated at Pomona (south coast interior valley climate), Oceanside (south coast coastal valley and plains climate) and Cathedral City (southern California desert climate).
Jan 9
6
Feb 96
Mar 96
Apr 96
May 96
Jun 9
6Ju
l 96
Aug 96
Sep 96
Oct 96
Nov 96
Dec 96
Jan 9
7
Feb 97
Mar 97
Apr 97
May 97
Jun 9
7Ju
l 97
Aug 97
Sep 97
Oct 97
Nov 97
Dec 97
0
20
40
60
80
100
Mon
thly
ave
rage
rel
ativ
e hu
mid
ity (
%)
POM OCN CTH
Figure 3. Accumulative monthly evapotranspiration (ETo) recorded at CIMIS weather stations located at Pomona (south coast interior valley climate), Oceanside (south coast coastal valley and plains climate) and Cathedral City (southern California desert cli-mate).
Jan 9
6
Feb 96
Mar 96
Apr 96
May 96
Jun 9
6Ju
l 96
Aug 96
Sep 96
Oct 96
Nov 96
Dec 96
Jan 9
7
Feb 97
Mar 97
Apr 97
May 97
Jun 9
7Ju
l 97
Aug 97
Sep 97
Oct 97
Nov 97
Dec 97
0
2
4
6
8
10
12
Mon
thy
accu
mul
taiv
e ET
(in
ches
)
POM OCN CTH
o
Proceedings of the UCR Turfgrass and Landscape Management Research Conference and Field Day, September 1998

7
The south coast interior valley (Industry Hills Golf Courses) and desert (The Springs Club) trials were hand-seeded in 5.0 x 7.0 ft plots in November 1995 and December 1996, respectively, while the south coast coastal valley (Rancho Santa Fe Golf Club) trial was hand-seeded in 4.5 x 5.0 ft plots in November 1995. Seeding rates at all three locations were equivalent to 1.0 lb seed/1000 ft2. There are four replications of each cultivar/blend treatment. Each site is located on a putting green nursery with a root zone soil consisting of a well-drained sand. Golf Course Superintendents at the three locations (Bert Spivey: Industry Hills Golf Courses; Mike Kocour: The Springs Club; and, Tim Barrier: Rancho Santa Fe Golf Club) incorporate management practices consistent with those used on in-use putting greens, including mowing, irrigation, fertiliza-tion, topdressing, verticutting, grooming, cultivation, and pesticide applications. Visual ratings of the cultivars were initiated when the Superintendent considered the turfgrass in the trial representative of the turfgrass on his putting greens, which averaged four to six months after seeding. Visual ratings of putting green quality were taken five to nine times per year (with the ex-ception of the Southern California desert location, which was not rated in 1996), while visual ratings of genetic color were taken one to two times annually. Normally, two to four people participated in the ratings, including the Superintendent, a UC Cooperative Extension Farm Advisor, and other in-dustry and UCR personnel. To help insure that accurate overall conclusions are made pertaining to cultivar/blend performance, data will be collected from each site for at least three years. Because bentgrass plots used in this study do not receive actual golfer play and traffic, a study was established during the past year on in-use practice putting greens to evaluate both bentgrass and bermudagrass cultivars. This study, led by Robert Green, is located at the Southern California Golf Association (SCGA) Members’ Club in Murrieta and will be conducted over a five-year period as part of the National Turfgrass Evaluation Program’s (NTEP) on-site cultivar testing and performance evaluation. It is supported by the NTEP, the United States Golf Association (USGA), and the Golf Course Superintendents Association of America (GCSAA). Average visual putting green quality ratings and rankings for 1996 and 1997 are presented in Table 1 on the following page. These ratings are on a scale of 1-9 with 1 = lowest quality, 5 = minimally acceptable and 9 = highest quality putting surface. Visual putting green quality ratings were a com-posite of leaf texture; leaf and shoot density; color; uniformity of leaf texture, density, orientation, and color; and surface smoothness. Caution: Data in the following tables represent one- or two-year average of multiple rating dates, though the data have been analyzed for each individual rating date. While it is interesting to note that some cultivars performed well at all three locations to date, the study remains ongoing and re-ported results are preliminary and subject to possible change over time.
Proceedings of the UCR Turfgrass and Landscape Management Research Conference and Field Day, September 1998
8
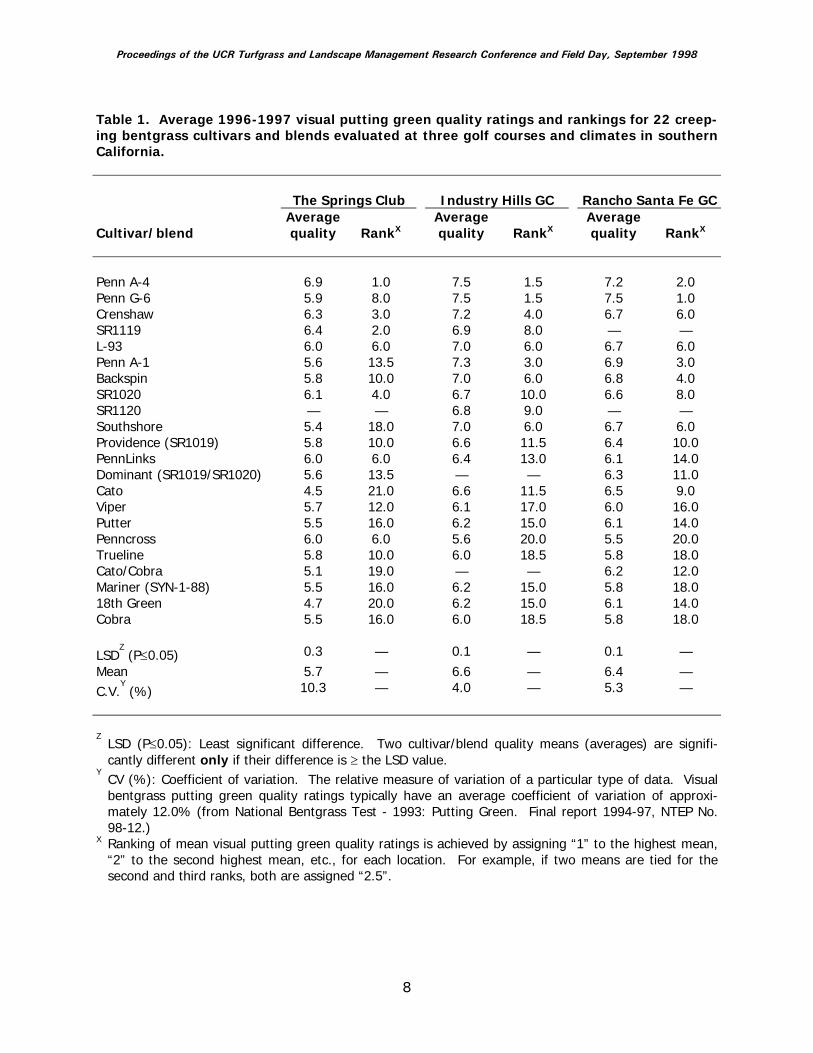
Table 1. Average 1996-1997 visual putting green quality ratings and rankings for 22 creep-ing bentgrass cultivars and blends evaluated at three golf courses and climates in southern California.
The Springs Club Industry Hills GC Rancho Santa Fe GC
Average Average Average Cultivar/blend quality RankX quality RankX quality RankX Penn A-4 6.9 1.0 7.5 1.5 7.2 2.0 Penn G-6 5.9 8.0 7.5 1.5 7.5 1.0 Crenshaw 6.3 3.0 7.2 4.0 6.7 6.0 SR1119 6.4 2.0 6.9 8.0 — — L-93 6.0 6.0 7.0 6.0 6.7 6.0 Penn A-1 5.6 13.5 7.3 3.0 6.9 3.0 Backspin 5.8 10.0 7.0 6.0 6.8 4.0 SR1020 6.1 4.0 6.7 10.0 6.6 8.0 SR1120 — — 6.8 9.0 — — Southshore 5.4 18.0 7.0 6.0 6.7 6.0 Providence (SR1019) 5.8 10.0 6.6 11.5 6.4 10.0 PennLinks 6.0 6.0 6.4 13.0 6.1 14.0 Dominant (SR1019/SR1020) 5.6 13.5 — — 6.3 11.0 Cato 4.5 21.0 6.6 11.5 6.5 9.0 Viper 5.7 12.0 6.1 17.0 6.0 16.0 Putter 5.5 16.0 6.2 15.0 6.1 14.0 Penncross 6.0 6.0 5.6 20.0 5.5 20.0 Trueline 5.8 10.0 6.0 18.5 5.8 18.0 Cato/Cobra 5.1 19.0 — — 6.2 12.0 Mariner (SYN-1-88) 5.5 16.0 6.2 15.0 5.8 18.0 18th Green 4.7 20.0 6.2 15.0 6.1 14.0 Cobra 5.5 16.0 6.0 18.5 5.8 18.0 LSD
Z (P≤0.05) 0.3 — 0.1 — 0.1 —
Mean 5.7 — 6.6 — 6.4 — C.V.
Y (%) 10.3 — 4.0 — 5.3 —
Z LSD (P≤0.05): Least significant difference. Two cultivar/blend quality means (averages) are signifi-
cantly different only if their difference is ≥ the LSD value. Y CV (%): Coefficient of variation. The relative measure of variation of a particular type of data. Visual
bentgrass putting green quality ratings typically have an average coefficient of variation of approxi-mately 12.0% (from National Bentgrass Test - 1993: Putting Green. Final report 1994-97, NTEP No. 98-12.)
X Ranking of mean visual putting green quality ratings is achieved by assigning “1” to the highest mean, “2” to the second highest mean, etc., for each location. For example, if two means are tied for the second and third ranks, both are assigned “2.5”.
Proceedings of the UCR Turfgrass and Landscape Management Research Conference and Field Day, September 1998
9
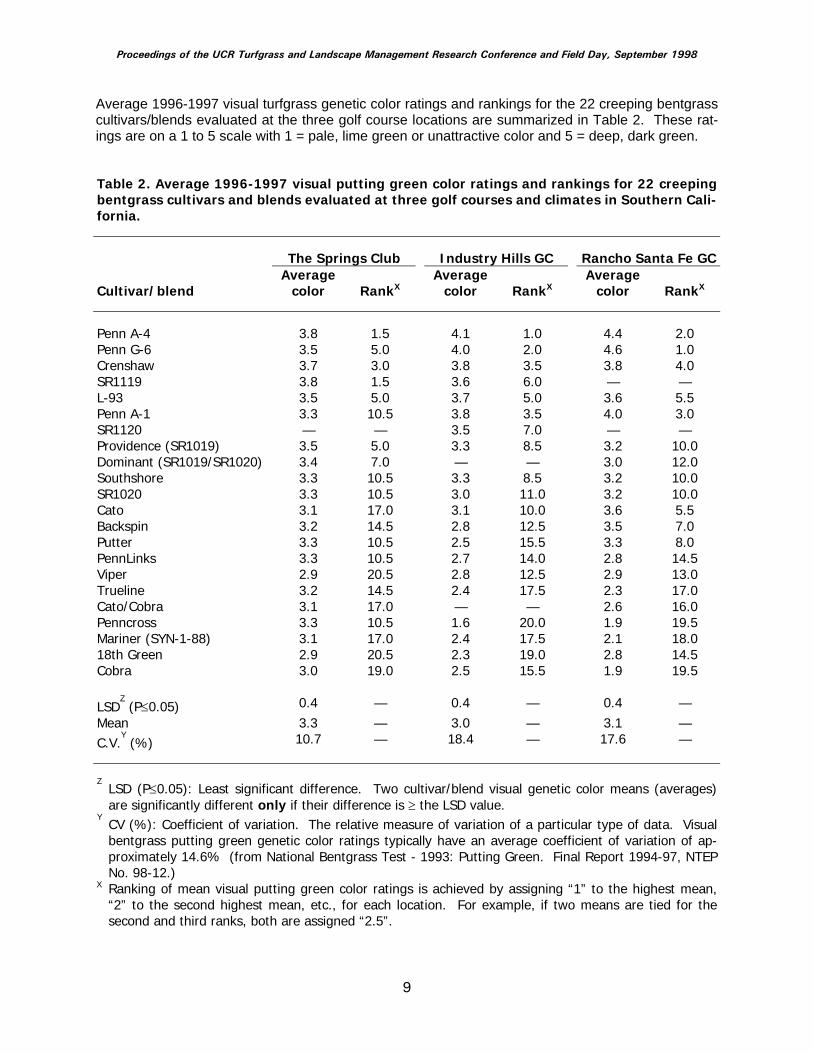
Average 1996-1997 visual turfgrass genetic color ratings and rankings for the 22 creeping bentgrass cultivars/blends evaluated at the three golf course locations are summarized in Table 2. These rat-ings are on a 1 to 5 scale with 1 = pale, lime green or unattractive color and 5 = deep, dark green. Table 2. Average 1996-1997 visual putting green color ratings and rankings for 22 creeping bentgrass cultivars and blends evaluated at three golf courses and climates in Southern Cali-fornia. The Springs Club Industry Hills GC Rancho Santa Fe GC Average Average Average Cultivar/blend color RankX color RankX color RankX
Penn A-4 3.8 1.5 4.1 1.0 4.4 2.0 Penn G-6 3.5 5.0 4.0 2.0 4.6 1.0 Crenshaw 3.7 3.0 3.8 3.5 3.8 4.0 SR1119 3.8 1.5 3.6 6.0 — — L-93 3.5 5.0 3.7 5.0 3.6 5.5 Penn A-1 3.3 10.5 3.8 3.5 4.0 3.0 SR1120 — — 3.5 7.0 — — Providence (SR1019) 3.5 5.0 3.3 8.5 3.2 10.0 Dominant (SR1019/SR1020) 3.4 7.0 — — 3.0 12.0 Southshore 3.3 10.5 3.3 8.5 3.2 10.0 SR1020 3.3 10.5 3.0 11.0 3.2 10.0 Cato 3.1 17.0 3.1 10.0 3.6 5.5 Backspin 3.2 14.5 2.8 12.5 3.5 7.0 Putter 3.3 10.5 2.5 15.5 3.3 8.0 PennLinks 3.3 10.5 2.7 14.0 2.8 14.5 Viper 2.9 20.5 2.8 12.5 2.9 13.0 Trueline 3.2 14.5 2.4 17.5 2.3 17.0 Cato/Cobra 3.1 17.0 — — 2.6 16.0 Penncross 3.3 10.5 1.6 20.0 1.9 19.5 Mariner (SYN-1-88) 3.1 17.0 2.4 17.5 2.1 18.0 18th Green 2.9 20.5 2.3 19.0 2.8 14.5 Cobra 3.0 19.0 2.5 15.5 1.9 19.5 LSD
Z (P≤0.05) 0.4 — 0.4 — 0.4 —
Mean 3.3 — 3.0 — 3.1 — C.V.
Y (%) 10.7 — 18.4 — 17.6 —
Z LSD (P≤0.05): Least significant difference. Two cultivar/blend visual genetic color means (averages)
are significantly different only if their difference is ≥ the LSD value. Y CV (%): Coefficient of variation. The relative measure of variation of a particular type of data. Visual
bentgrass putting green genetic color ratings typically have an average coefficient of variation of ap-proximately 14.6% (from National Bentgrass Test - 1993: Putting Green. Final Report 1994-97, NTEP No. 98-12.)
X Ranking of mean visual putting green color ratings is achieved by assigning “1” to the highest mean, “2” to the second highest mean, etc., for each location. For example, if two means are tied for the second and third ranks, both are assigned “2.5”.
Proceedings of the UCR Turfgrass and Landscape Management Research Conference and Field Day, September 1998

10
WHAT HAPPENED TO THE GRASS IN THE RETRACTABLE ROOF STADIUM?
Stephen T. Cockerham Agricultural Operations, University of California, Riverside, CA 92521-0124
The concept of a roof that would open and close to provide comfort for the spectators during inclem-ent weather, provide an open-air feeling in nice weather, and, incidentally, allow the grass to grow has become reality. On March 29, 1998, the Arizona Diamondbacks opened their inaugural season in the Bank One Ballpark a retractable roof stadium with natural grass turf as a playing surface. ‘De Anza’ zoysiagrass was installed as thick-cut sod the first week of February 1998. Artificial lights were used on the infield to supplement the natural light of the late winter and early spring as scheduled. The outfield suffered as the spring of 1998, supposedly as a result of ‘El Nino’, was cold and overcast in Phoenix. Soil temperatures stayed in the low 50s and light was limited causing the turfgrass growth to be slow to non-existent. Construction delays also impacted the turf, as the roof structure was not completed when the grass was installed with unscheduled closings sometimes lasting for several days. A major league baseball game does not normally produce excessive traffic. However, the pre-game activities of batting practice, infield practice, and workouts by each team can put some stress on the turf. In April, with 14 games in 17 days the field took quite a beating. May was also cool and the turf didn’t grow enough to adequately recover from injury. The quality and performance of the playing surface was good, certainly well within the range required for major league baseball, but not quite at the level expected by the researchers. By the first week of June, temperatures were closer to nor-mal and the turf responded quickly. Once the turf growth reached the expected level, it provided an excellent playing surface for major league baseball. Challenges have been frequent and often quite significant. Artificial lights were used for turf growth in the severely shaded areas of right field in the summer due to the closing of the roof for the air conditioning. Balancing the irrigation to reduce the impact upon the air conditioning is an ongoing need. What happened to the grass in the retractable roof stadium? It is alive and well. Phoenix has a beautiful new baseball park with natural grass and a roof. PRACTICUM If your travels take you to Phoenix, stop by and see the Bank One Ballpark. It is a great experience.
Proceedings of the UCR Turfgrass and Landscape Management Research Conference and Field Day, September 1998
11
FATE OF PESTICIDES IN TURF
M. V. Yates1, J. Gan1, R. L. Green2, and S. R. Yates3, and P. Pacheco1 Departments of Soil & Environmental Sciences1 and Botany & Plant Sciences2, University of California,
Riverside; and United States Salinity Laboratory3
Previous USGA-funded research at the University of California, Riverside (UCR) indicated that less than 10% of the applied pesticides could be accounted for through volatilization and leaching losses. In this project, we are performing a more detailed analysis of the fate of pesticides in the field plots to enable a determination of the mass balance. The purpose of this research project is to determine the partitioning of commonly-used turfgrass pesticides among the components of a turfgrass system including the atmosphere, soil, soil-water, leachate, and clippings. The pesticides used in the experiment were chlorpyrifos (Dursban 2E®) and trichlorfon (Dylox®). The chlorpyrifos was applied at a rate of 2 oz/1000 ft2 (2 lb active ingredient per gallon). The trichlorfon was applied at a rate of 3 oz per 1000 ft2 (80% active ingredient. The pesticides were applied by a certified pesticide applicator on June 4, 1996 at approximately 8:00 a.m. The experiment was replicated on July 10, 1997. Samples of drainage water were collected from each of the test plots on a daily basis for 40 days. Drain volumes were measured and recorded daily, allowing a calculation of the mass of pesticides leaching from the plots. Samples of the turfgrass clippings were taken from each of the experimental plots one day prior to pesticide application to determine any background concentrations. Clipping samples were also taken on days 1, 3, 5, 7, 9, 12, 14, and 16. The volatilization of the pesticides into the air was measured using a volatilization flux chamber placed directly on the turf in each of the designated plots. Soil samples were obtained from the entire soil profile (18.5 inch) using a handheld coring device. The soil was divided into five increments (0-0.8, 0.8-3.9, 3.9-7.9, 7.9-12.6, and 12.6-18.5 inch) prior to analysis to permit a determination of the depth distribution of the pesticides in the profile. Soil samples were taken prior to the pesticide application, and on days 2, 7, 15, and 30 after pesticide application. The results indicated that the majority of the applied chemical was retained by the soil until it was degraded by biological, physical, and/or chemical means. Very little (<0.005%) of either pesticide leached through the soil profile, and less than 0.5% was removed with the clippings. While less than 0.1% of the Dylox® volatilized, 15.7 and 2.8% of the Dursban 2E® volatilized in the 2 experiments. The measured partitioning of each of the chemicals into the various environmental compartments (soil, water, air, and tissue) was compared to that predicted by a mathematical transport model, CHAIN_2D. While the model predicts comparable behavior to what was actually measured, it is ob-vious that refinements will be necessary before accurate predictions can be made. Because of the vast number of combinations of pesticides, soil types, cultural practices, and environmental conditions, it is not practical to experimentally evaluate each of these combinations to determine potential environmental impacts. The use of computer models can substitute for experimental data if they are found to be accurate in their predictions. The ultimate goal of using a computer model would be to assist the turfgrass manager in identifying potential site-specific problems with environmental contamination so that measures to avoid those problems can be taken.
Proceedings of the UCR Turfgrass and Landscape Management Research Conference and Field Day, September 1998
12
MAINTAINING PUTTING GREEN SOIL AERATION AND LEACHING CAPABILITY DURING THE SUMMER
Robert L. Green
Dept. of Botany and Plant Sciences, University of California, Riverside, CA 92521-0124 Summer annual bluegrass/creeping bentgrass decline is one of the more common concerns of golf course superintendents in Southern California. It is a complex of plant stresses, which may include climate, soil, pests, traffic, and others. Though the successful management of annual bluegrass/creeping bentgrass putting greens during the summer involves numerous as-pects of the annual cultural program, the focus of this presentation and associated research is on the summer cultivation aspect. Summer cultivations of annual bluegrass/creeping bentgrass putting greens are needed to 1) reduce soil surface compaction and hardness due to increased summer-time traffic and/or so-dium, 2) maintain soil water infiltration and percolation which are especially critical for roots subjected to high soil temperatures and/or salts during the summer, and 3) maintain soil gas exchange which also is especially critical for roots subjected to high soil temperatures during the summer. In brief, prolonged high soil and air temperatures are probably the most general limiting factor for annual bluegrass/creeping bentgrass growth during the summer. Soils with limited soil gas exchange, limited soil water infiltration and percolation, and high concentrations of salts compound the detrimental effects of prolonged high temperatures. Maintaining good soil physical characteristics is a major key for successfully maintaining annual bluegrass/ creep-ing bentgrass greens during the summer in Southern California. The maintenance of proper soil physical characteristics is a 12-month process, and involves a proper soil cultivation and topdressing program during the spring and fall. Actually, the cultiva-tion/topdressing programs in the spring and fall may be the most important step in successfully dealing with summer annual bluegrass/creeping bentgrass decline, at least from a soil physical aspect. These activities are more long-term solutions for increasing soil water infiltration rates and soil aeration porosity. However, our current focus is on soil cultivations during the summer when annual bluegrass/creeping bentgrass is not under optimal growing conditions. Due to the environmental stress of the summer and the stress associated with increased traffic, less plant-stressful techniques of soil cultivations are practiced during the summer and have included spiking and coring with relatively small-diameter, solid and hollow tines. A more recent tech-nique involves using high-pressure water injection via a Toro HydroJect or similar equipment. This technique uses short bursts of high velocity streams of water to cultivate the soil while minimizing surface disruption. We have been involved in a two-summer project (1996 and 1997) at Industry Hills Golf Course. The major objective is to study cultivation methods for maintaining putting green soil aeration and leaching capability during the summer. The findings from this study will be discussed, so a brief study outline has been included in this report. Special thanks are given to Mr. Bert Spivey, CGCS, and his staff for their diligent care of the research plots. Also, thanks are given to The Toro Company for partially funding this research project.
Proceedings of the UCR Turfgrass and Landscape Management Research Conference and Field Day, September 1998

13
1996-97 TORO HYDROJECT PROJECT
Maintaining Putting Green Soil Aeration and Leaching Capability During the Summer with a Toro HydroJect
R. Green, L. Wu, G. Klein, B. Spivey, F. Merino, R. Strohman, J. Evans, E. Baltazar, and J. Hartin
I. OBJECTIVES Study summer cultivation techniques on an in-use annual bluegrass/creeping bentgrass
putting green to achieve the following:
• Maintain soil infiltration and percolation • Maintain leaching capability to manage salts • Maintain soil aeration, especially O2 status • Maintain rooting • Maintain a desirable putting green surface
II. LOCATION Industry Hills Golf Courses Eisenhower Practice Putting Green
• This practice putting green was constructed to USGA specifications in 1978. Cur-rently, the putting green is approximately 80% annual bluegrass and 20% creeping bentgrass
• Last cultivation prior to this study was a vertidrain operation in July 1995 • Average field infiltration rate in summer 1995 = 0.78 inch/hour • Average bulk density in summer 1995 = 1.43 g/cm3 • Average total porosity in summer 1995 = 46.25% • Average air-filled porosity in summer 1995 = 24.05% • Water analysis: pH = 8.3; EC = 0.99 d S/m (approximately 634 ppm total dissolved
solids); sodium 116 ppm; SAR 3.0 III. EXPERIMENTAL DESIGN, PLOT SIZE, AND STUDY DURATION
• Experimental design is a randomized complete block design with four replications of each treatment
• Individual plot size is 6.0 x 20.0 feet • This is a two-summer (1996 and 1997) study with measurements being taken for
not less than 16 to 20 consecutive weeks within each summer season IV. TREATMENTS (frequency)
1. Check (NA) 2. HydroJect z Lowered (21 days) 3. HydroJect
y Raised (21 days) 4. HydroJectz Lowered (14 days)
Proceedings of the UCR Turfgrass and Landscape Management Research Conference and Field Day, September 1998
14
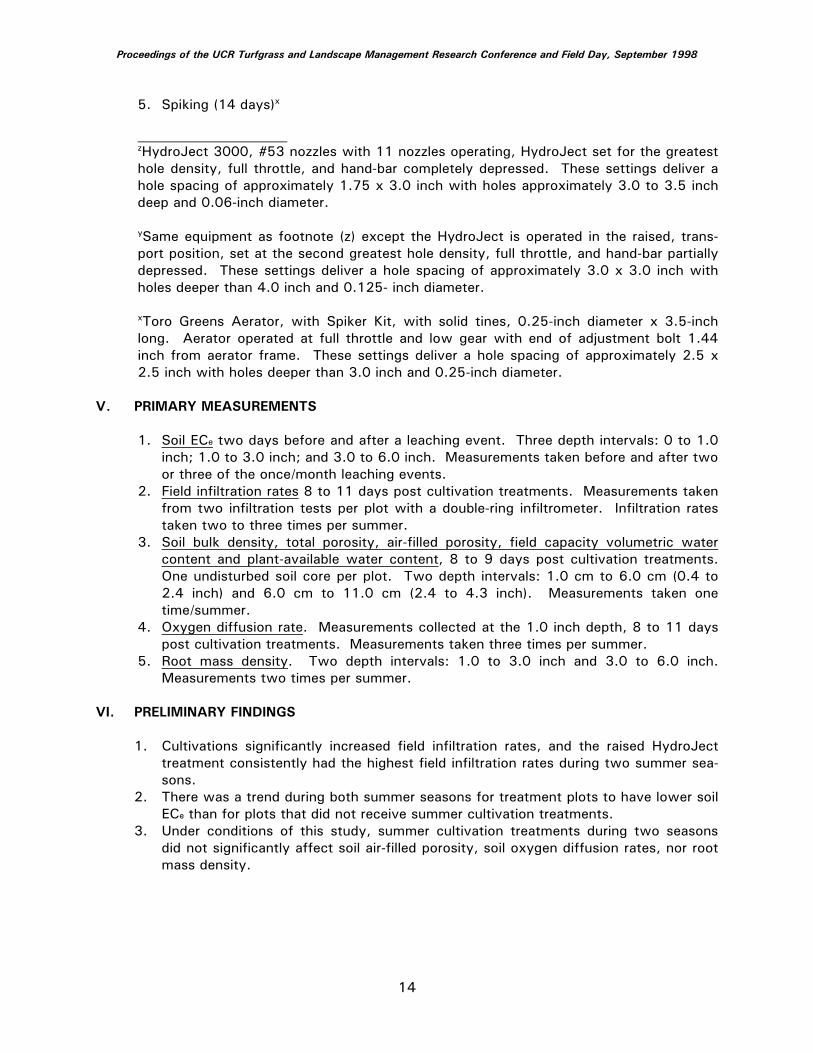
5. Spiking (14 days)x zHydroJect 3000, #53 nozzles with 11 nozzles operating, HydroJect set for the greatest hole density, full throttle, and hand-bar completely depressed. These settings deliver a hole spacing of approximately 1.75 x 3.0 inch with holes approximately 3.0 to 3.5 inch deep and 0.06-inch diameter. ySame equipment as footnote (z) except the HydroJect is operated in the raised, trans-port position, set at the second greatest hole density, full throttle, and hand-bar partially depressed. These settings deliver a hole spacing of approximately 3.0 x 3.0 inch with holes deeper than 4.0 inch and 0.125- inch diameter. xToro Greens Aerator, with Spiker Kit, with solid tines, 0.25-inch diameter x 3.5-inch long. Aerator operated at full throttle and low gear with end of adjustment bolt 1.44 inch from aerator frame. These settings deliver a hole spacing of approximately 2.5 x 2.5 inch with holes deeper than 3.0 inch and 0.25-inch diameter.
V. PRIMARY MEASUREMENTS
1. Soil ECe two days before and after a leaching event. Three depth intervals: 0 to 1.0 inch; 1.0 to 3.0 inch; and 3.0 to 6.0 inch. Measurements taken before and after two or three of the once/month leaching events.
2. Field infiltration rates 8 to 11 days post cultivation treatments. Measurements taken from two infiltration tests per plot with a double-ring infiltrometer. Infiltration rates taken two to three times per summer.
3. Soil bulk density, total porosity, air-filled porosity, field capacity volumetric water content and plant-available water content, 8 to 9 days post cultivation treatments. One undisturbed soil core per plot. Two depth intervals: 1.0 cm to 6.0 cm (0.4 to 2.4 inch) and 6.0 cm to 11.0 cm (2.4 to 4.3 inch). Measurements taken one time/summer.
4. Oxygen diffusion rate. Measurements collected at the 1.0 inch depth, 8 to 11 days post cultivation treatments. Measurements taken three times per summer.
5. Root mass density. Two depth intervals: 1.0 to 3.0 inch and 3.0 to 6.0 inch. Measurements two times per summer.
VI. PRELIMINARY FINDINGS 1. Cultivations significantly increased field infiltration rates, and the raised HydroJect
treatment consistently had the highest field infiltration rates during two summer sea-sons.
2. There was a trend during both summer seasons for treatment plots to have lower soil ECe than for plots that did not receive summer cultivation treatments.
3. Under conditions of this study, summer cultivation treatments during two seasons did not significantly affect soil air-filled porosity, soil oxygen diffusion rates, nor root mass density.
Proceedings of the UCR Turfgrass and Landscape Management Research Conference and Field Day, September 1998
15
UNRAVELING THE SECRET LIFE OF THE STING NEMATODE
J. Ole Becker Dept. of Nematology, University of California, Riverside, CA 92521-0124
The sting nematode, Belonolaimus spp., is one of the most destructive agricultural nematode pests in the Southeastern United States. A large number of plants including most agricultural crops, turf and forage grasses are hosts. In 1994, B. longicaudatus was found to be associated with dying turfgrass in several different Coachella Valley golf course sites and in a couple of private home lawns near one of the golf courses. The sting nematode constitutes a very serious threat not only to the golf courses but to major agricultural industries in the Coachella Valley and elsewhere in South-ern California. Although the sting nematode has been known for 50 years, details of its biology, life cycle and host-parasite interactions have remained unknown until recently. Current management options for sting nematodes in California turf are limited by the lack of resistant turfgrasses or effec-tive biocontrol organisms and the restriction of nematicide use. Development of new methods of control necessitates a better understanding of the host-parasite relationship and the influence of en-vironmental conditions on behavior and population dynamics of this pest. We developed an in vitro culture method which allows us to observe the normally hidden nematode under laboratory condi-tions and to describe its life cycle and behavior. The studies were conducted at the UC Riverside Nematology Quarantine Facilities which is recognized by CDFA and USDA as the only place in the state where research on exotic nematodes can be safely conducted. All critical events in the life cy-cle of the sting nematode, i.e. host search, feeding, molting, mating, egg-laying, hatching, were timed and documented by photography. These results will facilitate field population studies to opti-mize control decisions such as timing of pesticide applications. In addition, a thorough understand-ing of the life cycle will promote the development of novel nematode management strategies.
Proceedings of the UCR Turfgrass and Landscape Management Research Conference and Field Day, September 1998
16
SUSTAINABLE TURFGRASS SELECTION AND CULTURE
Victor A. Gibeault1, J. Michael Henry2, and Richard Autio1 1Dept. of Botany and Plant Sciences, University of California, Riverside, CA 92521-0124
2University of California Cooperative Extension, Riverside and Orange Counties 21150 Box Springs Road, Moreno Valley, CA 92557-8707
Most turfgrass in California is used for general landscape aesthetics and site-specific environmental modification. Examples are industrial, municipal, and many residential lawns, as well as lawns used in cemeteries and other facilities where traffic is not an issue. Such uses of turfgrass require a soil cover by a uniform grass surface, capable of being mowed, to yield the functional and aesthetic re-sults that are desired by our California urban/suburban population. Where turfgrasses are used for these purposes, grasses that perform at acceptable levels with low-to moderate-input of water, nutri-ents, energy, pest control and resulting maintenance costs may be practical and realistic for the ma-jority of turfed facilities in California. Strain on public and private budgets and environmental con-cerns regarding natural resource use and protection are focusing attention on the concept of sus-tainable turfgrass selection and culture. In contrast, turfed sites that are used for recreational or other heavy trafficked conditions must be capable of tolerating traffic and recuperating from that heavy use. These functions of turf are asso-ciated with athletic fields, and the intense-use areas of golf courses, school grounds and parks. Un-der these use conditions, a higher level of input during establishment and for maintenance practices is necessary to insure adequate recuperative ability, safety, durability and appearance of the on-site turfgrass sward. Fortunately, new grasses have been developed over the past decade that may play a role in lower-input-requiring sites. In that regard, the objective of this study is to evaluate the growth, develop-ment and quality performance of four turfgrasses that have been specifically chosen for reduced-input success, when irrigated with calculated optimum and less than optimum irrigation regimes, and maintained with varying moderate to low levels of nitrogen fertilization. The study is being conducted at the University of California South Coast Research and Extension Center in Irvine where an in-ground irrigation system provides 48 individually controlled irrigation plots with a very high irrigation distribution uniformity. Grasses being studied include common ber-mudagrass, ‘Sahara’; zoysiagrass, ‘De Anza’; buffalograss, (UCD-95); and tall fescue, ‘Falcon II’. Each grass is irrigated at three regimes: 100%, 70%, and 40% of a well-watered warm season turf. Each grass and irrigation plot is includes three nitrogen fertilization rates on an annual basis, those being 1, 2 and 4 lbs/1000 sq ft/year. The 12 grass and irrigation treatments are replicated four times. In the spring of 1998 ‘Watermark’ soil moisture granular matrix sensors were installed at three depths in the tall fescue and zoysiagrass treatments and will be monitored on a continuing basis throughout the study period. This being the first year of data collection, results to date are preliminary, but obvious trends are be-ing noted and will be reported.
Proceedings of the UCR Turfgrass and Landscape Management Research Conference and Field Day, September 1998

17
TURFGRASS CULTIVAR EVALUATIONS: UC RIVERSIDE
Victor A. Gibeault and Richard Autio Dept. of Botany and Plant Sciences, University of California, Riverside, CA 92521-0124
The National Turfgrass Evaluation Program (NTEP) is a non-profit organization that provides leader-ship in turfgrass evaluation and improvement by linking the public and private sectors of the industry through their common goals of grass development, improvement, and evaluation. Its mission is to provide a mechanism for uniform evaluations; to advance the science of species and cultivar evalua-tion; to collect and disseminate performance information; and to enhance the transfer and use of in-formation and technology relating to turfgrass improvement and evaluation. Structurally, NTEP is a cooperative effort of the United States Department of Agriculture (at Beltsville, MD) and the Turfgrass Federation, Inc. The clientele of NTEP are diverse, with varying interests and expectations. To be clientele sensitive, NTPE has identified the following categories of interest groups that interact and benefit from the ac-tivities of the program: public and private turfgrass plant breeders; public and private sector re-searchers; seed distributors; technology transfer educators such as cooperative extension educators and industry technical representatives; other professionals such as seed producers, sod producers, golf course superintendents, grounds managers, sports turf managers, lawn care service operators, landscape contractors, landscape architects and consultants. Homeowners indirectly are influenced by NTEP because the turfgrasses they buy have been tested for performance characteristics in their climate zones. Most cultivar evaluations are conducted by university turfgrass research and extension programs, but modified studies by private plant breeders are also undertaken. Seed or vegetative material of a turfgrass species is accumulated by the program and sent to cooperating researchers where repli-cated trials are established. Somewhat standardized establishment and cultural practices are used and they are reported for each site. Data collected on a monthly basis during the growing season are also standardized and usually include a turfgrass quality rating. Other specific characteristics such as color, texture, spring green-up, density, drought tolerance and disease or weed activity are rated when appropriate. Data are sent to NTEP on an annual basis, statistical analyses performed and annual results are reported by species. Those reports are used as a basis for information transfer to interested clientele. Four NTEP studies are currently underway at UCR. The plot plans follow, as do national results for the 1997 calendar year for three of the grasses under examination.
Proceedings of the UCR Turfgrass and Landscape Management Research Conference and Field Day, September 1998
18
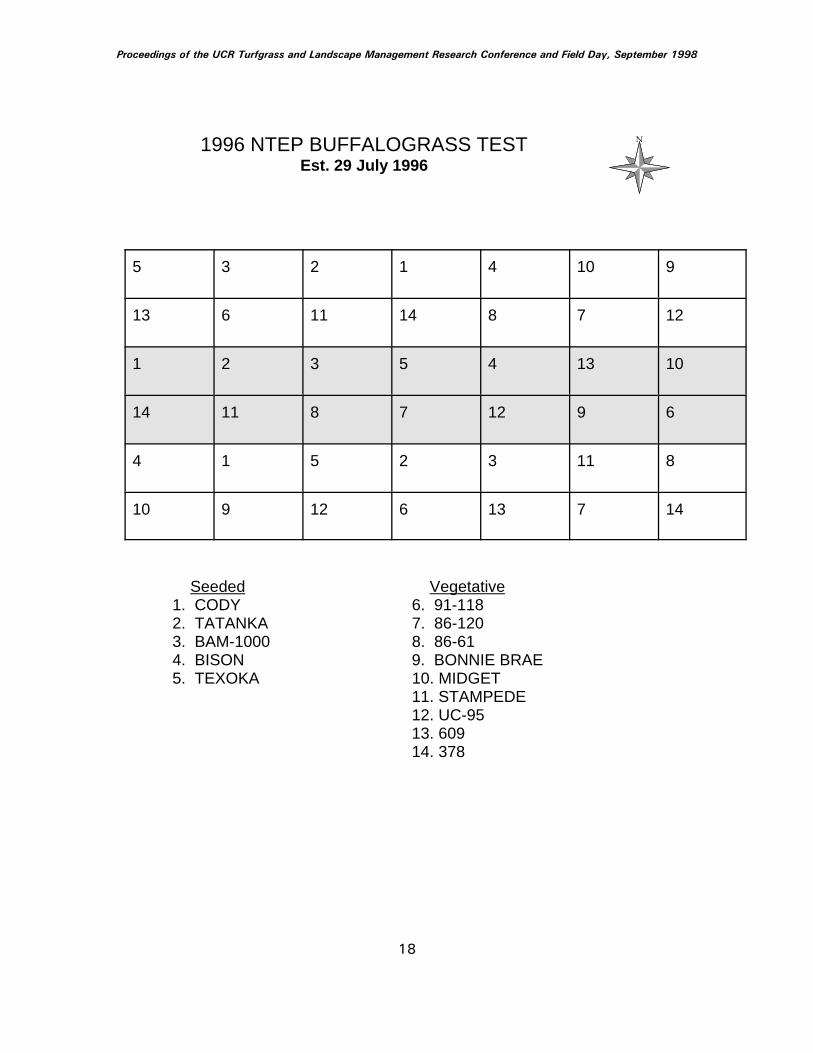
1996 NTEP BUFFALOGRASS TESTEst. 29 July 1996
5 3 2 1 4 10 9
13 6 11 14 8 7 12
1 2 3 5 4 13 10
14 11 8 7 12 9 6
4 1 5 2 3 11 8
10 9 12 6 13 7 14
Seeded Vegetative1. CODY 6. 91-1182. TATANKA 7. 86-1203. BAM-1000 8. 86-614. BISON 9. BONNIE BRAE5. TEXOKA 10. MIDGET
11. STAMPEDE12. UC-9513. 60914. 378
Proceedings of the UCR Turfgrass and Landscape Management Research Conference and Field Day, September 1998
19
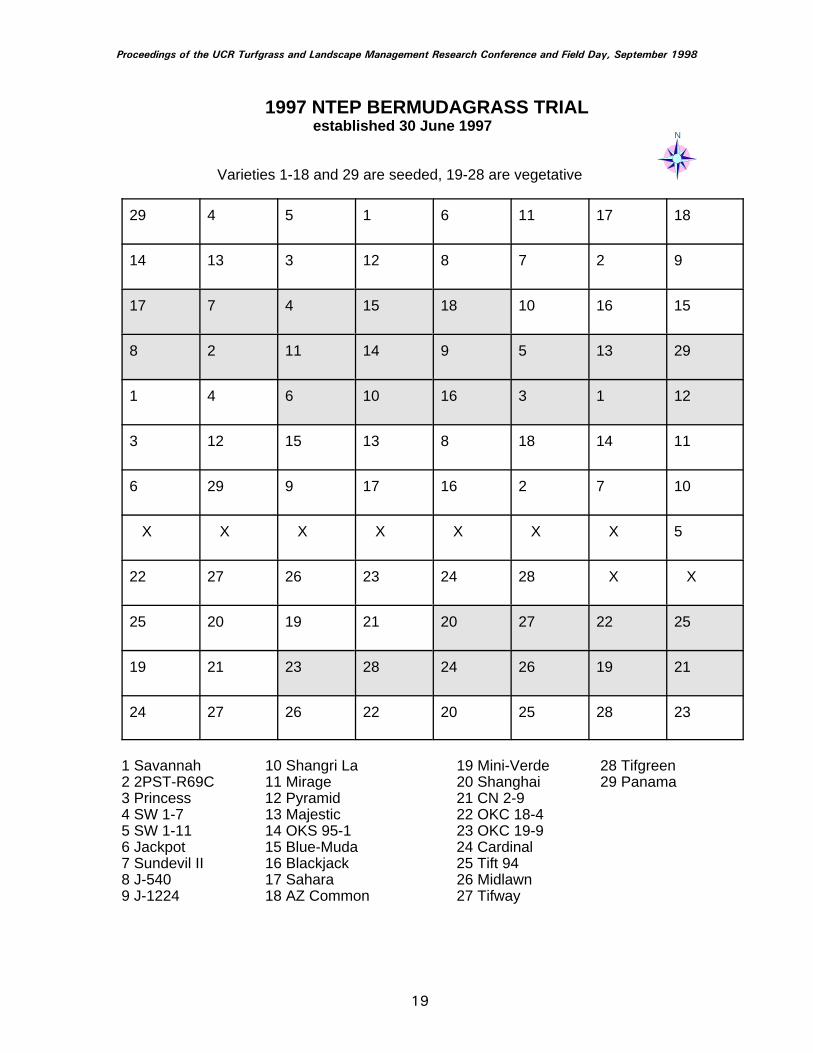
1997 NTEP BERMUDAGRASS TRIALestablished 30 June 1997
Varieties 1-18 and 29 are seeded, 19-28 are vegetative
29 4 5 1 6 11 17 18
14 13 3 12 8 7 2 9
17 7 4 15 18 10 16 15
8 2 11 14 9 5 13 29
1 4 6 10 16 3 1 12
3 12 15 13 8 18 14 11
6 29 9 17 16 2 7 10
X X X X X X X 5
22 27 26 23 24 28 X X
25 20 19 21 20 27 22 25
19 21 23 28 24 26 19 21
24 27 26 22 20 25 28 23
1 Savannah 10 Shangri La 19 Mini-Verde 28 Tifgreen 2 2PST-R69C 11 Mirage 20 Shanghai 29 Panama3 Princess 12 Pyramid 21 CN 2-94 SW 1-7 13 Majestic 22 OKC 18-45 SW 1-11 14 OKS 95-1 23 OKC 19-96 Jackpot 15 Blue-Muda 24 Cardinal7 Sundevil II 16 Blackjack 25 Tift 948 J-540 17 Sahara 26 Midlawn9 J-1224 18 AZ Common 27 Tifway
N
Proceedings of the UCR Turfgrass and Landscape Management Research Conference and Field Day, September 1998
20
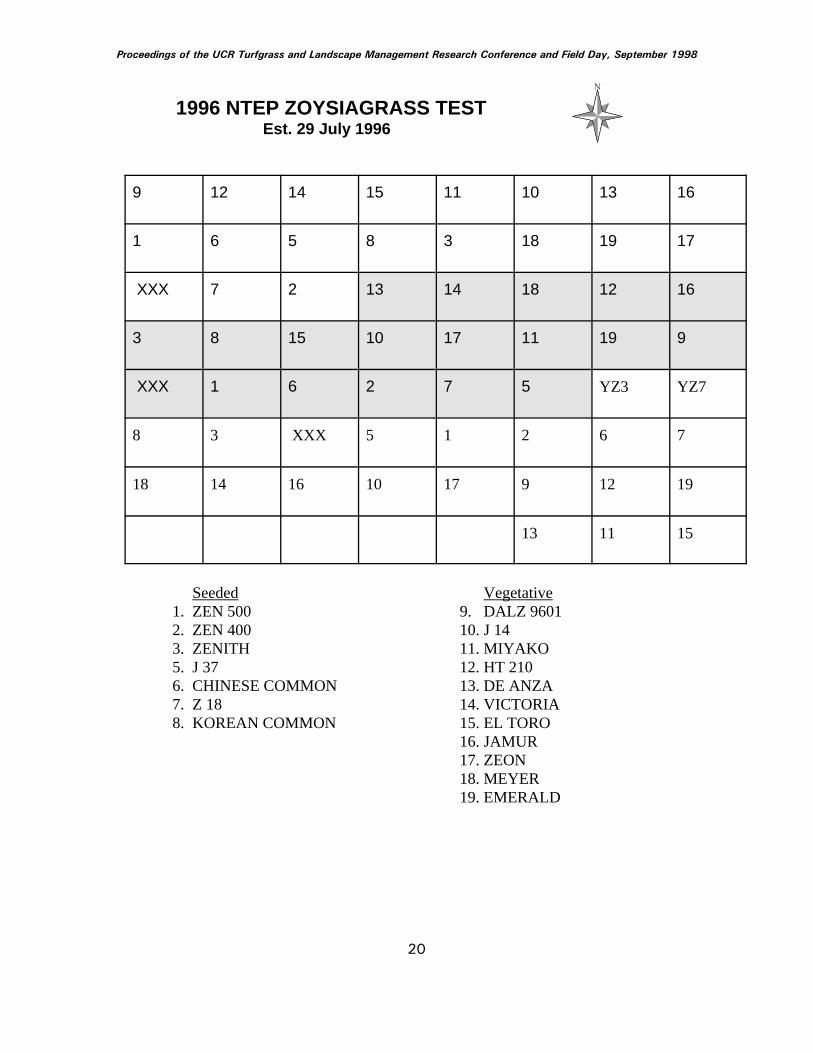
1996 NTEP ZOYSIAGRASS TESTEst. 29 July 1996
9 12 14 15 11 10 13 16
1 6 5 8 3 18 19 17
XXX 7 2 13 14 18 12 16
3 8 15 10 17 11 19 9
XXX 1 6 2 7 5 YZ3 YZ7
8 3 XXX 5 1 2 6 7
18 14 16 10 17 9 12 19
13 11 15
Seeded Vegetative1. ZEN 500 9. DALZ 96012. ZEN 400 10. J 143. ZENITH 11. MIYAKO5. J 37 12. HT 2106. CHINESE COMMON 13. DE ANZA7. Z 18 14. VICTORIA8. KOREAN COMMON 15. EL TORO
16. JAMUR17. ZEON18. MEYER19. EMERALD
Proceedings of the UCR Turfgrass and Landscape Management Research Conference and Field Day, September 1998
21
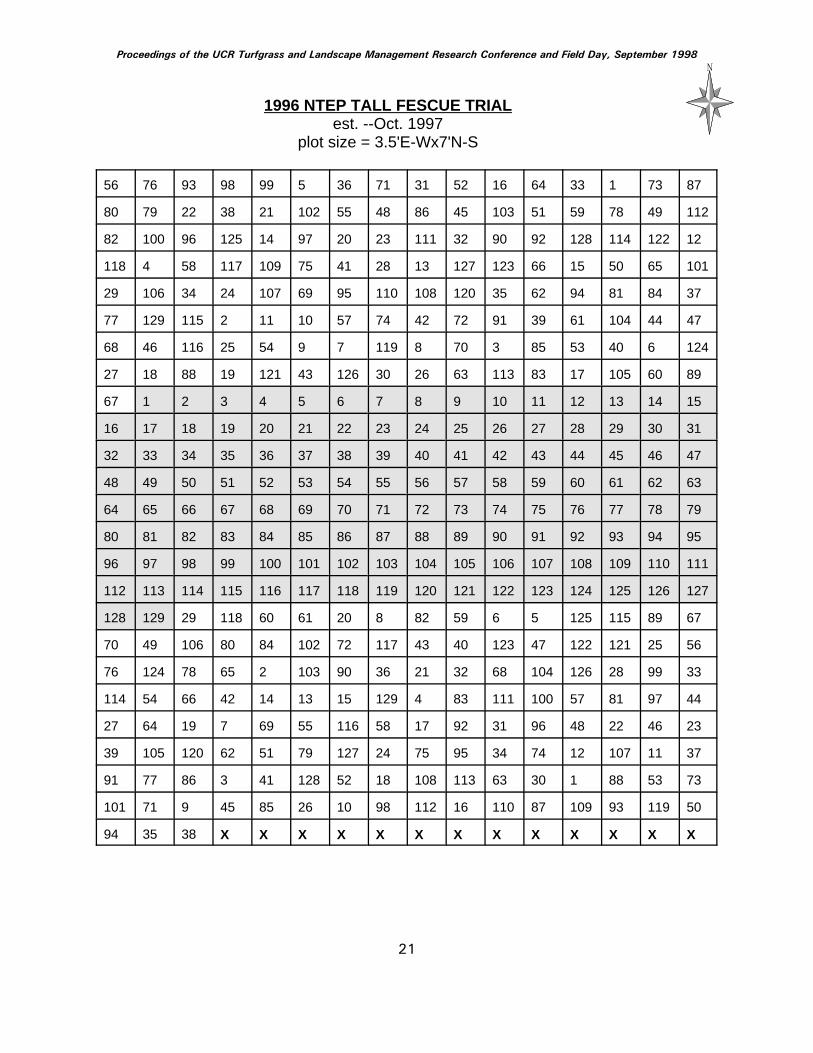
1996 NTEP TALL FESCUE TRIALest. --Oct. 1997
plot size = 3.5'E-Wx7'N-S
56 76 93 98 99 5 36 71 31 52 16 64 33 1 73 87
80 79 22 38 21 102 55 48 86 45 103 51 59 78 49 112
82 100 96 125 14 97 20 23 111 32 90 92 128 114 122 12
118 4 58 117 109 75 41 28 13 127 123 66 15 50 65 101
29 106 34 24 107 69 95 110 108 120 35 62 94 81 84 37
77 129 115 2 11 10 57 74 42 72 91 39 61 104 44 47
68 46 116 25 54 9 7 119 8 70 3 85 53 40 6 124
27 18 88 19 121 43 126 30 26 63 113 83 17 105 60 89
67 1 2 3 4 5 6 7 8 9 10 11 12 13 14 15
16 17 18 19 20 21 22 23 24 25 26 27 28 29 30 31
32 33 34 35 36 37 38 39 40 41 42 43 44 45 46 47
48 49 50 51 52 53 54 55 56 57 58 59 60 61 62 63
64 65 66 67 68 69 70 71 72 73 74 75 76 77 78 79
80 81 82 83 84 85 86 87 88 89 90 91 92 93 94 95
96 97 98 99 100 101 102 103 104 105 106 107 108 109 110 111
112 113 114 115 116 117 118 119 120 121 122 123 124 125 126 127
128 129 29 118 60 61 20 8 82 59 6 5 125 115 89 67
70 49 106 80 84 102 72 117 43 40 123 47 122 121 25 56
76 124 78 65 2 103 90 36 21 32 68 104 126 28 99 33
114 54 66 42 14 13 15 129 4 83 111 100 57 81 97 44
27 64 19 7 69 55 116 58 17 92 31 96 48 22 46 23
39 105 120 62 51 79 127 24 75 95 34 74 12 107 11 37
91 77 86 3 41 128 52 18 108 113 63 30 1 88 53 73
101 71 9 45 85 26 10 98 112 16 110 87 109 93 119 50
94 35 38 X X X X X X X X X X X X X
Proceedings of the UCR Turfgrass and Landscape Management Research Conference and Field Day, September 1998
22
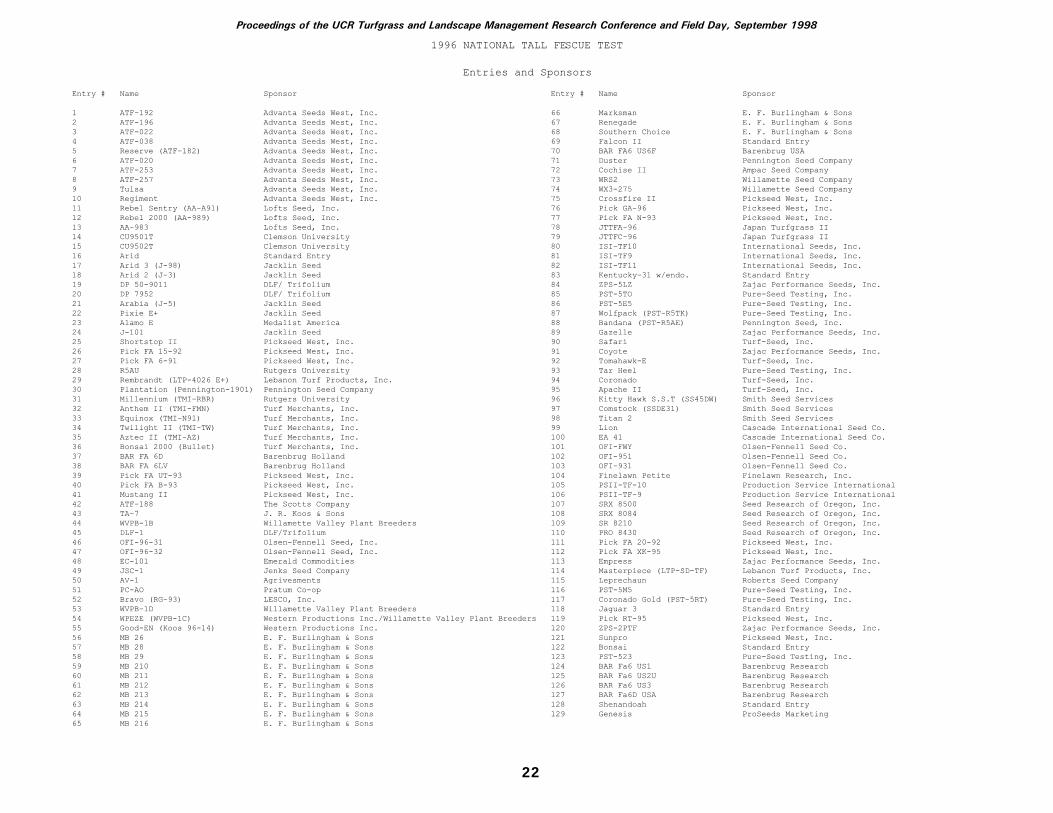
1996 NATIONAL TALL FESCUE TEST
Entries and Sponsors
Entry # Name Sponsor Entry # Name Sponsor
1 ATF-192 Advanta Seeds West, Inc. 66 Marksman E. F. Burlingham & Sons2 ATF-196 Advanta Seeds West, Inc. 67 Renegade E. F. Burlingham & Sons3 ATF-022 Advanta Seeds West, Inc. 68 Southern Choice E. F. Burlingham & Sons4 ATF-038 Advanta Seeds West, Inc. 69 Falcon II Standard Entry5 Reserve (ATF-182) Advanta Seeds West, Inc. 70 BAR FA6 US6F Barenbrug USA6 ATF-020 Advanta Seeds West, Inc. 71 Duster Pennington Seed Company7 ATF-253 Advanta Seeds West, Inc. 72 Cochise II Ampac Seed Company8 ATF-257 Advanta Seeds West, Inc. 73 WRS2 Willamette Seed Company9 Tulsa Advanta Seeds West, Inc. 74 WX3-275 Willamette Seed Company10 Regiment Advanta Seeds West, Inc. 75 Crossfire II Pickseed West, Inc.11 Rebel Sentry (AA-A91) Lofts Seed, Inc. 76 Pick GA-96 Pickseed West, Inc.12 Rebel 2000 (AA-989) Lofts Seed, Inc. 77 Pick FA N-93 Pickseed West, Inc.13 AA-983 Lofts Seed, Inc. 78 JTTFA-96 Japan Turfgrass II14 CU9501T Clemson University 79 JTTFC-96 Japan Turfgrass II15 CU9502T Clemson University 80 ISI-TF10 International Seeds, Inc.16 Arid Standard Entry 81 ISI-TF9 International Seeds, Inc.17 Arid 3 (J-98) Jacklin Seed 82 ISI-TF11 International Seeds, Inc.18 Arid 2 (J-3) Jacklin Seed 83 Kentucky-31 w/endo. Standard Entry19 DP 50-9011 DLF/ Trifolium 84 ZPS-5LZ Zajac Performance Seeds, Inc.20 DP 7952 DLF/ Trifolium 85 PST-5TO Pure-Seed Testing, Inc.21 Arabia (J-5) Jacklin Seed 86 PST-5E5 Pure-Seed Testing, Inc.22 Pixie E+ Jacklin Seed 87 Wolfpack (PST-R5TK) Pure-Seed Testing, Inc.23 Alamo E Medalist America 88 Bandana (PST-R5AE) Pennington Seed, Inc.24 J-101 Jacklin Seed 89 Gazelle Zajac Performance Seeds, Inc.25 Shortstop II Pickseed West, Inc. 90 Safari Turf-Seed, Inc.26 Pick FA 15-92 Pickseed West, Inc. 91 Coyote Zajac Performance Seeds, Inc.27 Pick FA 6-91 Pickseed West, Inc. 92 Tomahawk-E Turf-Seed, Inc.28 R5AU Rutgers University 93 Tar Heel Pure-Seed Testing, Inc.29 Rembrandt (LTP-4026 E+) Lebanon Turf Products, Inc. 94 Coronado Turf-Seed, Inc.30 Plantation (Pennington-1901) Pennington Seed Company 95 Apache II Turf-Seed, Inc.31 Millennium (TMI-RBR) Rutgers University 96 Kitty Hawk S.S.T (SS45DW) Smith Seed Services32 Anthem II (TMI-FMN) Turf Merchants, Inc. 97 Comstock (SSDE31) Smith Seed Services33 Equinox (TMI-N91) Turf Merchants, Inc. 98 Titan 2 Smith Seed Services34 Twilight II (TMI-TW) Turf Merchants, Inc. 99 Lion Cascade International Seed Co.35 Aztec II (TMI-AZ) Turf Merchants, Inc. 100 EA 41 Cascade International Seed Co.36 Bonsai 2000 (Bullet) Turf Merchants, Inc. 101 OFI-FWY Olsen-Fennell Seed Co.37 BAR FA 6D Barenbrug Holland 102 OFI-951 Olsen-Fennell Seed Co.38 BAR FA 6LV Barenbrug Holland 103 OFI-931 Olsen-Fennell Seed Co.39 Pick FA UT-93 Pickseed West, Inc. 104 Finelawn Petite Finelawn Research, Inc.40 Pick FA B-93 Pickseed West, Inc. 105 PSII-TF-10 Production Service International41 Mustang II Pickseed West, Inc. 106 PSII-TF-9 Production Service International42 ATF-188 The Scotts Company 107 SRX 8500 Seed Research of Oregon, Inc.43 TA-7 J. R. Koos & Sons 108 SRX 8084 Seed Research of Oregon, Inc.44 WVPB-1B Willamette Valley Plant Breeders 109 SR 8210 Seed Research of Oregon, Inc.45 DLF-1 DLF/Trifolium 110 PRO 8430 Seed Research of Oregon, Inc.46 OFI-96-31 Olsen-Fennell Seed, Inc. 111 Pick FA 20-92 Pickseed West, Inc.47 OFI-96-32 Olsen-Fennell Seed, Inc. 112 Pick FA XK-95 Pickseed West, Inc.48 EC-101 Emerald Commodities 113 Empress Zajac Performance Seeds, Inc.49 JSC-1 Jenks Seed Company 114 Masterpiece (LTP-SD-TF) Lebanon Turf Products, Inc.50 AV-1 Agrivesments 115 Leprechaun Roberts Seed Company51 PC-AO Pratum Co-op 116 PST-5M5 Pure-Seed Testing, Inc.52 Bravo (RG-93) LESCO, Inc. 117 Coronado Gold (PST-5RT) Pure-Seed Testing, Inc.53 WVPB-1D Willamette Valley Plant Breeders 118 Jaguar 3 Standard Entry54 WPEZE (WVPB-1C) Western Productions Inc./Willamette Valley Plant Breeders 119 Pick RT-95 Pickseed West, Inc.55 Good-EN (Koos 96-14) Western Productions Inc. 120 ZPS-2PTF Zajac Performance Seeds, Inc.56 MB 26 E. F. Burlingham & Sons 121 Sunpro Pickseed West, Inc.57 MB 28 E. F. Burlingham & Sons 122 Bonsai Standard Entry58 MB 29 E. F. Burlingham & Sons 123 PST-523 Pure-Seed Testing, Inc.59 MB 210 E. F. Burlingham & Sons 124 BAR Fa6 US1 Barenbrug Research60 MB 211 E. F. Burlingham & Sons 125 BAR Fa6 US2U Barenbrug Research61 MB 212 E. F. Burlingham & Sons 126 BAR Fa6 US3 Barenbrug Research62 MB 213 E. F. Burlingham & Sons 127 BAR Fa6D USA Barenbrug Research63 MB 214 E. F. Burlingham & Sons 128 Shenandoah Standard Entry64 MB 215 E. F. Burlingham & Sons 129 Genesis ProSeeds Marketing65 MB 216 E. F. Burlingham & Sons
Proceedings of the UCR Turfgrass and Landscape Management Research Conference and Field Day, September 1998
23
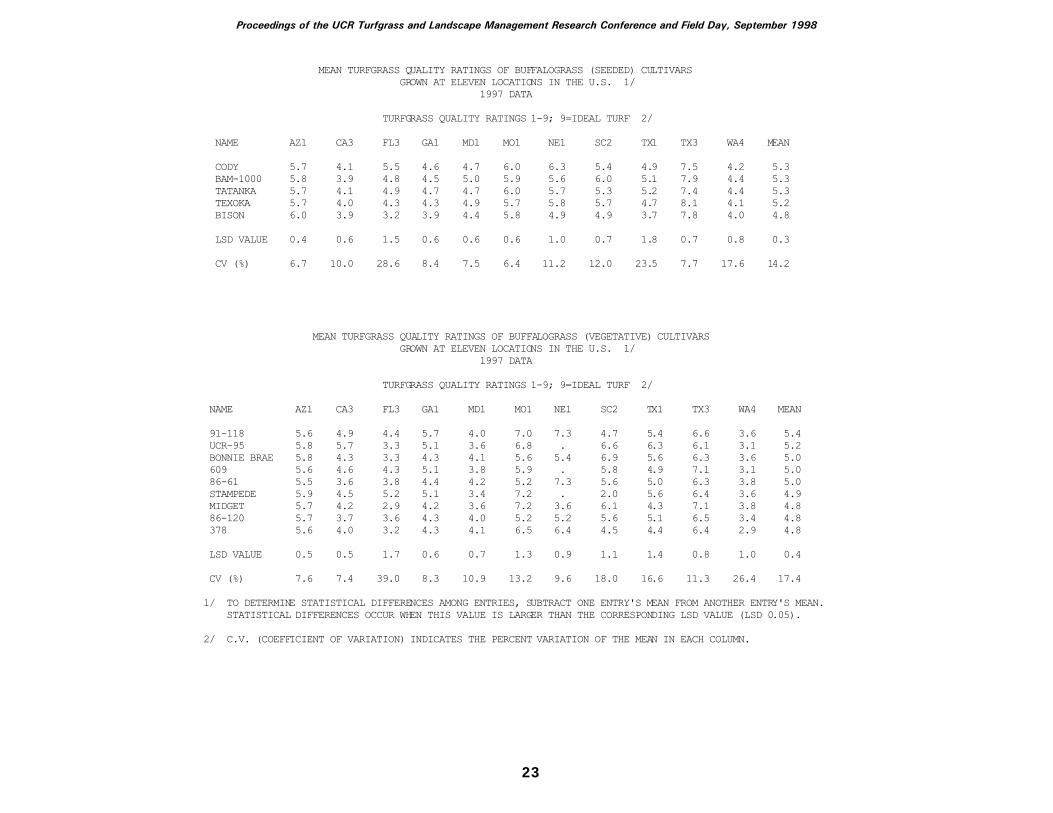
MEAN TURFGRASS QUALITY RATINGS OF BUFFALOGRASS (SEEDED) CULTIVARS GROWN AT ELEVEN LOCATIONS IN THE U.S. 1/ 1997 DATA
TURFGRASS QUALITY RATINGS 1-9; 9=IDEAL TURF 2/
NAME AZ1 CA3 FL3 GA1 MD1 MO1 NE1 SC2 TX1 TX3 WA4 MEAN
CODY 5.7 4.1 5.5 4.6 4.7 6.0 6.3 5.4 4.9 7.5 4.2 5.3 BAM-1000 5.8 3.9 4.8 4.5 5.0 5.9 5.6 6.0 5.1 7.9 4.4 5.3 TATANKA 5.7 4.1 4.9 4.7 4.7 6.0 5.7 5.3 5.2 7.4 4.4 5.3 TEXOKA 5.7 4.0 4.3 4.3 4.9 5.7 5.8 5.7 4.7 8.1 4.1 5.2 BISON 6.0 3.9 3.2 3.9 4.4 5.8 4.9 4.9 3.7 7.8 4.0 4.8
LSD VALUE 0.4 0.6 1.5 0.6 0.6 0.6 1.0 0.7 1.8 0.7 0.8 0.3
CV (%) 6.7 10.0 28.6 8.4 7.5 6.4 11.2 12.0 23.5 7.7 17.6 14.2
MEAN TURFGRASS QUALITY RATINGS OF BUFFALOGRASS (VEGETATIVE) CULTIVARS GROWN AT ELEVEN LOCATIONS IN THE U.S. 1/ 1997 DATA
TURFGRASS QUALITY RATINGS 1-9; 9=IDEAL TURF 2/
NAME AZ1 CA3 FL3 GA1 MD1 MO1 NE1 SC2 TX1 TX3 WA4 MEAN
91-118 5.6 4.9 4.4 5.7 4.0 7.0 7.3 4.7 5.4 6.6 3.6 5.4 UCR-95 5.8 5.7 3.3 5.1 3.6 6.8 . 6.6 6.3 6.1 3.1 5.2 BONNIE BRAE 5.8 4.3 3.3 4.3 4.1 5.6 5.4 6.9 5.6 6.3 3.6 5.0 609 5.6 4.6 4.3 5.1 3.8 5.9 . 5.8 4.9 7.1 3.1 5.0 86-61 5.5 3.6 3.8 4.4 4.2 5.2 7.3 5.6 5.0 6.3 3.8 5.0 STAMPEDE 5.9 4.5 5.2 5.1 3.4 7.2 . 2.0 5.6 6.4 3.6 4.9 MIDGET 5.7 4.2 2.9 4.2 3.6 7.2 3.6 6.1 4.3 7.1 3.8 4.8 86-120 5.7 3.7 3.6 4.3 4.0 5.2 5.2 5.6 5.1 6.5 3.4 4.8 378 5.6 4.0 3.2 4.3 4.1 6.5 6.4 4.5 4.4 6.4 2.9 4.8
LSD VALUE 0.5 0.5 1.7 0.6 0.7 1.3 0.9 1.1 1.4 0.8 1.0 0.4
CV (%) 7.6 7.4 39.0 8.3 10.9 13.2 9.6 18.0 16.6 11.3 26.4 17.4
1/ TO DETERMINE STATISTICAL DIFFERENCES AMONG ENTRIES, SUBTRACT ONE ENTRY'S MEAN FROM ANOTHER ENTRY'S MEAN. STATISTICAL DIFFERENCES OCCUR WHEN THIS VALUE IS LARGER THAN THE CORRESPONDING LSD VALUE (LSD 0.05).
2/ C.V. (COEFFICIENT OF VARIATION) INDICATES THE PERCENT VARIATION OF THE MEAN IN EACH COLUMN.
Proceedings of the UCR Turfgrass and Landscape Management Research Conference and Field Day, September 1998
24
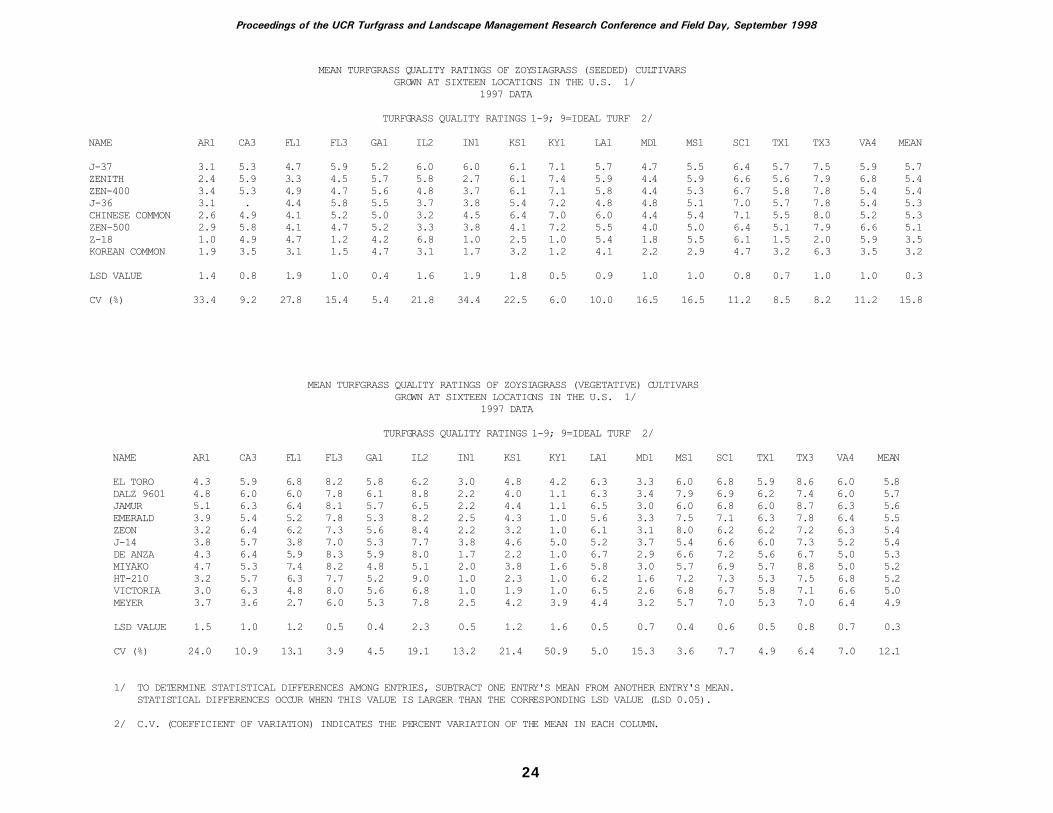
MEAN TURFGRASS QUALITY RATINGS OF ZOYSIAGRASS (SEEDED) CULTIVARS GROWN AT SIXTEEN LOCATIONS IN THE U.S. 1/ 1997 DATA
TURFGRASS QUALITY RATINGS 1-9; 9=IDEAL TURF 2/
NAME AR1 CA3 FL1 FL3 GA1 IL2 IN1 KS1 KY1 LA1 MD1 MS1 SC1 TX1 TX3 VA4 MEAN
J-37 3.1 5.3 4.7 5.9 5.2 6.0 6.0 6.1 7.1 5.7 4.7 5.5 6.4 5.7 7.5 5.9 5.7 ZENITH 2.4 5.9 3.3 4.5 5.7 5.8 2.7 6.1 7.4 5.9 4.4 5.9 6.6 5.6 7.9 6.8 5.4 ZEN-400 3.4 5.3 4.9 4.7 5.6 4.8 3.7 6.1 7.1 5.8 4.4 5.3 6.7 5.8 7.8 5.4 5.4 J-36 3.1 . 4.4 5.8 5.5 3.7 3.8 5.4 7.2 4.8 4.8 5.1 7.0 5.7 7.8 5.4 5.3 CHINESE COMMON 2.6 4.9 4.1 5.2 5.0 3.2 4.5 6.4 7.0 6.0 4.4 5.4 7.1 5.5 8.0 5.2 5.3 ZEN-500 2.9 5.8 4.1 4.7 5.2 3.3 3.8 4.1 7.2 5.5 4.0 5.0 6.4 5.1 7.9 6.6 5.1 Z-18 1.0 4.9 4.7 1.2 4.2 6.8 1.0 2.5 1.0 5.4 1.8 5.5 6.1 1.5 2.0 5.9 3.5 KOREAN COMMON 1.9 3.5 3.1 1.5 4.7 3.1 1.7 3.2 1.2 4.1 2.2 2.9 4.7 3.2 6.3 3.5 3.2
LSD VALUE 1.4 0.8 1.9 1.0 0.4 1.6 1.9 1.8 0.5 0.9 1.0 1.0 0.8 0.7 1.0 1.0 0.3
CV (%) 33.4 9.2 27.8 15.4 5.4 21.8 34.4 22.5 6.0 10.0 16.5 16.5 11.2 8.5 8.2 11.2 15.8
MEAN TURFGRASS QUALITY RATINGS OF ZOYSIAGRASS (VEGETATIVE) CULTIVARS GROWN AT SIXTEEN LOCATIONS IN THE U.S. 1/ 1997 DATA
TURFGRASS QUALITY RATINGS 1-9; 9=IDEAL TURF 2/
NAME AR1 CA3 FL1 FL3 GA1 IL2 IN1 KS1 KY1 LA1 MD1 MS1 SC1 TX1 TX3 VA4 MEAN
EL TORO 4.3 5.9 6.8 8.2 5.8 6.2 3.0 4.8 4.2 6.3 3.3 6.0 6.8 5.9 8.6 6.0 5.8 DALZ 9601 4.8 6.0 6.0 7.8 6.1 8.8 2.2 4.0 1.1 6.3 3.4 7.9 6.9 6.2 7.4 6.0 5.7 JAMUR 5.1 6.3 6.4 8.1 5.7 6.5 2.2 4.4 1.1 6.5 3.0 6.0 6.8 6.0 8.7 6.3 5.6 EMERALD 3.9 5.4 5.2 7.8 5.3 8.2 2.5 4.3 1.0 5.6 3.3 7.5 7.1 6.3 7.8 6.4 5.5 ZEON 3.2 6.4 6.2 7.3 5.6 8.4 2.2 3.2 1.0 6.1 3.1 8.0 6.2 6.2 7.2 6.3 5.4 J-14 3.8 5.7 3.8 7.0 5.3 7.7 3.8 4.6 5.0 5.2 3.7 5.4 6.6 6.0 7.3 5.2 5.4 DE ANZA 4.3 6.4 5.9 8.3 5.9 8.0 1.7 2.2 1.0 6.7 2.9 6.6 7.2 5.6 6.7 5.0 5.3 MIYAKO 4.7 5.3 7.4 8.2 4.8 5.1 2.0 3.8 1.6 5.8 3.0 5.7 6.9 5.7 8.8 5.0 5.2 HT-210 3.2 5.7 6.3 7.7 5.2 9.0 1.0 2.3 1.0 6.2 1.6 7.2 7.3 5.3 7.5 6.8 5.2 VICTORIA 3.0 6.3 4.8 8.0 5.6 6.8 1.0 1.9 1.0 6.5 2.6 6.8 6.7 5.8 7.1 6.6 5.0 MEYER 3.7 3.6 2.7 6.0 5.3 7.8 2.5 4.2 3.9 4.4 3.2 5.7 7.0 5.3 7.0 6.4 4.9
LSD VALUE 1.5 1.0 1.2 0.5 0.4 2.3 0.5 1.2 1.6 0.5 0.7 0.4 0.6 0.5 0.8 0.7 0.3
CV (%) 24.0 10.9 13.1 3.9 4.5 19.1 13.2 21.4 50.9 5.0 15.3 3.6 7.7 4.9 6.4 7.0 12.1
1/ TO DETERMINE STATISTICAL DIFFERENCES AMONG ENTRIES, SUBTRACT ONE ENTRY'S MEAN FROM ANOTHER ENTRY'S MEAN. STATISTICAL DIFFERENCES OCCUR WHEN THIS VALUE IS LARGER THAN THE CORRESPONDING LSD VALUE (LSD 0.05).
2/ C.V. (COEFFICIENT OF VARIATION) INDICATES THE PERCENT VARIATION OF THE MEAN IN EACH COLUMN.
Proceedings of the UCR Turfgrass and Landscape Management Research Conference and Field Day, September 1998
25
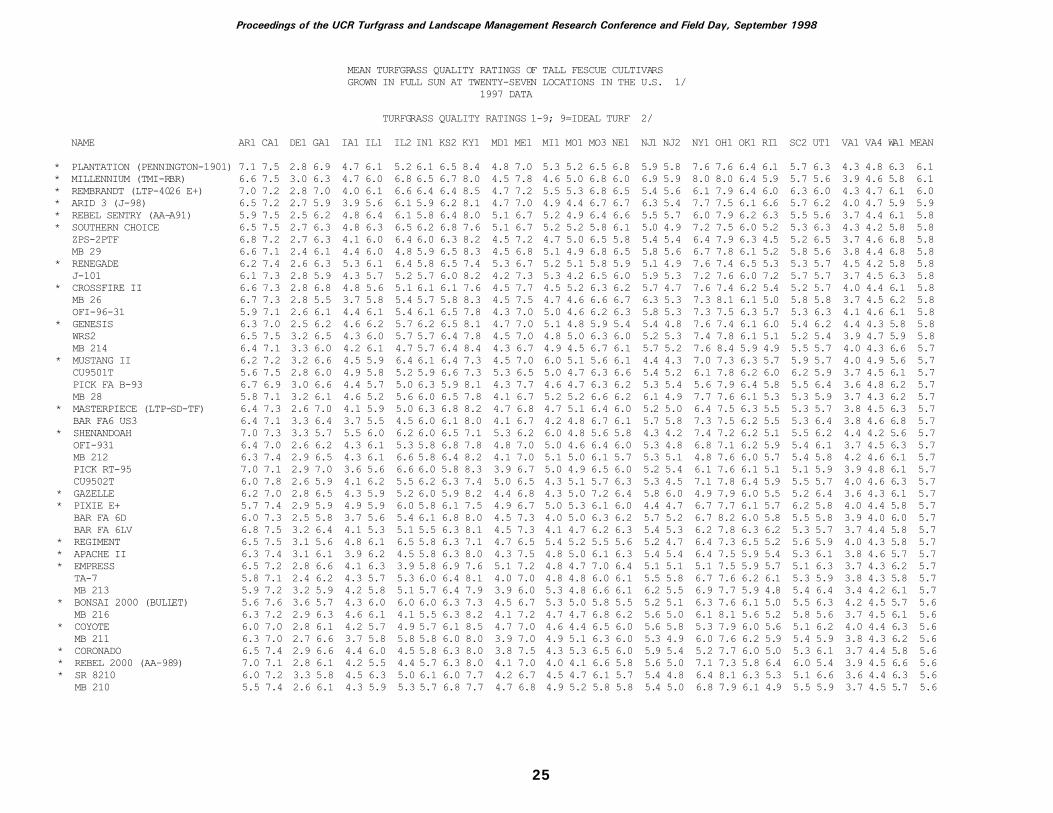
MEAN TURFGRASS QUALITY RATINGS OF TALL FESCUE CULTIVARS GROWN IN FULL SUN AT TWENTY-SEVEN LOCATIONS IN THE U.S. 1/ 1997 DATA
TURFGRASS QUALITY RATINGS 1-9; 9=IDEAL TURF 2/
NAME AR1 CA1 DE1 GA1 IA1 IL1 IL2 IN1 KS2 KY1 MD1 ME1 MI1 MO1 MO3 NE1 NJ1 NJ2 NY1 OH1 OK1 RI1 SC2 UT1 VA1 VA4 WA1 MEAN
* PLANTATION (PENNINGTON-1901) 7.1 7.5 2.8 6.9 4.7 6.1 5.2 6.1 6.5 8.4 4.8 7.0 5.3 5.2 6.5 6.8 5.9 5.8 7.6 7.6 6.4 6.1 5.7 6.3 4.3 4.8 6.3 6.1 * MILLENNIUM (TMI-RBR) 6.6 7.5 3.0 6.3 4.7 6.0 6.8 6.5 6.7 8.0 4.5 7.8 4.6 5.0 6.8 6.0 6.9 5.9 8.0 8.0 6.4 5.9 5.7 5.6 3.9 4.6 5.8 6.1 * REMBRANDT (LTP-4026 E+) 7.0 7.2 2.8 7.0 4.0 6.1 6.6 6.4 6.4 8.5 4.7 7.2 5.5 5.3 6.8 6.5 5.4 5.6 6.1 7.9 6.4 6.0 6.3 6.0 4.3 4.7 6.1 6.0 * ARID 3 (J-98) 6.5 7.2 2.7 5.9 3.9 5.6 6.1 5.9 6.2 8.1 4.7 7.0 4.9 4.4 6.7 6.7 6.3 5.4 7.7 7.5 6.1 6.6 5.7 6.2 4.0 4.7 5.9 5.9 * REBEL SENTRY (AA-A91) 5.9 7.5 2.5 6.2 4.8 6.4 6.1 5.8 6.4 8.0 5.1 6.7 5.2 4.9 6.4 6.6 5.5 5.7 6.0 7.9 6.2 6.3 5.5 5.6 3.7 4.4 6.1 5.8 * SOUTHERN CHOICE 6.5 7.5 2.7 6.3 4.8 6.3 6.5 6.2 6.8 7.6 5.1 6.7 5.2 5.2 5.8 6.1 5.0 4.9 7.2 7.5 6.0 5.2 5.3 6.3 4.3 4.2 5.8 5.8 ZPS-2PTF 6.8 7.2 2.7 6.3 4.1 6.0 6.4 6.0 6.3 8.2 4.5 7.2 4.7 5.0 6.5 5.8 5.4 5.4 6.4 7.9 6.3 4.5 5.2 6.5 3.7 4.6 6.8 5.8 MB 29 6.6 7.1 2.4 6.1 4.4 6.0 4.8 5.9 6.5 8.3 4.5 6.8 5.1 4.9 6.8 6.5 5.8 5.6 6.7 7.8 6.1 5.2 5.8 5.6 3.8 4.4 6.8 5.8 * RENEGADE 6.2 7.4 2.6 6.3 5.3 6.1 6.4 5.8 6.5 7.4 5.3 6.7 5.2 5.1 5.8 5.9 5.1 4.9 7.6 7.4 6.5 5.3 5.3 5.7 4.5 4.2 5.8 5.8 J-101 6.1 7.3 2.8 5.9 4.3 5.7 5.2 5.7 6.0 8.2 4.2 7.3 5.3 4.2 6.5 6.0 5.9 5.3 7.2 7.6 6.0 7.2 5.7 5.7 3.7 4.5 6.3 5.8 * CROSSFIRE II 6.6 7.3 2.8 6.8 4.8 5.6 5.1 6.1 6.1 7.6 4.5 7.7 4.5 5.2 6.3 6.2 5.7 4.7 7.6 7.4 6.2 5.4 5.2 5.7 4.0 4.4 6.1 5.8 MB 26 6.7 7.3 2.8 5.5 3.7 5.8 5.4 5.7 5.8 8.3 4.5 7.5 4.7 4.6 6.6 6.7 6.3 5.3 7.3 8.1 6.1 5.0 5.8 5.8 3.7 4.5 6.2 5.8 OFI-96-31 5.9 7.1 2.6 6.1 4.4 6.1 5.4 6.1 6.5 7.8 4.3 7.0 5.0 4.6 6.2 6.3 5.8 5.3 7.3 7.5 6.3 5.7 5.3 6.3 4.1 4.6 6.1 5.8 * GENESIS 6.3 7.0 2.5 6.2 4.6 6.2 5.7 6.2 6.5 8.1 4.7 7.0 5.1 4.8 5.9 5.4 5.4 4.8 7.6 7.4 6.1 6.0 5.4 6.2 4.4 4.3 5.8 5.8 WRS2 6.5 7.5 3.2 6.5 4.3 6.0 5.7 5.7 6.4 7.8 4.5 7.0 4.8 5.0 6.3 6.0 5.2 5.3 7.4 7.8 6.1 5.1 5.2 5.4 3.9 4.7 5.9 5.8 MB 214 6.4 7.1 3.3 6.0 4.2 6.1 4.7 5.7 6.4 8.4 4.3 6.7 4.9 4.5 6.7 6.1 5.7 5.2 7.6 8.4 5.9 4.9 5.5 5.7 4.0 4.3 6.6 5.7 * MUSTANG II 6.2 7.2 3.2 6.6 4.5 5.9 6.4 6.1 6.4 7.3 4.5 7.0 6.0 5.1 5.6 6.1 4.4 4.3 7.0 7.3 6.3 5.7 5.9 5.7 4.0 4.9 5.6 5.7 CU9501T 5.6 7.5 2.8 6.0 4.9 5.8 5.2 5.9 6.6 7.3 5.3 6.5 5.0 4.7 6.3 6.6 5.4 5.2 6.1 7.8 6.2 6.0 6.2 5.9 3.7 4.5 6.1 5.7 PICK FA B-93 6.7 6.9 3.0 6.6 4.4 5.7 5.0 6.3 5.9 8.1 4.3 7.7 4.6 4.7 6.3 6.2 5.3 5.4 5.6 7.9 6.4 5.8 5.5 6.4 3.6 4.8 6.2 5.7 MB 28 5.8 7.1 3.2 6.1 4.6 5.2 5.6 6.0 6.5 7.8 4.1 6.7 5.2 5.2 6.6 6.2 6.1 4.9 7.7 7.6 6.1 5.3 5.3 5.9 3.7 4.3 6.2 5.7 * MASTERPIECE (LTP-SD-TF) 6.4 7.3 2.6 7.0 4.1 5.9 5.0 6.3 6.8 8.2 4.7 6.8 4.7 5.1 6.4 6.0 5.2 5.0 6.4 7.5 6.3 5.5 5.3 5.7 3.8 4.5 6.3 5.7 BAR FA6 US3 6.4 7.1 3.3 6.4 3.7 5.5 4.5 6.0 6.1 8.0 4.1 6.7 4.2 4.8 6.7 6.1 5.7 5.8 7.3 7.5 6.2 5.5 5.3 6.4 3.8 4.6 6.8 5.7 * SHENANDOAH 7.0 7.3 3.3 5.7 5.5 6.0 6.2 6.0 6.5 7.1 5.3 6.2 6.0 4.8 5.6 5.8 4.3 4.2 7.4 7.2 6.2 5.1 5.5 6.2 4.4 4.2 5.6 5.7 OFI-931 6.4 7.0 2.6 6.2 4.3 6.1 5.3 5.8 6.8 7.8 4.8 7.0 5.0 4.6 6.4 6.0 5.3 4.8 6.8 7.1 6.2 5.9 5.4 6.1 3.7 4.5 6.3 5.7 MB 212 6.3 7.4 2.9 6.5 4.3 6.1 6.6 5.8 6.4 8.2 4.1 7.0 5.1 5.0 6.1 5.7 5.3 5.1 4.8 7.6 6.0 5.7 5.4 5.8 4.2 4.6 6.1 5.7 PICK RT-95 7.0 7.1 2.9 7.0 3.6 5.6 6.6 6.0 5.8 8.3 3.9 6.7 5.0 4.9 6.5 6.0 5.2 5.4 6.1 7.6 6.1 5.1 5.1 5.9 3.9 4.8 6.1 5.7 CU9502T 6.0 7.8 2.6 5.9 4.1 6.2 5.5 6.2 6.3 7.4 5.0 6.5 4.3 5.1 5.7 6.3 5.3 4.5 7.1 7.8 6.4 5.9 5.5 5.7 4.0 4.6 6.3 5.7 * GAZELLE 6.2 7.0 2.8 6.5 4.3 5.9 5.2 6.0 5.9 8.2 4.4 6.8 4.3 5.0 7.2 6.4 5.8 6.0 4.9 7.9 6.0 5.5 5.2 6.4 3.6 4.3 6.1 5.7 * PIXIE E+ 5.7 7.4 2.9 5.9 4.9 5.9 6.0 5.8 6.1 7.5 4.9 6.7 5.0 5.3 6.1 6.0 4.4 4.7 6.7 7.7 6.1 5.7 6.2 5.8 4.0 4.4 5.8 5.7 BAR FA 6D 6.0 7.3 2.5 5.8 3.7 5.6 5.4 6.1 6.8 8.0 4.5 7.3 4.0 5.0 6.3 6.2 5.7 5.2 6.7 8.2 6.0 5.8 5.5 5.8 3.9 4.0 6.0 5.7 BAR FA 6LV 6.8 7.5 3.2 6.4 4.1 5.3 5.1 5.5 6.3 8.1 4.5 7.3 4.1 4.7 6.2 6.3 5.4 5.3 6.2 7.8 6.3 6.2 5.3 5.7 3.7 4.4 5.8 5.7 * REGIMENT 6.5 7.5 3.1 5.6 4.8 6.1 6.5 5.8 6.3 7.1 4.7 6.5 5.4 5.2 5.5 5.6 5.2 4.7 6.4 7.3 6.5 5.2 5.6 5.9 4.0 4.3 5.8 5.7 * APACHE II 6.3 7.4 3.1 6.1 3.9 6.2 4.5 5.8 6.3 8.0 4.3 7.5 4.8 5.0 6.1 6.3 5.4 5.4 6.4 7.5 5.9 5.4 5.3 6.1 3.8 4.6 5.7 5.7 * EMPRESS 6.5 7.2 2.8 6.6 4.1 6.3 3.9 5.8 6.9 7.6 5.1 7.2 4.8 4.7 7.0 6.4 5.1 5.1 5.1 7.5 5.9 5.7 5.1 6.3 3.7 4.3 6.2 5.7 TA-7 5.8 7.1 2.4 6.2 4.3 5.7 5.3 6.0 6.4 8.1 4.0 7.0 4.8 4.8 6.0 6.1 5.5 5.8 6.7 7.6 6.2 6.1 5.3 5.9 3.8 4.3 5.8 5.7 MB 213 5.9 7.2 3.2 5.9 4.2 5.8 5.1 5.7 6.4 7.9 3.9 6.0 5.3 4.8 6.6 6.1 6.2 5.5 6.9 7.7 5.9 4.8 5.4 6.4 3.4 4.2 6.1 5.7 * BONSAI 2000 (BULLET) 5.6 7.6 3.6 5.7 4.3 6.0 6.0 6.0 6.3 7.3 4.5 6.7 5.3 5.0 5.8 5.5 5.2 5.1 6.3 7.6 6.1 5.0 5.5 6.3 4.2 4.5 5.7 5.6 MB 216 6.3 7.2 2.9 6.3 4.6 6.1 4.1 5.5 6.3 8.2 4.1 7.2 4.7 4.7 6.8 6.2 5.6 5.0 6.1 8.1 5.6 5.2 5.8 5.6 3.7 4.5 6.1 5.6 * COYOTE 6.0 7.0 2.8 6.1 4.2 5.7 4.9 5.7 6.1 8.5 4.7 7.0 4.6 4.4 6.5 6.0 5.6 5.8 5.3 7.9 6.0 5.6 5.1 6.2 4.0 4.4 6.3 5.6 MB 211 6.3 7.0 2.7 6.6 3.7 5.8 5.8 5.8 6.0 8.0 3.9 7.0 4.9 5.1 6.3 6.0 5.3 4.9 6.0 7.6 6.2 5.9 5.4 5.9 3.8 4.3 6.2 5.6 * CORONADO 6.5 7.4 2.9 6.6 4.4 6.0 4.5 5.8 6.3 8.0 3.8 7.5 4.3 5.3 6.5 6.0 5.9 5.4 5.2 7.7 6.0 5.0 5.3 6.1 3.7 4.4 5.8 5.6 * REBEL 2000 (AA-989) 7.0 7.1 2.8 6.1 4.2 5.5 4.4 5.7 6.3 8.0 4.1 7.0 4.0 4.1 6.6 5.8 5.6 5.0 7.1 7.3 5.8 6.4 6.0 5.4 3.9 4.5 6.6 5.6 * SR 8210 6.0 7.2 3.3 5.8 4.5 6.3 5.0 6.1 6.0 7.7 4.2 6.7 4.5 4.7 6.1 5.7 5.4 4.8 6.4 8.1 6.3 5.3 5.1 6.6 3.6 4.4 6.3 5.6 MB 210 5.5 7.4 2.6 6.1 4.3 5.9 5.3 5.7 6.8 7.7 4.7 6.8 4.9 5.2 5.8 5.8 5.4 5.0 6.8 7.9 6.1 4.9 5.5 5.9 3.7 4.5 5.7 5.6
Proceedings of the UCR Turfgrass and Landscape Management Research Conference and Field Day, September 1998
26
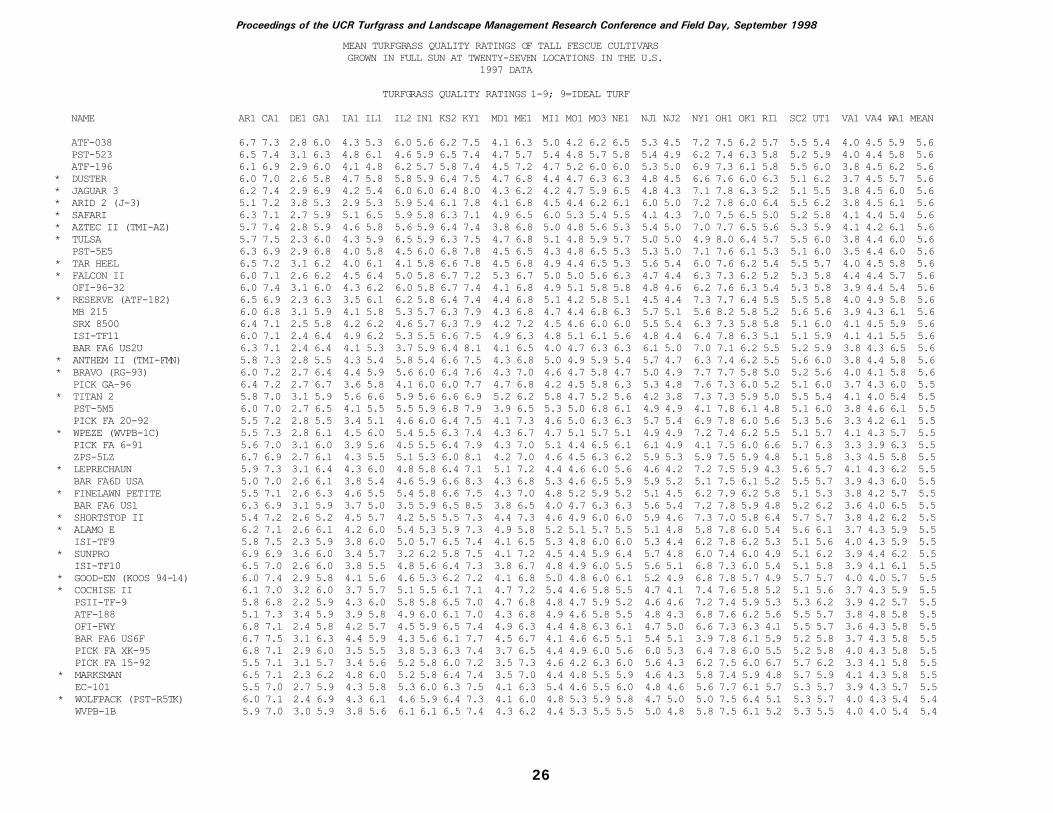
MEAN TURFGRASS QUALITY RATINGS OF TALL FESCUE CULTIVARS GROWN IN FULL SUN AT TWENTY-SEVEN LOCATIONS IN THE U.S. 1997 DATA
TURFGRASS QUALITY RATINGS 1-9; 9=IDEAL TURF
NAME AR1 CA1 DE1 GA1 IA1 IL1 IL2 IN1 KS2 KY1 MD1 ME1 MI1 MO1 MO3 NE1 NJ1 NJ2 NY1 OH1 OK1 RI1 SC2 UT1 VA1 VA4 WA1 MEAN
ATF-038 6.7 7.3 2.8 6.0 4.3 5.3 6.0 5.6 6.2 7.5 4.1 6.3 5.0 4.2 6.2 6.5 5.3 4.5 7.2 7.5 6.2 5.7 5.5 5.4 4.0 4.5 5.9 5.6 PST-523 6.5 7.4 3.1 6.3 4.8 6.1 4.6 5.9 6.5 7.4 4.7 5.7 5.4 4.8 5.7 5.8 5.4 4.9 6.2 7.4 6.3 5.8 5.2 5.9 4.0 4.4 5.8 5.6 ATF-196 6.1 6.9 2.9 6.0 4.1 4.8 6.2 5.7 5.8 7.4 4.5 7.2 4.7 5.2 6.0 6.0 5.3 5.0 6.9 7.3 6.1 5.8 5.5 6.0 3.8 4.5 6.2 5.6 * DUSTER 6.0 7.0 2.6 5.8 4.7 5.8 5.8 5.9 6.4 7.5 4.7 6.8 4.4 4.7 6.3 6.3 4.8 4.5 6.6 7.6 6.0 6.3 5.1 6.2 3.7 4.5 5.7 5.6 * JAGUAR 3 6.2 7.4 2.9 6.9 4.2 5.4 6.0 6.0 6.4 8.0 4.3 6.2 4.2 4.7 5.9 6.5 4.8 4.3 7.1 7.8 6.3 5.2 5.1 5.5 3.8 4.5 6.0 5.6 * ARID 2 (J-3) 5.1 7.2 3.8 5.3 2.9 5.3 5.9 5.4 6.1 7.8 4.1 6.8 4.5 4.4 6.2 6.1 6.0 5.0 7.2 7.8 6.0 6.4 5.5 6.2 3.8 4.5 6.1 5.6 * SAFARI 6.3 7.1 2.7 5.9 5.1 6.5 5.9 5.8 6.3 7.1 4.9 6.5 6.0 5.3 5.4 5.5 4.1 4.3 7.0 7.5 6.5 5.0 5.2 5.8 4.1 4.4 5.4 5.6 * AZTEC II (TMI-AZ) 5.7 7.4 2.8 5.9 4.6 5.8 5.6 5.9 6.4 7.4 3.8 6.8 5.0 4.8 5.6 5.3 5.4 5.0 7.0 7.7 6.5 5.6 5.3 5.9 4.1 4.2 6.1 5.6 * TULSA 5.7 7.5 2.3 6.0 4.3 5.9 6.5 5.9 6.3 7.5 4.7 6.8 5.1 4.8 5.9 5.7 5.0 5.0 4.9 8.0 6.4 5.7 5.5 6.0 3.8 4.4 6.0 5.6 PST-5E5 6.3 6.9 2.9 6.8 4.0 5.8 4.5 6.0 6.8 7.8 4.5 6.5 4.3 4.8 6.5 5.3 5.3 5.0 7.1 7.6 6.1 5.3 5.1 6.0 3.5 4.4 6.0 5.6 * TAR HEEL 6.5 7.2 3.1 6.2 4.0 6.1 4.1 5.8 6.6 7.8 4.5 6.8 4.9 4.4 6.5 5.3 5.6 5.4 6.0 7.6 6.2 5.4 5.5 5.7 4.0 4.5 5.8 5.6 * FALCON II 6.0 7.1 2.6 6.2 4.5 6.4 5.0 5.8 6.7 7.2 5.3 6.7 5.0 5.0 5.6 6.3 4.7 4.4 6.3 7.3 6.2 5.2 5.3 5.8 4.4 4.4 5.7 5.6 OFI-96-32 6.0 7.4 3.1 6.0 4.3 6.2 6.0 5.8 6.7 7.4 4.1 6.8 4.9 5.1 5.8 5.8 4.8 4.6 6.2 7.6 6.3 5.4 5.3 5.8 3.9 4.4 5.4 5.6 * RESERVE (ATF-182) 6.5 6.9 2.3 6.3 3.5 6.1 6.2 5.8 6.4 7.4 4.4 6.8 5.1 4.2 5.8 5.1 4.5 4.4 7.3 7.7 6.4 5.5 5.5 5.8 4.0 4.9 5.8 5.6 MB 215 6.0 6.8 3.1 5.9 4.1 5.8 5.3 5.7 6.3 7.9 4.3 6.8 4.7 4.4 6.8 6.3 5.7 5.1 5.6 8.2 5.8 5.2 5.6 5.6 3.9 4.3 6.1 5.6 SRX 8500 6.4 7.1 2.5 5.8 4.2 6.2 4.6 5.7 6.3 7.9 4.2 7.2 4.5 4.6 6.0 6.0 5.5 5.4 6.3 7.3 5.8 5.8 5.1 6.0 4.1 4.5 5.9 5.6 ISI-TF11 6.0 7.1 2.4 6.4 4.9 6.2 5.3 5.5 6.6 7.5 4.9 6.3 4.8 5.1 6.1 5.6 4.8 4.4 6.4 7.8 6.3 5.1 5.1 5.9 4.1 4.1 5.5 5.6 BAR FA6 US2U 6.3 7.1 2.4 6.4 4.1 5.3 3.7 5.9 6.4 8.1 4.1 6.5 4.0 4.7 6.3 6.3 6.1 5.0 7.0 7.1 6.2 5.5 5.2 5.9 3.8 4.3 6.5 5.6 * ANTHEM II (TMI-FMN) 5.8 7.3 2.8 5.5 4.3 5.4 5.8 5.4 6.6 7.5 4.3 6.8 5.0 4.9 5.9 5.4 5.7 4.7 6.3 7.4 6.2 5.5 5.6 6.0 3.8 4.4 5.8 5.6 * BRAVO (RG-93) 6.0 7.2 2.7 6.4 4.4 5.9 5.6 6.0 6.4 7.6 4.3 7.0 4.6 4.7 5.8 4.7 5.0 4.9 7.7 7.7 5.8 5.0 5.2 5.6 4.0 4.1 5.8 5.6 PICK GA-96 6.4 7.2 2.7 6.7 3.6 5.8 4.1 6.0 6.0 7.7 4.7 6.8 4.2 4.5 5.8 6.3 5.3 4.8 7.6 7.3 6.0 5.2 5.1 6.0 3.7 4.3 6.0 5.5 * TITAN 2 5.8 7.0 3.1 5.9 5.6 6.6 5.9 5.6 6.6 6.9 5.2 6.2 5.8 4.7 5.2 5.6 4.2 3.8 7.3 7.3 5.9 5.0 5.5 5.4 4.1 4.0 5.4 5.5 PST-5M5 6.0 7.0 2.7 6.5 4.1 5.5 5.5 5.9 6.8 7.9 3.9 6.5 5.3 5.0 6.8 6.1 4.9 4.9 4.1 7.8 6.1 4.8 5.1 6.0 3.8 4.6 6.1 5.5 PICK FA 20-92 5.5 7.2 2.8 5.5 3.4 5.1 4.6 6.0 6.4 7.5 4.1 7.3 4.6 5.0 6.3 6.3 5.7 5.4 6.9 7.8 6.0 5.6 5.3 5.6 3.3 4.2 6.1 5.5 * WPEZE (WVPB-1C) 5.5 7.3 2.8 6.1 4.5 6.0 5.4 5.5 6.3 7.4 4.3 6.7 4.7 5.1 5.7 5.1 4.9 4.9 7.2 7.4 6.2 5.5 5.1 5.7 4.1 4.3 5.7 5.5 PICK FA 6-91 5.6 7.0 3.1 6.0 3.9 5.6 4.5 5.5 6.4 7.9 4.3 7.0 5.1 4.4 6.5 6.1 6.1 4.9 4.1 7.5 6.0 6.6 5.7 6.3 3.3 3.9 6.3 5.5 ZPS-5LZ 6.7 6.9 2.7 6.1 4.3 5.5 5.1 5.3 6.0 8.1 4.2 7.0 4.6 4.5 6.3 6.2 5.9 5.3 5.9 7.5 5.9 4.8 5.1 5.8 3.3 4.5 5.8 5.5 * LEPRECHAUN 5.9 7.3 3.1 6.4 4.3 6.0 4.8 5.8 6.4 7.1 5.1 7.2 4.4 4.6 6.0 5.6 4.6 4.2 7.2 7.5 5.9 4.3 5.6 5.7 4.1 4.3 6.2 5.5 BAR FA6D USA 5.0 7.0 2.6 6.1 3.8 5.4 4.6 5.9 6.6 8.3 4.3 6.8 5.3 4.6 6.5 5.9 5.9 5.2 5.1 7.5 6.1 5.2 5.5 5.7 3.9 4.3 6.0 5.5 * FINELAWN PETITE 5.5 7.1 2.6 6.3 4.6 5.5 5.4 5.8 6.6 7.5 4.3 7.0 4.8 5.2 5.9 5.2 5.1 4.5 6.2 7.9 6.2 5.8 5.1 5.3 3.8 4.2 5.7 5.5 BAR FA6 US1 6.3 6.9 3.1 5.9 3.7 5.0 3.5 5.9 6.5 8.5 3.8 6.5 4.0 4.7 6.3 6.3 5.6 5.4 7.2 7.8 5.9 4.8 5.2 6.2 3.6 4.0 6.5 5.5 * SHORTSTOP II 5.4 7.2 2.6 5.2 4.5 5.7 4.2 5.5 5.5 7.3 4.4 7.3 4.6 4.9 6.0 6.0 5.9 4.6 7.3 7.0 5.8 6.4 5.7 5.7 3.8 4.2 6.2 5.5 * ALAMO E 6.2 7.1 2.6 6.1 4.2 6.0 5.4 5.3 5.9 7.3 4.9 5.8 5.2 5.1 5.7 5.5 5.1 4.8 5.8 7.8 6.0 5.4 5.6 6.1 3.7 4.3 5.9 5.5 ISI-TF9 5.8 7.5 2.3 5.9 3.8 6.0 5.0 5.7 6.5 7.4 4.1 6.5 5.3 4.8 6.0 6.0 5.3 4.4 6.2 7.8 6.2 5.3 5.1 5.6 4.0 4.3 5.9 5.5 * SUNPRO 6.9 6.9 3.6 6.0 3.4 5.7 3.2 6.2 5.8 7.5 4.1 7.2 4.5 4.4 5.9 6.4 5.7 4.8 6.0 7.4 6.0 4.9 5.1 6.2 3.9 4.4 6.2 5.5 ISI-TF10 6.5 7.0 2.6 6.0 3.8 5.5 4.8 5.6 6.4 7.3 3.8 6.7 4.8 4.9 6.0 5.5 5.6 5.1 6.8 7.3 6.0 5.4 5.1 5.8 3.9 4.1 6.1 5.5 * GOOD-EN (KOOS 94-14) 6.0 7.4 2.9 5.8 4.1 5.6 4.6 5.3 6.2 7.2 4.1 6.8 5.0 4.8 6.0 6.1 5.2 4.9 6.8 7.8 5.7 4.9 5.7 5.7 4.0 4.0 5.7 5.5 * COCHISE II 6.1 7.0 3.2 6.0 3.7 5.7 5.1 5.5 6.1 7.1 4.7 7.2 5.4 4.6 5.8 5.5 4.7 4.1 7.4 7.6 5.8 5.2 5.1 5.6 3.7 4.3 5.9 5.5 PSII-TF-9 5.8 6.8 2.2 5.9 4.3 6.0 5.8 5.8 6.5 7.0 4.7 6.8 4.8 4.7 5.9 5.2 4.6 4.6 7.2 7.4 5.9 5.3 5.3 6.2 3.9 4.2 5.7 5.5 ATF-188 5.1 7.3 3.4 5.9 3.9 5.8 4.9 6.0 6.1 7.0 4.3 6.8 4.9 4.6 5.8 5.5 4.8 4.3 6.8 7.6 6.2 5.6 5.5 5.7 3.8 4.8 5.8 5.5 OFI-FWY 6.8 7.1 2.4 5.8 4.2 5.7 4.5 5.9 6.5 7.4 4.9 6.3 4.4 4.8 6.3 6.1 4.7 5.0 6.6 7.3 6.3 4.1 5.5 5.7 3.6 4.3 5.8 5.5 BAR FA6 US6F 6.7 7.5 3.1 6.3 4.4 5.9 4.3 5.6 6.1 7.7 4.5 6.7 4.1 4.6 6.5 5.1 5.4 5.1 3.9 7.8 6.1 5.9 5.2 5.8 3.7 4.3 5.8 5.5 PICK FA XK-95 6.8 7.1 2.9 6.0 3.5 5.5 3.8 5.3 6.3 7.4 3.7 6.5 4.4 4.9 6.0 5.6 6.0 5.3 6.4 7.8 6.0 5.5 5.2 5.8 4.0 4.3 5.8 5.5 PICK FA 15-92 5.5 7.1 3.1 5.7 3.4 5.6 5.2 5.8 6.0 7.2 3.5 7.3 4.6 4.2 6.3 6.0 5.6 4.3 6.2 7.5 6.0 6.7 5.7 6.2 3.3 4.1 5.8 5.5 * MARKSMAN 6.5 7.1 2.3 6.2 4.8 6.0 5.2 5.8 6.4 7.4 3.5 7.0 4.4 4.8 5.5 5.9 4.6 4.3 5.8 7.4 5.9 4.8 5.7 5.9 4.1 4.3 5.8 5.5 EC-101 5.5 7.0 2.7 5.9 4.3 5.8 5.3 6.0 6.3 7.5 4.1 6.3 5.4 4.6 5.5 6.0 4.8 4.6 5.6 7.7 6.1 5.7 5.3 5.7 3.9 4.3 5.7 5.5 * WOLFPACK (PST-R5TK) 6.0 7.1 2.4 6.9 4.3 6.1 4.6 5.9 6.4 7.3 4.1 6.0 4.8 5.3 5.9 5.8 4.7 5.0 5.0 7.5 6.4 5.1 5.3 5.7 4.0 4.3 5.4 5.4 WVPB-1B 5.9 7.0 3.0 5.9 3.8 5.6 6.1 6.1 6.5 7.4 4.3 6.2 4.4 5.3 5.5 5.5 5.0 4.8 5.8 7.5 6.1 5.2 5.3 5.5 4.0 4.0 5.4 5.4
Proceedings of the UCR Turfgrass and Landscape Management Research Conference and Field Day, September 1998
27
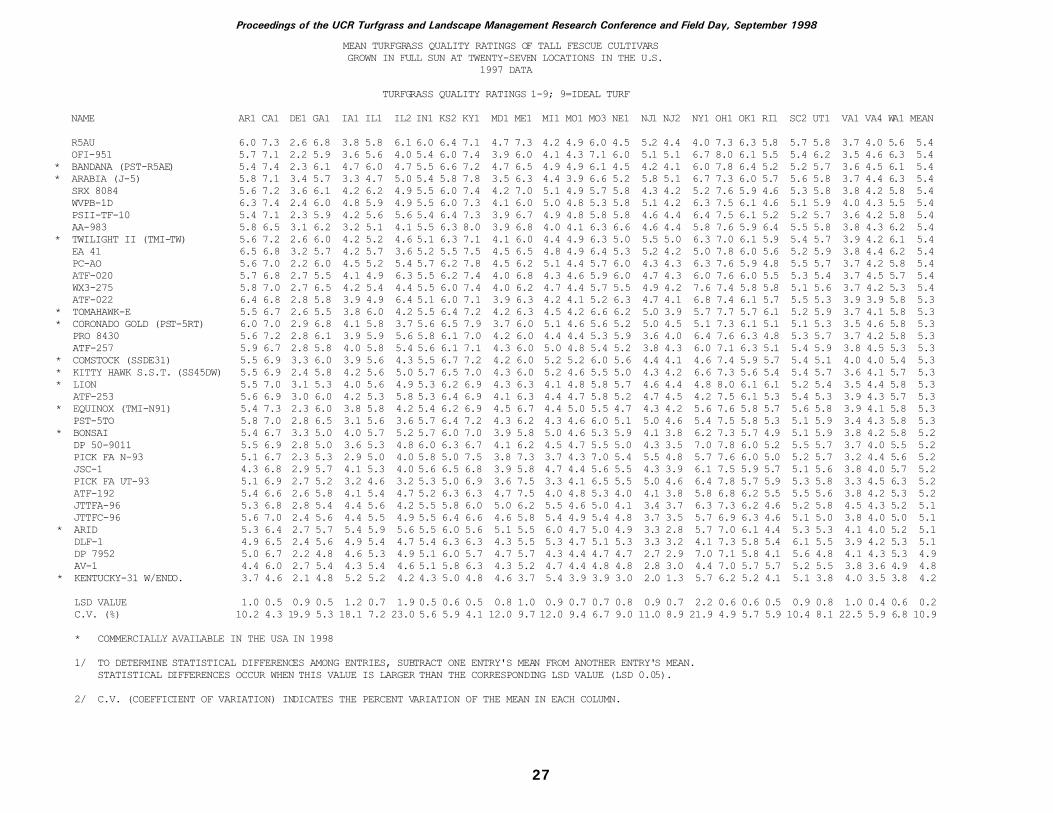
MEAN TURFGRASS QUALITY RATINGS OF TALL FESCUE CULTIVARS GROWN IN FULL SUN AT TWENTY-SEVEN LOCATIONS IN THE U.S. 1997 DATA
TURFGRASS QUALITY RATINGS 1-9; 9=IDEAL TURF
NAME AR1 CA1 DE1 GA1 IA1 IL1 IL2 IN1 KS2 KY1 MD1 ME1 MI1 MO1 MO3 NE1 NJ1 NJ2 NY1 OH1 OK1 RI1 SC2 UT1 VA1 VA4 WA1 MEAN
R5AU 6.0 7.3 2.6 6.8 3.8 5.8 6.1 6.0 6.4 7.1 4.7 7.3 4.2 4.9 6.0 4.5 5.2 4.4 4.0 7.3 6.3 5.8 5.7 5.8 3.7 4.0 5.6 5.4 OFI-951 5.7 7.1 2.2 5.9 3.6 5.6 4.0 5.4 6.0 7.4 3.9 6.0 4.1 4.3 7.1 6.0 5.1 5.1 6.7 8.0 6.1 5.5 5.4 6.2 3.5 4.6 6.3 5.4 * BANDANA (PST-R5AE) 5.4 7.4 2.3 6.1 4.7 6.0 4.7 5.5 6.6 7.2 4.7 6.5 4.9 4.9 6.1 4.5 4.2 4.1 6.0 7.8 6.4 5.2 5.2 5.7 3.6 4.5 6.1 5.4 * ARABIA (J-5) 5.8 7.1 3.4 5.7 3.3 4.7 5.0 5.4 5.8 7.8 3.5 6.3 4.4 3.9 6.6 5.2 5.8 5.1 6.7 7.3 6.0 5.7 5.6 5.8 3.7 4.4 6.3 5.4 SRX 8084 5.6 7.2 3.6 6.1 4.2 6.2 4.9 5.5 6.0 7.4 4.2 7.0 5.1 4.9 5.7 5.8 4.3 4.2 5.2 7.6 5.9 4.6 5.3 5.8 3.8 4.2 5.8 5.4 WVPB-1D 6.3 7.4 2.4 6.0 4.8 5.9 4.9 5.5 6.0 7.3 4.1 6.0 5.0 4.8 5.3 5.8 5.1 4.2 6.3 7.5 6.1 4.6 5.1 5.9 4.0 4.3 5.5 5.4 PSII-TF-10 5.4 7.1 2.3 5.9 4.2 5.6 5.6 5.4 6.4 7.3 3.9 6.7 4.9 4.8 5.8 5.8 4.6 4.4 6.4 7.5 6.1 5.2 5.2 5.7 3.6 4.2 5.8 5.4 AA-983 5.8 6.5 3.1 6.2 3.2 5.1 4.1 5.5 6.3 8.0 3.9 6.8 4.0 4.1 6.3 6.6 4.6 4.4 5.8 7.6 5.9 6.4 5.5 5.8 3.8 4.3 6.2 5.4 * TWILIGHT II (TMI-TW) 5.6 7.2 2.6 6.0 4.2 5.2 4.6 5.1 6.3 7.1 4.1 6.0 4.4 4.9 6.3 5.0 5.5 5.0 6.3 7.0 6.1 5.9 5.4 5.7 3.9 4.2 6.1 5.4 EA 41 6.5 6.8 3.2 5.7 4.2 5.7 3.6 5.2 5.5 7.5 4.5 6.5 4.8 4.9 6.4 5.3 5.2 4.2 5.0 7.8 6.0 5.6 5.2 5.9 3.8 4.4 6.2 5.4 PC-AO 5.6 7.0 2.2 6.0 4.5 5.2 5.4 5.7 6.2 7.8 4.5 6.2 5.1 4.4 5.7 6.0 4.3 4.3 6.3 7.6 5.9 4.8 5.5 5.7 3.7 4.2 5.8 5.4 ATF-020 5.7 6.8 2.7 5.5 4.1 4.9 6.3 5.5 6.2 7.4 4.0 6.8 4.3 4.6 5.9 6.0 4.7 4.3 6.0 7.6 6.0 5.5 5.3 5.4 3.7 4.5 5.7 5.4 WX3-275 5.8 7.0 2.7 6.5 4.2 5.4 4.4 5.5 6.0 7.4 4.0 6.2 4.7 4.4 5.7 5.5 4.9 4.2 7.6 7.4 5.8 5.8 5.1 5.6 3.7 4.2 5.3 5.4 ATF-022 6.4 6.8 2.8 5.8 3.9 4.9 6.4 5.1 6.0 7.1 3.9 6.3 4.2 4.1 5.2 6.3 4.7 4.1 6.8 7.4 6.1 5.7 5.5 5.3 3.9 3.9 5.8 5.3 * TOMAHAWK-E 5.5 6.7 2.6 5.5 3.8 6.0 4.2 5.5 6.4 7.2 4.2 6.3 4.5 4.2 6.6 6.2 5.0 3.9 5.7 7.7 5.7 6.1 5.2 5.9 3.7 4.1 5.8 5.3 * CORONADO GOLD (PST-5RT) 6.0 7.0 2.9 6.8 4.1 5.8 3.7 5.6 6.5 7.9 3.7 6.0 5.1 4.6 5.6 5.2 5.0 4.5 5.1 7.3 6.1 5.1 5.1 5.3 3.5 4.6 5.8 5.3 PRO 8430 5.6 7.2 2.8 6.1 3.9 5.9 5.6 5.8 6.1 7.0 4.2 6.0 4.4 4.4 5.3 5.9 3.6 4.0 6.4 7.6 6.3 4.8 5.3 5.7 3.7 4.2 5.8 5.3 ATF-257 5.9 6.7 2.8 5.8 4.0 5.8 5.4 5.6 6.1 7.1 4.3 6.0 5.0 4.8 5.4 5.2 3.8 4.3 6.0 7.1 6.3 5.1 5.4 5.9 3.8 4.5 5.3 5.3 * COMSTOCK (SSDE31) 5.5 6.9 3.3 6.0 3.9 5.6 4.3 5.5 6.7 7.2 4.2 6.0 5.2 5.2 6.0 5.6 4.4 4.1 4.6 7.4 5.9 5.7 5.4 5.1 4.0 4.0 5.4 5.3 * KITTY HAWK S.S.T. (SS45DW) 5.5 6.9 2.4 5.8 4.2 5.6 5.0 5.7 6.5 7.0 4.3 6.0 5.2 4.6 5.5 5.0 4.3 4.2 6.6 7.3 5.6 5.4 5.4 5.7 3.6 4.1 5.7 5.3 * LION 5.5 7.0 3.1 5.3 4.0 5.6 4.9 5.3 6.2 6.9 4.3 6.3 4.1 4.8 5.8 5.7 4.6 4.4 4.8 8.0 6.1 6.1 5.2 5.4 3.5 4.4 5.8 5.3 ATF-253 5.6 6.9 3.0 6.0 4.2 5.3 5.8 5.3 6.4 6.9 4.1 6.3 4.4 4.7 5.8 5.2 4.7 4.5 4.2 7.5 6.1 5.3 5.4 5.3 3.9 4.3 5.7 5.3 * EQUINOX (TMI-N91) 5.4 7.3 2.3 6.0 3.8 5.8 4.2 5.4 6.2 6.9 4.5 6.7 4.4 5.0 5.5 4.7 4.3 4.2 5.6 7.6 5.8 5.7 5.6 5.8 3.9 4.1 5.8 5.3 PST-5TO 5.8 7.0 2.8 6.5 3.1 5.6 3.6 5.7 6.4 7.2 4.3 6.2 4.3 4.6 6.0 5.1 5.0 4.6 5.4 7.5 5.8 5.3 5.1 5.9 3.4 4.3 5.8 5.3 * BONSAI 5.4 6.7 3.3 5.0 4.0 5.7 5.2 5.7 6.0 7.0 3.9 5.8 5.0 4.6 5.3 5.9 4.1 3.8 6.2 7.3 5.7 4.9 5.1 5.9 3.8 4.2 5.8 5.2 DP 50-9011 5.5 6.9 2.8 5.0 3.6 5.3 4.8 6.0 6.3 6.7 4.1 6.2 4.5 4.7 5.5 5.0 4.3 3.5 7.0 7.8 6.0 5.2 5.5 5.7 3.7 4.0 5.5 5.2 PICK FA N-93 5.1 6.7 2.3 5.3 2.9 5.0 4.0 5.8 5.0 7.5 3.8 7.3 3.7 4.3 7.0 5.4 5.5 4.8 5.7 7.6 6.0 5.0 5.2 5.7 3.2 4.4 5.6 5.2 JSC-1 4.3 6.8 2.9 5.7 4.1 5.3 4.0 5.6 6.5 6.8 3.9 5.8 4.7 4.4 5.6 5.5 4.3 3.9 6.1 7.5 5.9 5.7 5.1 5.6 3.8 4.0 5.7 5.2 PICK FA UT-93 5.1 6.9 2.7 5.2 3.2 4.6 3.2 5.3 5.0 6.9 3.6 7.5 3.3 4.1 6.5 5.5 5.0 4.6 6.4 7.8 5.7 5.9 5.3 5.8 3.3 4.5 6.3 5.2 ATF-192 5.4 6.6 2.6 5.8 4.1 5.4 4.7 5.2 6.3 6.3 4.7 7.5 4.0 4.8 5.3 4.0 4.1 3.8 5.8 6.8 6.2 5.5 5.5 5.6 3.8 4.2 5.3 5.2 JTTFA-96 5.3 6.8 2.8 5.4 4.4 5.6 4.2 5.5 5.8 6.0 5.0 6.2 5.5 4.6 5.0 4.1 3.4 3.7 6.3 7.3 6.2 4.6 5.2 5.8 4.5 4.3 5.2 5.1 JTTFC-96 5.6 7.0 2.4 5.6 4.4 5.5 4.9 5.5 6.4 6.6 4.6 5.8 5.4 4.9 5.4 4.8 3.7 3.5 5.7 6.9 6.3 4.6 5.1 5.0 3.8 4.0 5.0 5.1 * ARID 5.3 6.4 2.7 5.7 5.4 5.9 5.6 5.5 6.0 5.6 5.1 5.5 6.0 4.7 5.0 4.9 3.3 2.8 5.7 7.0 6.1 4.4 5.3 5.3 4.1 4.0 5.2 5.1 DLF-1 4.9 6.5 2.4 5.6 4.9 5.4 4.7 5.4 6.3 6.3 4.3 5.5 5.3 4.7 5.1 5.3 3.3 3.2 4.1 7.3 5.8 5.4 6.1 5.5 3.9 4.2 5.3 5.1 DP 7952 5.0 6.7 2.2 4.8 4.6 5.3 4.9 5.1 6.0 5.7 4.7 5.7 4.3 4.4 4.7 4.7 2.7 2.9 7.0 7.1 5.8 4.1 5.6 4.8 4.1 4.3 5.3 4.9 AV-1 4.4 6.0 2.7 5.4 4.3 5.4 4.6 5.1 5.8 6.3 4.3 5.2 4.7 4.4 4.8 4.8 2.8 3.0 4.4 7.0 5.7 5.7 5.2 5.5 3.8 3.6 4.9 4.8 * KENTUCKY-31 W/ENDO. 3.7 4.6 2.1 4.8 5.2 5.2 4.2 4.3 5.0 4.8 4.6 3.7 5.4 3.9 3.9 3.0 2.0 1.3 5.7 6.2 5.2 4.1 5.1 3.8 4.0 3.5 3.8 4.2
LSD VALUE 1.0 0.5 0.9 0.5 1.2 0.7 1.9 0.5 0.6 0.5 0.8 1.0 0.9 0.7 0.7 0.8 0.9 0.7 2.2 0.6 0.6 0.5 0.9 0.8 1.0 0.4 0.6 0.2 C.V. (%) 10.2 4.3 19.9 5.3 18.1 7.2 23.0 5.6 5.9 4.1 12.0 9.7 12.0 9.4 6.7 9.0 11.0 8.9 21.9 4.9 5.7 5.9 10.4 8.1 22.5 5.9 6.8 10.9
* COMMERCIALLY AVAILABLE IN THE USA IN 1998
1/ TO DETERMINE STATISTICAL DIFFERENCES AMONG ENTRIES, SUBTRACT ONE ENTRY'S MEAN FROM ANOTHER ENTRY'S MEAN. STATISTICAL DIFFERENCES OCCUR WHEN THIS VALUE IS LARGER THAN THE CORRESPONDING LSD VALUE (LSD 0.05).
2/ C.V. (COEFFICIENT OF VARIATION) INDICATES THE PERCENT VARIATION OF THE MEAN IN EACH COLUMN.
Proceedings of the UCR Turfgrass and Landscape Management Research Conference and Field Day, September 1998
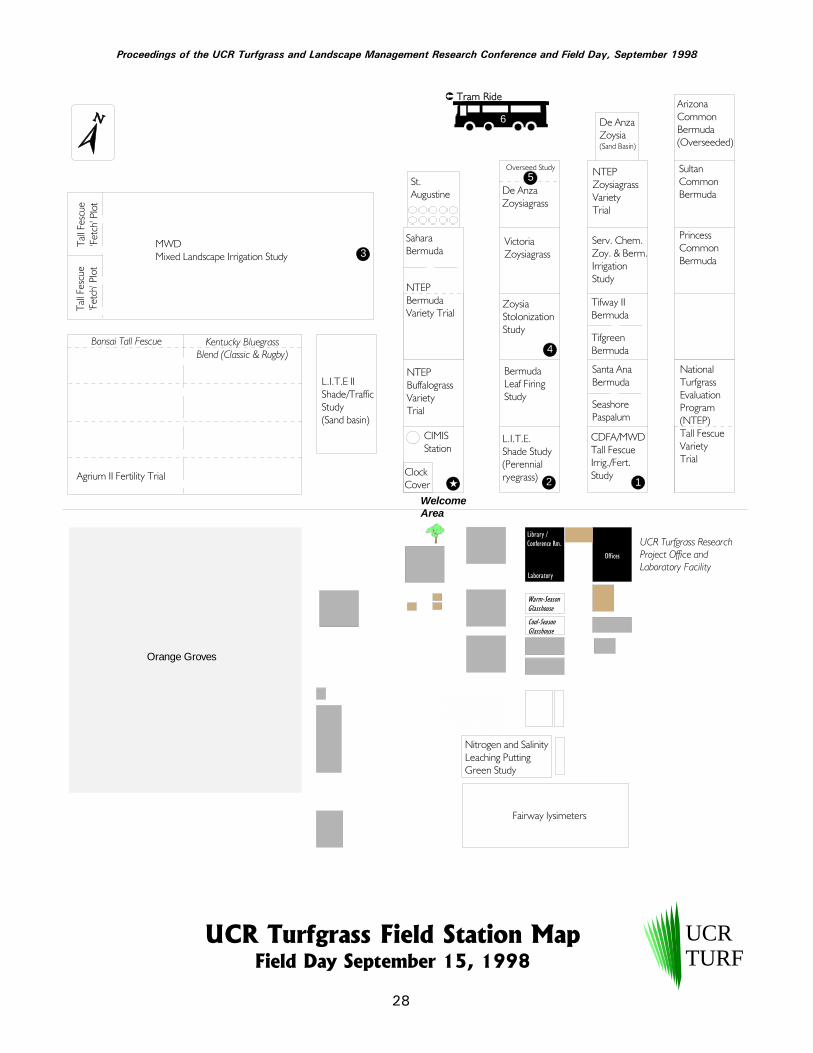
UCRTURF
L.I.T.E IIShade/TrafficStudy(Sand basin)
BermudaLeaf FiringStudy
SeashorePaspalum
VictoriaZoysiagrass
Fairway lysimeters
Nitrogen and Salinity Leaching Putting Green Study
UCR Turfgrass Research Project Office and Laboratory Facility
Warm-SeasonGlasshouse
Cool-SeasonGlasshouse
ArizonaCommonBermuda(Overseeded)
St.Augustine
Serv. Chem.Zoy. & Berm.Irrigation Study
NTEPZoysiagrassVarietyTrial
NTEPBermudaVariety Trial
NTEPBuffalograssVarietyTrial
L.I.T.E.Shade Study(Perennialryegrass)
CDFA/MWD Tall FescueIrrig./Fert.Study
CIMISStation
ClockCover
Orange Groves
MWD Mixed Landscape Irrigation Study
[De AnzaZoysiagrass
SultanCommonBermuda
PrincessCommonBermuda
Tifway IIBermuda
TifgreenBermuda
Santa AnaBermuda
SaharaBermuda
Kentucky BluegrassBlend (Classic & Rugby)
Bonsai Tall Fescue
De AnzaZoysia(Sand Basin)
Library /Conference Rm.
Laboratory
Offices
Tall
Fesc
ue'Fe
tch'
Plo
t
ZoysiaStolonizationStudy
NationalTurfgrassEvaluationProgram(NTEP)Tall FescueVarietyTrial
Overseed Study
Agrium II Fertility Trial
Tall
Fesc
ue'Fe
tch'
Plo
t
UCR Turfgrass Field Station MapField Day September 15, 1998
i
Welcome Area
12
3
4
5
6
Tram Ride
28
Proceedings of the UCR Turfgrass and Landscape Management Research Conference and Field Day, September 1998
29
TALL FESCUE IRRIGATION AND NUTRITION FIELD STUDY
Grant J. Klein1, William E. Richie1, Janet S. Hartin2, Victor A. Gibeault1, and Robert L. Green1
1Dept. of Botany and Plant Sciences, University of California, Riverside, CA 92521-0124 2University of California Cooperative Extension, San Bernardino and Los Angeles Counties
777 E. Rialto Avenue, San Bernardino, CA 92514 This project involves the study and development of best management practices (BMPs) for landscape water conservation and N-fertility efficiency on tall fescue, currently the most widely-planted turfgrass species in California. This 3-year field study will investigate irrigation treatments that are designed to test irrigating tall fescue at a defined annual amount (80% his-torical reference evapotranspiration [ETo] plus rain), with increased irrigation during the warm season to improve grass performance, and then proportionally adjusting the cool-season irriga-tion amount downward to make up for the additional warm-season irrigation. These treatments will be compared to irrigating tall fescue at a constant rate of 1) 80% historical ETo plus rain and 2) 80% ETo (real time) plus rain. In conjunction with the irrigation treatments, this study will investigate N-fertilizer treatments designed to test optimal annual N rates for tall fescue performance in terms of visual quality and drought stress tolerance, growth (clipping yields), and N uptake. We will also determine the influence of irrigation and N-fertilizer treatments on soil water con-tent and soil N status. In the course of the study, we will also conduct outreach activities, in-cluding trade journal publications and oral presentations, reflecting both the ongoing research and the importance of turfgrass BMPs in general. The presentations will evolve with the ongo-ing research and from audience evaluations, which will include an assessment of the current turfgrass management practices of the target audience, so suggestions can be made as to how such practices should be modified in order to meet the requirements of generally accepted BMPs for turfgrass irrigation and N fertilization. Upon completion, we hope to be able to pro-vide the necessary information for maintaining acceptable tall fescue, complying with land-scape water-use budgets, and efficiently applying N fertilizers. Considering that water use is the most important environmental issue in California, and that tall fescue is currently the most widely planted turfgrass species in the state, there is a high potential that BMPs developed from this project will have immediate and widespread adoption by professional turfgrass man-agers, personnel involved in the fertilizer industries, educators, consultants, as well as home-lawn owners. Project Objectives: 1. Test irrigating tall fescue at a defined annual amount (80% historical ETo plus rain) with in-
creased irrigation during the warm season to improve grass performance, and then propor-tionally adjusting the cool-season irrigation amount downward to make up for the addition of warm-season irrigation. These treatments will be compared to irrigating tall fescue at a constant rate of 1) 80% historical ETo plus rain and 2) 80% ETo (real time) plus rain.
2. In conjunction with irrigation treatments, test the influence of the annual N-fertility rate on the performance of tall fescue.
3. Quantify the effects of irrigation and N-fertility treatments on tall fescue visual appearance and drought stress tolerance, growth (clipping yield) and N uptake, along with treatment ef-fects on soil water content and soil N status.
This research is funded in part by the 1) State of California, Department of Food and Agriculture, Fertilizer Re-
search and Education Program, and 2) Metropolitan Water District of Southern California.
Proceedings of the UCR Turfgrass and Landscape Management Research Conference and Field Day, September 1998

30
4. Develop BMPs for tall fescue relating to turfgrass water conservation and N-fertilizer use
efficiency, which provide optimal performance in terms of visual quality and drought stress tolerance, growth (clipping yields), and N uptake.
5. Conduct outreach activities, including trade journal publications and oral presentations, em-phasizing the importance of turfgrass BMPs, and how to properly carry out these practices for turfgrass irrigation and N fertilization.
b
Figure 1. Plot plan for the tall fescue irrigation and N-fertility study.
N a a
a
c a a
aa
a
a
b a
bb b
b c
bb b
ba b
cc
c
a c b
c c
c
c
c c
A,B,C,D I, II, III
12 12-1 11 11-1 10 10-1
12-2 11-2 10-2
12-3 11-3 10-3
9 9-1 8 8-1 7-1 7
9-2 8-2 7-2
9-3 8-3 7-3
6 6-1 5-1 5 4-1 4
6-2 5-2 4-2
6-3 5-3 4-3
3-1 3 2 2-1 1 1-1
3-2 2-2 1-2
3-3 2-3 1-3
DI DII
CIIIDIII
CII CI
BIII
BII
BI
AIII
AII
AI
Proceedings of the UCR Turfgrass and Landscape Management Research Conference and Field Day, September 1998
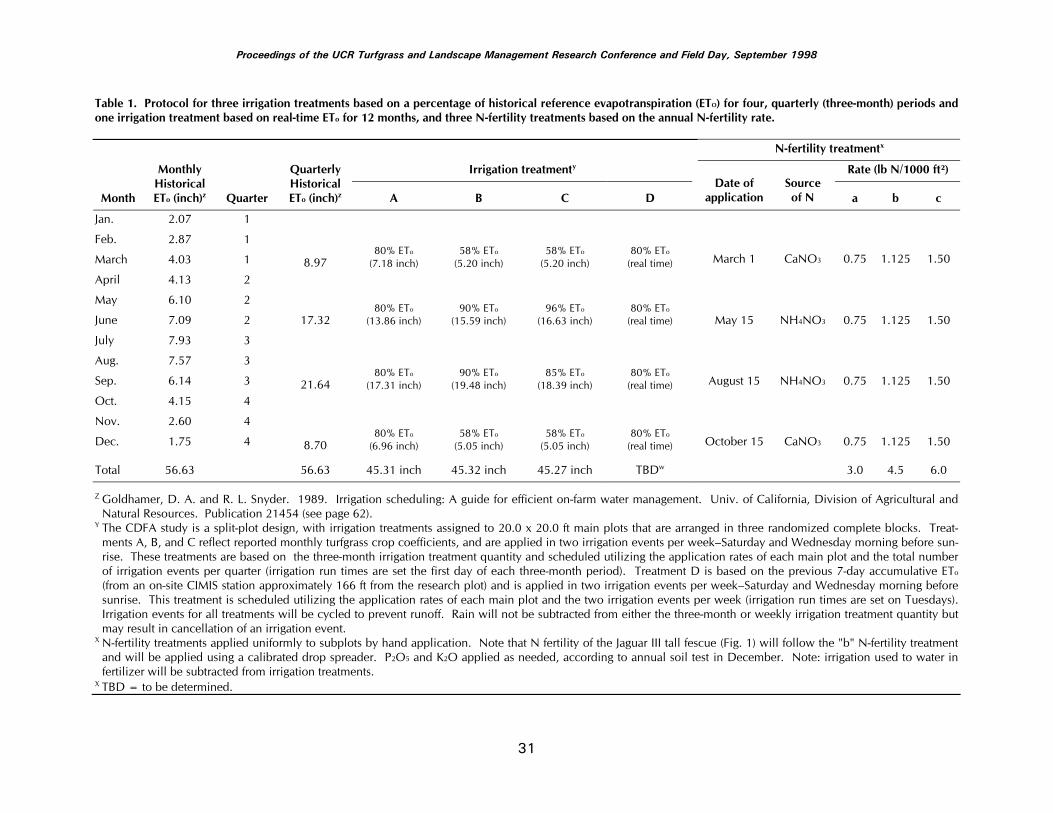
31
Table 1. Protocol for three irrigation treatments based on a percentage of historical reference evapotranspiration (ETO) for four, quarterly (three-month) periods and one irrigation treatment based on real-time ETo for 12 months, and three N-fertility treatments based on the annual N-fertility rate. N-fertility treatmentx
Irrigation treatmenty Rate (lb N/1000 ft²)
Month
Monthly Historical ETo (inch)z Quarter
Quarterly Historical ETo (inch)z A B C D
Date of application
Source of N a b c
Jan. 2.07 1
Feb. 2.87 1
March 4.03 1 8.97 80% ETo
(7.18 inch) 58% ETo
(5.20 inch) 58% ETo
(5.20 inch) 80% ETo
(real time) March 1 CaNO3 0.75 1.125 1.50
April 4.13 2
May 6.10 2
June 7.09 2 17.32 80% ETo
(13.86 inch) 90% ETo
(15.59 inch) 96% ETo
(16.63 inch) 80% ETo
(real time) May 15 NH4NO3 0.75 1.125 1.50
July 7.93 3
Aug. 7.57 3
Sep. 6.14 3 21.64 80% ETo
(17.31 inch) 90% ETo
(19.48 inch) 85% ETo
(18.39 inch) 80% ETo
(real time) August 15 NH4NO3 0.75 1.125 1.50
Oct. 4.15 4
Nov. 2.60 4
Dec. 1.75 4 8.70 80% ETo
(6.96 inch) 58% ETo
(5.05 inch) 58% ETo
(5.05 inch) 80% ETo
(real time) October 15 CaNO3 0.75 1.125 1.50
Total 56.63 56.63 45.31 inch 45.32 inch 45.27 inch TBDw 3.0 4.5 6.0
Z Goldhamer, D. A. and R. L. Snyder. 1989. Irrigation scheduling: A guide for efficient on-farm water management. Univ. of California, Division of Agricultural and Natural Resources. Publication 21454 (see page 62).
Y The CDFA study is a split-plot design, with irrigation treatments assigned to 20.0 x 20.0 ft main plots that are arranged in three randomized complete blocks. Treat-ments A, B, and C reflect reported monthly turfgrass crop coefficients, and are applied in two irrigation events per week–Saturday and Wednesday morning before sun-rise. These treatments are based on the three-month irrigation treatment quantity and scheduled utilizing the application rates of each main plot and the total number of irrigation events per quarter (irrigation run times are set the first day of each three-month period). Treatment D is based on the previous 7-day accumulative ETo (from an on-site CIMIS station approximately 166 ft from the research plot) and is applied in two irrigation events per week–Saturday and Wednesday morning before sunrise. This treatment is scheduled utilizing the application rates of each main plot and the two irrigation events per week (irrigation run times are set on Tuesdays). Irrigation events for all treatments will be cycled to prevent runoff. Rain will not be subtracted from either the three-month or weekly irrigation treatment quantity but may result in cancellation of an irrigation event.
X N-fertility treatments applied uniformly to subplots by hand application. Note that N fertility of the Jaguar III tall fescue (Fig. 1) will follow the "b" N-fertility treatment and will be applied using a calibrated drop spreader. P2O5 and K2O applied as needed, according to annual soil test in December. Note: irrigation used to water in fertilizer will be subtracted from irrigation treatments.
X TBD = to be determined.
Proceedings of the UCR Turfgrass and Landscape Management Research Conference and Field Day, September 1998
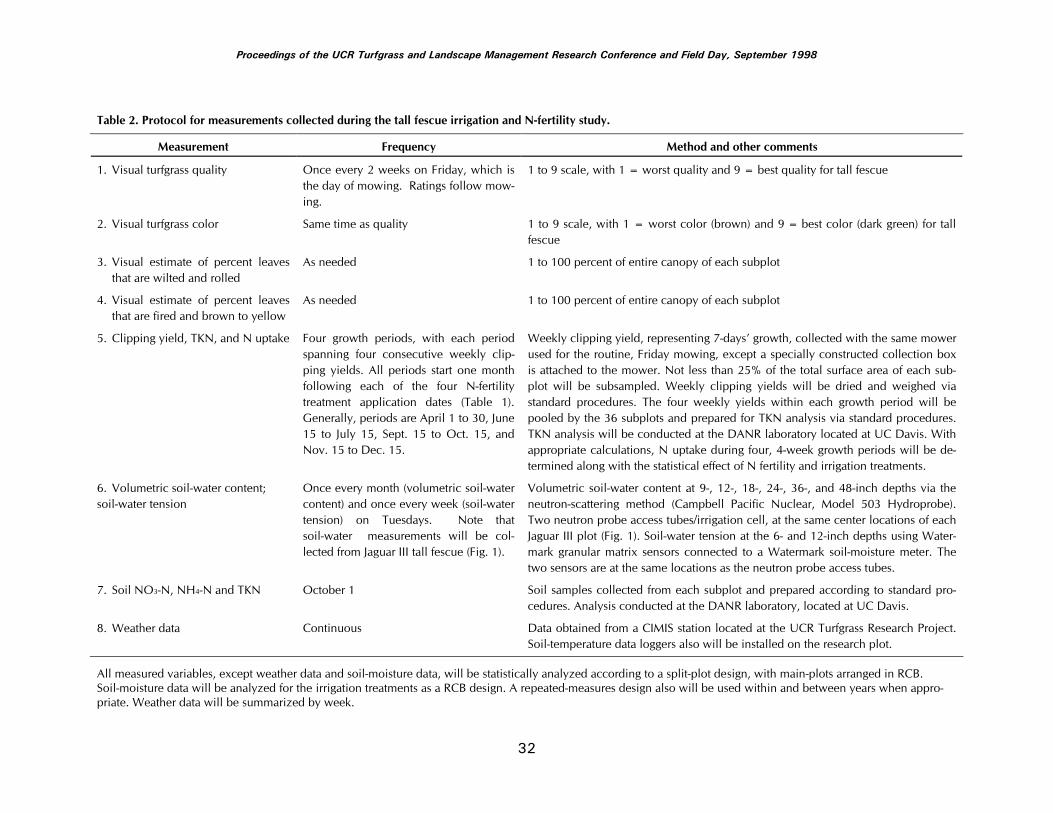
32
Table 2. Protocol for measurements collected during the tall fescue irrigation and N-fertility study.
Measurement
Frequency
Method and other comments 1. Visual turfgrass quality
Once every 2 weeks on Friday, which is the day of mowing. Ratings follow mow-ing.
1 to 9 scale, with 1 = worst quality and 9 = best quality for tall fescue
2. Visual turfgrass color
Same time as quality
1 to 9 scale, with 1 = worst color (brown) and 9 = best color (dark green) for tall fescue
3. Visual estimate of percent leaves
that are wilted and rolled
As needed
1 to 100 percent of entire canopy of each subplot
4. Visual estimate of percent leaves
that are fired and brown to yellow
As needed
1 to 100 percent of entire canopy of each subplot
5. Clipping yield, TKN, and N uptake
Four growth periods, with each period spanning four consecutive weekly clip-ping yields. All periods start one month following each of the four N-fertility treatment application dates (Table 1). Generally, periods are April 1 to 30, June 15 to July 15, Sept. 15 to Oct. 15, and Nov. 15 to Dec. 15.
Weekly clipping yield, representing 7-days’ growth, collected with the same mower used for the routine, Friday mowing, except a specially constructed collection box is attached to the mower. Not less than 25% of the total surface area of each sub-plot will be subsampled. Weekly clipping yields will be dried and weighed via standard procedures. The four weekly yields within each growth period will be pooled by the 36 subplots and prepared for TKN analysis via standard procedures. TKN analysis will be conducted at the DANR laboratory located at UC Davis. With appropriate calculations, N uptake during four, 4-week growth periods will be de-termined along with the statistical effect of N fertility and irrigation treatments.
6. Volumetric soil-water content; soil-water tension
Once every month (volumetric soil-water content) and once every week (soil-water tension) on Tuesdays. Note that soil-water measurements will be col-lected from Jaguar III tall fescue (Fig. 1).
Volumetric soil-water content at 9-, 12-, 18-, 24-, 36-, and 48-inch depths via the neutron-scattering method (Campbell Pacific Nuclear, Model 503 Hydroprobe). Two neutron probe access tubes/irrigation cell, at the same center locations of each Jaguar III plot (Fig. 1). Soil-water tension at the 6- and 12-inch depths using Water-mark granular matrix sensors connected to a Watermark soil-moisture meter. The two sensors are at the same locations as the neutron probe access tubes.
7. Soil NO3-N, NH4-N and TKN
October 1
Soil samples collected from each subplot and prepared according to standard pro-cedures. Analysis conducted at the DANR laboratory, located at UC Davis.
8. Weather data
Continuous
Data obtained from a CIMIS station located at the UCR Turfgrass Research Project. Soil-temperature data loggers also will be installed on the research plot.
All measured variables, except weather data and soil-moisture data, will be statistically analyzed according to a split-plot design, with main-plots arranged in RCB. Soil-moisture data will be analyzed for the irrigation treatments as a RCB design. A repeated-measures design also will be used within and between years when appro-priate. Weather data will be summarized by week.
Proceedings of the UCR Turfgrass and Landscape Management Research Conference and Field Day, September 1998
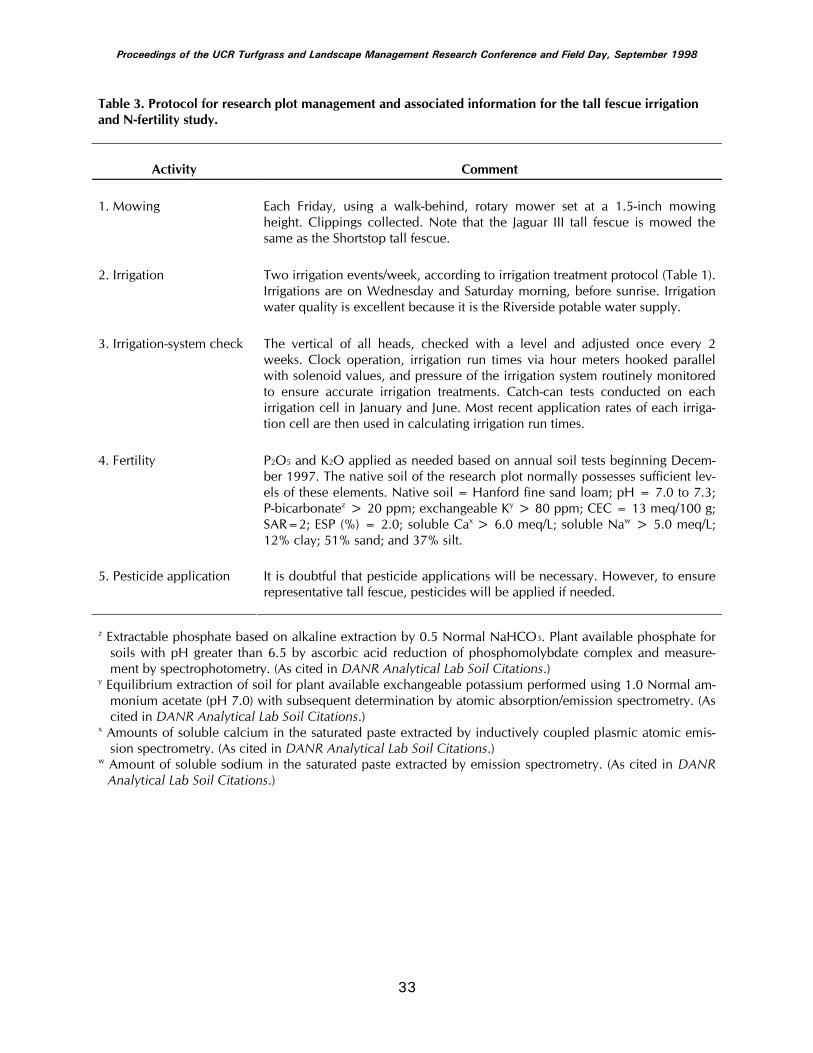
33
Table 3. Protocol for research plot management and associated information for the tall fescue irrigation and N-fertility study.
Activity Comment 1. Mowing Each Friday, using a walk-behind, rotary mower set at a 1.5-inch mowing
height. Clippings collected. Note that the Jaguar III tall fescue is mowed the same as the Shortstop tall fescue.
2. Irrigation Two irrigation events/week, according to irrigation treatment protocol (Table 1).
Irrigations are on Wednesday and Saturday morning, before sunrise. Irrigation water quality is excellent because it is the Riverside potable water supply.
3. Irrigation-system check The vertical of all heads, checked with a level and adjusted once every 2
weeks. Clock operation, irrigation run times via hour meters hooked parallel with solenoid values, and pressure of the irrigation system routinely monitored to ensure accurate irrigation treatments. Catch-can tests conducted on each irrigation cell in January and June. Most recent application rates of each irriga-tion cell are then used in calculating irrigation run times.
4. Fertility P2O5 and K2O applied as needed based on annual soil tests beginning Decem-
ber 1997. The native soil of the research plot normally possesses sufficient lev-els of these elements. Native soil = Hanford fine sand loam; pH = 7.0 to 7.3; P-bicarbonatez > 20 ppm; exchangeable Ky > 80 ppm; CEC = 13 meq/100 g; SAR=2; ESP (%) = 2.0; soluble Cax > 6.0 meq/L; soluble Naw > 5.0 meq/L; 12% clay; 51% sand; and 37% silt.
5. Pesticide application It is doubtful that pesticide applications will be necessary. However, to ensure
representative tall fescue, pesticides will be applied if needed.
z Extractable phosphate based on alkaline extraction by 0.5 Normal NaHCO3. Plant available phosphate for soils with pH greater than 6.5 by ascorbic acid reduction of phosphomolybdate complex and measure-ment by spectrophotometry. (As cited in DANR Analytical Lab Soil Citations.)
y Equilibrium extraction of soil for plant available exchangeable potassium performed using 1.0 Normal am-monium acetate (pH 7.0) with subsequent determination by atomic absorption/emission spectrometry. (As cited in DANR Analytical Lab Soil Citations.)
x Amounts of soluble calcium in the saturated paste extracted by inductively coupled plasmic atomic emis-sion spectrometry. (As cited in DANR Analytical Lab Soil Citations.)
w Amount of soluble sodium in the saturated paste extracted by emission spectrometry. (As cited in DANR Analytical Lab Soil Citations.)
Proceedings of the UCR Turfgrass and Landscape Management Research Conference and Field Day, September 1998
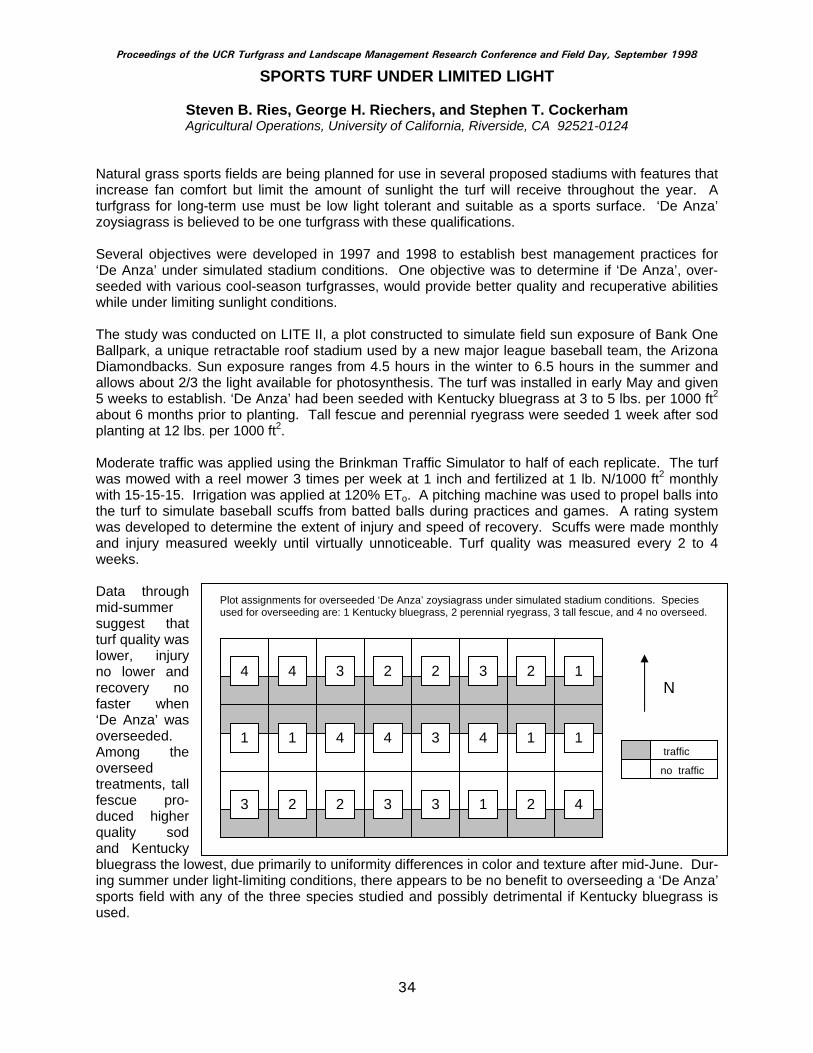
34
SPORTS TURF UNDER LIMITED LIGHT
Steven B. Ries, George H. Riechers, and Stephen T. Cockerham Agricultural Operations, University of California, Riverside, CA 92521-0124
Natural grass sports fields are being planned for use in several proposed stadiums with features that increase fan comfort but limit the amount of sunlight the turf will receive throughout the year. A turfgrass for long-term use must be low light tolerant and suitable as a sports surface. ‘De Anza’ zoysiagrass is believed to be one turfgrass with these qualifications. Several objectives were developed in 1997 and 1998 to establish best management practices for ‘De Anza’ under simulated stadium conditions. One objective was to determine if ‘De Anza’, over-seeded with various cool-season turfgrasses, would provide better quality and recuperative abilities while under limiting sunlight conditions. The study was conducted on LITE II, a plot constructed to simulate field sun exposure of Bank One Ballpark, a unique retractable roof stadium used by a new major league baseball team, the Arizona Diamondbacks. Sun exposure ranges from 4.5 hours in the winter to 6.5 hours in the summer and allows about 2/3 the light available for photosynthesis. The turf was installed in early May and given 5 weeks to establish. ‘De Anza’ had been seeded with Kentucky bluegrass at 3 to 5 lbs. per 1000 ft2 about 6 months prior to planting. Tall fescue and perennial ryegrass were seeded 1 week after sod planting at 12 lbs. per 1000 ft2. Moderate traffic was applied using the Brinkman Traffic Simulator to half of each replicate. The turf was mowed with a reel mower 3 times per week at 1 inch and fertilized at 1 lb. N/1000 ft2 monthly with 15-15-15. Irrigation was applied at 120% ETo. A pitching machine was used to propel balls into the turf to simulate baseball scuffs from batted balls during practices and games. A rating system was developed to determine the extent of injury and speed of recovery. Scuffs were made monthly and injury measured weekly until virtually unnoticeable. Turf quality was measured every 2 to 4 weeks. Data through mid-summer suggest that turf quality was lower, injury no lower and recovery no faster when ‘De Anza’ was overseeded. Among the overseed treatments, tall fescue pro-duced higher quality sod and Kentucky bluegrass the lowest, due primarily to uniformity differences in color and texture after mid-June. Dur-ing summer under light-limiting conditions, there appears to be no benefit to overseeding a ‘De Anza’ sports field with any of the three species studied and possibly detrimental if Kentucky bluegrass is used.
4 4 3 2 2 3 2 1
3 2 2 3 3 1 2 4
1 1 4 4 3 4 1 1
N
traffic
no traffic
Plot assignments for overseeded ‘De Anza’ zoysiagrass under simulated stadium conditions. Species used for overseeding are: 1 Kentucky bluegrass, 2 perennial ryegrass, 3 tall fescue, and 4 no overseed.
Proceedings of the UCR Turfgrass and Landscape Management Research Conference and Field Day, September 1998

35
IRRIGATION MANAGEMENT FOR MIXED LANDSCAPES
Dennis R. Pittenger1, 2 and William E. Richie2 1University of California Cooperative Extension, Southern Region and Los Angeles County
2Dept. of Botany and Plant Sciences University of California, Riverside, CA 92521-0124 Future water conservation strategies for landscapes will likely center on allocating a specific wa-ter budget for each irrigated site based on reference evapotranspiration (ETo). It will be very important for landscape architects, urban planners, landscape contractors, water agencies, and others to accurately estimate the water needs of entire landscaped areas and to have confi-dence in the CIMIS ETo values available for carrying out the calculations. Traditionally, estimat-ing a landscape’s water needs has relied on understanding the water needs of the individual plant species in a given planting, but it is unlikely that research-based information will ever be developed for each of the hundreds of plant species that are typically used in Southern Califor-nia landscapes. Thus, there is a need to develop a means for accurately estimating the irriga-tion needs of mixed landscape plantings based on reliable scientific data. The specific objectives for this long-term study are: 1. Determine if the water requirement and species’ responses of a landscape, composed of a
mixture of turfgrass, ground cover, and tree species with similar water requirements, are the same as a planting of equal area composed of a single species.
2. Test the validity of the “landscape coefficient method” of estimating water requirements of
landscape. 3. Characterize in quantitative terms the components and factors that determine the water re-
quirements of a newly established landscape. Three species of landscape plant materials are being evaluated for performance (visual and physiological measures) in 7 planting combinations each under two levels of irrigation in River-side, CA. Plant materials (tree: ‘Bradford’ pear - Pyrus calleryana ‘Bradford’; ground cover: spring cinquefoil - Potentilla tabernaemontanii; turfgrass: ‘Shortcut’ tall fescue - Festuca arun-dinacaea ‘Shortcut’) were planted in December 1995 and maintained under well-watered condi-tions from planting through July 1997 to obtain establishment (20 months). These three plant species are arranged in plots in monoculture and in all possible combinations of plant material as follows: 1. tree alone 2. groundcover alone 3. turfgrass alone 4. tree in center of groundcover 5. tree in center of turfgrass 6. ½ groundcover, ½ turf 7. tree in center with ½ groundcover, ½ turfgrass Irrigation treatments of 80% and 56% ETo (100% ETcrop and 70% ETcrop, respectively) were initi-ated August 7, 1997 and are applied twice per week based on the previous week’s (7 day) ETo accumulation obtained from CIMIS. These treatments were selected because they represent
Proceedings of the UCR Turfgrass and Landscape Management Research Conference and Field Day, September 1998
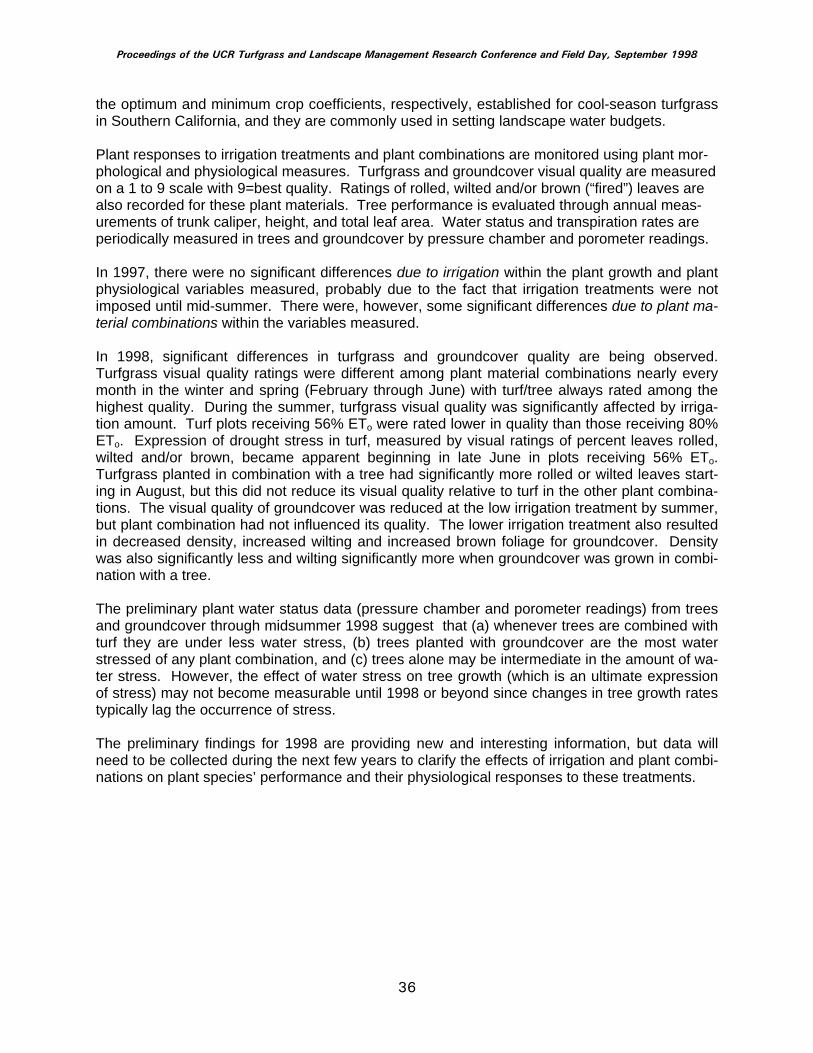
36
the optimum and minimum crop coefficients, respectively, established for cool-season turfgrass in Southern California, and they are commonly used in setting landscape water budgets. Plant responses to irrigation treatments and plant combinations are monitored using plant mor-phological and physiological measures. Turfgrass and groundcover visual quality are measured on a 1 to 9 scale with 9=best quality. Ratings of rolled, wilted and/or brown (“fired”) leaves are also recorded for these plant materials. Tree performance is evaluated through annual meas-urements of trunk caliper, height, and total leaf area. Water status and transpiration rates are periodically measured in trees and groundcover by pressure chamber and porometer readings. In 1997, there were no significant differences due to irrigation within the plant growth and plant physiological variables measured, probably due to the fact that irrigation treatments were not imposed until mid-summer. There were, however, some significant differences due to plant ma-terial combinations within the variables measured. In 1998, significant differences in turfgrass and groundcover quality are being observed. Turfgrass visual quality ratings were different among plant material combinations nearly every month in the winter and spring (February through June) with turf/tree always rated among the highest quality. During the summer, turfgrass visual quality was significantly affected by irriga-tion amount. Turf plots receiving 56% ETo were rated lower in quality than those receiving 80% ETo. Expression of drought stress in turf, measured by visual ratings of percent leaves rolled, wilted and/or brown, became apparent beginning in late June in plots receiving 56% ETo. Turfgrass planted in combination with a tree had significantly more rolled or wilted leaves start-ing in August, but this did not reduce its visual quality relative to turf in the other plant combina-tions. The visual quality of groundcover was reduced at the low irrigation treatment by summer, but plant combination had not influenced its quality. The lower irrigation treatment also resulted in decreased density, increased wilting and increased brown foliage for groundcover. Density was also significantly less and wilting significantly more when groundcover was grown in combi-nation with a tree. The preliminary plant water status data (pressure chamber and porometer readings) from trees and groundcover through midsummer 1998 suggest that (a) whenever trees are combined with turf they are under less water stress, (b) trees planted with groundcover are the most water stressed of any plant combination, and (c) trees alone may be intermediate in the amount of wa-ter stress. However, the effect of water stress on tree growth (which is an ultimate expression of stress) may not become measurable until 1998 or beyond since changes in tree growth rates typically lag the occurrence of stress. The preliminary findings for 1998 are providing new and interesting information, but data will need to be collected during the next few years to clarify the effects of irrigation and plant combi-nations on plant species’ performance and their physiological responses to these treatments.
Proceedings of the UCR Turfgrass and Landscape Management Research Conference and Field Day, September 1998
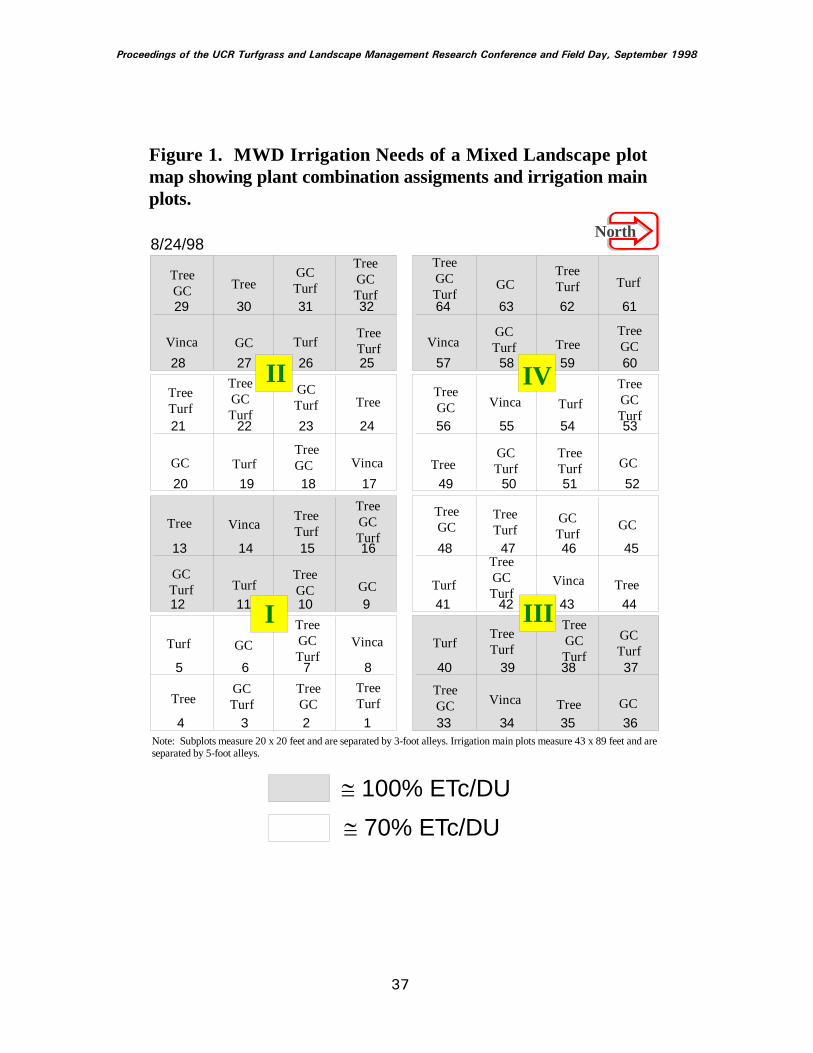
TreeGCTree
GCTurf
TreeGCTurf
GC TurfTreeTurf
TreeGC
TreeGCTurf
TreeGCTurf
GC
Turf
TreeTurf
TreeGC
Tree
GCTurf
TreeGCTurf
GC
Turf
TreeTurf
TreeGC Tree
GCTurf
TreeGCTurf
GC
TurfTreeTurf
TreeGC Tree
GCTurf
TreeGCTurf
Vinca GC TurfTreeTurf
TreeGC
TreeGCTurf
TreeGCTurf
GC Turf
TreeTurf
TreeGC
Tree
GCTurf
TreeGCTurf
GCTurf
TreeTurf
TreeGCTree
GCTurf
TreeGCTurf
GCTurf
TreeTurf
Figure 1. MWD Irrigation Needs of a Mixed Landscape plot map showing plant combination assigments and irrigation main plots.
29 30 31 32 64 63 62 61
28 27 26 25 57 58 59 60
21 22 23 24 56 55 54 53
20 19 18 17 49 50 51 52
13 14 15 16 48 47 46 45
12 11 10 9 41 42 43 44
5 6 7 8 40 39 38 37
4 3 2 1 33 34 35 36
North
I III
II IV
Note: Subplots measure 20 x 20 feet and are separated by 3-foot alleys. Irrigation main plots measure 43 x 89 feet and are separated by 5-foot alleys.
≅ 100% ETc/DU≅ 70% ETc/DU
8/24/98
Vinca
Vinca
Vinca
Vinca
Vinca
Vinca
Vinca
37
Proceedings of the UCR Turfgrass and Landscape Management Research Conference and Field Day, September 1998

38
INFLUENCE OF SEASON ON THE SUCCESS OF ZOYSIAGRASS STOLONIZATION
George H. Riechers Agricultural Operations, University of California, Riverside, CA 92521-0124
'De Anza' and 'Victoria' are hybrid zoysiagrasses patented and released by the University of Califor-nia in 1995. Both are the progeny of a cross of 'El Toro' (Zoysia japonica Steud.) with a (Z. matrella x Z. tenuifolia) hybrid. As hybrids (presumably sterile) they must be vegetatively propagated from sprigs or stolons. They are just beginning to reach the commercial market. While both 'De Anza' and 'Victoria' typically hold color under Southern California wintertime conditions much better than other zoysiagrasses, including 'El Toro', their growth is minimal at cool temperatures, and the rate of establishment from stolons planted after late summer is low. In the present experiment, 'De Anza', 'Victoria' and 'El Toro' zoysiagrasses have been planted monthly from May to October 1997, and in April 1998. The experiment is in 3 replicate blocks, with planting month randomly assigned within each block. Cultivars were randomly assigned to 5 x 5 foot plots within each block x month row. From 12/04/97 until 03/09/98 half of the plots were covered with ventilated, clear-plastic tarps (Table 1). These covers trap sufficient heat to warm the surface and soil several degrees. Establishment rate was measured monthly throughout the growing season by assessing percent cover. Growth, especially of the younger plots planted late the summer and autumn before, was sig-nificantly enhanced by tarping. Color of the turf in each plot was also rated in June, 1998 when a detrimental affect of tarping over the winter became apparent. Tarping temporarily, but statistically significantly decreased the visual rating score (on an arbitrary 1 to 10 scale) of all cultivars. Therefore, it can be con-cluded that while growth & establishment rate of these zoysiagrass culti-vars can be enhanced over their 'off-season' by the use of these clear, ventilated tarps, this in-creased growth is at the expense of appearance of the grasses.
Table 1: Plot assignments. D ='De Anza', E ='El Toro', V ='Victoria'. t = tarped winter months (12/04/97 to 03/09/98), o = open, no tarps. 05, 06, 07 . . . 10 = planting month, 1997; 04 = planted April 1998.
Block 1 Block 2 Block 3 10 Et Do Vt Vo Dt Eo 05 Et Dt Vo Do Vt Eo
08 Do Vt Vo Eo Dt Et 10 Et Dt Do Vo Vt Eo
06 Eo Do Dt Vo Et Vt 10 Vt Vo Dt Do Et Eo 07 Et Eo Do Vo Vt Dt 05 Et Vt Do Dt Vo Eo 09 Dt Vo Do Et Vt Eo 09 Dt Do Vo Vt Eo Et 08 Vo Do Vt Eo Et Dt 07 Et Do Eo Vt Vo Dt 05 Dt Vt Vo Do Et Eo 04 V E E D D V 04 E D D V V E 07 Vt Dt Et Vo Do Eo 06 Vt Dt Do Eo Vo Et 08 Et Dt Vo Eo Vt Do
04 V E E V D D 06 Et Eo Dt Vo Do Vt 09 Dt Vt Et Vo Eo Do
Proceedings of the UCR Turfgrass and Landscape Management Research Conference and Field Day, September 1998
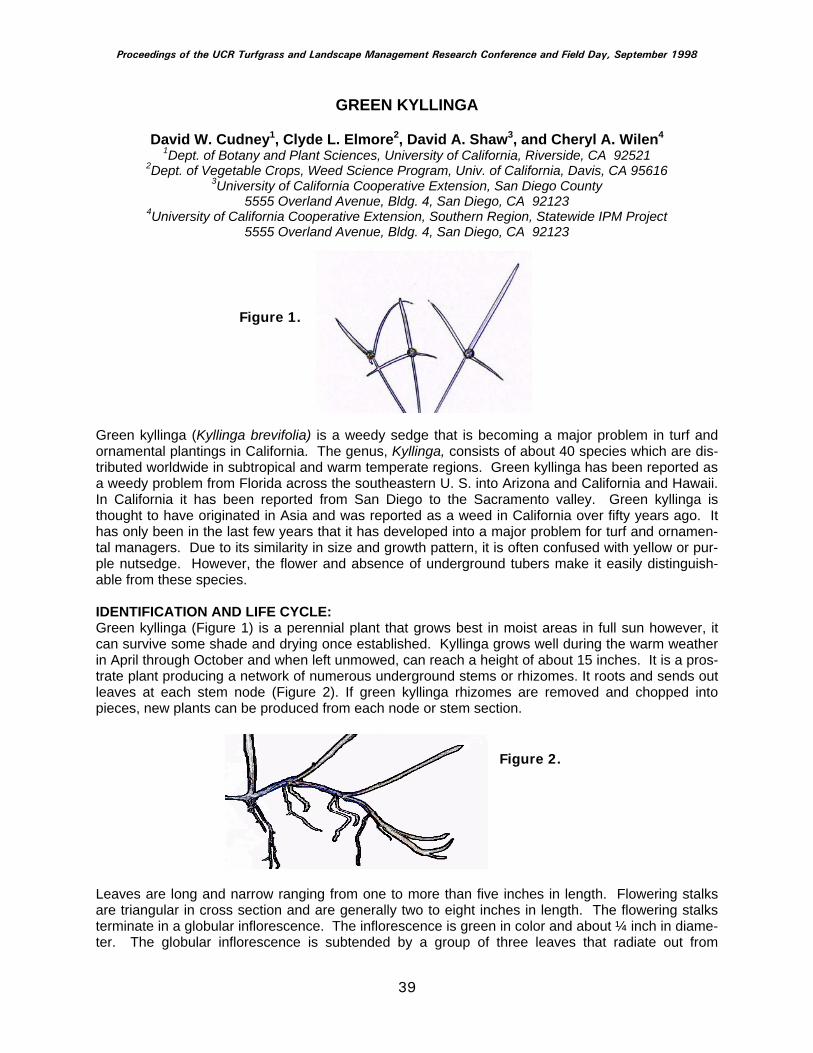
39
GREEN KYLLINGA
David W. Cudney1, Clyde L. Elmore2, David A. Shaw3, and Cheryl A. Wilen4 1Dept. of Botany and Plant Sciences, University of California, Riverside, CA 92521
2Dept. of Vegetable Crops, Weed Science Program, Univ. of California, Davis, CA 95616 3University of California Cooperative Extension, San Diego County
5555 Overland Avenue, Bldg. 4, San Diego, CA 92123 4University of California Cooperative Extension, Southern Region, Statewide IPM Project
5555 Overland Avenue, Bldg. 4, San Diego, CA 92123
Figure 1. Green kyllinga (Kyllinga brevifolia) is a weedy sedge that is becoming a major problem in turf and ornamental plantings in California. The genus, Kyllinga, consists of about 40 species which are dis-tributed worldwide in subtropical and warm temperate regions. Green kyllinga has been reported as a weedy problem from Florida across the southeastern U. S. into Arizona and California and Hawaii. In California it has been reported from San Diego to the Sacramento valley. Green kyllinga is thought to have originated in Asia and was reported as a weed in California over fifty years ago. It has only been in the last few years that it has developed into a major problem for turf and ornamen-tal managers. Due to its similarity in size and growth pattern, it is often confused with yellow or pur-ple nutsedge. However, the flower and absence of underground tubers make it easily distinguish-able from these species. IDENTIFICATION AND LIFE CYCLE: Green kyllinga (Figure 1) is a perennial plant that grows best in moist areas in full sun however, it can survive some shade and drying once established. Kyllinga grows well during the warm weather in April through October and when left unmowed, can reach a height of about 15 inches. It is a pros-trate plant producing a network of numerous underground stems or rhizomes. It roots and sends out leaves at each stem node (Figure 2). If green kyllinga rhizomes are removed and chopped into pieces, new plants can be produced from each node or stem section.
Figure 2. Leaves are long and narrow ranging from one to more than five inches in length. Flowering stalks are triangular in cross section and are generally two to eight inches in length. The flowering stalks terminate in a globular inflorescence. The inflorescence is green in color and about ¼ inch in diame-ter. The globular inflorescence is subtended by a group of three leaves that radiate out from
Proceedings of the UCR Turfgrass and Landscape Management Research Conference and Field Day, September 1998
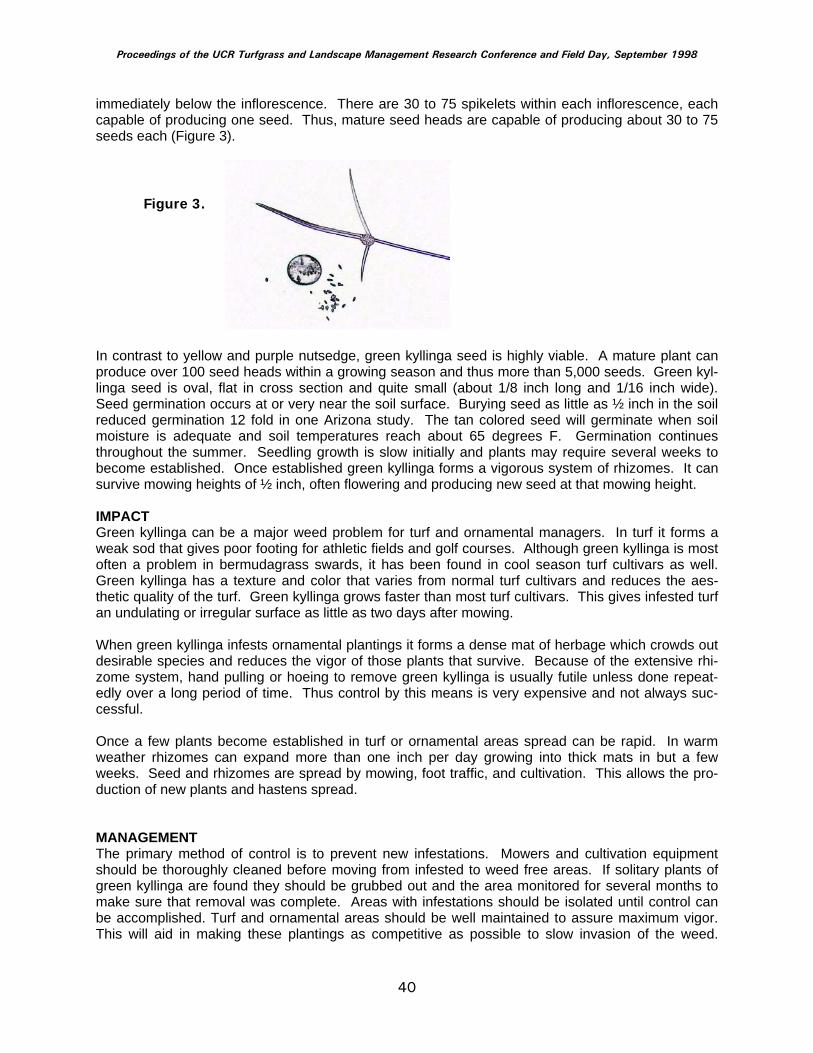
40
immediately below the inflorescence. There are 30 to 75 spikelets within each inflorescence, each capable of producing one seed. Thus, mature seed heads are capable of producing about 30 to 75 seeds each (Figure 3).
Figure 3. In contrast to yellow and purple nutsedge, green kyllinga seed is highly viable. A mature plant can produce over 100 seed heads within a growing season and thus more than 5,000 seeds. Green kyl-linga seed is oval, flat in cross section and quite small (about 1/8 inch long and 1/16 inch wide). Seed germination occurs at or very near the soil surface. Burying seed as little as ½ inch in the soil reduced germination 12 fold in one Arizona study. The tan colored seed will germinate when soil moisture is adequate and soil temperatures reach about 65 degrees F. Germination continues throughout the summer. Seedling growth is slow initially and plants may require several weeks to become established. Once established green kyllinga forms a vigorous system of rhizomes. It can survive mowing heights of ½ inch, often flowering and producing new seed at that mowing height. IMPACT Green kyllinga can be a major weed problem for turf and ornamental managers. In turf it forms a weak sod that gives poor footing for athletic fields and golf courses. Although green kyllinga is most often a problem in bermudagrass swards, it has been found in cool season turf cultivars as well. Green kyllinga has a texture and color that varies from normal turf cultivars and reduces the aes-thetic quality of the turf. Green kyllinga grows faster than most turf cultivars. This gives infested turf an undulating or irregular surface as little as two days after mowing. When green kyllinga infests ornamental plantings it forms a dense mat of herbage which crowds out desirable species and reduces the vigor of those plants that survive. Because of the extensive rhi-zome system, hand pulling or hoeing to remove green kyllinga is usually futile unless done repeat-edly over a long period of time. Thus control by this means is very expensive and not always suc-cessful. Once a few plants become established in turf or ornamental areas spread can be rapid. In warm weather rhizomes can expand more than one inch per day growing into thick mats in but a few weeks. Seed and rhizomes are spread by mowing, foot traffic, and cultivation. This allows the pro-duction of new plants and hastens spread. MANAGEMENT The primary method of control is to prevent new infestations. Mowers and cultivation equipment should be thoroughly cleaned before moving from infested to weed free areas. If solitary plants of green kyllinga are found they should be grubbed out and the area monitored for several months to make sure that removal was complete. Areas with infestations should be isolated until control can be accomplished. Turf and ornamental areas should be well maintained to assure maximum vigor. This will aid in making these plantings as competitive as possible to slow invasion of the weed.
Proceedings of the UCR Turfgrass and Landscape Management Research Conference and Field Day, September 1998
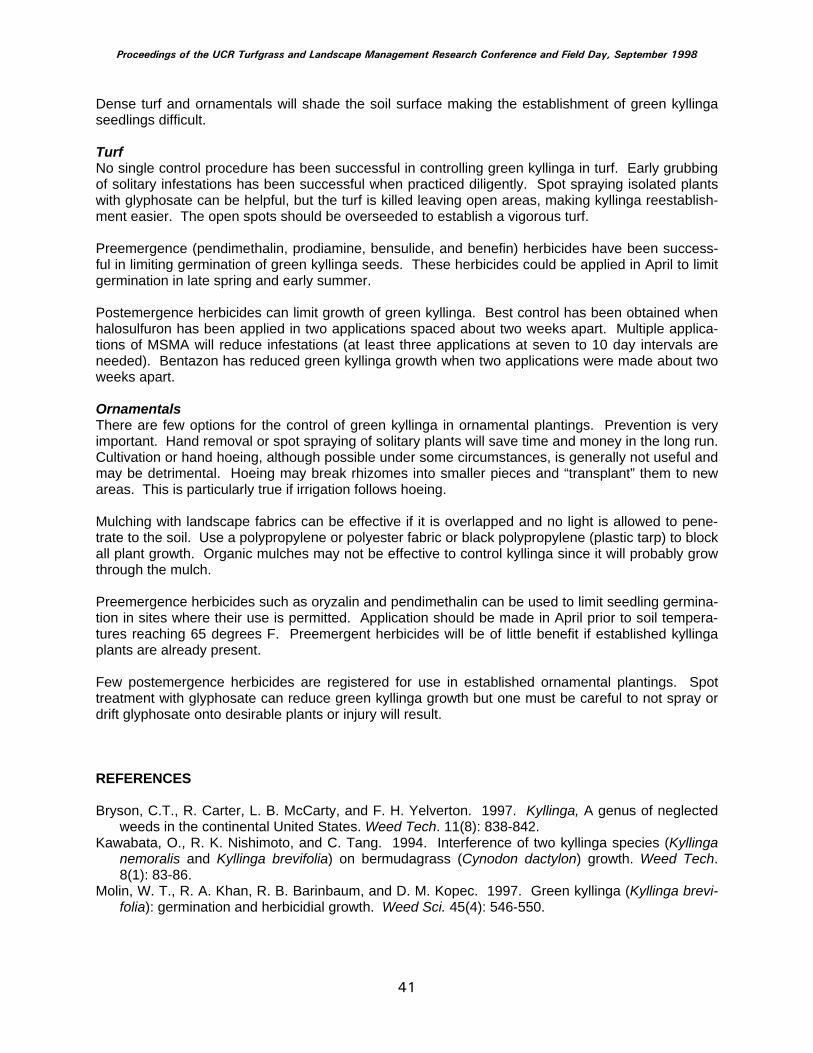
41
Dense turf and ornamentals will shade the soil surface making the establishment of green kyllinga seedlings difficult. Turf No single control procedure has been successful in controlling green kyllinga in turf. Early grubbing of solitary infestations has been successful when practiced diligently. Spot spraying isolated plants with glyphosate can be helpful, but the turf is killed leaving open areas, making kyllinga reestablish-ment easier. The open spots should be overseeded to establish a vigorous turf. Preemergence (pendimethalin, prodiamine, bensulide, and benefin) herbicides have been success-ful in limiting germination of green kyllinga seeds. These herbicides could be applied in April to limit germination in late spring and early summer. Postemergence herbicides can limit growth of green kyllinga. Best control has been obtained when halosulfuron has been applied in two applications spaced about two weeks apart. Multiple applica-tions of MSMA will reduce infestations (at least three applications at seven to 10 day intervals are needed). Bentazon has reduced green kyllinga growth when two applications were made about two weeks apart. Ornamentals There are few options for the control of green kyllinga in ornamental plantings. Prevention is very important. Hand removal or spot spraying of solitary plants will save time and money in the long run. Cultivation or hand hoeing, although possible under some circumstances, is generally not useful and may be detrimental. Hoeing may break rhizomes into smaller pieces and “transplant” them to new areas. This is particularly true if irrigation follows hoeing. Mulching with landscape fabrics can be effective if it is overlapped and no light is allowed to pene-trate to the soil. Use a polypropylene or polyester fabric or black polypropylene (plastic tarp) to block all plant growth. Organic mulches may not be effective to control kyllinga since it will probably grow through the mulch. Preemergence herbicides such as oryzalin and pendimethalin can be used to limit seedling germina-tion in sites where their use is permitted. Application should be made in April prior to soil tempera-tures reaching 65 degrees F. Preemergent herbicides will be of little benefit if established kyllinga plants are already present. Few postemergence herbicides are registered for use in established ornamental plantings. Spot treatment with glyphosate can reduce green kyllinga growth but one must be careful to not spray or drift glyphosate onto desirable plants or injury will result. REFERENCES Bryson, C.T., R. Carter, L. B. McCarty, and F. H. Yelverton. 1997. Kyllinga, A genus of neglected
weeds in the continental United States. Weed Tech. 11(8): 838-842. Kawabata, O., R. K. Nishimoto, and C. Tang. 1994. Interference of two kyllinga species (Kyllinga
nemoralis and Kyllinga brevifolia) on bermudagrass (Cynodon dactylon) growth. Weed Tech. 8(1): 83-86.
Molin, W. T., R. A. Khan, R. B. Barinbaum, and D. M. Kopec. 1997. Green kyllinga (Kyllinga brevi-folia): germination and herbicidial growth. Weed Sci. 45(4): 546-550.
Proceedings of the UCR Turfgrass and Landscape Management Research Conference and Field Day, September 1998
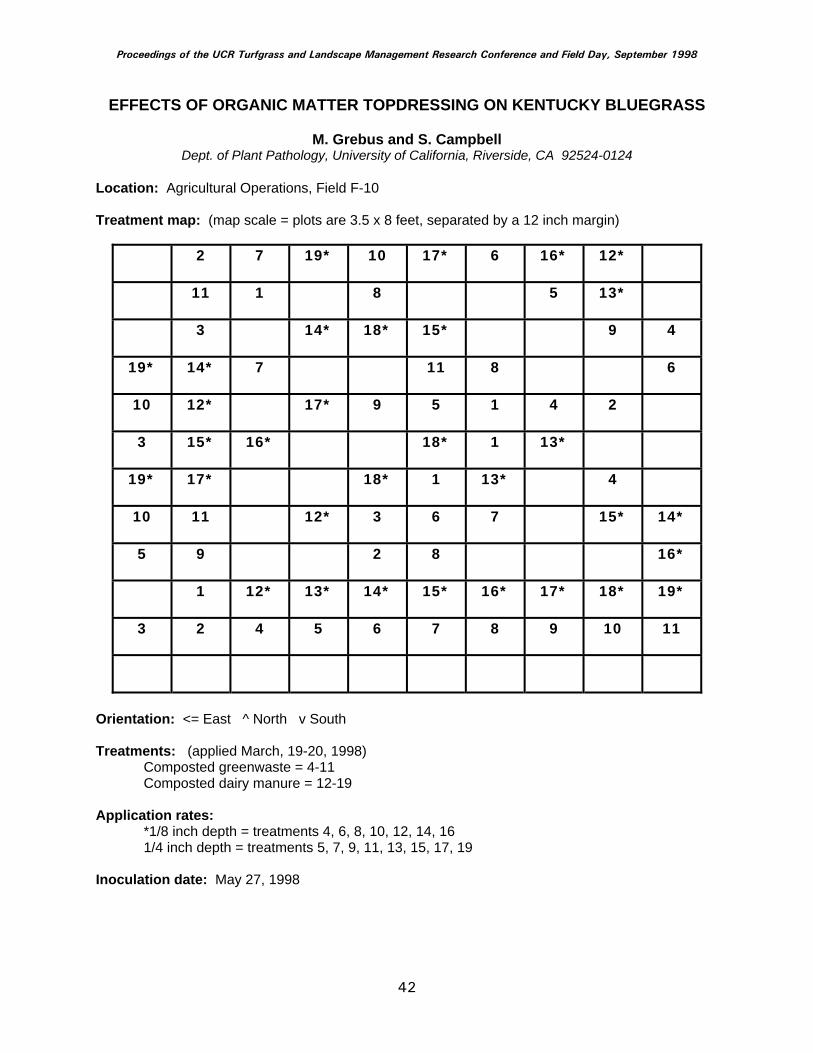
42
EFFECTS OF ORGANIC MATTER TOPDRESSING ON KENTUCKY BLUEGRASS
M. Grebus and S. Campbell Dept. of Plant Pathology, University of California, Riverside, CA 92524-0124
Location: Agricultural Operations, Field F-10 Treatment map: (map scale = plots are 3.5 x 8 feet, separated by a 12 inch margin)
2
7 19* 10 17* 6 16* 12*
11 1 8 5 13*
3 14* 18* 15* 9 4
19*
14* 7 11 8 6
10
12* 17* 9 5 1 4 2
3
15* 16* 18* 1 13*
19*
17* 18* 1 13* 4
10
11 12* 3 6 7 15* 14*
5
9 2 8 16*
1 12* 13* 14* 15* 16* 17* 18* 19*
3
2 4 5 6 7 8 9 10 11
Orientation: <= East ^ North v South Treatments: (applied March, 19-20, 1998) Composted greenwaste = 4-11 Composted dairy manure = 12-19 Application rates: *1/8 inch depth = treatments 4, 6, 8, 10, 12, 14, 16 1/4 inch depth = treatments 5, 7, 9, 11, 13, 15, 17, 19 Inoculation date: May 27, 1998
Proceedings of the UCR Turfgrass and Landscape Management Research Conference and Field Day, September 1998
LANDSCAPE MANAGEMENT RESEARCH CONFERENCE AND FIELD
DAY
WEDNESDAY, SEPTEMBER 16, 1998

i
LANDSCAPE MANAGEMENT RESEARCH CONFERENCE AND FIELD DAY WEDNESDAY, SEPTEMBER 16, 1998
TABLE OF CONTENTS AND CONFERENCE SCHEDULE
8:00 a.m. Registration 8:50 Welcome and Announcements Dennis Pittenger and Cheryl Wilen 9:00 Updates on Oleander Leaf Scorch Research Projects ............................. 1 • Disease Overview and Management
Marcella Grebus • Vector Biology and Management
Mathew A. Blua Heather Costa
9:50 Arundo Biology and Management .............................................................. 3
Jodie Holt 10:10 Questions and Answers 10:20 BREAK 10:50 Potential for Using Marigolds to Manage Plant Parasitic Nematodes ..... 4 Antoon Ploeg 11:10 Landscape Trees and Mycorrhizae ............................................................. 5 Lidia Yoshida 11:30 Giant Whitefly Management Strategies ...................................................... 7 John Kabashima 11:50 Questions and Answers 12 noon LUNCH 12:45 p.m. Drive Your Own Car to Agricultural Experiment Station 1:20 Organizational Comments Stop #1 Evaluation of Chemical Edging Materials .................................................. 9 Dave Cudney Stop #2 Avoiding Oleander Leaf Scorch: Alternatives to Oleander ..................... 10 Janet Hartin Stop #3 Comparison of Corrective Pruning Techniques to Improve Tree
Structure ....................................................................................................... 11 Jim Downer Stop #4 Irrigation Management in the Landscape .................................................... 13 David Shaw
ii
THE FOLLOWING COMPANIES, AGENCIES, AND ORGANIZATIONS HAVE GENEROUSLY PROVIDED DIRECT OR INDIRECT SUPPORT TO ONE OR MORE OF THE UC LANDSCAPE MANAGEMENT PROJECTS AT THE UNIVERSITY OF CALIFORNIA, RIVERSIDE. THEIR SUPPORT IS VERY MUCH APPRECIATED.
METROPOLITAN WATER DISTRICT OF SOUTHERN CALIFORNIA
A-G SOD FARMS, INCORPORATED
CALSENSE
HUNTER INDUSTRIES INCORPORATED
THE TORO COMPANY - IRRIGATION DIVISION
LANDSCAPE GROWERS, INC.
BANDINI FERTILIZER COMPANY
DEEPROOT PARTNERS, L. P.

1
UPDATES ON OLEANDER LEAF SCORCH RESEARCH PROJECTS DISEASE OVERVIEW AND MANAGEMENT
Marcella Grebus
Dept. of Plant Pathology, University of California, Riverside, CA 92521 NOTES:
Proceedings of the UCR Turfgrass and Landscape Management Research Conference and Field Day, September 1998
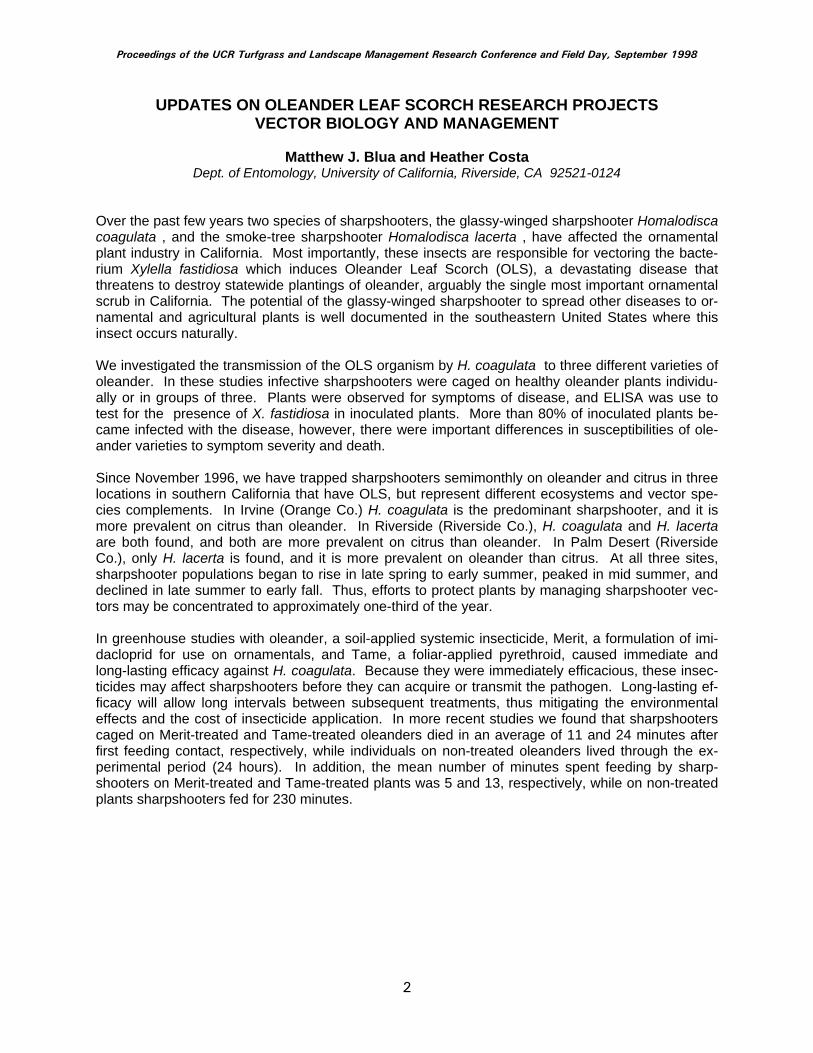
2
UPDATES ON OLEANDER LEAF SCORCH RESEARCH PROJECTS VECTOR BIOLOGY AND MANAGEMENT
Matthew J. Blua and Heather Costa
Dept. of Entomology, University of California, Riverside, CA 92521-0124 Over the past few years two species of sharpshooters, the glassy-winged sharpshooter Homalodisca coagulata , and the smoke-tree sharpshooter Homalodisca lacerta , have affected the ornamental plant industry in California. Most importantly, these insects are responsible for vectoring the bacte-rium Xylella fastidiosa which induces Oleander Leaf Scorch (OLS), a devastating disease that threatens to destroy statewide plantings of oleander, arguably the single most important ornamental scrub in California. The potential of the glassy-winged sharpshooter to spread other diseases to or-namental and agricultural plants is well documented in the southeastern United States where this insect occurs naturally. We investigated the transmission of the OLS organism by H. coagulata to three different varieties of oleander. In these studies infective sharpshooters were caged on healthy oleander plants individu-ally or in groups of three. Plants were observed for symptoms of disease, and ELISA was use to test for the presence of X. fastidiosa in inoculated plants. More than 80% of inoculated plants be-came infected with the disease, however, there were important differences in susceptibilities of ole-ander varieties to symptom severity and death. Since November 1996, we have trapped sharpshooters semimonthly on oleander and citrus in three locations in southern California that have OLS, but represent different ecosystems and vector spe-cies complements. In Irvine (Orange Co.) H. coagulata is the predominant sharpshooter, and it is more prevalent on citrus than oleander. In Riverside (Riverside Co.), H. coagulata and H. lacerta are both found, and both are more prevalent on citrus than oleander. In Palm Desert (Riverside Co.), only H. lacerta is found, and it is more prevalent on oleander than citrus. At all three sites, sharpshooter populations began to rise in late spring to early summer, peaked in mid summer, and declined in late summer to early fall. Thus, efforts to protect plants by managing sharpshooter vec-tors may be concentrated to approximately one-third of the year. In greenhouse studies with oleander, a soil-applied systemic insecticide, Merit, a formulation of imi-dacloprid for use on ornamentals, and Tame, a foliar-applied pyrethroid, caused immediate and long-lasting efficacy against H. coagulata. Because they were immediately efficacious, these insec-ticides may affect sharpshooters before they can acquire or transmit the pathogen. Long-lasting ef-ficacy will allow long intervals between subsequent treatments, thus mitigating the environmental effects and the cost of insecticide application. In more recent studies we found that sharpshooters caged on Merit-treated and Tame-treated oleanders died in an average of 11 and 24 minutes after first feeding contact, respectively, while individuals on non-treated oleanders lived through the ex-perimental period (24 hours). In addition, the mean number of minutes spent feeding by sharp-shooters on Merit-treated and Tame-treated plants was 5 and 13, respectively, while on non-treated plants sharpshooters fed for 230 minutes.
Proceedings of the UCR Turfgrass and Landscape Management Research Conference and Field Day, September 1998
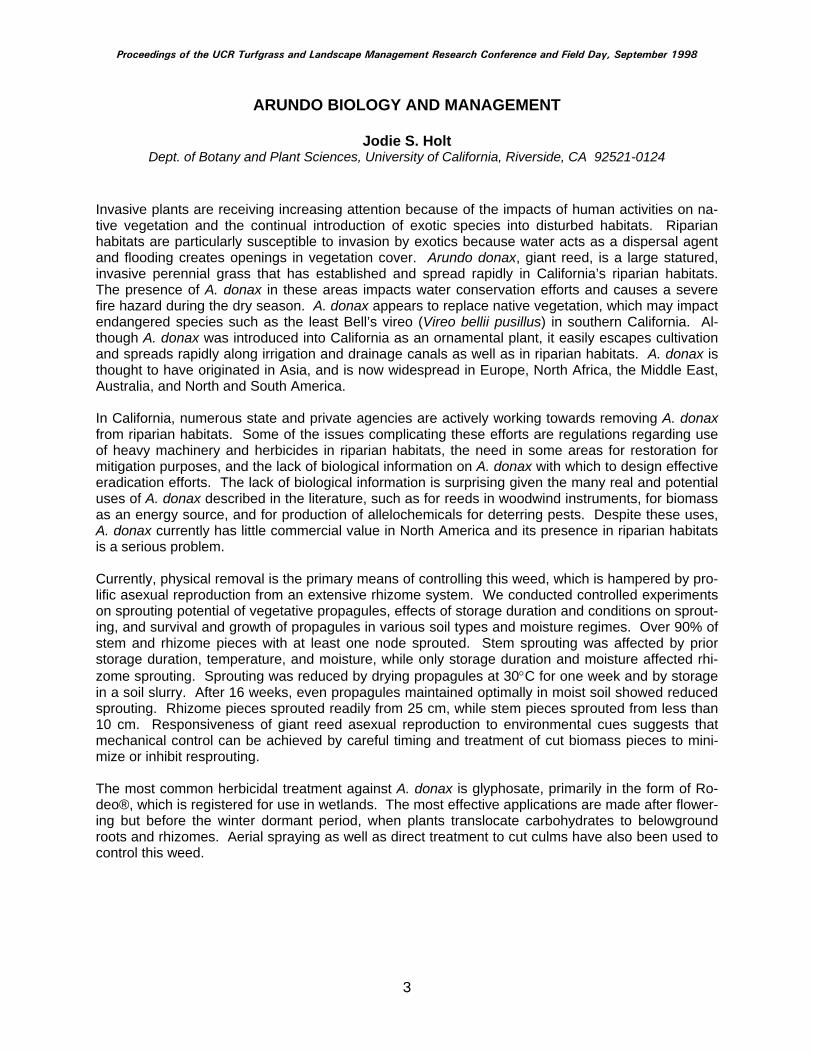
3
ARUNDO BIOLOGY AND MANAGEMENT
Jodie S. Holt Dept. of Botany and Plant Sciences, University of California, Riverside, CA 92521-0124
Invasive plants are receiving increasing attention because of the impacts of human activities on na-tive vegetation and the continual introduction of exotic species into disturbed habitats. Riparian habitats are particularly susceptible to invasion by exotics because water acts as a dispersal agent and flooding creates openings in vegetation cover. Arundo donax, giant reed, is a large statured, invasive perennial grass that has established and spread rapidly in California’s riparian habitats. The presence of A. donax in these areas impacts water conservation efforts and causes a severe fire hazard during the dry season. A. donax appears to replace native vegetation, which may impact endangered species such as the least Bell’s vireo (Vireo bellii pusillus) in southern California. Al-though A. donax was introduced into California as an ornamental plant, it easily escapes cultivation and spreads rapidly along irrigation and drainage canals as well as in riparian habitats. A. donax is thought to have originated in Asia, and is now widespread in Europe, North Africa, the Middle East, Australia, and North and South America. In California, numerous state and private agencies are actively working towards removing A. donax from riparian habitats. Some of the issues complicating these efforts are regulations regarding use of heavy machinery and herbicides in riparian habitats, the need in some areas for restoration for mitigation purposes, and the lack of biological information on A. donax with which to design effective eradication efforts. The lack of biological information is surprising given the many real and potential uses of A. donax described in the literature, such as for reeds in woodwind instruments, for biomass as an energy source, and for production of allelochemicals for deterring pests. Despite these uses, A. donax currently has little commercial value in North America and its presence in riparian habitats is a serious problem. Currently, physical removal is the primary means of controlling this weed, which is hampered by pro-lific asexual reproduction from an extensive rhizome system. We conducted controlled experiments on sprouting potential of vegetative propagules, effects of storage duration and conditions on sprout-ing, and survival and growth of propagules in various soil types and moisture regimes. Over 90% of stem and rhizome pieces with at least one node sprouted. Stem sprouting was affected by prior storage duration, temperature, and moisture, while only storage duration and moisture affected rhi-zome sprouting. Sprouting was reduced by drying propagules at 30°C for one week and by storage in a soil slurry. After 16 weeks, even propagules maintained optimally in moist soil showed reduced sprouting. Rhizome pieces sprouted readily from 25 cm, while stem pieces sprouted from less than 10 cm. Responsiveness of giant reed asexual reproduction to environmental cues suggests that mechanical control can be achieved by careful timing and treatment of cut biomass pieces to mini-mize or inhibit resprouting. The most common herbicidal treatment against A. donax is glyphosate, primarily in the form of Ro-deo®, which is registered for use in wetlands. The most effective applications are made after flower-ing but before the winter dormant period, when plants translocate carbohydrates to belowground roots and rhizomes. Aerial spraying as well as direct treatment to cut culms have also been used to control this weed.
Proceedings of the UCR Turfgrass and Landscape Management Research Conference and Field Day, September 1998
4
POTENTIAL FOR USING MARIGOLDS TO MANAGE PLANT-PARASITIC NEMATODES
Antoon Ploeg Dept. of Nematology, University of California, Riverside, CA 92521-0124
Marigolds (Tagetes spp.) have long been known to possess nematicidal activity. Initial reports on marigolds were on the suppression of root-knot (Meloidogyne spp.) and root-lesion (Pratylenchus spp.) nematodes. Studies in the 1950’s and 1960’s focused mainly on the suppression of root-lesion nematodes and showed that yields of several susceptible crops increased typically by 10-40% fol-lowing marigolds compared to after other crops or fallow. Results from studies on the suppression of root-knot nematodes by marigolds were often contradictory. Marigold species which effectively suppressed root-knot nematodes in one study did not have any effect on root-knot nematode popu-lations in another. It was suggested that the suppression of root-knot nematodes is strongly influ-enced by the interaction between the variety and species of marigold used and the species or popu-lation of root-knot nematodes. Studies on the use of marigolds in California orchards suggested that phytotoxic effects nullified benefits of nematode control. In order to initially screen different marigold varieties representing four Tagetes species against four species of Meloidogyne the nematodes were inoculated onto the different marigold varieties which were grown for 60 days in 250 cc con-tainers in a greenhouse. Root and soil populations after the marigolds were determined and com-pared to fallow (=no plant) and susceptible tomato controls. Susceptible tomatoes were transplanted into the containers and grown for another eight weeks. Top and root weights, root galling and Meloi-dogyne reproduction were determined and compared with tomato grown in non-inoculated soil. To-mato after tomato resulted in more root-galling and higher Meloidogyne reproduction than after any of the marigolds tested. Between marigold varieties and between Meloidogyne populations, how-ever, large differences occurred in nematode reproduction and galling on subsequent tomato. A few marigold varieties reduced tomato root galling and nematode reproduction to zero, and significantly suppressed nematode damage and reproduction compared to the fallow control. Obvious phytotoxic effects of marigolds to tomato were not observed as tomato growth after marigolds generally was not different from tomato planted in non-inoculated soil. Studies are on-going to evaluate the usefulness of several marigold varieties under field conditions.
Proceedings of the UCR Turfgrass and Landscape Management Research Conference and Field Day, September 1998
5
LANDSCAPE TREES AND MYCORRHIZAE
Lidia C. Yoshida and Edith B. Allen Dept. of Botany and Plant Sciences, University of California, Riverside, CA 92521-0124
Most, if not all, landscape tree roots are associated with some form of mycorrhizal fungi. A my-corrhiza is a symbiosis between a plant and a fungus which results in an exchange of nutrients, usu-ally minerals for the plant and carbon products for the fungus. About 90% of land plants have my-corrhizal associations, primarily endomycorrhizal or ectomycorrhizal (Allen, 1991; Smith and Read, 1997). The most common and widespread mycorrhizae are known as arbuscular mycorrhizae which penetrate the cell wall. These form arbuscules that are sites of nutrient exchange and absorption, and may also form vesicles that store fungal lipids. Outside of the roots, the mycorrhizal fungi form spores, which can germinate and infect other plants. Besides spores, the infected roots and hyphae can infect other plants. Arbuscular mycorrhizae colonize with most angiosperms, a few conifers, some bryophytes (mosses) and pteridophytes (ferns). Ectomycorrhizae form associations mostly with conifers and angiosperms. This group of fungi have over 4,000 species and each is very spe-cific to their host (angiosperms and gymnosperms). Ectomycorrhizae do not penetrate the cell walls, rather they form a network of hyphae between root cells known as the Hartig net. The roots are sur-rounded by a layer of hyphae known as the sheath or mantle. Arbuscular mycorrhizal trees include apple, oaks, orange, avocado, sequoia, juniper, walnut, and maple. Examples of trees colonized with ectomycorrhizae are pine, spruce, fir, and oaks. Not only can plants support more than one species of mycorrhizae, some form associations with different types of mycorrhizae. Eucalyptus, alder, poplar, cottonwood and chamise are arbuscular mycorrhi-zal and ectomycorrhizal. Many mycorrhizal plants are known to have increased success at outplant-ing, beneficial interactions with other soil microorganisms (rhizobia, mycorrhization helper bacteria), protection from pathogens, increased drought stress tolerance, and improved uptake of macronutri-ents (P, N) and micronutrients (Cu and Zn). Plants may be inoculated by adding mycorrhizal root fragments or individual sterilized spores to transplant medium, mixing native inoculum with soil or growth medium, or by buying preinoculated plants. Common problems in nurseries arise through contamination of pots when left on the ground. Over watering and over fertilization by overzealous homeowners can discourage mycorrhizal colonization. Moreover, each plant species needs to be evaluated for mycorrhizal dependency and each fungal isolate needs to be assessed for infectivity (the ability to penetrate and spread in the root) and effectivity (enhanced growth and stress tolerance of the host plant). Three examples of successful applications of mycorrhizae to landscape plants are described below: Pine was successfully established in Puerto Rico in 1955 where they were nonexistent by inoculat-ing soil around seedlings with soil containing ectomycorrhizal propagules from North Carolina (Vozzo and Hacskaylo, 1971). After one year, inoculated seedlings survived and grew rapidly while most of the noninoculated pines died. Fifteen years later the pine continued to thrive along with the mycorrhizal fungi. In a restoration project conducted in Australia, inoculum originating from two different sites (mine and forest) was applied to eucalyptus seedlings (Egerton-Warburton, 1992). The seedlings that re-ceived inoculum from the forest sites did not grow as well as those that received inoculum from the mine site. The nutrient content of the tissues showed increased minerals in the mycorrhizal plants, but more in the ones taken from the mine site than the forest site. Thus, success of mycorrhizal plants may depend on the source of inoculum or mycorrhizal fungal isolate. In a tropical forest in Quintana Roo, Mexico, six species of early and late successional trees were planted by using inoculum containing arbuscular mycorrhizae from an undisturbed forest (late suc-
Proceedings of the UCR Turfgrass and Landscape Management Research Conference and Field Day, September 1998
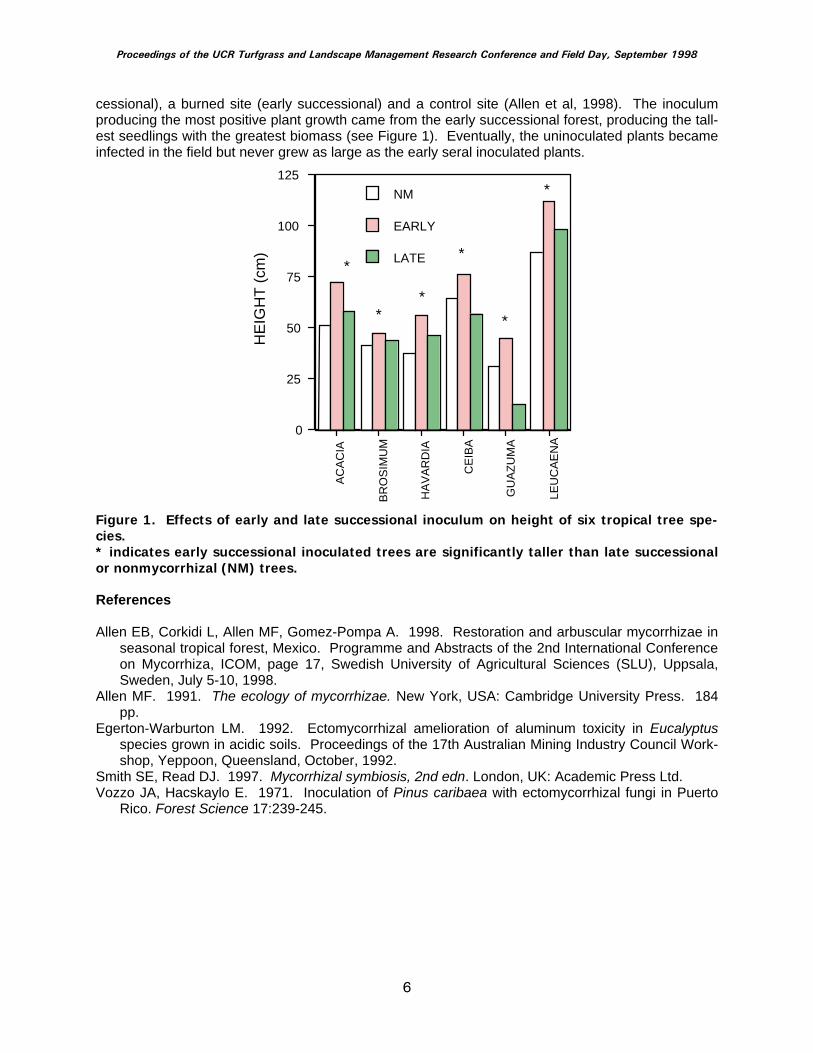
6
cessional), a burned site (early successional) and a control site (Allen et al, 1998). The inoculum producing the most positive plant growth came from the early successional forest, producing the tall-est seedlings with the greatest biomass (see Figure 1). Eventually, the uninoculated plants became infected in the field but never grew as large as the early seral inoculated plants.
0
25
50
75
100
125
HE
IGH
T (c
m)
AC
AC
IA
BR
OS
IMU
M
HA
VA
RD
IA
CE
IBA
GU
AZU
MA
LEU
CA
EN
A
LATE
EARLY
NM
**
*
*
*
*
Figure 1. Effects of early and late successional inoculum on height of six tropical tree spe-cies. * indicates early successional inoculated trees are significantly taller than late successional or nonmycorrhizal (NM) trees. References Allen EB, Corkidi L, Allen MF, Gomez-Pompa A. 1998. Restoration and arbuscular mycorrhizae in
seasonal tropical forest, Mexico. Programme and Abstracts of the 2nd International Conference on Mycorrhiza, ICOM, page 17, Swedish University of Agricultural Sciences (SLU), Uppsala, Sweden, July 5-10, 1998.
Allen MF. 1991. The ecology of mycorrhizae. New York, USA: Cambridge University Press. 184 pp.
Egerton-Warburton LM. 1992. Ectomycorrhizal amelioration of aluminum toxicity in Eucalyptus species grown in acidic soils. Proceedings of the 17th Australian Mining Industry Council Work-shop, Yeppoon, Queensland, October, 1992.
Smith SE, Read DJ. 1997. Mycorrhizal symbiosis, 2nd edn. London, UK: Academic Press Ltd. Vozzo JA, Hacskaylo E. 1971. Inoculation of Pinus caribaea with ectomycorrhizal fungi in Puerto
Rico. Forest Science 17:239-245.
Proceedings of the UCR Turfgrass and Landscape Management Research Conference and Field Day, September 1998
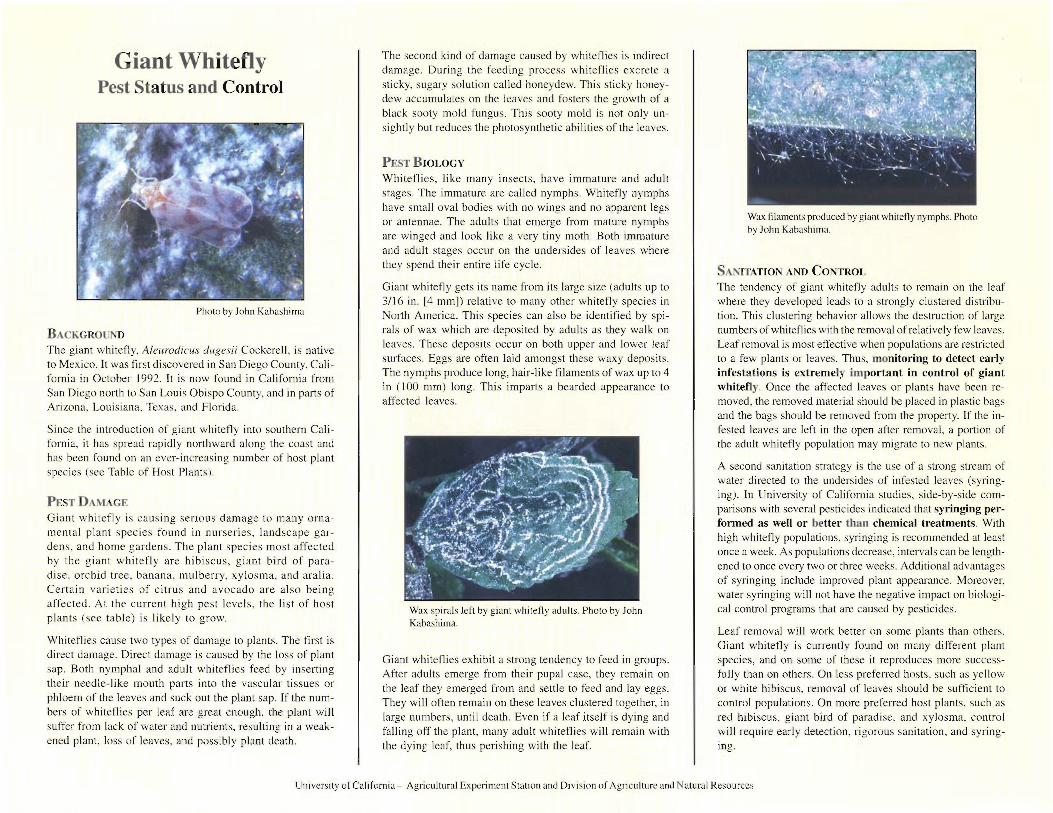
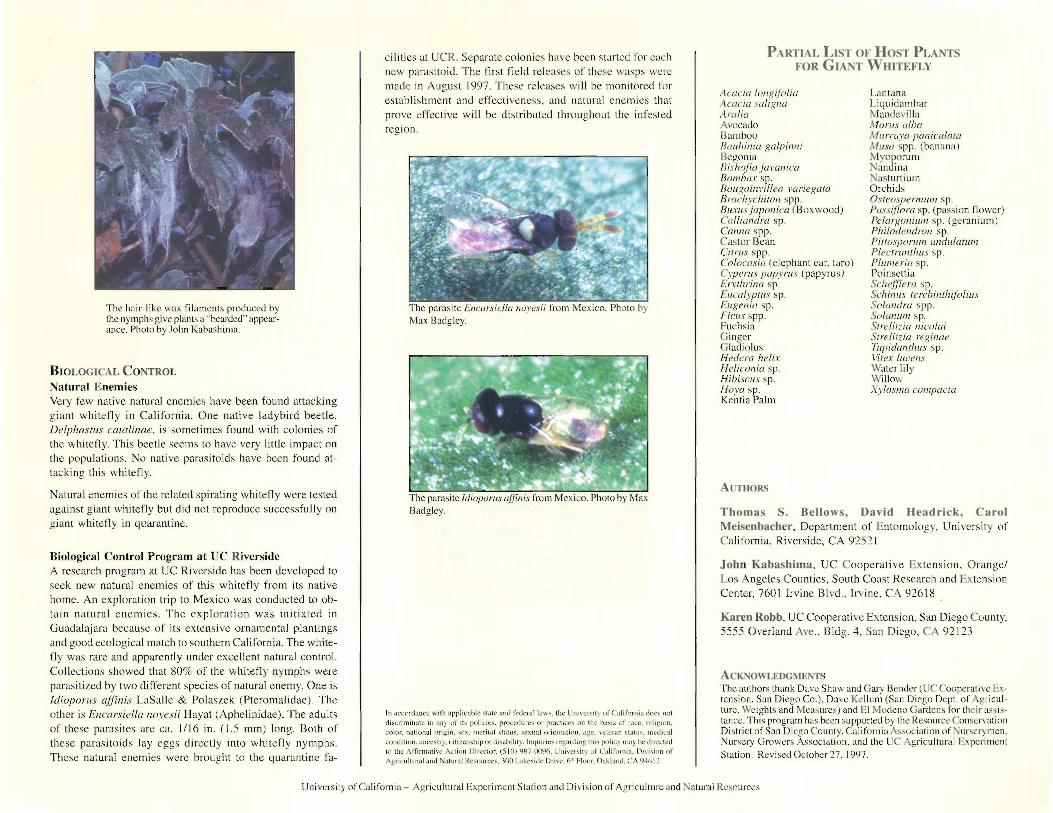

9
CHEMICAL EDGING OF HYBRID BERMUDAGRASS
David W. Cudney1, Clyde L. Elmore2, and Victor A. Gibeault1 1Dept. of Botany and Plant Sciences, University of California, Riverside, CA 92521-0124 2Dept. of Vegetable Crops, Weed Science Program, Univ. of California, Davis, CA 95616
Aggressive, stoloniferous grasses such as bermudagrass, kikuyugrass, zoysiagrass and St. Au-gustinegrass often extend their growth into ornamental beds, tree wells, and sidewalks within land-scaped areas. This requires repeated mechanical edging or hand removal during the growing sea-son. These procedures are time-consuming and often costly. Chemical edging has been an alter-native to the drudgery of mechanical and hand removal. Cacodylic acid, diquat, and weed oil were used in the past for short-term chemical edging. When glyphosate (Roundup) was introduced, it re-placed much of these usages, however, because of its systemic nature in these stoloniferous grasses, the effects of the glyphosate often extend beyond the edges into the desirable turf areas. Three newer chemicals have been introduced which may be useful as chemical edgers, pelargonic acid (Scythe), glufosinate (Finale) and trinexapac-ethyl (Primo). Pelargonic acid is a rapidly acting “contact” foliar herbicide, Glufosinate is a rapid acting “contact” foliar herbicide which is not yet regis-tered in California while trinexapacl is a turf growth regulator. Trials have been conducted for three years at the University of California, Riverside Experimental Turf Farm on an eight-year-old, vigorous stand of “Santa Anna” hybrid bermudagrass. The effects of these edging materials have been measured by estimating the pytotoxic effects on the bermuda-grass visually, by measuring regrowth in the treated areas, and by measuring light reflectance from the treated turf surface. Pelargonic acid and Diquat desiccated the turf within one day, cacodylic acid required 5 days to reach maximum effect. Rapid regreening of the bermudagrass occurred in the pelargonic acid treatments (usually within one week). Diquat and cacodylic acid had lost their effect by 19 and 26 days respectively. Glufosinate reached its maximum effect in 5 days with the effects persisting for 45 days. Glyphosate required 14 days to reach its maximum effect, however its phytotoxic effect remained for more than eight weeks, although regrowth from the edges of the treated area was in evidence at the end of this period. Trinexapac stopped growth of the turf and caused only a slight yellowing of the turf, its growth reducing effects were evident for at least six weeks. Glufosinate was quicker acting than glyphosate and longer lasting than diquat or cacodylic acid. Trinexapac stopped turf growth with little discoloration. It appears that both of these products may have a place in chemical edging. Glufosinate for a quick burn back and trinexapac after mechanical edging to slow regrowth an the need for a second mechanical edging. Glyphosate is still the most effective single, long term, chemical edging tool.
Proceedings of the UCR Turfgrass and Landscape Management Research Conference and Field Day, September 1998
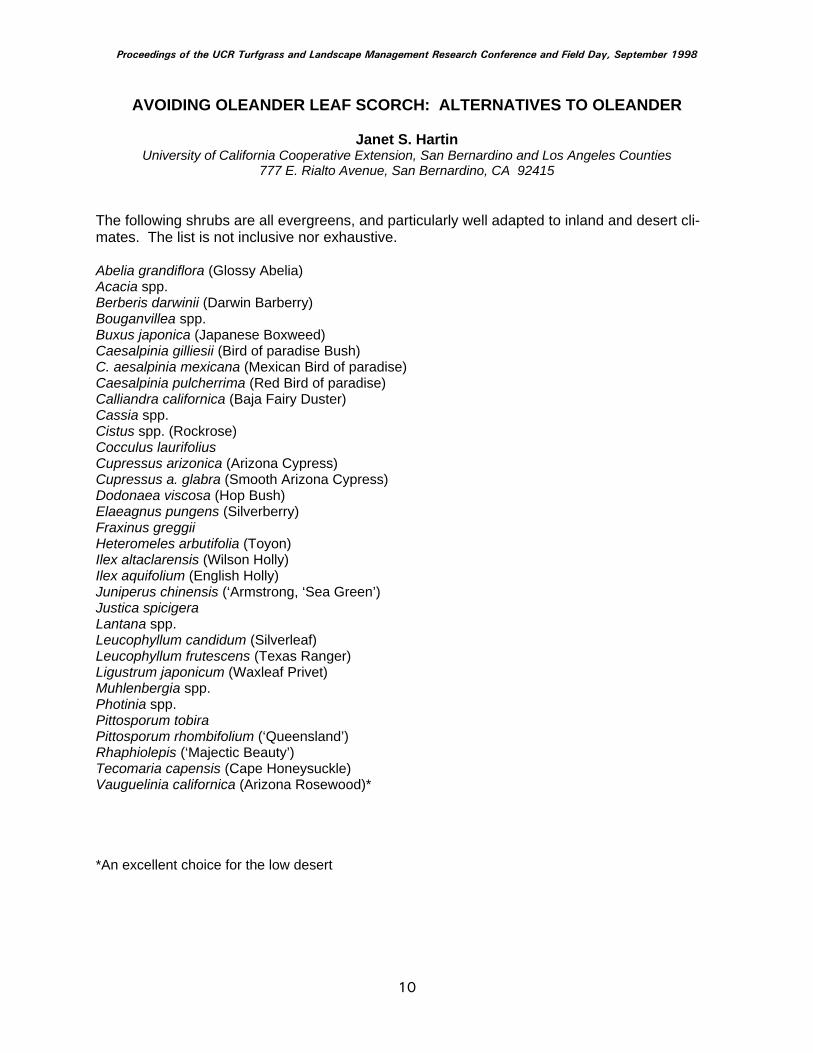
10
AVOIDING OLEANDER LEAF SCORCH: ALTERNATIVES TO OLEANDER
Janet S. Hartin University of California Cooperative Extension, San Bernardino and Los Angeles Counties
777 E. Rialto Avenue, San Bernardino, CA 92415 The following shrubs are all evergreens, and particularly well adapted to inland and desert cli-mates. The list is not inclusive nor exhaustive. Abelia grandiflora (Glossy Abelia) Acacia spp. Berberis darwinii (Darwin Barberry) Bouganvillea spp. Buxus japonica (Japanese Boxweed) Caesalpinia gilliesii (Bird of paradise Bush) C. aesalpinia mexicana (Mexican Bird of paradise) Caesalpinia pulcherrima (Red Bird of paradise) Calliandra californica (Baja Fairy Duster) Cassia spp. Cistus spp. (Rockrose) Cocculus laurifolius Cupressus arizonica (Arizona Cypress) Cupressus a. glabra (Smooth Arizona Cypress) Dodonaea viscosa (Hop Bush) Elaeagnus pungens (Silverberry) Fraxinus greggii Heteromeles arbutifolia (Toyon) Ilex altaclarensis (Wilson Holly) Ilex aquifolium (English Holly) Juniperus chinensis (‘Armstrong, ‘Sea Green’) Justica spicigera Lantana spp. Leucophyllum candidum (Silverleaf) Leucophyllum frutescens (Texas Ranger) Ligustrum japonicum (Waxleaf Privet) Muhlenbergia spp. Photinia spp. Pittosporum tobira Pittosporum rhombifolium (‘Queensland’) Rhaphiolepis (‘Majectic Beauty’) Tecomaria capensis (Cape Honeysuckle) Vauguelinia californica (Arizona Rosewood)* *An excellent choice for the low desert
Proceedings of the UCR Turfgrass and Landscape Management Research Conference and Field Day, September 1998
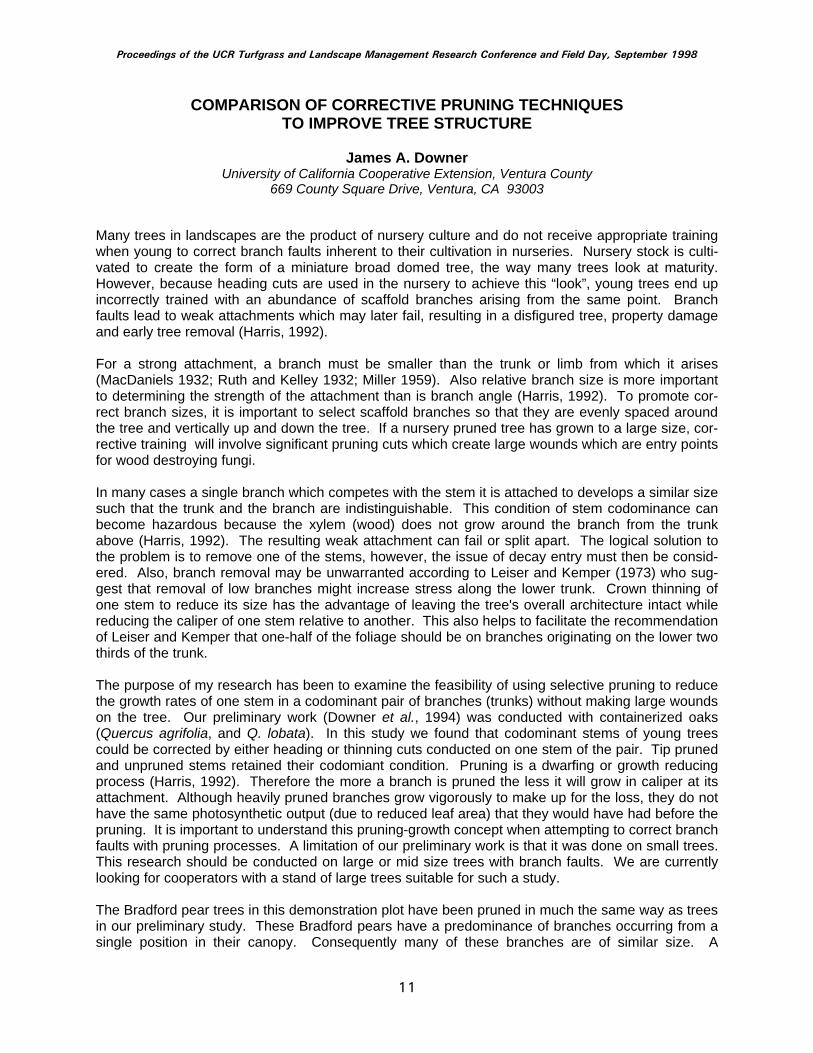
11
COMPARISON OF CORRECTIVE PRUNING TECHNIQUES TO IMPROVE TREE STRUCTURE
James A. Downer
University of California Cooperative Extension, Ventura County 669 County Square Drive, Ventura, CA 93003
Many trees in landscapes are the product of nursery culture and do not receive appropriate training when young to correct branch faults inherent to their cultivation in nurseries. Nursery stock is culti-vated to create the form of a miniature broad domed tree, the way many trees look at maturity. However, because heading cuts are used in the nursery to achieve this “look”, young trees end up incorrectly trained with an abundance of scaffold branches arising from the same point. Branch faults lead to weak attachments which may later fail, resulting in a disfigured tree, property damage and early tree removal (Harris, 1992). For a strong attachment, a branch must be smaller than the trunk or limb from which it arises (MacDaniels 1932; Ruth and Kelley 1932; Miller 1959). Also relative branch size is more important to determining the strength of the attachment than is branch angle (Harris, 1992). To promote cor-rect branch sizes, it is important to select scaffold branches so that they are evenly spaced around the tree and vertically up and down the tree. If a nursery pruned tree has grown to a large size, cor-rective training will involve significant pruning cuts which create large wounds which are entry points for wood destroying fungi. In many cases a single branch which competes with the stem it is attached to develops a similar size such that the trunk and the branch are indistinguishable. This condition of stem codominance can become hazardous because the xylem (wood) does not grow around the branch from the trunk above (Harris, 1992). The resulting weak attachment can fail or split apart. The logical solution to the problem is to remove one of the stems, however, the issue of decay entry must then be consid-ered. Also, branch removal may be unwarranted according to Leiser and Kemper (1973) who sug-gest that removal of low branches might increase stress along the lower trunk. Crown thinning of one stem to reduce its size has the advantage of leaving the tree's overall architecture intact while reducing the caliper of one stem relative to another. This also helps to facilitate the recommendation of Leiser and Kemper that one-half of the foliage should be on branches originating on the lower two thirds of the trunk. The purpose of my research has been to examine the feasibility of using selective pruning to reduce the growth rates of one stem in a codominant pair of branches (trunks) without making large wounds on the tree. Our preliminary work (Downer et al., 1994) was conducted with containerized oaks (Quercus agrifolia, and Q. lobata). In this study we found that codominant stems of young trees could be corrected by either heading or thinning cuts conducted on one stem of the pair. Tip pruned and unpruned stems retained their codomiant condition. Pruning is a dwarfing or growth reducing process (Harris, 1992). Therefore the more a branch is pruned the less it will grow in caliper at its attachment. Although heavily pruned branches grow vigorously to make up for the loss, they do not have the same photosynthetic output (due to reduced leaf area) that they would have had before the pruning. It is important to understand this pruning-growth concept when attempting to correct branch faults with pruning processes. A limitation of our preliminary work is that it was done on small trees. This research should be conducted on large or mid size trees with branch faults. We are currently looking for cooperators with a stand of large trees suitable for such a study. The Bradford pear trees in this demonstration plot have been pruned in much the same way as trees in our preliminary study. These Bradford pears have a predominance of branches occurring from a single position in their canopy. Consequently many of these branches are of similar size. A
Proceedings of the UCR Turfgrass and Landscape Management Research Conference and Field Day, September 1998
12
codominant branch pair was selected from each tree. The pair was tagged and the following treat-ments were applied: 1.) no pruning on either branch (control treatment); 2.) Branch tips pinched on one branch of the pair; 3) lateral branches thinned from one of the branches in a pair; and, 4.) one branch of the pair headed back severely. The clippings were retained and dried to obtain weights of the biomass removed by pruning. The relationship between biomass pruned and growth reduction will be discussed as well as the corrective nature of the treatment and its ability to reduce codomi-nance in a pair of stems. Literature Cited Downer, A.J. M.Shaw and D. Pittenger. 1994. The effect of pruning on branch growth in two oak
species. HortScience 29:550 (Abstr.) Harris, R.W. 1992. Arboriculture Integrated management of landscape trees shrubs and vines.
Second Ed. Prentice Hall, Englewood Cliffs. 674pp. Leiser A.T. and J.D. Kemper. 1973. Analysis of stress distribution in the sapling tree trunk.
J.Amer.Soc.Hort.Sci. 97:498-503. MacDaniels, L.H. 1932. Factors affecting the breaking strength of apple tree crotches. Proc. Amer.
Soc. Hort. Sci. 29:44 Miller, V.J. 1959. Crotch Influence on strength and breaking point of apple tree branches. Proc.
Amer.Soc. Hort. Sci 73:27-32. Ruth, W.A., and V.W. Kelley. 1932. A study of the framework of the apple tree and its relations to
longevity. I11. Agr. Exp. Sta. Bull. 376:509-637.
Proceedings of the UCR Turfgrass and Landscape Management Research Conference and Field Day, September 1998

13
IRRIGATION MANAGEMENT IN THE LANDSCAPE
David A. Shaw University of California Cooperative Extension, San Diego County
5555 Overland Avenue, Bldg. 4, San Diego, CA 92123 The goal of good irrigation management in the landscape is to supply the plant materials with the correct amount of water at the proper time. In areas where water costs are high, supplies are limited, and there is demand for high quality turf and landscapes, the irrigation manager must maintain irrigation systems for peak performance and make careful decisions on when and how much to irrigate. Utilization of reference evapotranspiration (ETo) information need not be complex in order to as-sist your scheduling program. In this presentation, we will observe irrigation conditions and soil moisture content in the field. Then we will compare water applications to ETo estimates to check irrigation frequency and find out how well we did. In most landscape situations, applying rather small amounts of water on a daily basis is an inef-ficient and unsound horticultural practice. A more practical and effective method is to wait a pe-riod of time, usually several days, and then apply the accumulated amount needed. This allows enough water to be applied to adequately irrigate the root zone. A field estimate of soil moisture status or plant water stress can be used for deciding when to irrigate and ETo data to determine the amount of water or run time. However, many horticultural and non-horticutural factors gov-ern irrigation frequency: Factors Which Restrict Scheduling Flexibility: Mandated Irrigation Days and/or Hours Limited Water Supply Cultural or Maintenance Practices Sports or Other Activities High Wind Conditions Factors Which Necessitate Frequent Irrigation: High Plant Water Use Rates Shallow Rooting Depth Sandy Soils with Low Water Holding Capacity
High Runoff Potential Due to Slope or Compaction Poor Infiltration Rate Due to Compaction or Clay Soils Factors Which Allow Less Frequent Irrigation: Low ET Rates or Presence of Rainfall, Dew, or Fog Deep Roots and High Root Density Plants With Ability to Tolerate Drought No Runoff Problems Acceptable Quality or Site Use Under Reduced Irrigation Field observation of plant material quality, rooting depth, soil moisture status, and water pene-tration is necessary in determining irrigation frequency and amount of water to apply. The soil moisture status is easily determined by the “feel method”, a simple technique involving field ob-
Proceedings of the UCR Turfgrass and Landscape Management Research Conference and Field Day, September 1998
14
servations and a soil probe or shovel. Soil probes also provide information on actual rooting depth of plants, wetted depth, and type(s) of soil. How deep a given amount of water will pene-trate will vary with soil texture, hydraulic conductivity, and initial water content. Where site condi-tions limit the infiltration rate, runoff will determine the longest possible station run time. Multiple cycles should be programmed if additional run time is required for water to penetrate to a de-sired depth in the soil. Irrigation, rainfall, and ET amounts can all be measured in INCHES. A useful conversion is: 1 square foot, 1 inch deep = 0.62 gallons. So… if you irrigate 1000 ft2 with 300 gallons, 300 ÷ 1000 ÷ 0.62 = 0.48 Inches applied. To find out how well you did: Inches applied divided by ETo accumulated between irrigations should result in a number below 1. 1.0 (100% of ETo) is the number that many water districts are using for landscape water allocations. To estimate the irri-gation frequency: Inches applied ÷ desired decimal percentage of ETo ÷ Daily average ETo = # of days until irrigation needed. So… 0.5 inches applied ÷0.60 ÷0.25 = 3.3 or 3 days. These calculations can be done quickly and will aid in efficient irrigation.
Proceedings of the UCR Turfgrass and Landscape Management Research Conference and Field Day, September 1998