landscape impacts of bioenergy production using state-and-transition modeling
TRANSCRIPT

Assessing landscape impacts of potential bioenergy production scenarios
using spatially explicit STSMsJennifer Costanza
Robert C. Abt, Alexa McKerrow, Jaime CollazoSeptember 17, 2014
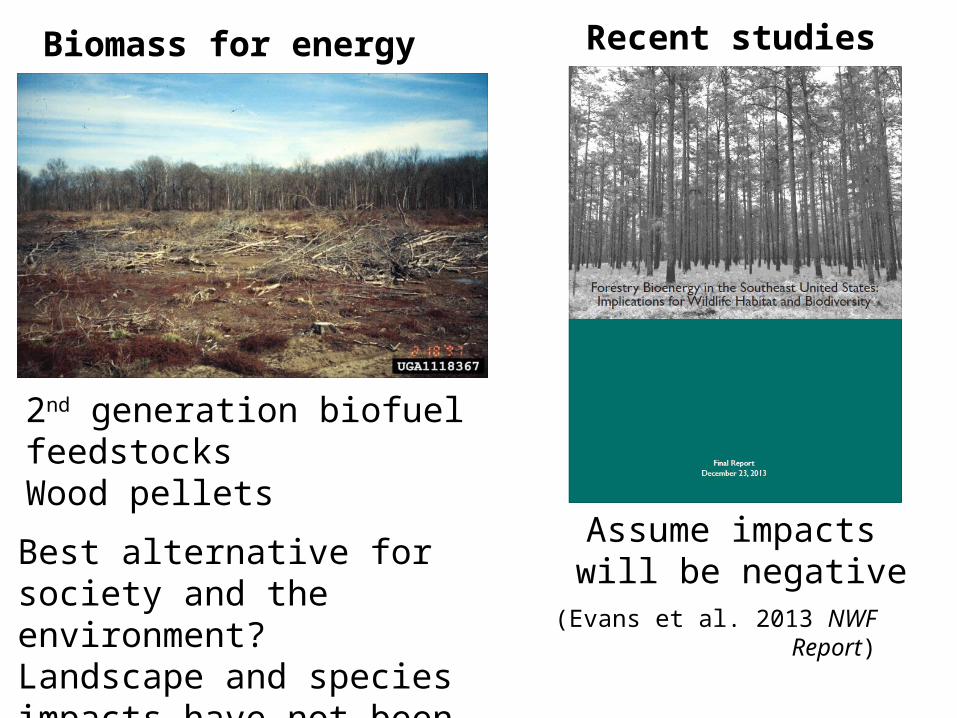
Biomass for energy
Best alternative for society and the environment?Landscape and species impacts have not been fully addressed
Assume impacts will be negative
Recent studies
(Evans et al. 2013 NWF Report)
2nd generation biofuel feedstocks Wood pellets

How will biofuels affect the NC landscape?
2. “Purpose-grown crops” on marginal ag and forest lands
1. Increased “conventional” forest management
• Sweet sorghum• Switchgrass• Short-rotation loblolly pine based on supply chain (Gonzalez et al. 2011, 2012)

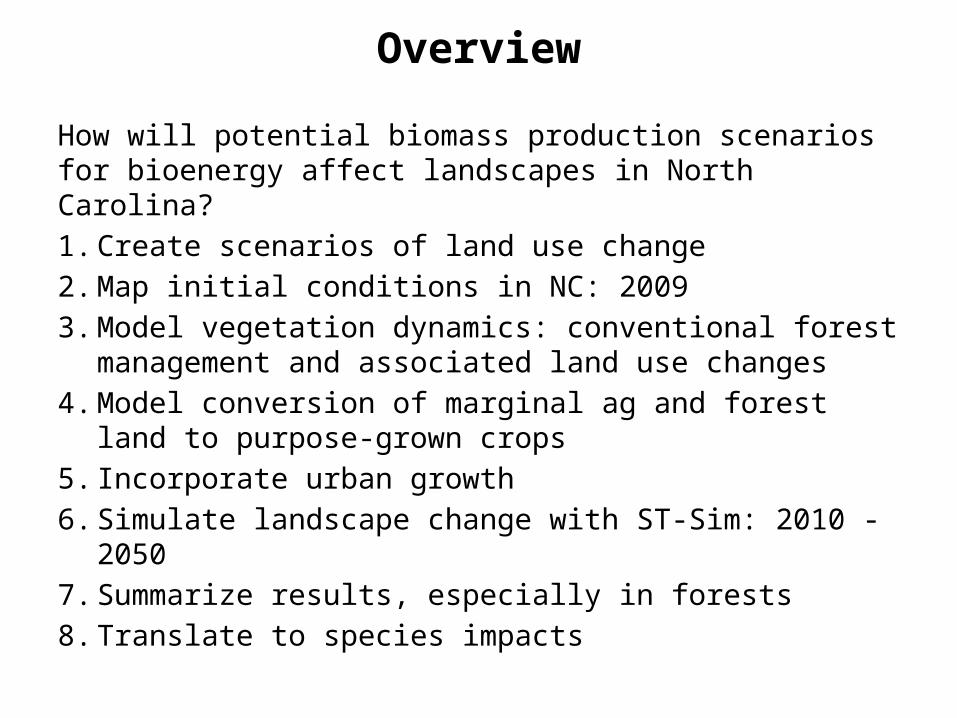
How will potential biomass production scenarios for biofuels affect landscapes in North Carolina?1. Create scenarios of land use change2. Map initial conditions in NC: 20093. Model vegetation dynamics: conventional forest
management and associated land use changes4. Model conversion of marginal ag and forest land to
purpose-grown crops5. Incorporate urban growth 6. Simulate landscape change with ST-Sim: 2010 - 20507. Summarize results, especially in forests8. Translate to species impacts
Overview
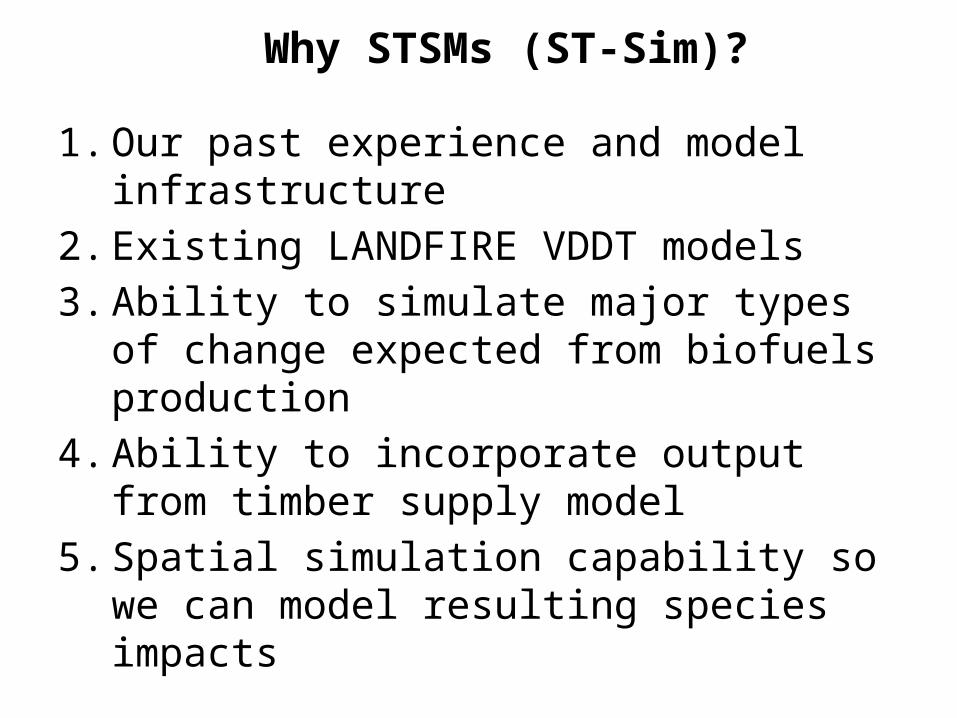
1. Our past experience and model infrastructure 2. Existing LANDFIRE VDDT models3. Ability to simulate major types of change
expected from biofuels production4. Ability to incorporate output from timber supply
model5. Spatial simulation capability so we can model
resulting species impacts
Why STSMs (ST-Sim)?

Biomass production scenarios for NC
ScenarioConv.
forestsOther forest
products
Marg. ag to purpose grown
Marg. forest to purpose grown
Portion of NC Fuel
Baseline None BAU No No 0%
Ag No BAU Yes No 10%
Ag-Forest No BAU Some Some 10%
Conventional Yes Reduced No No 1.5%
Conventional-Ag Yes Reduced Yes No 10%
Conventional-Ag-Forest Yes Reduced Some Some 10%
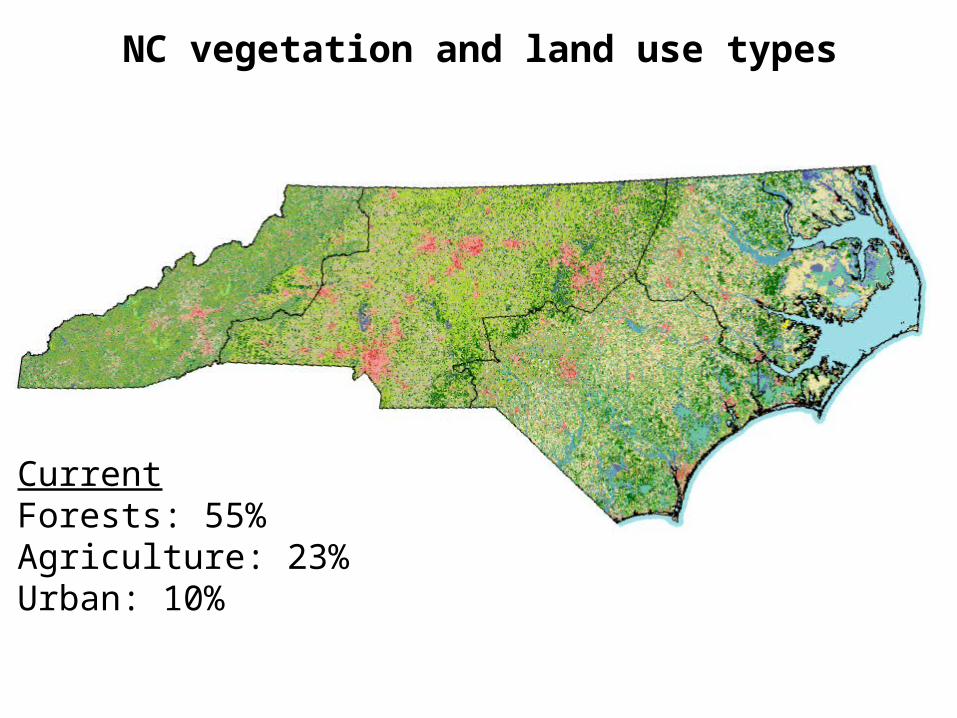
NC vegetation and land use types
CurrentForests: 55%Agriculture: 23%Urban: 10%
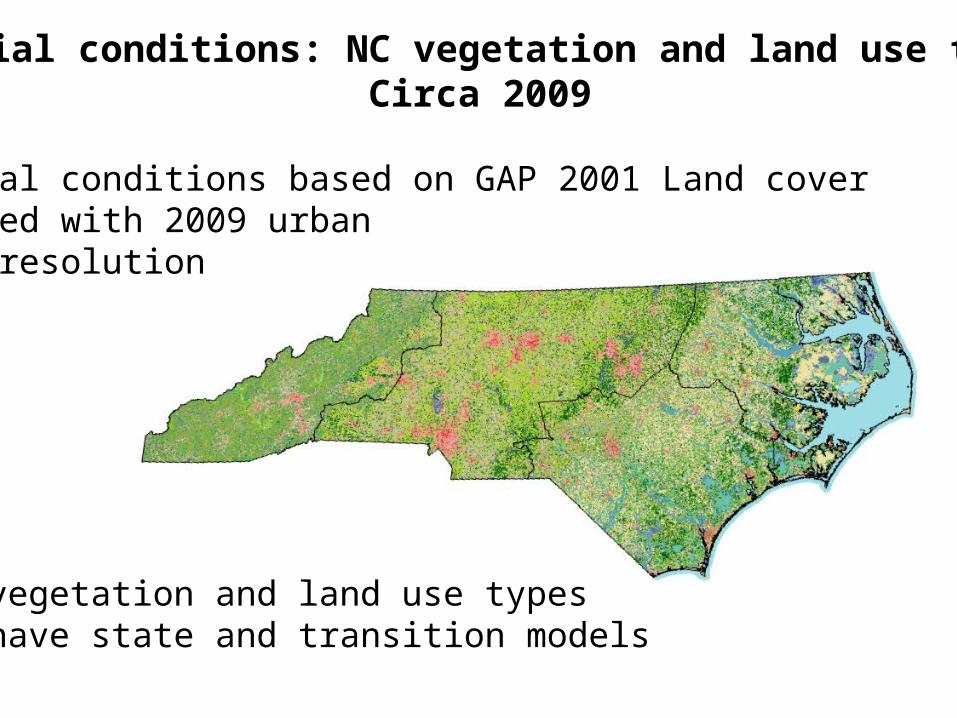
Initial conditions: NC vegetation and land use typesCirca 2009
Spatial conditions based on GAP 2001 Land coverupdated with 2009 urban60 m resolution
73 vegetation and land use types59 have state and transition models
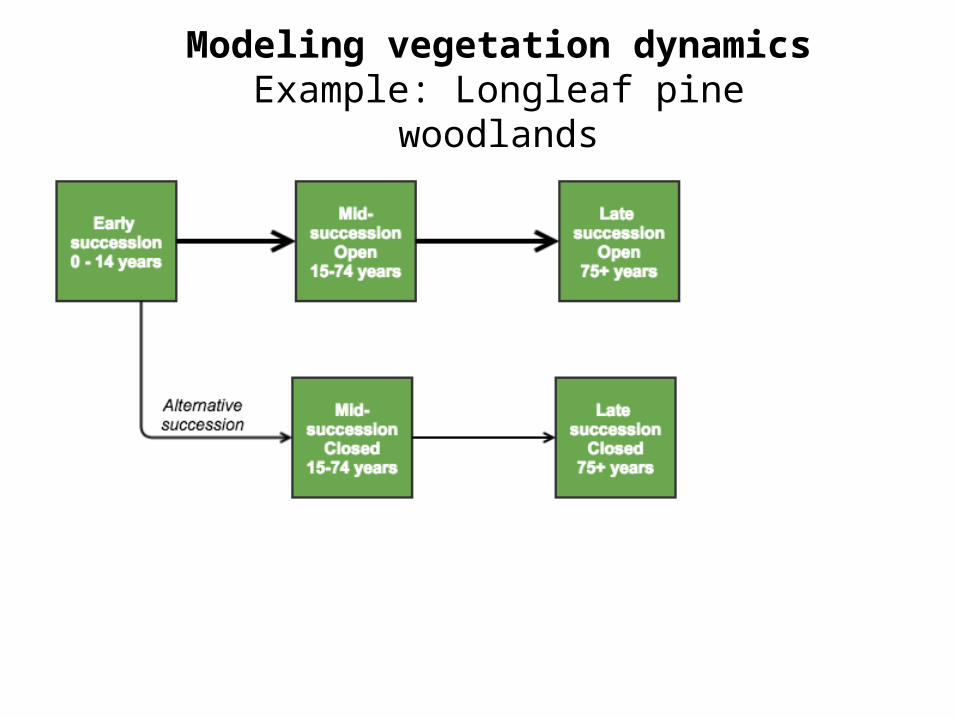
Modeling vegetation dynamicsExample: Longleaf pine woodlands

Modeling vegetation dynamicsExample: Longleaf pine woodlands
Conventional forest management added
To other vegand land uses

Initial conditions: state classes, ages
States: Based on 2008 LANDFIRE S-class, NLCD canopy coverAges: Based on FIA data
Modeling conventional forest management:Thinning, harvest, land use change
SRTS timber supply model (Abt et al. 2009 For. Prod. J.)
Not all demand is met by increased harvest
Estimates timber supply based on • Inventory: how much timber exists? (FIA data;
economic land use change model)• Demand:
1. Empirical harvests (FIA data)2. Annual demand in NC increases to 4 million green tons biomass by 2018• Forest residues harvested• Other products displaced
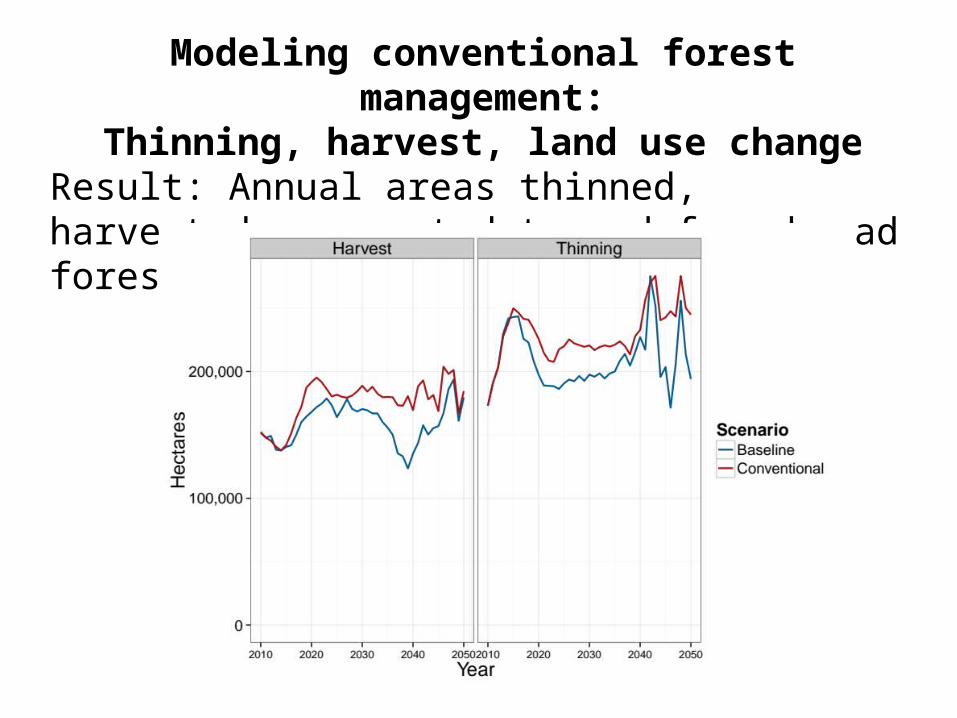
Modeling conventional forest management:Thinning, harvest, land use change
Result: Annual areas thinned, harvested, converted to and from broad forest types and age classes

Modeling purpose grown crops onmarginal agricultural and forest land
Based on soil and land useExcludes protected areas
Based on life cycle analysis

Series of spatial multipliers
Urban growth through time: 2010 - 2050
Terando et al. 2014 PLOS ONE
How will potential biomass production scenarios for bioenergy affect landscapes in North Carolina?1. Create scenarios of land use change2. Map initial conditions in NC: 20093. Model vegetation dynamics: conventional forest
management and associated land use changes4. Model conversion of marginal ag and forest land to
purpose-grown crops5. Incorporate urban growth 6. Simulate landscape change with ST-Sim: 2010 - 20507. Summarize results, especially in forests8. Translate to species impacts
Overview
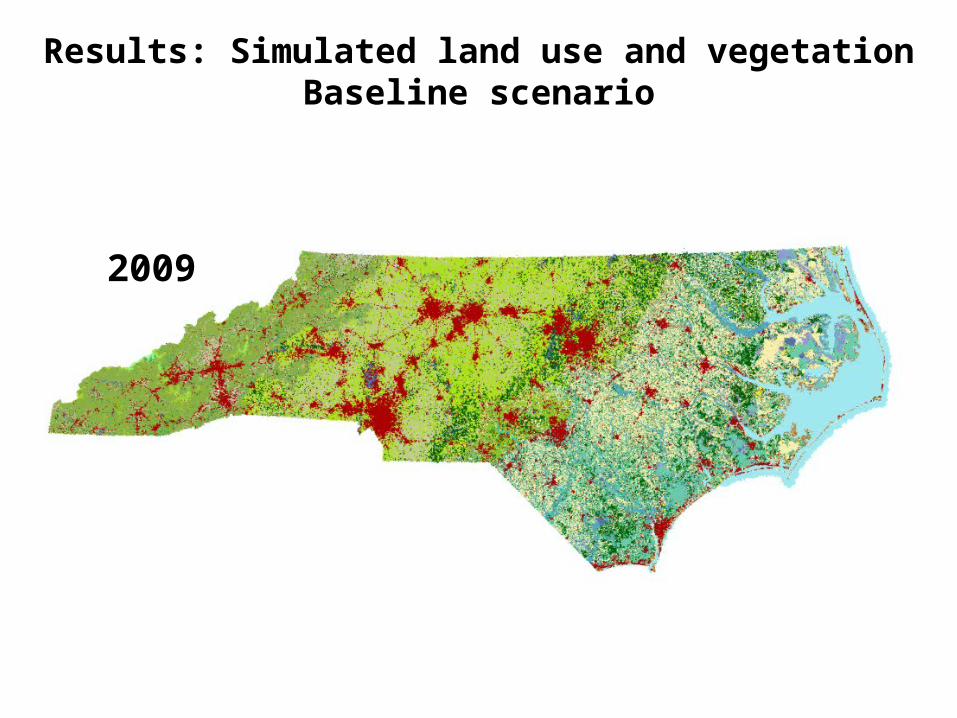
Results: Simulated land use and vegetationBaseline scenario
2009
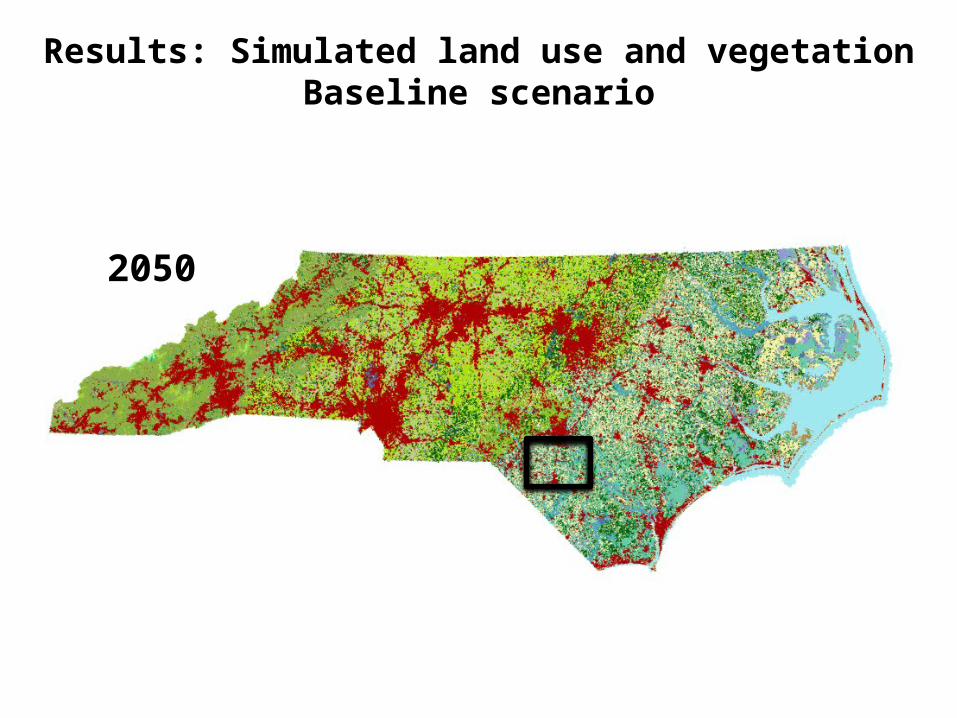
2050
Results: Simulated land use and vegetationBaseline scenario

2009
Fayetteville, NC
Spatial results: Conventional biomass scenario

2020
Fayetteville, NC
Spatial results: Conventional biomass scenario

2030
Fayetteville, NC
Spatial results: Conventional biomass scenario

2040 Spatial results: Conventional biomass scenario
Fayetteville, NC
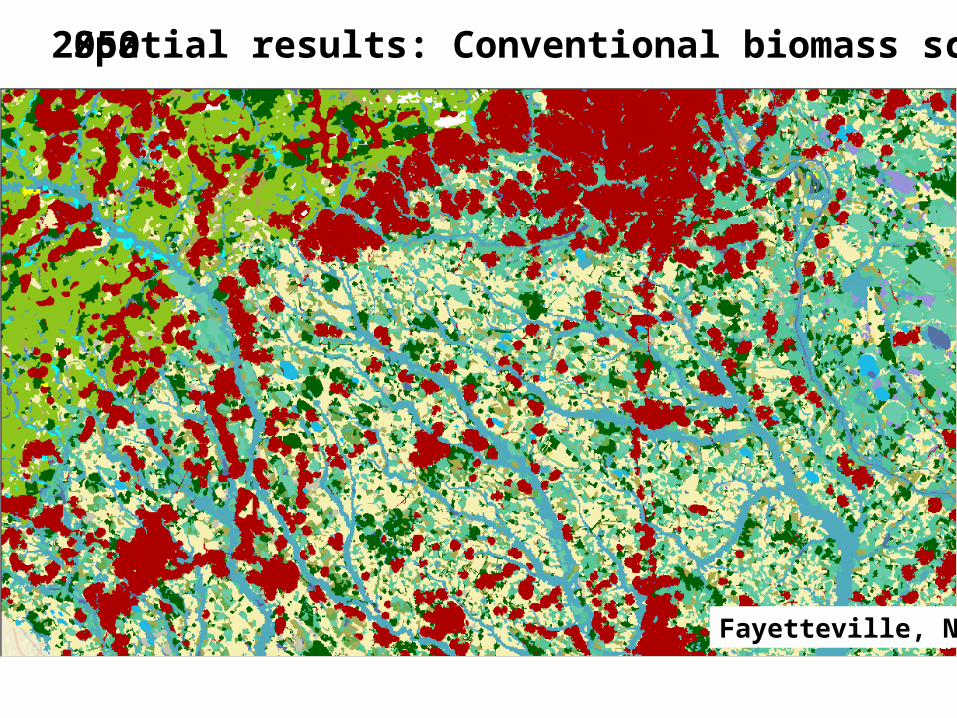
2050
Fayetteville, NC
Spatial results: Conventional biomass scenario
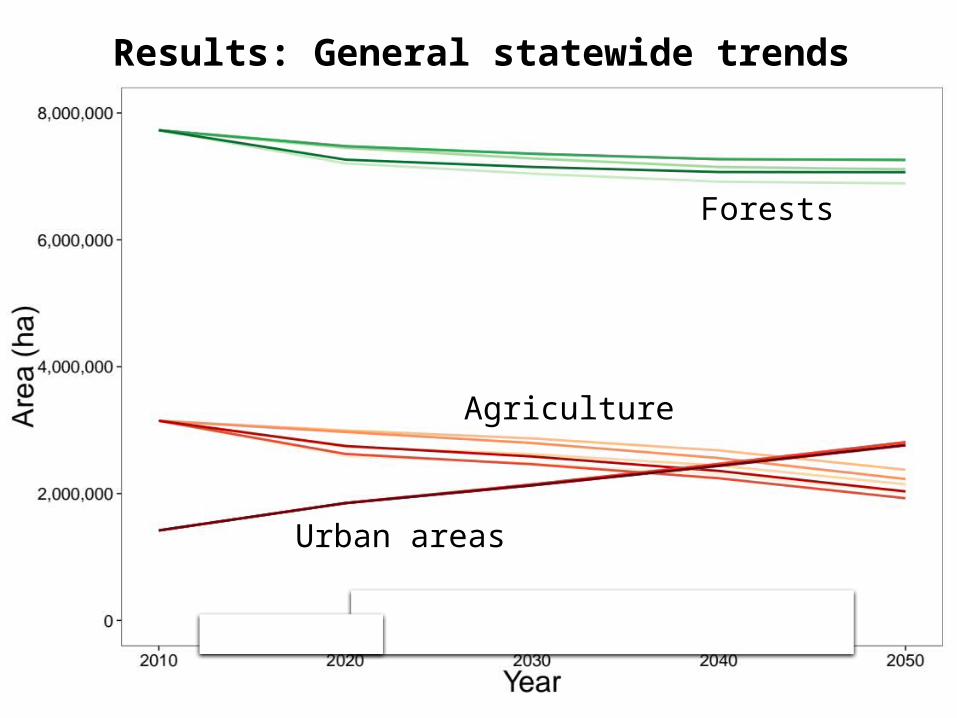
Results: General statewide trends
Forests
Agriculture
Urban areas

2050 Proportion difference from Baseline Scenario
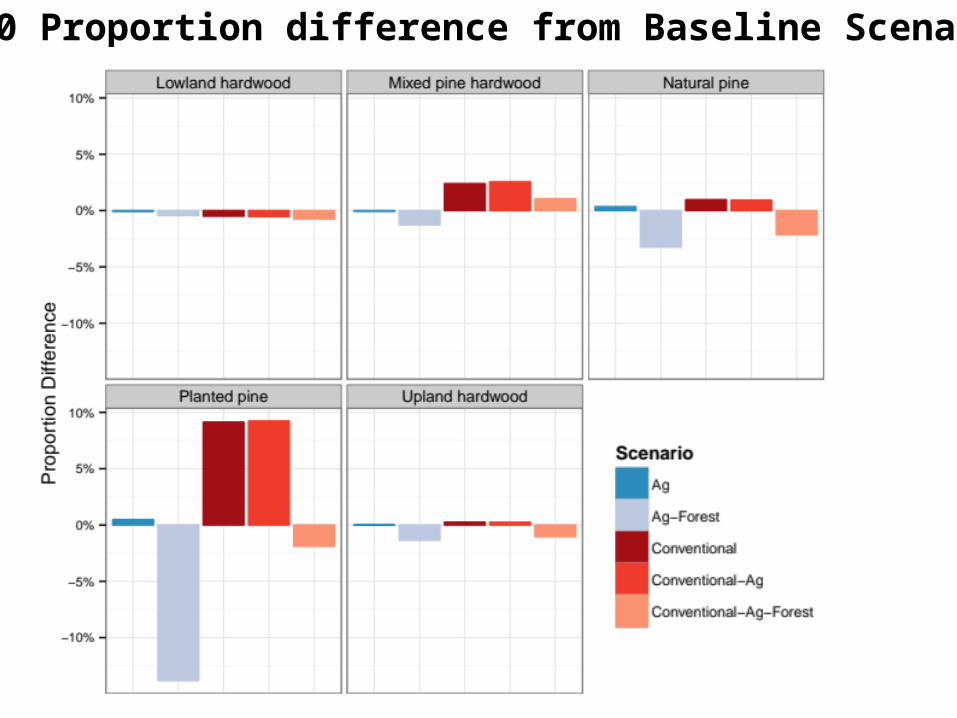
2050 Proportion difference from Baseline Scenario

2050 Proportion difference from Baseline Scenario:Seral Stage, All Forests

2050 Proportion difference from Baseline Scenario:Seral Stage, Lowland Hardwoods
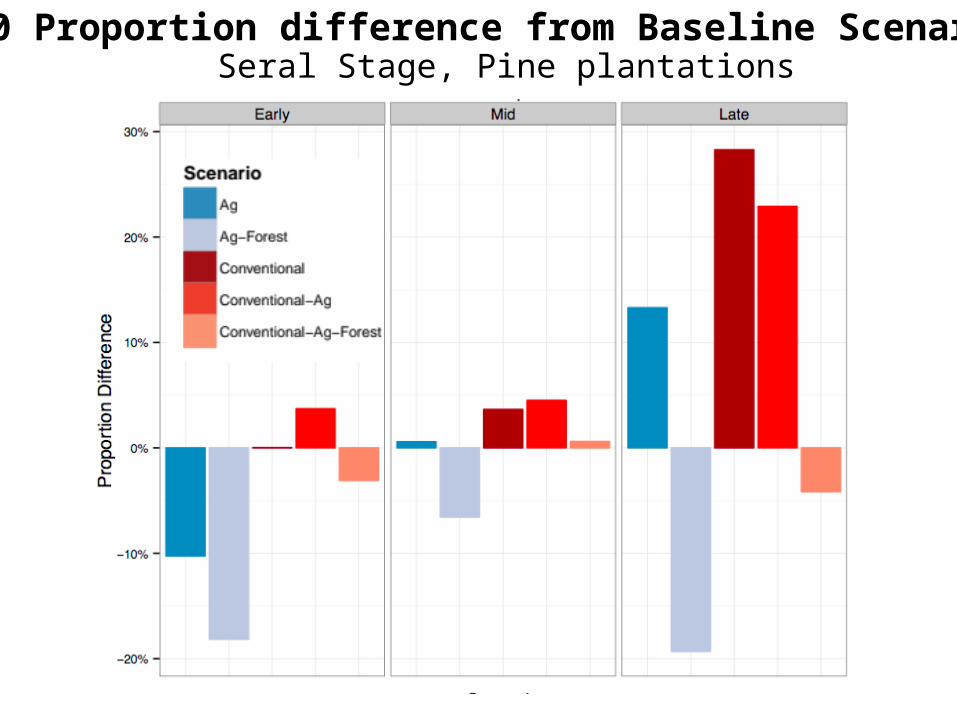
2050 Proportion difference from Baseline Scenario:Seral Stage, Pine plantations

Translating landscape results to potential species habitat
State classes Suitable/unsuitable habitat
• Deductive modeling based on literature• Pixels in the current species range classified as
suitable or unsuitable: potential habitat• Not considering species interactions, etc.

Example results: Brown-headed Nuthatch- Affinity: open, mature pine forests- Recent sharp declines due to pine plantations Photo: David Bell
% Change in potential habitat from 2009 Difference in area compared to baseline

Wildlife species we modeled
Birds (12)Brown-headed NuthatchCerulean WarblerGrasshopper SparrowHairy WoodpeckerKentucky WarblerLoggerhead ShrikePrairie WarblerProthonotary WarblerRed-headed WoodpeckerSwainson’s WarblerWood ThrushYellow-breasted Chat
Amphibians (4)Eastern tiger salamanderGopher frogOak toadMole salamander
Summary
• The STSM framework is useful for assessing change through time
• Biomass demand, especially in conventional forests, helps keep some forests on the landscape
• Remaining forest tends to have more area in early succession state
• In some cases, species could be positively impacted by biomass production
• There remains much uncertainty regarding landscape and species impacts
• This famework can be applied to assess potential positive and negative impacts of other bioenergy and forest management scenarios
Acknowledgements
People:Todd EarnhardtMatt RubinoNathan TarrAshton DrewSteve WilliamsRonalds GonzalezDennis Hazel
Funding: