landscape evolution of mesozoic sediments in the andamooka ... · the mesozoic sediments preserve...
TRANSCRIPT

1
Landscape evolution of Mesozoic
sediments in the Andamooka area,
incorporating remotely sensed ASTER
data to facilitate future mineral
exploration
Mathew Kavanagh
Geology and Geophysics, School of Earth and Environmental Sciences
University of Adelaide, Adelaide SA 5005 Australia
Supervisor: Dr Robert Dart
Co-supervisor: Dr Steve Hill
2011

2
i. Abstract
Regolith and sedimentary material overlying potentially enriched basement, is an
ever-present obstacle in the highly prospective Olympic iron-oxide copper gold
(IOCG) Province, South Australia. The Eromanga Basin, composed of Mesozoic
sediments - Algebuckina Sandstone, Cadna-owie Formation and Bulldog Shale -
overlies the northern extent of the Stuart Shelf, including the Olympic Dam IOCG
province. The closest surface exposures of these sediments to Olympic Dam, is
around the opal mining town of Andamooka. The formation and distribution of the
precious opal has been previously linked to fluctuating water tables. However,
oxidation of pyrite by fluctuating water table height, caused by intracontinental
extensional faulting in the area, provides an enhanced interpretation linking opal
distribution with the presence of jasper and silcrete lag. Extensional fault boundaries
were identified through contrasting regolith and landform components observed from
field mapping and remote sensing imagery. ASTER band ratios and relative
absorption-band depth ratios complimented field observations with ratios primarily
useful in distinguishing high reflectance homogenous mineral groups e.g. opal
diggings and sand dunes. A regolith-landform map and digital elevation model over
the area identifies the contrasting units, with opal diggings (digitised from ASTER
imagery) strongly associated with higher elevations.
The potential for secondary economic mineralisation is proposed for the Andamooka
area. A source material (Olympic IOCG Province), transport mechanism (extensional
duplex faulting), and potential trap rock (REDOX boundaries and varying

3
permeability of Mesozoic units) all contributed to a prospective exploration model for
the area.
Key words: Andamooka; Eromanga Basin; Mesozoic sediments; Bulldog Shale;
Algebuckina Sandstone; Cadna-owie Formation; ASTER satellite imagery; opal

4
Table of Contents i. Abstract...................................................................................................................... 2
1. Introduction .............................................................................................................. 6
1.1 Project aims .......................................................................................................... 6
1.2 Geological setting ................................................................................................ 6
1.2.1 Algebuckina Sandstone ................................................................................. 8
1.2.2 Cadna-owie Formation................................................................................ 10
1.2.3 Bulldog Shale .............................................................................................. 13
1.3 Regolith and landscape evolution ...................................................................... 15
1.4 Remote sensing background .............................................................................. 17
2. Methods ................................................................................................................... 18
2.1 Regolith-landform mapping ............................................................................... 18
2.2 Soil diagnostic tests............................................................................................ 19
2.3 Hylogger analysis............................................................................................... 20
2.4 ASTER analysis using band ratio processing .................................................... 21
2.5 Supervised classification using combined ASTER data and field observations 23
2.6 Digital elevation model ...................................................................................... 23
3. Results ..................................................................................................................... 24
3.1 Regolith-landforms ............................................................................................ 24
3.2 Remote sensing imagery .................................................................................... 28
3.3 Hylogger analysis............................................................................................... 31
4. Discussion................................................................................................................ 32
4.1 Regolith-landform map and landscape evolution .............................................. 32
4.2 ASTER analysis ................................................................................................. 38

5
4.3 Hylogger interpretations .................................................................................... 40
4.4 Mineral prospectivity ......................................................................................... 40
4.5 Scope for further study....................................................................................... 41
5. Conclusion .............................................................................................................. 43
6. Acknowledgements ................................................................................................ 44
7. References ............................................................................................................... 45
8. Figure captions ....................................................................................................... 51
9. Figures ..................................................................................................................... 53
10. Tables .................................................................................................................... 69

6
1. Introduction
1.1 Project aims
The aim of this project was to: i) construct a regolith-landform map for the
Andamooka area and interpret the landscape evolution; ii) identify relationships
between field observations and remotely sensed data; and iii) evaluate the mineral
prospectivity of the area. This was accomplished through a combination of field and
laboratory work.
The Andamooka location was selected because of its close proximity to
mineralisation at Olympic Dam and the presence of Mesozoic sediments exposed at
the surface. In other areas these units have been found to act as a trap for secondary
mineralisation (Hill and Hore 2010). This study focuses on the surface expression and
composition of the Mesozoic sediments, as they constitute part of the regolith
components which blanket the mineral enrichment, causing difficulty in exploration
whilst potentially hosting secondary mineralisation.
The results of this project will contribute to the Deep Exploration Technologies
Cooperative Research Centre’s (DET CRC) overall study of the Stuart Shelf region,
with the objective of assisting exploration drilling through a better understanding of
overlying cover material.
1.2 Geological setting
The Stuart Shelf in the Gawler Craton, South Australia is host to Olympic Dam, one
of the world’s largest known iron oxide copper gold (IOCG) deposits. Additional

7
IOCG type prospect have been discovered in the surrounding area at Acropolis,
Wirrda Well, Oak Dam and Prominent Hill, demonstrating the prospectivity of the
area (Belperio et al. 2007; Skirrow and Davidson 2007). Despite these discoveries,
Prominent Hill is currently the only deposit considered economical to mine and hence
the only one in operation. Exploration has been difficult in this prospective province,
due to a thick blanket of cover (e.g. Mesozoic sedimentary units) overlying the Cu-Au
enriched Hiltaba granite basement (Lambert et al.1987). Despite this challenge, the
area still remains highly prospective with innovative exploration methods being
implemented. One such technique involves investigating the regolith-landscape
evolution for an area (Craig et al. 1999).
The opal mining town of Andamooka is located on the Stuart Shelf approximately
600 km north of Adelaide and 30 km east of Roxby Downs (Figure 1). Due to the
prosperity of opal mining in the region and its proximity to Olympic Dam, further
mineral exploration in Andamooka has been relatively incomplete. Research
completed in the area has either been on a regional scale or has been concerned with
the presence and distribution of opal (Johns 1968; Carr et al. 1979). Although these
publications are focused on opal, they also provide an insight into the overall geology
of the district. The following geological units have been proposed from the surface
geology around Andamooka; – Proterozoic metasediments (Adelaidean) and granite
(Hiltaba suite) basement underlying Neoproterozoic quartzite (Arcoona Quartzite),
unconformably overlain by Cambrian limestone (Andamooka Limestone) which lies
beneath a Mesozoic cover of sediments (Figure 2) (Wopfner et al. 1970; Carr et al.
1979; Lambert et al. 1987). The Mesozoic sediments preserve evidence of a transition
from a terrestrial-fluviatile environment (Algebuckina Sandstone) to a transgressional

8
marine setting (Cadna-owie Formation and Bulldog Shale) (Wopfner et al. 1970).
This stratigraphy has been well documented with similar observations made over
much of northern South Australia and western Queensland (Wopfner et al. 1970;
Twidale and Campbell 1991; Campbell and Haig 1999; Veevers 2006; Wopfner
2010). It is widely accepted that the Mesozoic sediments, which cover much of the
area, were deposited in a sedimentary basin (Eromanga Basin) that initiated in the
early Jurassic, forming over the previously stable Gondwana surface (Wopfner 2010).
1.2.1 Algebuckina Sandstone
Stratigraphy
The term Algebuckina Sandstone was first used by Sprigg (1958) to classify ―a gently
dipping sequence of cross bedded grits and sandstones... which overlap on to the
folded Precambrian of Mt. Dutton and the Peake and Denison Ranges‖. This term has
since been modified by Wopfner et al. (1970), to further classify the change within
the stratigraphy. The Algebuckina Sandstone at Andamooka consists of medium grain
to conglomerate arenite beds (occasional presence of gold), unconformably overlying
pre-Jurassic rocks, which vary from deeply weathered and kaolinized material to
quartzite. An upper and lower unit of the Algebuckina Sandstone has been defined
(Wopfner et al. 1970) - the lower unit consists of moderately well sorted fine to
medium grained kaolinitic sandstone, with angular to sub angular milky to clear
quartz grains. Pyrite concretions and pebble conglomerate units appear mid-way
through the unit with angular current bedding. The upper part of the unit is
characterized by ferruginous layers leading to very well sorted clean semifriable
quartz sandstone (quartz arenite), with silicification producing a quartzitic crust

9
(Figure 3). The unit is disconformably overlain, generally by the Cadna-owie
Formation.
Other distinguishable features include the abundance of kaolinite and absence of
feldspars, wood and leaf fossils preserved at the top of the unit, and preservation of
angular and concavely current beds in the upper sandstone. Overall this unit has a
high porosity factor, which has resulted in multiple stages of ferruginisation
throughout beds in the upper part of the unit.
Depositional environment
Wide exposures of Algebuckina Sandstone have been noted along the south western
margin of the Eromanga Basin around Oodnadatta (Algebuckina Hill), Mount Dutton
and the Peake and Denison Ranges. Using observations made at sporadic exposures of
the Algebuckina Sandstone, the following depositional interpretations have been
made by Wopfner et al. (1970) and Harris (1962). Fossilized wood, fern and other
plant fossils preserved in the upper well sorted sandstone have been defined as upper
Jurassic to late Cretaceous age (Harris 1962). The environment at the time is
described as terrestrial with a temporal climate (shown by the presence of ferns
cycads and members of the Araucariaceae family (Harris 1962)). This indicates a
fluvial terrestrial high weathering depositional environment for most, if not all, of the
Algebuckina Sandstone’s depositional history. The presence of large quartz and
sandstone gravels at the base of the unit indicates a high energy fluvial system during
the initial stages of deposition. As the sediments fine upwards, the energy of the
environment is predicted to have subsided. This variety in sediment size, erosional
features and the presence of angular and concavely current beds are all supportive of a
braided river system.

10
Throughout and following the Algebuckina Sandstones’s depositional history, the
system is believed to have been subjected to intense weathering and erosion (Wopfner
1964). This is shown by the dominance of rounded quartz clasts, presence of alluvial
gold and dominance of kaolinitic grains observed throughout the system.
Subsequently, the protolith was presumably rich in quartz and aluminium silicates,
with the highly resistant quartz grains remaining relatively stable throughout the
entirety of the depositional system. Meanwhile the aluminium silicates (presumably
feldspars) are believed to have weathered to the kaolinitic matrix observed today. The
effect of latter stages of erosion (during the Algebuckina Sandstone’s depositional
history) is also noted by the erosional disconformity of the overlying Cadna-owie
Formation, which marks the onset of the marine transgression.
1.2.2 Cadna-owie Formation
Stratigraphy
The term Cadna-owie Formation was first proposed by Wopfner et al. (1970) to
describe the mappable transition from the Algebuckina Sandstone to the Bulldog
Shale. Wopfner et al. (1970) noted that despite the overall heterogeneity of the
composition, the unit is clearly distinguishable by its ―characteristic arenaceous rock
types...and gently undulating erosion surface on the Algebuckina Sandstone‖. At
Andamooka, the base of the Cadna-owie Formation is marked by an erosional
disconformity overlying the Algebuckina Sandstone. The lower part of the unit is
characterised by well sorted fine to medium grained sandstone, ranging to kaolinite in
parts, distinguishable by buff-brown colour staining throughout (caused by
weathering of the sandstone). This is overlain by ~2-5 m of prominent well cemented
iron oxide sandstone (i.e. ferricrete), which also shows mottled staining observed in

11
the lower part of the unit. A white coloured fine sand layer with pyrite concretions is
found in the upper middle section. This is followed by characteristic calcareous beds
marking the upper part of the Cadna-owie Formation, capped by milky quartz clasts
locally cemented in a highly resistant silicified matrix. This Cadna-owie Formation is
conformably overlain by the Bulldog Shale (Figure 4).
Fossils have been observed throughout the Cadna-owie Formation (Harris 1962;
Ludbook 1965; Ludbrook 1966; Wopfner et al. 1970). Plant and fern fossils have
been found in the lower Cadna-owie Formation, similar to those observed in the upper
Algebuckina Sandstone. Fossilised microflora and limited fauna have also been
documented, with Gaudryinella permacra the only diagnostic fossil indicating a
marine environment (Harris 1962; Ludbrook 1966).
In other areas of exposed Cadna-owie Formation (such as at Mount Anna and
Oodnadatta) the lithology varies, containing an abundance of mica and feldspar
minerals that are importantly lacking in the overall Algebuckina Sandstone
stratigraphy. Rhyolite pebbles observed at Mt Anna (classified as Mt Anna Sandstone
Member) and interpreted as being sourced from the Gawler Range Volcanics, have
considerable implications for the interpretation of the continental environment at the
time of deposition (Rogers and Freeman 1993). The Mt Anna Sandstone Member was
not observed in the study area.
Depositional environment
Until Wopfner et al. (1970) classified the Cadna-owie Formation (similar to the one
defined above), the boundary between the Jurassic fluvial sandstone and the
Cretaceous marine sediments was relatively undefined and consequently under-
classified. In the majority of cases, where part fluvial to marine sediments were

12
observed it was largely either classified as Algebuckina Sandstone or Bulldog Shale,
with some guesswork involved. Using the classification above, the following
depositional setting can be interpreted. Prolonged periods of intense weathering and
erosion resulted in a new depositional environment, overlying the previously formed
Algebuckina Sandstones (evident by the undulating erosional surface). The base fine
sand is believed to have formed in a marginal marine (beach) setting with well sorted
fine sand grains being deposited. As the transgression gradually took place, the water
level migrated over these sand beds, depositing calcium carbonate rich material (dead
marine organisms), similar to that observed in present day shallow marine systems.
As the sea transgressed further inland, the water depth increased, leading to the
deposition of the Bulldog Shale. The mottled staining observed throughout patches of
the unit occurred later as it was subjected to oxidation and intense weathering, in
particular affecting the iron rich sediments in the stratigraphy.
The presence of feldspars and micas noted elsewhere in the Eromanga Basin provide
a greater insight into the continental environment at the time. As both feldspar and
mica minerals are significantly susceptible to weathering, a system allowing for rapid
deposition is required. This consequently implies a mild tectonically unstable
environment. The clasts of Rhyolite pebbles, found in the Mt Anna Sandstone
Member (which are derived from the Gawler Range Volcanics) provides evidence for
a direction of flow to be determined (Rogers and Freeman 1993). The stratigraphy
sequence is believed to have formed in a high energy tectonically unstable
environment with river systems originating in the west, and depositing sediment to the
east (Rogers and Freeman 1993).
13
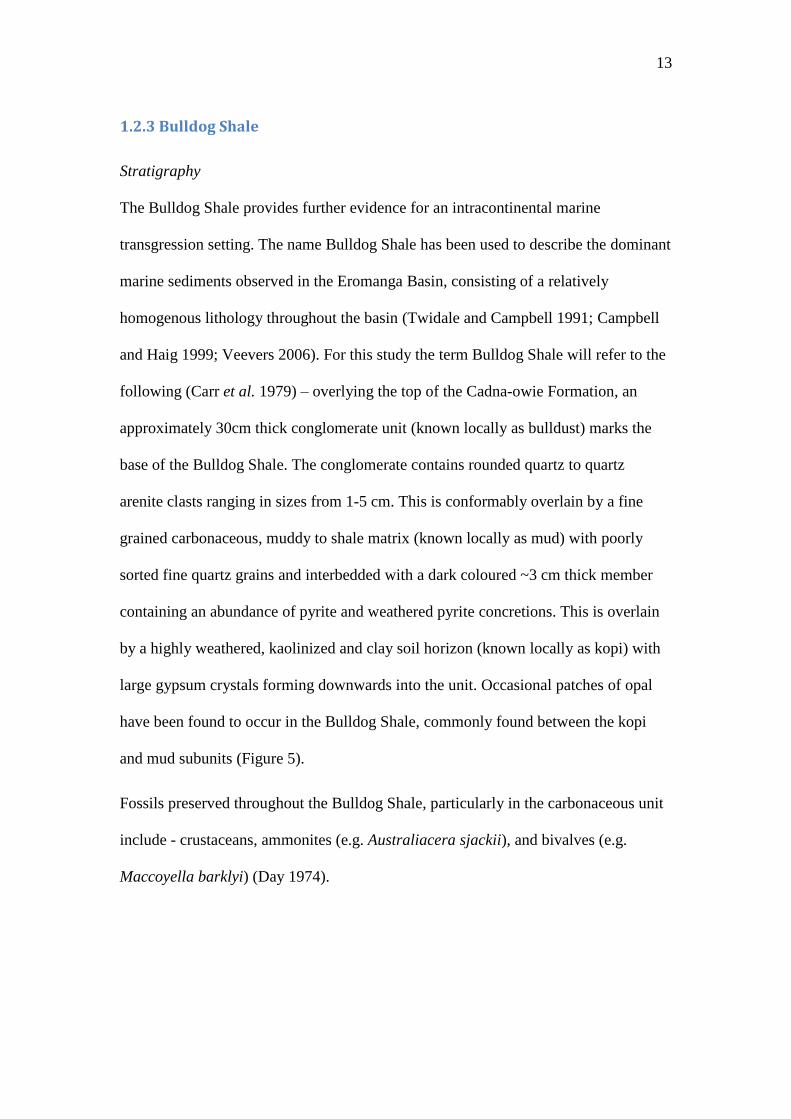
1.2.3 Bulldog Shale
Stratigraphy
The Bulldog Shale provides further evidence for an intracontinental marine
transgression setting. The name Bulldog Shale has been used to describe the dominant
marine sediments observed in the Eromanga Basin, consisting of a relatively
homogenous lithology throughout the basin (Twidale and Campbell 1991; Campbell
and Haig 1999; Veevers 2006). For this study the term Bulldog Shale will refer to the
following (Carr et al. 1979) – overlying the top of the Cadna-owie Formation, an
approximately 30cm thick conglomerate unit (known locally as bulldust) marks the
base of the Bulldog Shale. The conglomerate contains rounded quartz to quartz
arenite clasts ranging in sizes from 1-5 cm. This is conformably overlain by a fine
grained carbonaceous, muddy to shale matrix (known locally as mud) with poorly
sorted fine quartz grains and interbedded with a dark coloured ~3 cm thick member
containing an abundance of pyrite and weathered pyrite concretions. This is overlain
by a highly weathered, kaolinized and clay soil horizon (known locally as kopi) with
large gypsum crystals forming downwards into the unit. Occasional patches of opal
have been found to occur in the Bulldog Shale, commonly found between the kopi
and mud subunits (Figure 5).
Fossils preserved throughout the Bulldog Shale, particularly in the carbonaceous unit
include - crustaceans, ammonites (e.g. Australiacera sjackii), and bivalves (e.g.
Maccoyella barklyi) (Day 1974).

14
Depositional environment
The presence of fossilised marine organisms provides a significant insight into the
time and type of environmental setting for the Bulldog Shale. Crustaceans, ammonites
and bivalves are all marine organisms with similar ancestry observed today. The
environment would have therefore been similar to a shallow marine setting of today.
These organisms thrived in the lower Cretaceous (Jablonski 1987), consequently an
age can be defined for the sediments which preserve these fossils. Further work by
Exon and Senior (1976), Senior et al. (1978), Veevers (2006) and Campbell and Haig
(1999) has refined the Bulldog Shale age from Aptian to Albian (lower Cretaceous).
Exon and Senior (1976) also noted similar marine sediments in neighbouring basins to
the Eromanga (Carpentaria and Surat), concluding ~60% of Australia was submerged
during the early Cretaceous.
Another feature of note in the Bulldog Shale is the quartz conglomerate unit which is
believed to have been sourced from the underlying Cadna-owie and Algebuckina
Formations. As the transgression was in the early stages, the energy of the overall
system would have been relatively higher, similar to pebble lag horizons that form
during the onset of marine transgressions (Bhattacharya 1993; Donovan 1993;
Leithold 1994). As this subsided overtime, finer grained sediments (mud to shale)
were deposited with carbonaceous members attributed to the greater presence of
marine organisms.
Veevers (2006) speculates that the Bulldog Shale also contains an ash component in
the matrix, which originates from volcanism relating to extensional activity during the
breakup of the previously stable Gondwana supercontinent (Powell et al. 1988).
Veevers (2006) suggests that volcanism was occurring simultaneously with the

15
marine transgression on land, with emissions from the adjacent arcs settling into the
newly formed ocean where it was deposited within the Bulldog Shale matrix. Such a
conclusion leads to the following question of whether the marine transgression was
triggered by this rifting or whether external factors were at play. Numerous authors
have investigated this problem (Twidale and Campbell 1991; Campbell and Haig
1999; Veevers 2006), with many linking this transgressional event with a similar
Cretaceous marine transgression preserved in Northern America’s stratigraphy, the
Western Interior Seaway (Hart and Plint 1993; Nummedal and Molenaar 1995;
Campbell and Haig 1999). They argue that these two events imply globally high sea
levels during the Cretaceous that inundated many continental areas including the
previously stable Gondwana surface.
1.3 Regolith and landscape evolution
Andamooka is a dynamic evolving landscape, with continuous erosional processes
shaping numerous landforms observed today. These erosional processes, in particular
wind and water drainage, have produced a regolith dominated environment with
limited exposed geology in the area. The word ―regolith‖ is derived from the Greek
words for blanket or cover (regos) and rock (lithos). The definition of what defines a
regolith terrain has been fairly disputed in the past, with workers questioning whether
regolith should be restricted to unconsolidated material (Jackson 1997) or include
sequences of cemented units within unconsolidated units (Taylor and Eggleton 2001).
As cemented layers (e.g. silicified conglomerates) were observed within the Mesozoic
sediments and are still considered regolith components, this study will follow the
definition of Taylor and Eggleton (2001) – ―Regolith is all the continental lithospheric
materials above fresh bedrock and including fresh rocks where these are interbedded
16
with or enclosed by unconsolidated or weathered rock materials. Regolith materials
can be of any age‖.
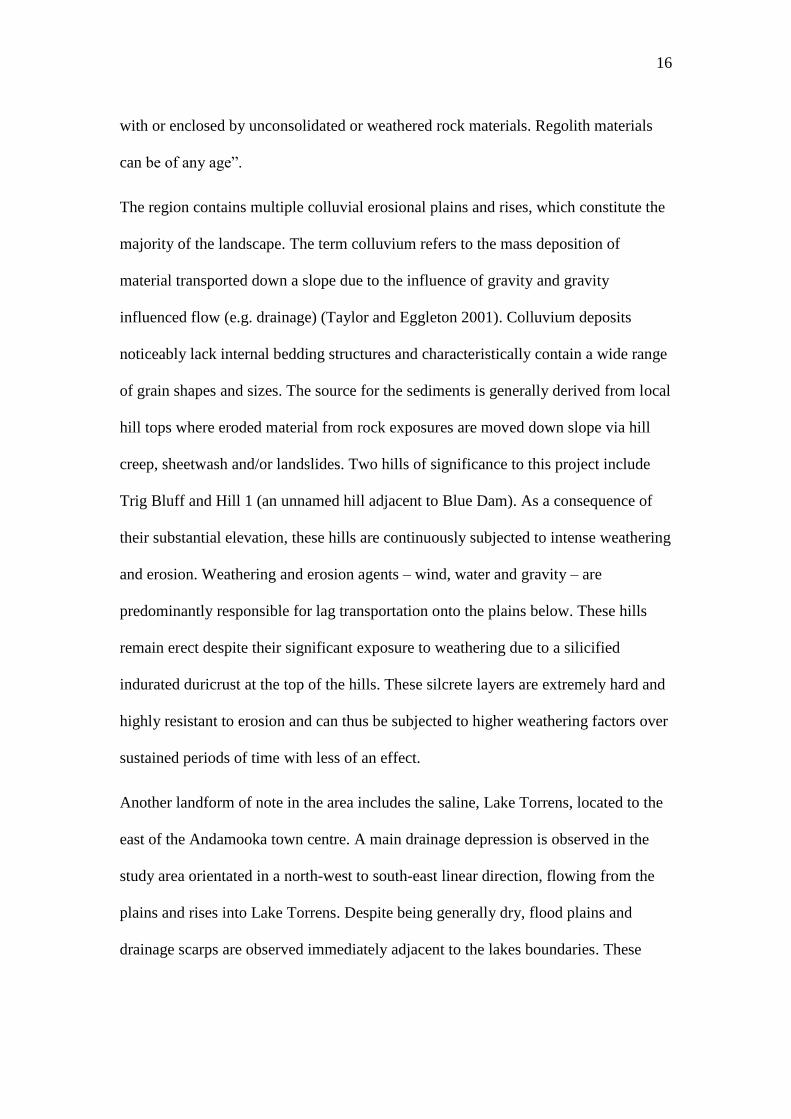
The region contains multiple colluvial erosional plains and rises, which constitute the
majority of the landscape. The term colluvium refers to the mass deposition of
material transported down a slope due to the influence of gravity and gravity
influenced flow (e.g. drainage) (Taylor and Eggleton 2001). Colluvium deposits
noticeably lack internal bedding structures and characteristically contain a wide range
of grain shapes and sizes. The source for the sediments is generally derived from local
hill tops where eroded material from rock exposures are moved down slope via hill
creep, sheetwash and/or landslides. Two hills of significance to this project include
Trig Bluff and Hill 1 (an unnamed hill adjacent to Blue Dam). As a consequence of
their substantial elevation, these hills are continuously subjected to intense weathering
and erosion. Weathering and erosion agents – wind, water and gravity – are
predominantly responsible for lag transportation onto the plains below. These hills
remain erect despite their significant exposure to weathering due to a silicified
indurated duricrust at the top of the hills. These silcrete layers are extremely hard and
highly resistant to erosion and can thus be subjected to higher weathering factors over
sustained periods of time with less of an effect.
Another landform of note in the area includes the saline, Lake Torrens, located to the
east of the Andamooka town centre. A main drainage depression is observed in the
study area orientated in a north-west to south-east linear direction, flowing from the
plains and rises into Lake Torrens. Despite being generally dry, flood plains and
drainage scarps are observed immediately adjacent to the lakes boundaries. These

17
contain an abundance of clay and sand sediments (with minimal lag) layered during
ephemeral wet periods.
1.4 Remote sensing background
Remote sensing is the use of sensors at a distance to acquire and analyse information.
A modern practice of remote sensing is the use of spacecraft and airborne sensors to
measure transmitted and reflected electromagnetic radiation from the earth’s surface.
Reflective values received by the sensors are then used in a wide range of analyses for
interpretation of features on the earth’s surface. This study evaluates the ability of
using Advanced Spacebourne Thermal Emission and Reflection Radiometer (ASTER)
on board the Terra satellite for geological and regolith-landform mapping around the
Andamooka area.
The ASTER sensor is a joint venture between Japan (METI) and America (NASA)
and was designed to produce high resolution multispectral images for interpretations
of surface temperature, elevation, reflectance and emissivity. The ASTER sensor
contains 15 bands with measurements in the visible-near infrared radiation (VNIR),
shortwave infrared radiation (SWIR) and thermal infrared radiation (TIR) (Figure 6).
ASTER contains a backward scanning band labelled VNIR_band3B designed to
calculate and produce digital elevation models for the mosaic tiles (Kalinowski and
Oliver 2004). It is important to note that this band should not be used in the
interpretation and processing of images, and thus should be excluded. The remaining
14 bands can be used in combination with each other to enhance and mask absorption
features in the respective parts of the spectrum (Kalinowski and Oliver 2004).

18
2. Methods
To meet the project aims of constructing a regolith landform map, interpreting the
landscape, and assessing the accuracy of using remotely sensed data, a combination of
field observations and laboratory work was performed. This section describes the
processes and steps completed to achieve these aims.
2.1 Regolith-landform mapping
Regolith-landform mapping encompasses the representation of regolith materials,
incorporating both the geomorphology and landscape controls for the individual
regolith landform units (RLUs) (Taylor and Eggleton 2001). It is of particular use for
areas where rock outcrop exposures are limited, and minimal previous geological
knowledge is known. Observations taken in the field included sediment orientation,
mineralogy, colour, consistency, porosity, rock strength, fabric, geomorphic
processes, grain size, sorting, lag, landforms, and weathering degree, processes and
structures. This classification follows guidelines suggested by Pain (2008). RLUs are
based on a combination of regolith units and their associated landforms, employing a
code system as shown in Figure 7. Units were characterised and classified based on
this system whilst in the field. GPS coordinates, and vegetation types were
additionally recorded. Grab samples were also collected at designated spots to
represent the soil and lag of each RLU (Figure 8). These grab samples were then used
for a range of analyses, including examination under the PIRSA (Primary Industries
and Resources South Australia) Hylogger, and a series of diagnostic soil tests (exact
methods used in these tests are described in the following subchapters). This data

19
aided in the production of the regolith landform map by helping to classify the RLUs.
The map was digitised based on the combined data from the RLUs (aided by
corresponding GPS points), with polygons digitised over georegistered background
aerial imagery and geology maps in ArcMap.
2.2 Soil diagnostic tests
Diagnostic tests were performed on the soil samples to analyse unique properties of
the soil. These tests included determining the texture, structure, colour and pH of the
soil. Soil texture is a measure of consistency, sampled using a small handful of soil to
represent the unit as a whole. The consistency is measured by kneading a handful of
moistened soil (approximately at field capacity) into a ball and ribboning the ball
between the thumb and forefinger. Textures are determined based on the feel of
kneading the soil and the length of ribbon achieved. The ribboning length is a good
indicator of the particles within the soil. Generally, shorter ribbons indicate greater
sand content, whilst longer ribbons indicate greater clay content. Wetherby’s (2006)
soil classification chart was used as a guideline to classifying soil textures (Figure 9).
Soil colour was also determined at field capacity. Colour values were determined
using the standard Munsell Colour Chart to approximate the hue, value and chroma of
the soil i.e. 10 YR (hue) 5 (value) / 2 (chroma). Apart from giving the reader an
interpretation on the soil’s appearance, colour values can be an indication of a soil’s
drainage property. Reddish hue’s within a B horizon indicate a high porosity, well
drained soil, whilst yellowish hues and gleys indicate poor drainage (Wetherby 2006).
Soil pH is a measure of acidity or alkalinity within the soil. It is an important property
of soils, as the pH has significant controls and consequences on chemical processes.
An example of such is the presence of extremely high acidic soils around oxidized

20
pyrite. The pH was tested by placing small amounts of the soil samples on a spot plate
and mixing them with dye indicator to their saturation point. Barium sulphate was
then sprinkled on top and left to rest until a change in colour was noted. The change in
colour was then compared with a pH colour card to approximate the pH of the soil
(accuracy ± 0.5). These soil diagnostic tests were then combined with field
observations including lag, landforms, vegetation and GPS coordinates to help
classify similar RLUs.
2.3 Hylogger analysis
Surface samples collected in the field at differing RLUs were separated into soil and
lag components in preparation for analysis with PIRSA’s Hylogger. The Hylogger
uses automated core tray handling, continuous visible and infrared spectroscopy and
digital imaging to characterise and identify spectral signatures for the mineralogy
(Mauger et al. 2004). These spectral signatures show absorption features within
measured spectral ranges characteristic of the mineral. For example, kaolinite is
distinguishable from other clay minerals by a doublet absorption in the 2200 nm range
(Mahoney et al. 2002) (Figure 10). Preparation of samples included placing
approximately 200 grams of each soil sample within labelled rock chip trays. Lag
samples were placed within labelled clear bags with at least one sample of each
different lag unit observed at each site. As the Hylogger is primarily used for scanning
standard sized core trays, the range and scope of the Hylogger sensor had to be
adjusted for the lag samples. To represent the lag observed on the surface, the whole
rocks from each profile were placed on the conveyor belt in a line of approximately
70 cm to 1 m. The Hylogger takes a photo of each sample and then scans horizontally
across the profile, propagating down with each completed scan. This resulted in a
21
series of spectral signatures for the samples, which were analysed and processed by
Georgina Gordon, a specialist spectral geologist with PIRSA. Processed data was in
the form of TSG files, viewed in TSG Viewer1. These files include images of the
samples and their associated main minerals as predicted by the software, based on
their SWIR and VNIR signatures. This information was used to help distinguish
RLUs based on their mineralogies.
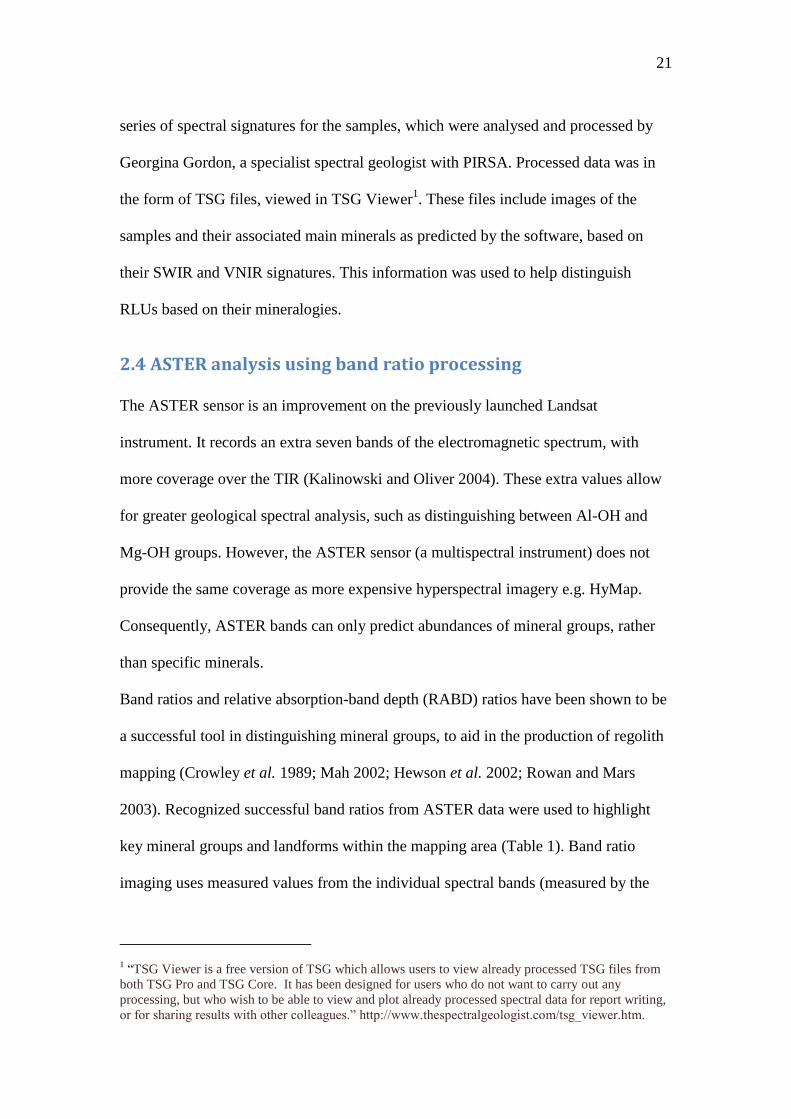
2.4 ASTER analysis using band ratio processing
The ASTER sensor is an improvement on the previously launched Landsat
instrument. It records an extra seven bands of the electromagnetic spectrum, with
more coverage over the TIR (Kalinowski and Oliver 2004). These extra values allow
for greater geological spectral analysis, such as distinguishing between Al-OH and
Mg-OH groups. However, the ASTER sensor (a multispectral instrument) does not
provide the same coverage as more expensive hyperspectral imagery e.g. HyMap.
Consequently, ASTER bands can only predict abundances of mineral groups, rather
than specific minerals.
Band ratios and relative absorption-band depth (RABD) ratios have been shown to be
a successful tool in distinguishing mineral groups, to aid in the production of regolith
mapping (Crowley et al. 1989; Mah 2002; Hewson et al. 2002; Rowan and Mars
2003). Recognized successful band ratios from ASTER data were used to highlight
key mineral groups and landforms within the mapping area (Table 1). Band ratio
imaging uses measured values from the individual spectral bands (measured by the
1 ―TSG Viewer is a free version of TSG which allows users to view already processed TSG files from
both TSG Pro and TSG Core. It has been designed for users who do not want to carry out any
processing, but who wish to be able to view and plot already processed spectral data for report writing,
or for sharing results with other colleagues.‖ http://www.thespectralgeologist.com/tsg_viewer.htm.

22
ASTER sensor) to highlight significant absorption and reflectance features. This is
achieved by running a model which divides one band’s strong absorption signal by
another bands weaker signal (e.g. band 5/band 6). RABD ratio imaging uses the
addition of multiple bands which border strong absorption feature and divide that
value by a band which records minimal absorption (i.e. RABD = (Band X + Band
Y)/Band Z). However before processing of the ASTER band ratios can be conducted,
images must be pre-processed.
ERDAS Imagine software was used in the production of pre-processed and processed
ASTER imagery. The ASTER sensor measures reflectance values over 3 parts of the
spectrum VNIR, SWIR and TIR. Consequently raw ASTER images are separated into
subsets of these three parts of the spectrum (with an extra image in the VNIR used in
the calibration of elevation values). A layer stack was conducted to incorporate all 14
bands into one useable image. This file was then reprojected to GDA94 Zone 53 to
align with GPS coordinates taken in the field. Additionally, the image was clipped to
only incorporate the project area to help with a supervised classification and accuracy
assessment i.e. ground truthing. Despite ASTER bands measuring within atmospheric
windows, distortion was still noted in the imagery and thus had to be accounted for
before use. A log residual tool was consequently used to atmospherically correct the
data to pseudo-reflectance (DN values). A log residual tool divides each pixel’s
reflectance value (Rpv) by the band’s mean (Rbm) and the mean of the whole image
(Rmi) (i.e. log residual DN value = Rpv / Rba / Rmi). This quick atmospheric correction
tool accounts for atmospheric absorption, solar illumination and sensor gains. Notably
cloud coverage is not corrected by this algorithm and had to be acknowledged in any
processed imagery. The log residual image was considered a viable representation of
the surface geology and used in the production of band ratio images. The model

23
maker tool enabled the selection of band ratios (Table 1) to enhance spectral
responses of interest. Resulting images were then used in conjunction with the
georegistered regolith map to firstly assess the validity of using ASTER data for the
project area and secondly highlight any features of interest previously overlooked.
2.5 Supervised classification using combined ASTER data and
field observations
A supervised classification was conducted in ERDAS Imagine using sample location
points as training areas. Area of interest (AOI) rectangles were digitized around GPS
coordinates of known units found in the field (e.g. Trig Bluff, opal diggings, Hill 1,
plains consisting of Bulldog Shale (CHep2) etc.). Multiple AOI rectangles were
selected as training sites, to represent the average spectral signature of the individual
units. A minimum distance to means classifier was then preformed. This associates
pixels in the image to the nearest training signature.
2.6 Digital elevation model
A digital elevation model was obtained from the Shuttle Radar Topography Mission
(SRTM) acquired in 2000 (Rabus et al. 2003). A standard deviation stretch was
performed in ArcMap to show enhanced visually identifiable elevation values for the
project area.
24
3. Results
Field observations are an integral component for understanding landscape features
and provide vital information to predict how the landscape evolved. It is important to
understand where units lie in the overall context of the system, such that anomalous
areas stand out for further investigation. In this study, field observations have
contributed significantly to interpretations made on the landscape evolution. Soil
diagnostic tests and remote sensing data were used to further examine areas of interest
noted in the field.
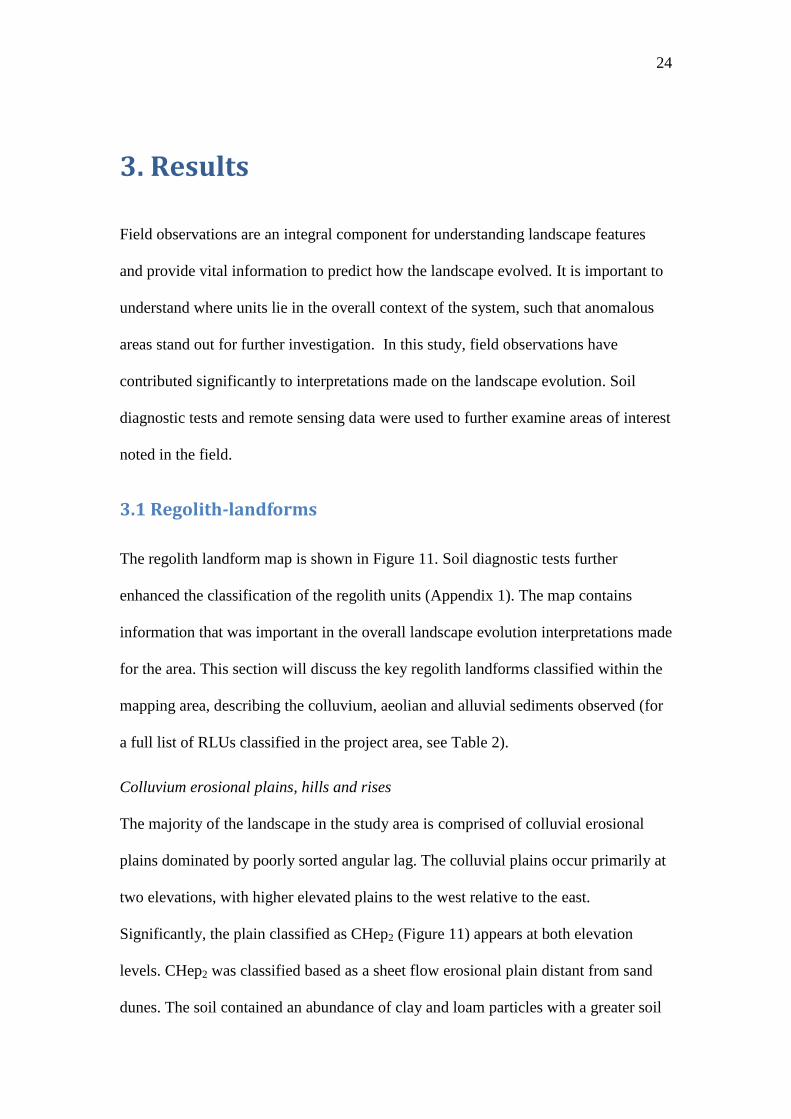
3.1 Regolith-landforms
The regolith landform map is shown in Figure 11. Soil diagnostic tests further
enhanced the classification of the regolith units (Appendix 1). The map contains
information that was important in the overall landscape evolution interpretations made
for the area. This section will discuss the key regolith landforms classified within the
mapping area, describing the colluvium, aeolian and alluvial sediments observed (for
a full list of RLUs classified in the project area, see Table 2).
Colluvium erosional plains, hills and rises
The majority of the landscape in the study area is comprised of colluvial erosional
plains dominated by poorly sorted angular lag. The colluvial plains occur primarily at
two elevations, with higher elevated plains to the west relative to the east.
Significantly, the plain classified as CHep2 (Figure 11) appears at both elevation
levels. CHep2 was classified based as a sheet flow erosional plain distant from sand
dunes. The soil contained an abundance of clay and loam particles with a greater soil
25
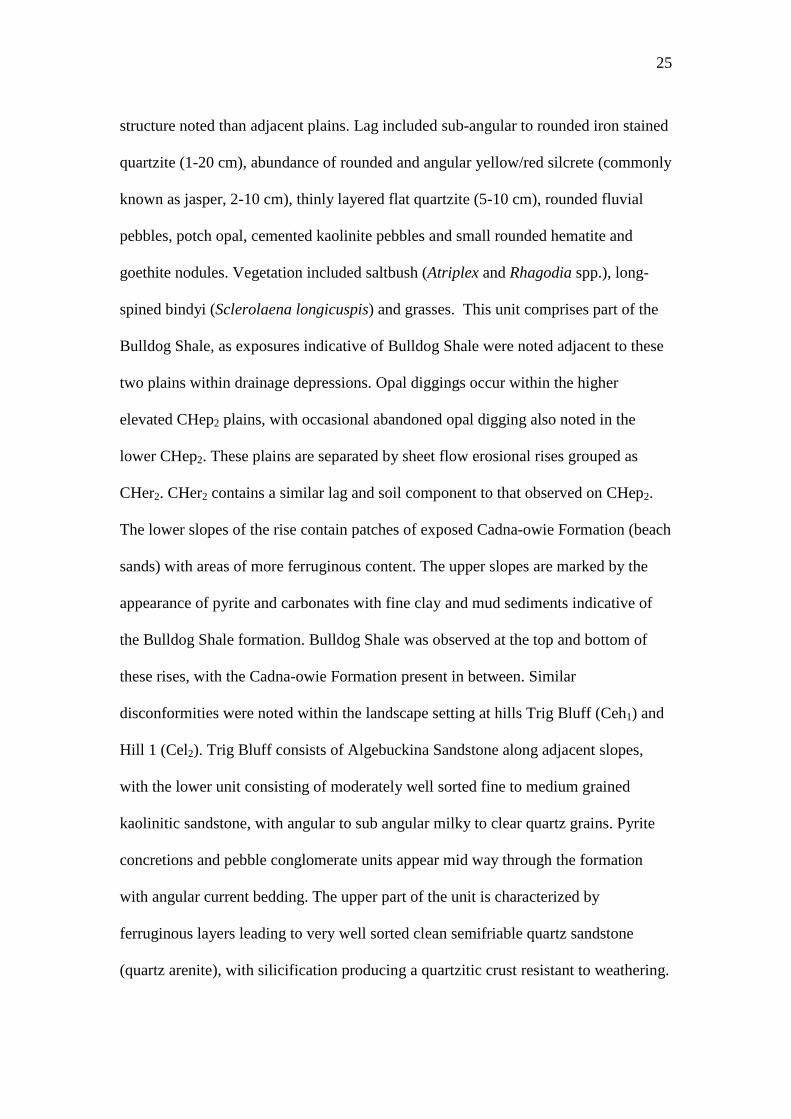
structure noted than adjacent plains. Lag included sub-angular to rounded iron stained
quartzite (1-20 cm), abundance of rounded and angular yellow/red silcrete (commonly
known as jasper, 2-10 cm), thinly layered flat quartzite (5-10 cm), rounded fluvial
pebbles, potch opal, cemented kaolinite pebbles and small rounded hematite and
goethite nodules. Vegetation included saltbush (Atriplex and Rhagodia spp.), long-
spined bindyi (Sclerolaena longicuspis) and grasses. This unit comprises part of the
Bulldog Shale, as exposures indicative of Bulldog Shale were noted adjacent to these
two plains within drainage depressions. Opal diggings occur within the higher
elevated CHep2 plains, with occasional abandoned opal digging also noted in the
lower CHep2. These plains are separated by sheet flow erosional rises grouped as
CHer2. CHer2 contains a similar lag and soil component to that observed on CHep2.
The lower slopes of the rise contain patches of exposed Cadna-owie Formation (beach
sands) with areas of more ferruginous content. The upper slopes are marked by the
appearance of pyrite and carbonates with fine clay and mud sediments indicative of
the Bulldog Shale formation. Bulldog Shale was observed at the top and bottom of
these rises, with the Cadna-owie Formation present in between. Similar
disconformities were noted within the landscape setting at hills Trig Bluff (Ceh1) and
Hill 1 (Cel2). Trig Bluff consists of Algebuckina Sandstone along adjacent slopes,
with the lower unit consisting of moderately well sorted fine to medium grained
kaolinitic sandstone, with angular to sub angular milky to clear quartz grains. Pyrite
concretions and pebble conglomerate units appear mid way through the formation
with angular current bedding. The upper part of the unit is characterized by
ferruginous layers leading to very well sorted clean semifriable quartz sandstone
(quartz arenite), with silicification producing a quartzitic crust resistant to weathering.

26
The hill is surrounded by older sheet flow plains (CHep5) dominated by flat angular
quartzite lag characteristic of the Arcoona Quartzite.
Exposures of Arcoona Quartzite were found within CHep5, with flat horizontal beds
of massive quartzite observed in-situ (Figure 12). Steeply bedded angular sheared
outcrop exposures were found in a strongly linear NE-SW orientation approximately
500 m from these exposures (Figure 13). Patches of gypsum and kaolinite soils
(Figure 14) were found in close proximity to these shear zones. Additionally, iron rich
fluid flows (forming along joints) and manganese staining were observed immediately
adjacent to these shear zone.
Hill 1 contains multiple exposures of the Cadna-owie Formation, observed within
drainage depressions down slope of the hill crest (eastern side). Exposures include
well sorted sandstones and kaolinite at the bottom, ferricrete, carbonaceous and pyrite
concretions appearing in the middle units, and silicified conglomerates capping the
top. Immediately below the hill in the drainage depression, adjacent to Blue Dam, is
exposures of Bulldog Shale. This provides a further example of younger stratigraphy
(Bulldog Shale) underlying an older formation (Cadna-owie Formation).
Aeolian sediments
Aeolian sediments, such as sand dunes, cover a majority of the interior Australian
continent (Wopfner and Twidale 1967). Of significance to this project include
longitudinal sand dunes located in the north and west of the project area. Longitudinal
sand dunes require a change in wind direction to allow for their linear orientation
(Wopfner and Twidale 1967). As the sand dunes contain a relatively homogenous
composition and distribution, they are herby classified into two groups ISul1 and
ISul2. ISul1 are sand dunes located in the west of the mapping area adjacent to CHep1.

27
The unit consists of aeolian deposited quartz sands with an iron component. ISul2 is
classified as longitudinal sand dunes located in the north of the mapping area. These
dunes contain a carbonate influence (observed by patches of white calcrete within the
soil) due to the presence of underlying limestone. Both units are clearly
distinguishable on the ASTER band ratio imagery.
Alluvial sediments
Lake Torrens (Lpl1) is a dry endorheic rift saline basin that formed within the Torrens
Hinge Zone (Twidale 1972; Belperio and Flint 1993). Many drainage depressions are
observed in the study area orientated in a north west to south east linear direction.
Despite being generally dry, floodplains and drainage scarps are observed
immediately adjacent to the lakes boundaries. These contain an abundance of layered
clay and sand sediments (with little lag) which formed during significant wet periods.
Apart from providing patches of exposed geology, which aid in the interpretation of
the landscape, the depressions remain relatively uniform. Consequently, the majority
of depressions have herby been classified as Aed1. These depressions include, an
abundance of reworked rounded sediments from the upper plains, including quartzite
pebbles, pink shales and conglomerates. An abundance of kaolinite and lack of sand
within the poorly structured soils along drainage beds was also noted. These
depressions are easily identifiable in the field and on remote sensing imagery due to
the abundance of vegetation in a linear orientation. Vegetation includes high density
Bullock Bush (Alectryon aleifolius), Western Myall (Acacia papyrocarpa), bluebush
(Maireana spp.), grasses, Malva sp. and saltbush (Atriplex and Rhagodia spp.).

28
3.2 Remote sensing imagery
Digital elevation model (DEM)
Field observations found the distribution of opals confined to the higher elevated
plains consisting of Bulldog Shale (CHep2). A correlation between the distribution of
opal diggings and elevation was conducted to quantify this field observation. A
statistical t-test was conducted for the opal diggings within the digital elevation model
(Appendix 2). The opal diggings were found to occur at an average elevation of
107.6 m above sea level, significantly higher than the surrounding study area (mean =
81.5 m; P-value < 0.0001; df = 248). The DEM also highlights drainage patterns
mirrored in the regolith-landform map. The drainage depressions in the study area are
concentrated where the elevation gradient is highest (i.e. in between high and low
elevation areas). In addition to the general northwest to southeast drainage pattern,
smaller offshoot drainage depressions from south west to north east are also
identifiable.
Band ratios of ASTER
Recognized ASTER band ratios (Hewson et al. 2002; Mah 2002) and relative
absorption band depth ratios (Table 1) (Ninomiya and Fu 2001; Crowley et al. 1989)
were used to compile ASTER imagery (Appendix 3). These assisted in the production
of the regolith-landform map. Any cloud coverage within the imagery causes high
reflectivity over most bands, and has consequently been noted for exclusion in
Appendix 3. The ASTER CSIRO regolith ratios were particularly useful in
distinguishing sand dunes, showing high contrast between the iron oxide rich sand
29
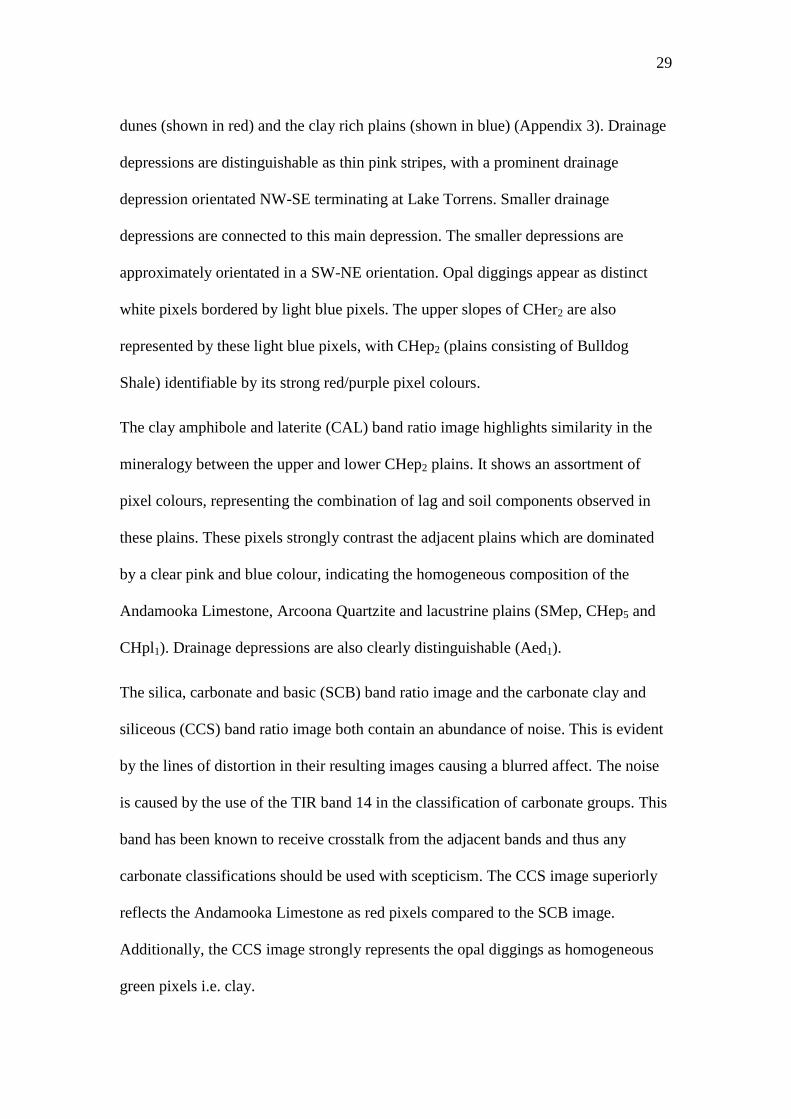
dunes (shown in red) and the clay rich plains (shown in blue) (Appendix 3). Drainage
depressions are distinguishable as thin pink stripes, with a prominent drainage
depression orientated NW-SE terminating at Lake Torrens. Smaller drainage
depressions are connected to this main depression. The smaller depressions are
approximately orientated in a SW-NE orientation. Opal diggings appear as distinct
white pixels bordered by light blue pixels. The upper slopes of CHer2 are also
represented by these light blue pixels, with CHep2 (plains consisting of Bulldog
Shale) identifiable by its strong red/purple pixel colours.
The clay amphibole and laterite (CAL) band ratio image highlights similarity in the
mineralogy between the upper and lower CHep2 plains. It shows an assortment of
pixel colours, representing the combination of lag and soil components observed in
these plains. These pixels strongly contrast the adjacent plains which are dominated
by a clear pink and blue colour, indicating the homogeneous composition of the
Andamooka Limestone, Arcoona Quartzite and lacustrine plains (SMep, CHep5 and
CHpl1). Drainage depressions are also clearly distinguishable (Aed1).
The silica, carbonate and basic (SCB) band ratio image and the carbonate clay and
siliceous (CCS) band ratio image both contain an abundance of noise. This is evident
by the lines of distortion in their resulting images causing a blurred affect. The noise
is caused by the use of the TIR band 14 in the classification of carbonate groups. This
band has been known to receive crosstalk from the adjacent bands and thus any
carbonate classifications should be used with scepticism. The CCS image superiorly
reflects the Andamooka Limestone as red pixels compared to the SCB image.
Additionally, the CCS image strongly represents the opal diggings as homogeneous
green pixels i.e. clay.

30
Similarly, the structural features (SF) band ratio shows the opal diggings as bright
blue pixels. The SF image also shows linearly orientated thin structures, vaguely
represented by thin bands of blue-green pixels. In most cases these bands appear
immediately adjacent to drainage depressions, but they also appear on the plains.
The Al-OH band ratio image clearly distinguishes boundaries between differing
landforms. In particular the image represents the wash off of slopes that forms the
smaller drainage depressions, displaying these areas as white-light pale blue pixels.
This image strongly reflects the drainage contours of that perceived in the DEM and
that of the RLU boundaries between CHep5 and CHer3.
The band ratio image highlighting areas of discrimination for mapping was
particularly useful in distinguishing the boundary between CHep1 and CHep2. CHep1
is clearly distinguishable by its vibrant yellow colour pixels similarly reflected in the
brighter colour pixels observed for the sand dunes.
Supervised classification
The supervised classification (Appendix 4) is limited to the amount of knowledge
known for the area. Pixels were associated to training sites based on their signature
values, which best reflected the training sites spectrum average. Consequently, pixels
could only be associated to predefined classes, which is not ideal for heterogeneous
landscapes. Despite multiple misclassifications being noted (e.g. opal diggings as
clouds), the supervised classification remarkably reflects the base of the CHer2 RLU.
The pixels labelled as Cadna-owie Formation in the supervised classification largely
mirror those identified in the RLU as CHer2. Furthermore, the boundary with the
Bulldog Shale in the upper slopes of the unit is also shown. As such, this technique
31
provides a possible way of distinguishing the approximate boundary between the
Bulldog Shale and the Cadna-owie Formation.
3.3 Hylogger analysis
Appendix 5 lists the main minerals predicted for the lag and soil samples based on
their SWIR and VNIR spectral signatures. From the SWIR signatures the Hylogger
primarily seems to be able to predict and distinguish between clays and other Al-OH
minerals. This is evident by the mineral abundances predicted in the samples, the
most common minerals including, kaolinite, montmorillonite, muscovite, illitic-
muscovite, dickite and palygorskite. In addition the Hylogger is also able to
successfully determine the presence of carbonate minerals with calcite, dolomite,
ankerite and siderite all being associated with units known to contain a carbonaceous
component (i.e. Andamooka Limestone SMep, Bulldog Shale CHep2 and upper part
of the Cadna-owie Formation CHer2). The VNIR signatures from the Hylogger were
able to distinguish the presence of Fe-O minerals - goethite and haematite. In the
majority of cases goethite was associated with aspectral minerals. Noticeably quartz
and siliceous minerals were significantly under classified. Despite numerous silcrete
and quartzite lag samples being analysed, no Hylogger results indicated siliceous
minerals. Commonly these samples were classified as aspectral or null, with
occasional clay minerals (from weathered/and or contaminated soil/dust coatings)
appearing in the results.

32
4. Discussion
Data analysis has been used to complement and contribute to field observations and
interpretations for the landscape evolution. Mainly, field observations and data
analysis have been used in combination to produce a regolith-landform map, which
highlights details unattainable solely from the previous geological map for
Andamooka (Figure 2). In particular, the Cadna-owie Formation and Algebuckina
Sandstone lithologies have hereby been distinguished as separate units (previously
grouped together). Additionally, surface disconformities have been investigated in
detail, examining the boundaries between differing lithologies and the possible
structures that could cause them.
4.1 Regolith-landform map and landscape evolution
The regolith-landform map visually conveys field observations made distinguishing
lithological boundaries. These boundaries have significant implications for the
proposed landscape evolution of Andamooka. Of particular significance, includes the
observed continuous transitional boundary between the Cadna-owie Formation and
Bulldog Shale made along the rises (CHer2) of adjoining plains (CHep2).
Additionally, Bulldog Shale exposures were noted beneath the Cadna-owie Formation
(Cel2) in adjacent drainage depressions. These observations consequently lead to the
following interpreted stratigraphy of older (Late Jurassic-Early Cretaceous) Cadna-
owie Formation interbedded between younger (Cretaceous) Bulldog Shale. As there is
an obvious disconformity between these units, a structural input is required.
Extensional faulting is one mechanism proposed for this disconformity. Multiple
33
normal faults orientated in a NE-SW direction are predicted throughout the project
area, resulting in sharp boundaries between differing units (Figure 15). In the majority
of cases, these faults have not been directly observed due to overprinting of drainage
depression sediments. However, a shear zone in a NE-SW direction was noted in the
Arcoona Quartzite bordering the lower Bulldog Shale plain. This shear zone was
distinguished based on observations of linearly orientated steep angular bedded
outcrop exposures of Arcoona Quartzite, adjacent to a horizontally bedded outcrop.
The Arcoona Quartzite widely remains homogenous with flat horizontal beds
observed throughout the majority of the unit. The reduction in grain size also noted is
interpreted as a mylonite texture, providing further evidence of shearing.
As the shear zone influences both the Arcoona Quartzite and Bulldog Shale, an
approximate age can herby be defined for this extensional stress. Extensional forces
must have been present from as young as the Cretaceous. As the Australian continent
has not been on a plate boundary since the Cretaceous, intracontinental stresses
presumably play a vital role in faulting for this area (Sandiford 2003). However, the
shear zone itself may have originated as late as the Neoproterozoic, with younger
reactivated faults possible. The landscape evolution is hence predicted to have been
significantly controlled by tectonic activity in the area. Extensional faulting may
account for the distribution of Bulldog Shale (CHep2) at high and low elevations, with
outcrop hills of Cadna-owie Formation and Algebuckina Sandstone being exhumed.
Remnants of these hills are still exposed due to localised silicification producing a
highly resistant indurated crust. These hills are herby viewed as preserved horsts with
the adjacent lower plains assumed to be grabens. Figure 16 illustrates the interpreted
boundaries of the units with relation to predicted normal faults in the study area.

34
The presence of white kaolinitic and gypsum rich soils could be a direct result of
faulting in the area. These soils were commonly found adjacent to these linear shear
zones overlying Arcoona Quartzite. As this unit is pure quartzite and does not contain
feldspar, the parent material for the kaolinite has previously been unknown (Wopfner
2010). It is proposed that these soils may have formed from transported material from
the Bulldog Shale due to the abrupt proximity of these units, caused by the faults.
Alternatively, these soils may be remnants of the previously highly weathered
Gondwana surface, discussed by Wopfner (2010).
Based on the geology, regolith-landform maps and band ratio images, there is an
obvious contact boundary between the geology north and south of the main drainage
depression. The main drainage depression in the north of the project area, orientated
north-west to south-east, is also assumed to be overprinting a fault scarp. The DEM
shows the contrast in elevation between the areas adjacent to this depression. An
oblique dextral strike slip fault is assumed, allowing for the exhumation of the
Cambrian Andamooka Limestone, whilst also accounting for the lateral displacement
of the Bulldog Shale. The smaller extensional faults are believed to be connected to
this larger strike slip faults i.e. an extensional duplex system.
Extensional faults caused by intracontinental neotectonism have also been
documented in similar Mesozoic sediments elsewhere in South Australia (e.g. near
Lake Eyre and Four Mile) (Reynolds et al. 2003; Sandiford 2003; Waclawik 2006;
Hill and Hore 2010). Reynolds et al. (2003) attributes changing plate boundary
interaction rates between the Indo-Australian and Pacific plates as the cause for
intracontinental stress, resulting in these faults. Sandiford (2003) acknowledges the
variation of stresses caused by modern plate boundaries as the possible mechanisms

35
for reactivation of faults for extensional activity across south-eastern Australia.
Consequently, post Cretaceous extensional faulting allowing for the modern
landscape formation is plausible.
Opal formation and distribution
Previous studies (Johns 1968; Carr et al. 1979) have discussed the stratigraphy of
known opalisation and its presence in the Bulldog Shale. However, no studies have
provided an overall model for opal exploration. The results presented above
demonstrate, a strong correlation between successful opal diggings and regions of
higher elevations, as shown in the DEM (Appendix 2). As the majority of diggings in
the lower plains of Bulldog Shale have been unsuccessful, horst blocks caused by
faulting are considered to be associated to opal distributions. One possible explanation
for this is the oxidation of pyrite within the Bulldog Shale initiating opal formation.
This proposed extensional faulting resulted in exhumation and oxidation of the pyrite
rich lithology in the Bulldog Shale. Oxidation of pyrite resulted in the formation of
sulphuric acid solutions that permeated throughout the Bulldog Shale leaching
aluminium (Al) from aluminium silicates (such as kaolinite, shale etc.) from within
the unit, leaving free silica. Opal then formed when the silica was hydrated
(accumulated in the ground water), and precipitated due to fluctuating water table
height within suitable crevices or trapped by permeability barriers.
This interpretation supports Carr et al.’s (1979) documentation of opal diggers’
observations that opal is commonly associated with the up-thrown side of ―slides‖ or
―slips‖ (i.e. faults), often forming shallow flexure basins on the up-thrown side
(Figure 5).

36
The pH readings taken from the plains consisting of Bulldog Shale were expected to
show acidic values for these soils, however few showed significant results. This may
be due to insufficient samples, pH re-neutralisation over time, unreliable results from
surface soil or a fault with the field pH testing kit. Therefore soil pH findings can
consequently not be solely used to prove or disprove this theory.
It should be noted that opal distributions have been largely based on aerial
photography of successful opal diggings. The assumption that opal distribution is
restricted to these diggings should be viewed with caution. For example it is possible
that the opals are present within the grabens, however they have yet to be discovered
due to the increased overburden.
Silcrete, jasper, goethite and haematite formation and distribution
Similar to the opal formation, exhumation and oxidation caused by extensional
faulting is believed to have contributed significantly to the formation of siliceous and
ferruginous materials in the region. Silcretes can broadly be classified into two groups
– pedogenic and groundwater silicates. This study proposes that the majority of
silcretes observed in the area are classified as groundwater silicates. These silcretes
presumably formed at the palaeo-water table, post Cretaceous faulting. As the silica
rich groundwater table height varied and percolated throughout the unit silica was
precipitated and cemented around surrounding material, forming these silcretes. There
is no evidence to constrain this silcrete formation to one period in the landscape
evolution, but may have occurred during multiple fluctuations in the palaeo-water
table. This model for silcrete formation is not solely restricted for the Bulldog Shale.
The pyrite rich upper units of the Cadna-owie Formation and Algebuckina Sandstone

37
are assumed to have enabled the formation of localised silcrete, as observed on Trig
Bluff and Hill 1.
Iron concentrations are believed to have formed synchronously with these silcretes.
As the pyrite oxidised, sulphur was stripped from the pyrite leaving high
concentrations of iron accumulating in the soil and groundwater. Some of this iron
accumulation is predicted to have bonded to the free silica in the groundwater
contributing to the formation of jasper. Jasper is predominantly a chert distinguishable
by its red to yellow colour, caused by iron inclusions in its composition. The
abundance of jasper lag observed on the plains consisting of Bulldog Shale and
adjacent landforms is the basis for this interpretation.
Iron nodules were also identified within equivalent plains of the Bulldog Shale. The
presence of hydrated silica (opal) and iron oxide minerals (haematite and goethite
nodules) further indicates an independent source of iron and silica relative to the
parent jasper material. The presence of copious goethite in relation to haematite
further suggests a hydraulic influence on the iron rich mineral’s formation, with free
water readily available. Iron rich groundwater solution is also believed to have
contributed to ferricrete members observed in the topographically lower underlying
units, the Cadna-owie Formation and Algebuckina Sandstone. This interpretation is
based on the presence of iron rich veins percolating downwards within the Bulldog
Shale profile (Figure 17). Although the Bulldog Shale contains a low porosity factor,
the iron rich fluids are predicted to have propagated along fractures and faults within
the unit, precipitating at oxidised redox boundaries i.e. within the Cadna-owie
Formation and Algebuckina Sandstone. These units were then presumably subjected
to multiple stages of ferruginization as a consequence of their high porosity factor.
38
4.2 ASTER analysis
Processed ASTER imagery was useful in distinguishing seemingly homogenous
landform features with high reflectivity values, such as opal diggings, sand dunes,
drainage depressions and Lake Torrens. In particular, ASTER band ratio images
highlighting clay mineral groups (CSIRO regolith ratios, CAL, CCS) were assessed to
successfully highlight opal digging boundaries. This is believed to be caused by opal
diggings generally focused around the clay rich kopi layer. Consequently, surface
material has been removed from these areas, leaving a homogenous clay layer
exposed at the surface. Boundaries of opal diggings are also highlighted by
contrasting colours, caused by waste from overburden discarded proximal to the
diggings. The Al-OH image further classifies the clay minerals predicted for the opal
diggings associating blue pixel values i.e. indicating a high probably of kaolinite. As
field observations describe the abundance of kaolinite in the kopi layer, this band ratio
image is assessed successful for identifying opal diggings. This further shows the
accuracy of using ASTER band imaging (especially high reflectance values) for
particular landforms.
The CSIRO Regolith ratio image was particularly useful in representing the plains of
Bulldog Shale (CHep2) and Cadna-owie Formation rises (CHer2). These were
distinguished based on assimilated red, blue and purple pixels, caused by the presence
of clays and ferruginous minerals which dominate these units. This image allowed for
the recognition of Bulldog Shale exposure on the northern side of the main drainage
depression running northwest to southeast. As this site was not visited in the field, it
was originally grouped as Andamooka Limestone. This was revised based on the
CSIRO band image, displaying an anomalous pixel value which distinctly reflected
39
the southerly plains. This was further verified, with the previous geology map
identifying the unit as a Bulldog Shale hill (locally referred to as Bill’s Lookout). A
dextral displacement component was herby attributed to the fault exhuming the
Andamooka Limestone, whilst laterally displacing the Bulldog Shale.
The enhanced structural image possibly represents the predicted fault scarps for the
area. Thin green pixel groups were noted adjacent to drainage depressions, predicted
to show outlines of the faults. Accuracy assessment is inconclusive due to the
observed fault scarp within the Arcoona Quartzite being overshadowed by cloud
cover in the area.
The band ratio image highlighting areas of discrimination for mapping strongly
displays the longitudinal sand dunes (as yellow pixels) mapped in the north and west
of the study area. Consequently, predictions can be made from the data, assuming the
yellow pixels are a representation of the siliceous sand content. Resultantly, the plains
adjacent to these sand dunes clearly show a strong sand component to their soils. As
this was the distinguishing feature in classifying units CHep1 and CHep2, this image
consequently shows the approximate boundary between these two differing RLUs.
Although processed ASTER imagery cannot solely replace field observations to
conduct regolith-landform mapping, it has been shown to complement and highlight
areas of significance in regolith dominated landscapes. In particular, homogenous and
high reflective units were found to be reliably classified in several band combinations,
further supporting field observations and interpretations.
40
4.3 Hylogger interpretations
The Hylogger data shows further evidence for association between the siliceous and
ferruginous materials. Although siliceous minerals are not directly identified by the
Hylogger system, it is assumed the majority of aspectral predicted materials are
essentially siliceous. Due to the crystal lattice of the bonded silica to oxygen elements
there is little to no absorption between interacting electromagnetic waves. Hence, as
the spectral signatures do not have any diagnostic absorption readings (compared to
most clay minerals), the siliceous minerals are classified as aspectral. Using this
assumption it is evident there is a strong correlation between predicted goethite and
aspectral/siliceous minerals from the Hylogger analysis. This supports the earlier
assumption that silcretes were forming from siliceous groundwater, also highly
concentrated in iron. Additionally, goethite and aspectral readings were not mutually
restricted. Goethite and in some cases haematite were found to occur independently in
lag samples, which were previously described as iron nodules.
4.4 Mineral prospectivity
Although Andamooka is renowned for prosperous opal mining, this study has found
potential for further economic mineralisation in the area. The understanding of
neotectonic activity, which is believed to have contributed significantly to the
landscape evolution, potentially is the key to further mineralisation discoveries.
Multiple iron rich (haematite) occurrences observed adjacent to shear zones in the
area provide evidence of iron rich fluid mobility along shear zones. Coupled with
numerous REDOX boundaries observed within the Mesozoic sediments, the area not
only remains highly prospective for mineralisation mobility but also for trapping and

41
precipitating mobile fluids. The permeability difference between the porous
Algebuckina Sandstone and Cadna-owie Formation and the impermeable Bulldog
Shale further enhances the potential for secondary mineralisation in the Mesozoic
sediments. Additionally, the presence of Olympic Dam (only approximately 20 km
west) indicates a potential source of IOCG type mineralisation within the region
(Olympic IOCG Province). Consequently, a source, transport mechanism (along the
faults) and potential trap for mineralisation can all be found proximal to Andamooka.
A similar exploration model previously implemented near Arkaroola was successful
in identifying economic uranium mineralisation at Honeymoon and Four Mile (Hill
and Hore 2010). High uranium concentrations were found to be hosted within the
Eyre Formation and Bulldog Shale units, with secondary mineralisation at Four Mile
constrained to grabens along extensional faults, similar to that observed in this study.
4.5 Scope for further study
For this project, it was widely assumed that the boundaries of extensional faults in the
area have been overprinted by transported alluvial sediments. Consequently, few fault
scarps were actually observed in the project area. Further geophysical studies could
therefore be concentrated on proving the presence and distribution of the proposed
extensional faults. One such study could be further use of the new high-resolution
resistivity instrument developed by ZZ Resistivity Imaging Pty Ltd. This instrument
has previously been used in the Andamooka Precious Stone Field, with test sites near
White Dam investigating the use of this instrument to enhance opal exploration
(Morris and Zhe 2010). These early trials have already proven to be a successful tool
in delineating sub-surface fault structures, and correlating resistivity values with
differing lithologies (Morris and Zhe 2010). Additionally, X-ray fluorescence (XRF)

42
readings could be measured around the observed shear zone bordering the Arcoona
Quartzite and Bulldog Shale. Values obtained could then further analyse the potential
on these faults as transport mechanisms allowing for secondary mineralisation within
the proposed grabens.
Biogeochemical sampling along transects orientated west to east could also be used to
further highlight potential drill site targets. Comparisons between the different
geochemical assay results for the horsts and grabens, would particularly be useful in
assessing the potential for secondary mineralisation within the proposed grabens. This
method was found to be previously successful in identifying uranium mineralisation
within Bulldog Shale grabens at Four Mile (Hill and Hore 2010).
Comparisons between opal presences and distribution at Coober Pedy could further
support the opal exploration model proposed in this study. Coober Pedy is an opal
mining town located north of Andamooka with similar Mesozoic sediments (i.e.
Bulldog Shale) hosting opal mineralisation (Pewkliang et al. 2008). Evaluating the
distribution of opal (based on opal diggings) and the digital elevation model for the
region could further support the theory that opalisation is constricted to pyrite rich
units which have been uplifted and consequently oxidised.

43
5. Conclusion
This study has shown the importance of understanding the landscape evolution for an
area, in particular the acknowledgement of regolith and sedimentary cover material,
previously considered an obstacle when exploring potentially mineral enriched
basement geology. The cover material (Mesozoic sediments) in Andamooka is host to
rich opalisation herby predicted to have formed on exhumed fault blocks, caused by
extensional intracontinental faults. The opal distribution previously was
independently linked to fluctuating water tables, however oxidation of pyrite
combined with varying water table height provides an enhanced interpretation linking
opal distribution with jasper and silcrete lag material also present in the area.
ASTER band ratios and relative absorption-band depth ratios were found to assist in
the production of a regolith-landform map with ratios primarily useful in
distinguishing high reflectance homogenous mineral groups e.g. opal diggings, sand
dunes. Differences between heterogeneous and homogenous mineral groups were also
strongly distinguishable based on mean pixel colours. Additionally, landforms were
easily identifiable based on similar linear pixels representing structures such as
drainage depressions, longitudinal dunes and possibly faults.
The potential for further economic mineralisation (e.g. IOCG) is also proposed for
Andamooka. With a source material (Olympic IOCG Province), transport mechanism
(extensional duplex faulting), and potential trap rock (REDOX boundaries and
varying permeability of Mesozoic units) all contributing to a prospective exploration
model for the area.
44
6. Acknowledgements
A first thanks goes to my supervisor Robert Dart, for his wealth of knowledge, sense
of humour and endless patience, which was severely tested throughout the year. To
Steve Hill, thanks for your brief but very helpful time, and for the memorable field
trip to the Yorke Peninsula (I will never look at sauce the same again). Thanks must
also go to Georgina Gordon and Alan Mauger who helped significantly with the
Hylogger data preparation and analysis found in this study. Thank you to Ken Clarke,
for the encouragement I was heading in the right direction, when the fog started to
come. To Oliver Hughes, thank you for your patience and driving expertise,
particularly whilst I was incarcerated in a cast. I look forward to working with both
you and Robert Klaebe in our future business adventures with Megalith and Varietea.
Special thanks to Frank, for making me believe in myself as a geologist and potential
botanist. Most importantly of all, thank you to Blair Pellegrino for the endless editing
(sometimes brutal but necessary), meals, hugs and laughs. I really couldn’t have done
it without you and hope you know this thesis is as much yours as it is mine.
A geologist's life would be a happy one if he had only to drink, and never to write.

45
7. References
BELPERIO A., FLINT R. & FREEMAN H. 2007. Prominent Hill: A hematite-dominated,
iron oxide copper-gold system. Economic Geology 102, 1499.
BELPERIO A. P. & FLINT R. B. 1993. Geological note: The southeastern margin of the
Gawler Craton. Australian Journal of Earth Sciences 40, 423-426.
BHATTACHARYA J. P. 1993. The expression and interpretation of marine flooding
surfaces in core; examples from the Upper Cretaceous Durwegan Formation,
Alberta Foreland Basin, Canada. In: Posamentier H. W., Summerhayes C. P.,
Haq B. U. & Allen G. P. eds., Sequence Stratigraphy and Facies Associations,
Vol. 18, pp 125-160, International Association of Sedimentologists, Special
Publication.
CAMPBELL R. J. & HAIG D. W. 1999. Bathymetric change during Early Cretaceous
intracratonic marine transgression across the northeastern Eromanga Basin,
Australia. Cretaceous Research 20, 403-446.
CARR S. G., OLLIVER J. G., CONOR C. H. H. & SCOTT D. C. 1979. Andamooka Opal
Fields: The Geology of the Precious Stones Field and the Results of the
Subsidised Mining Program. Geological Survey of South Australia
Department of Mines and Energy.
CRAIG M. A., WILFORD J. R. & TAPLEY I. J. 1999. Regolith-landform mapping in the
Gawler Craton. Mesa Journal 12, 17-21.

46
CROWLEY J. K., BRICKEY D. W. & ROWAN L. C. 1989. Airborne imaging
spectrometer data of the Ruby Mountains, Montana: mineral discrimination
using relative absorption band-depth images. Remote Sensing of Environment
29, 121-134.
DAY R. W. 1974. Aptian ammonites from the Eromanga and Surat basins,
Queensland (Vol. 360). Dept. of Mines.
DONOVAN A. D. 1993. The use of sequence stratigraphy to gain new insights into
stratigraphic relationships in the Upper Cretaceous of the US Gulf Coast.
Sequence Stratigraphy and Facies Associations, 563-577.
EXON N. F. & SENIOR B. R. 1976. The Cretaceous of the Eromanga and Surat Basins.
BMR Journal of Australian Geology and Geophysics 1, 33-50.
HARRIS W. K. 1962. Plant remains of Upper Jurassic to Lower Cretaceous age from
Cadlareena military sheet. South Australia. South Australia. Department of
Mines. Report Book 55, 128.
HART B. S. & PLINT A. G. 1993. Origin of an erosion surface in shoreface sandstones
of the Kakwa Member (Upper Cretaceous Cardium Formation, Canada):
importance for reconstruction of stratal geometry and depositional history.
Sequence Stratigraphy and Facies Associations, 451–468.
HEWSON R., KOCH C., BUCHANAN A. & SANDERS A. 2002. Detailed geological and
regolith mapping in the Bangemall Basin, WA, using ASTER multi-spectral
satellite-borne data.
HILL S. M. & HORE S. B. 2010. Overview of Regolith and Landscape Evolution of the
Arkaroola Wilderness Sanctuary, northern Flinders Ranges, South Australia.

47
JABLONSKI D. 1987. Heritability at the species level: analysis of geographic ranges of
Cretaceous mollusks. Science 238, 360.
JACKSON J. A. 1997. Glossary of geology. American Geological Institute, Alexandria,
USA.
JOHNS R. K. 1968. Geology and mineral resources of the Andamooka-Torrens area.
Govt. Printer.
KALINOWSKI A. & OLIVER S. 2004. ASTER Mineral Index Processing Manual.
Remote Sensing Applications, Geoscience Australia 37.
LAMBERT I. B., KNUTSON J., DONNELLY T. H. & ETMINAN H. 1987. Stuart Shelf-
Adelaide Geosyncline copper province, South Australia. Economic Geology
82, 108-123.
LEITHOLD E. L. 1994. Stratigraphical architecture at the muddy margin of the
Cretaceous Western Interior Seaway, southern Utah. Sedimentology 41, 521-
542.
LUDBROOK N. H. 1966. Cretaceous biostratigraphy of the Great Artesian Basin in
South Australia. WL Hawes, Govt. Printer.
LUDBROOK N. H. 1967. Stuart Range No. 3 Bore—Coober Pedy. Stratigraphy and
micropalaeontology. Mining Review, Adelaide 122, 28-31.
MAH A. 2002. ASTER wizard of ER Mapper. Waclawik V. G., Perth, Western
Australia.
MAHONEY S., JAMES P., MAUGER A. & HEINSON G. 2002. Geologic and regolith
mapping for mineral exploration in the Gawler Craton of South Australia
using hyperion and other remote sensing techniques, pp. 1779-1781. IEEE.

48
MAUGER A. J., KEELING J. L. & HUNTINGTON J. F. 2004. Bringing remote sensing
down to earth: CSIRO HyLogger as applied in the Tarcoola Goldfield, South
Australia.
MORRIS B. J. & ZHE J. 2010. High resolution resistivity test survey: Andamooka.
PIRSA Geological Survey Branch.
NINOMIYA Y. & FU B. 2001. Spectral indices for lithologic mapping with ASTER
thermal infrared data applying to a part of Beishan Mountains, Gansu, China,
pp. 2988-2990 vol. 2987. IEEE.
NUMMEDAL D. & MOLENAAR C. M. 1995. Sequence stratigraphy of ramp-setting
strand plain successions: the Gallup Sandstone, New Mexico. MEMOIRS-
AMERICAN ASSOCIATION OF PETROLEUM GEOLOGISTS, 277-310.
PAIN C. F. 2008. Field Guide for Describing Regolith and Landforms CRC LEME.
CSIRO Exploration and Mining, PO Box 1130, 94.
PEWKLIANG B., PRING A. & BRUGGER J. 2008. The formation of precious opal: clues
from the opalization of bone. The Canadian Mineralogist 46, 139-149.
POWELL C. M. A., ROOTS S. R. & VEEVERS J. J. 1988. Pre-breakup continental
extension in East Gondwanaland and the early opening of the eastern Indian
Ocean. Tectonophysics 155, 261-283.
RABUS B., EINEDER M., ROTH A. & BAMLER R. 2003. The shuttle radar topography
mission--a new class of digital elevation models acquired by spaceborne radar.
ISPRS Journal of Photogrammetry and Remote Sensing 57, 241-262.

49
REYNOLDS S. D., COBLENTZ D. D. & HILLIS R. R. 2003. Influences of plate-boundary
forces on the regional intraplate stress field of continental Australia. SPECIAL
PAPERS-GEOLOGICAL SOCIETY OF AMERICA, 59-70.
ROGERS P. A. & FREEMAN P. J. 1993. Explanatory notes for the Warrina 1:250 000
geological map. Department of Mines and Energy/Geological Survey South
Australia, Adelaide.
ROWAN L. C. & MARS J. C. 2001. Initial lithologic mapping results using advanced
spaceborne thermal emission and reflection radiometer (ASTER) data.
ROWAN L. C. & MARS J. C. 2003. Lithologic mapping in the Mountain Pass,
California area using advanced spaceborne thermal emission and reflection
radiometer (ASTER) data. Remote Sensing of Environment 84, 350-366.
SANDIFORD M. 2003. Neotectonics of southeastern Australia: linking the Quaternary
faulting record with seismicity and in situ stress. SPECIAL PAPERS-
GEOLOGICAL SOCIETY OF AMERICA, 107-120.
SENIOR B. R., MOND A. & HARRISON P. L. 1978. Geology of the Eromanga Basin.
Australian Govt. Pub. Service.
SKIRROW R. G. & DAVIDSON G. J. 2007. A Special Issue Devoted to Proterozoic Iron
Oxide Cu-Au-(U) and Gold Mineral Systems of the Gawler Craton: Preface.
Economic Geology 102, 1373-1375.
SPRIGG R. C. & LTD S. O. T. G. A. 1958. The Great Artesian Basin in South Australia.
The Geology of South Australia. Geological Society of Australia 5, 88-101.
TAYLOR G. & EGGLETON R. A. 2001. Regolith geology and geomorphology. Wiley.
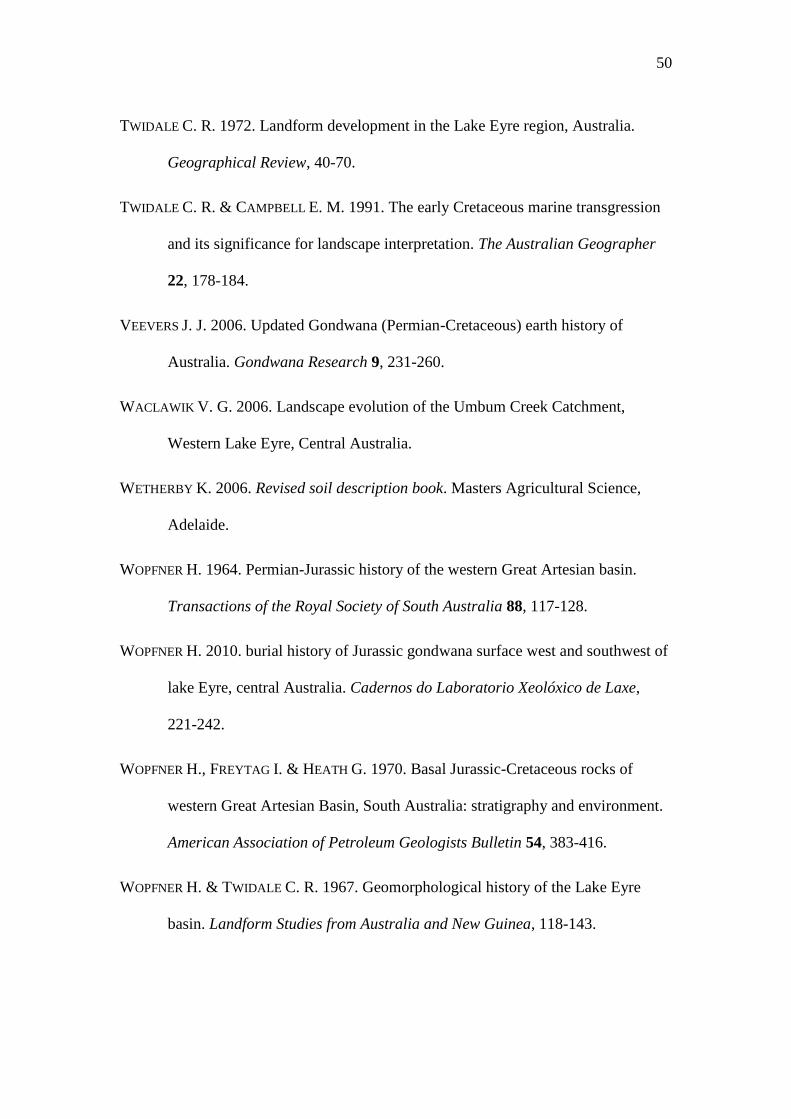
50
TWIDALE C. R. 1972. Landform development in the Lake Eyre region, Australia.
Geographical Review, 40-70.
TWIDALE C. R. & CAMPBELL E. M. 1991. The early Cretaceous marine transgression
and its significance for landscape interpretation. The Australian Geographer
22, 178-184.
VEEVERS J. J. 2006. Updated Gondwana (Permian-Cretaceous) earth history of
Australia. Gondwana Research 9, 231-260.
WACLAWIK V. G. 2006. Landscape evolution of the Umbum Creek Catchment,
Western Lake Eyre, Central Australia.
WETHERBY K. 2006. Revised soil description book. Masters Agricultural Science,
Adelaide.
WOPFNER H. 1964. Permian-Jurassic history of the western Great Artesian basin.
Transactions of the Royal Society of South Australia 88, 117-128.
WOPFNER H. 2010. burial history of Jurassic gondwana surface west and southwest of
lake Eyre, central Australia. Cadernos do Laboratorio Xeolóxico de Laxe,
221-242.
WOPFNER H., FREYTAG I. & HEATH G. 1970. Basal Jurassic-Cretaceous rocks of
western Great Artesian Basin, South Australia: stratigraphy and environment.
American Association of Petroleum Geologists Bulletin 54, 383-416.
WOPFNER H. & TWIDALE C. R. 1967. Geomorphological history of the Lake Eyre
basin. Landform Studies from Australia and New Guinea, 118-143.

51
8. Figure captions
Figure 1: Locality map of Andamooka in regards to Australia, South Australia, and
the discovered IOCG deposits
Figure 2: Interpreted geological map of Andamooka edited from Geological Survey
of South Australia grid map SH 53-12 (05 Oct 1999)
Figure 3: Section through the Algebuckina Sandstone (Wopfner et al. 1970)
Figure 4: Section through the Cadna-owie Formation (Wopfner et al. 1970)
Figure 5: Cross section through Bulldog Shale showing common location of
opalisation (Carr et al. 1979)
Figure 6: Electromagnetic reflectance values recorded by the ASTER sensor onboard
the Terra Satellite (Kalinowski and Oliver 2004)
Figure 7: Explanation of the regolith-landform codes, using channel sediments
deposited on a river flood plain as an example (Craig et al. 1999)
Figure 8: Location of soil and lag grab samples taken in Andamooka during first field
trip (11 April 2011 to 13 April 2011)
Figure 9: Guidelines to classifying soil textures by Wetherby (2006)
Figure 10: Example of spectral signatures for kaolinite, illite-smectite, gypsum, and
alunite recorded over the Tarcoola area (Mahoney et al. 2002)
Figure 11: Andamooka regolith-landform map for study area (for a detailed
description of the individual RLUs, view Table 2)

52
Figure 12: In-situ exposures of horizontally bedded massive crystalline quartzite i.e.
Arcoona Quartzite (observed at 715769 E and 6627544 N)
Figure 13: Exposed Arcoona Quartzite observed at steeply dipping angle
approximately 500m west of previous photo. Angular beds strongly orientated in
northeast to southwest orientation. Also noted with a reduction in quartz grain sizes
(observed at 715116 E and 6627897 N)
Figure 14: Handheld close up of gypsum (a) and kaolinite (c) rich soil immediately
adjacent to angular bedded quartzite. Photo of these soils in situ (b & d) (715144 E
6627896 N)
Figure 15: Regolith-landform map for Andamooka showing predicted extensional
faults orientation NE-SW along present drainage depressions
Figure 16: Cross section from A to B showing predicted lithologies and structures
Figure 17: Iron rich veins within the Bulldog Shale percolating down unit
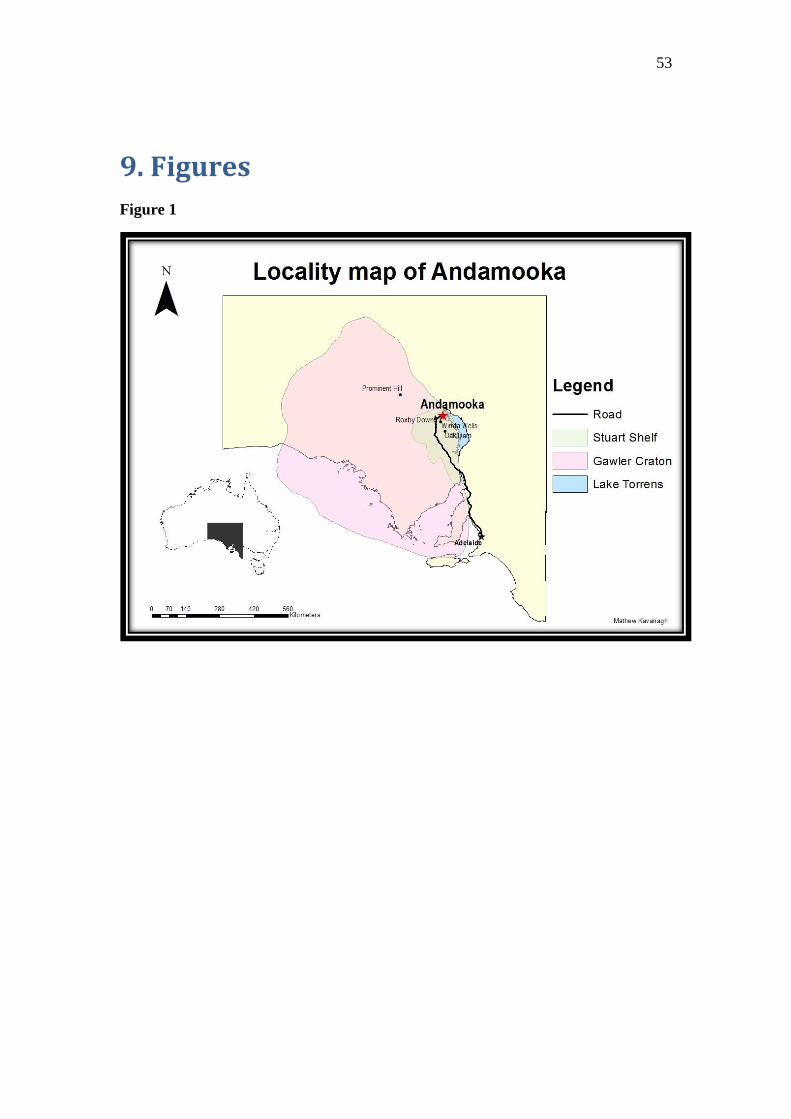
53
9. Figures
Figure 1

54
Figure 2
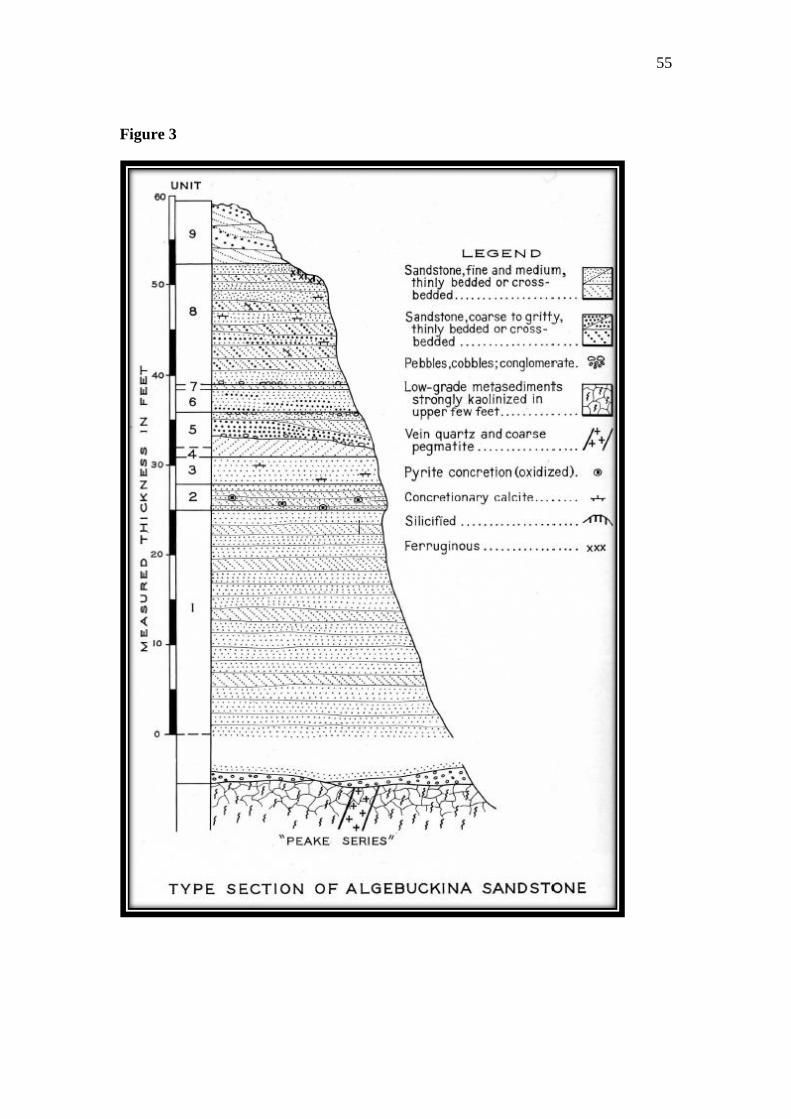
55
Figure 3

56
Figure 4

57
Figure 5

58
Figure 6
Figure 7

59
Figure 8

60
Figure 9
61
Figure 10

62
Figure 11 (see Table 2 for description of RLUs)

63
Figure 12
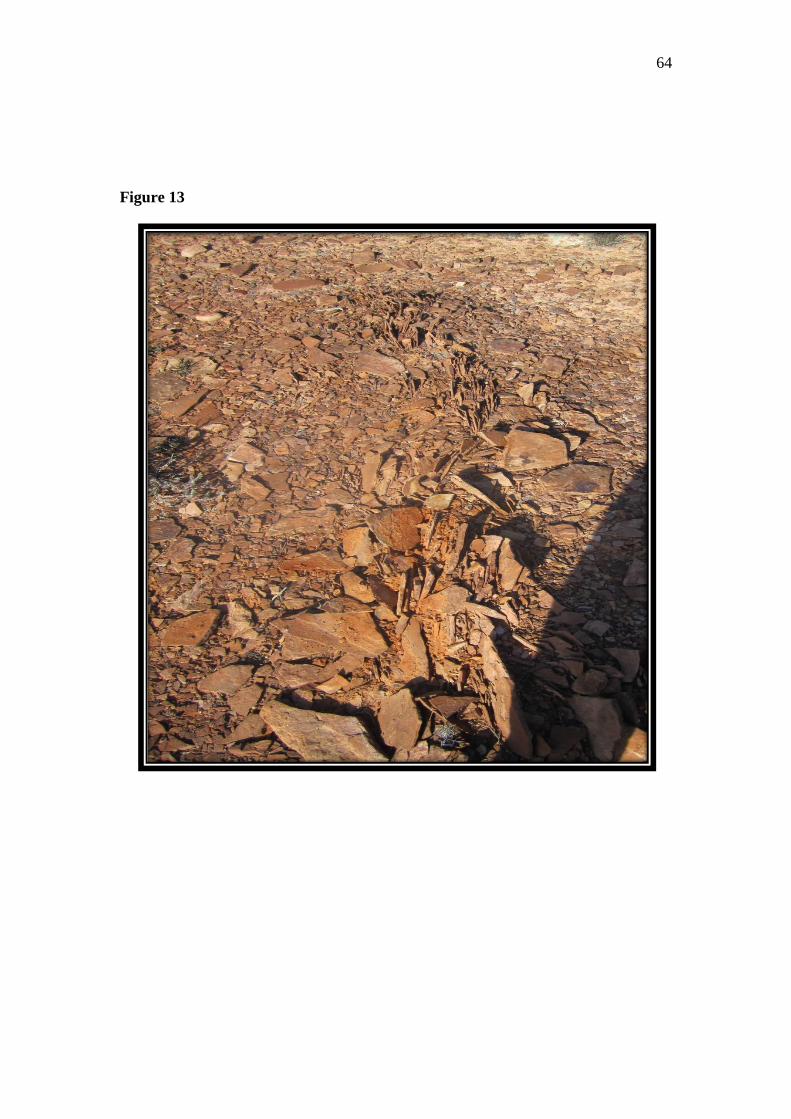
64
Figure 13

65
Figure 14

66
Figure 15

67
Figure 16

68
Figure 17

69
10. Tables
Table 1 Common ratio and band combinations
Features Red Green Blue Reference
True colour 3 2 1
Iron oxides, ferrous iron,
clays
3/2 3/7 4/7 CSIRO Regolith
Ratios
Clays, amphibole, laterite (5x7)/62 6/8 4/5 Bierwith
Silica, carbonate, basic
degree index
(11x11)/10/12 13/14 12/13 Bierwith
Enhanced structural
features
7 4 2 Rowan (USGS)
Carbonate, clays,
siliceous rocks
13/14 (5x7)/62 (11x11)/(10x12)
Bierwith,
Nimoyima,
CSIRO
Al-OH
minerals/advanced
argillic alteration,
alunite/pyrophyllite,
mica, kaolinite/dickite
5/6 (phen) 7/6 (musc) 7/5 (kaol) Hewson CSIRO
Discrimination for
mapping
4/1 3/1 12/14 Abdelsalam

70
Table 2 Detailed RLU legend
Landform Classification
ACah1 Alluvial channel depositing fine grained sediments in a low energy river system when filled with water. Abundance of vegetation with high
canopy cover.
Aed1 Alluvial drainage depressions with general flow direction from north west to south east. Abundance of reworked rounded sediments from the
upper plains, including quartzite pebbles, pink shales and conglomerates. Note the abundance of kaolinite and lack of sand within the poorly
structured soils along drainage beds. Easily identifiable by the abundance of vegetation in a linear orientation. Vegetation includes high density
Bullock Bush (Alectryon aleifolius), Western Myall (Acacia papyrocarpa), bluebush (Maireana spp.), grasses, Malva sp., and saltbush (Atriplex
and Rhagodia spp.).
CHep1 Sheet flow erosional plain adjacent to sand dunes. As plains are on the crest of the sand dunes, abundance of sand is noted in the soil matrix
with a kaolinite clay and hematite component noted within the ribboning and Hylogger data. Lag includes varying grain shape and sizes of
silcrete (jasper), quartzite, small hematite angular nodules, rounded quartz fragments, silicified conglomerates with small rounded quartz clasts
and potch opal closer to opal diggings. Vegetation includes acacias and bluebushes.
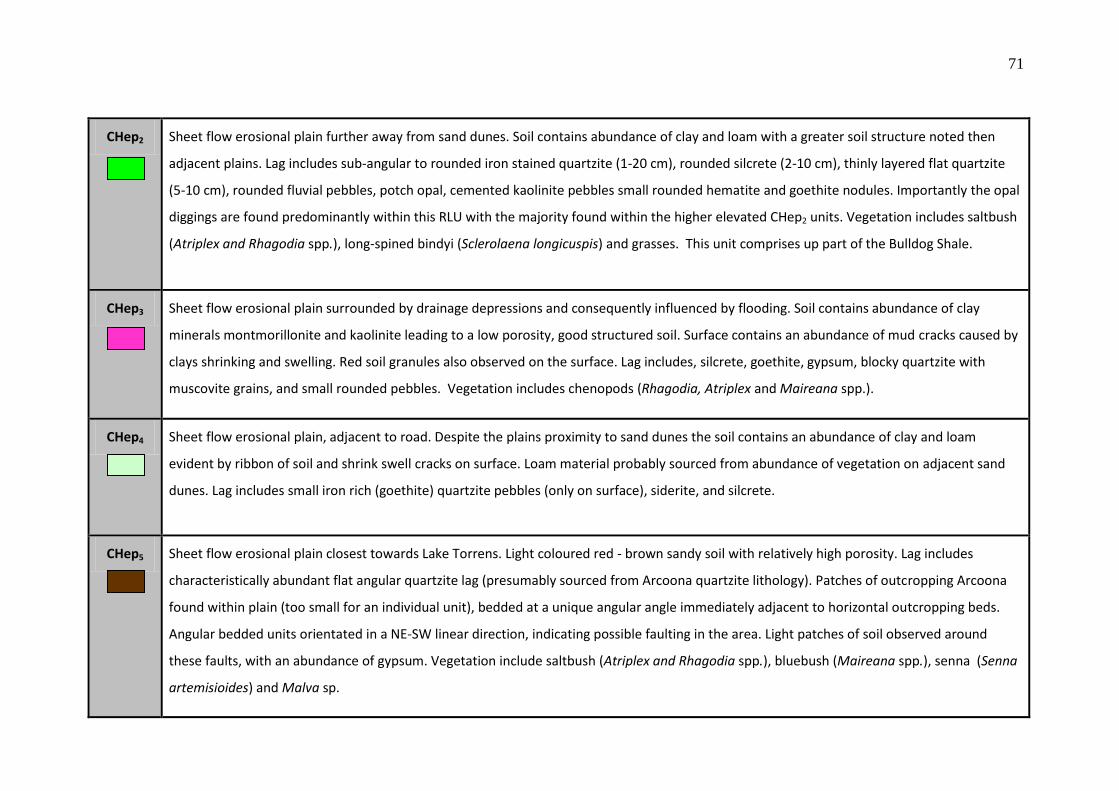
71
CHep2 Sheet flow erosional plain further away from sand dunes. Soil contains abundance of clay and loam with a greater soil structure noted then
adjacent plains. Lag includes sub-angular to rounded iron stained quartzite (1-20 cm), rounded silcrete (2-10 cm), thinly layered flat quartzite
(5-10 cm), rounded fluvial pebbles, potch opal, cemented kaolinite pebbles small rounded hematite and goethite nodules. Importantly the opal
diggings are found predominantly within this RLU with the majority found within the higher elevated CHep2 units. Vegetation includes saltbush
(Atriplex and Rhagodia spp.), long-spined bindyi (Sclerolaena longicuspis) and grasses. This unit comprises up part of the Bulldog Shale.
CHep3 Sheet flow erosional plain surrounded by drainage depressions and consequently influenced by flooding. Soil contains abundance of clay
minerals montmorillonite and kaolinite leading to a low porosity, good structured soil. Surface contains an abundance of mud cracks caused by
clays shrinking and swelling. Red soil granules also observed on the surface. Lag includes, silcrete, goethite, gypsum, blocky quartzite with
muscovite grains, and small rounded pebbles. Vegetation includes chenopods (Rhagodia, Atriplex and Maireana spp.).
CHep4 Sheet flow erosional plain, adjacent to road. Despite the plains proximity to sand dunes the soil contains an abundance of clay and loam
evident by ribbon of soil and shrink swell cracks on surface. Loam material probably sourced from abundance of vegetation on adjacent sand
dunes. Lag includes small iron rich (goethite) quartzite pebbles (only on surface), siderite, and silcrete.
CHep5 Sheet flow erosional plain closest towards Lake Torrens. Light coloured red - brown sandy soil with relatively high porosity. Lag includes
characteristically abundant flat angular quartzite lag (presumably sourced from Arcoona quartzite lithology). Patches of outcropping Arcoona
found within plain (too small for an individual unit), bedded at a unique angular angle immediately adjacent to horizontal outcropping beds.
Angular bedded units orientated in a NE-SW linear direction, indicating possible faulting in the area. Light patches of soil observed around
these faults, with an abundance of gypsum. Vegetation include saltbush (Atriplex and Rhagodia spp.), bluebush (Maireana spp.), senna (Senna
artemisioides) and Malva sp.
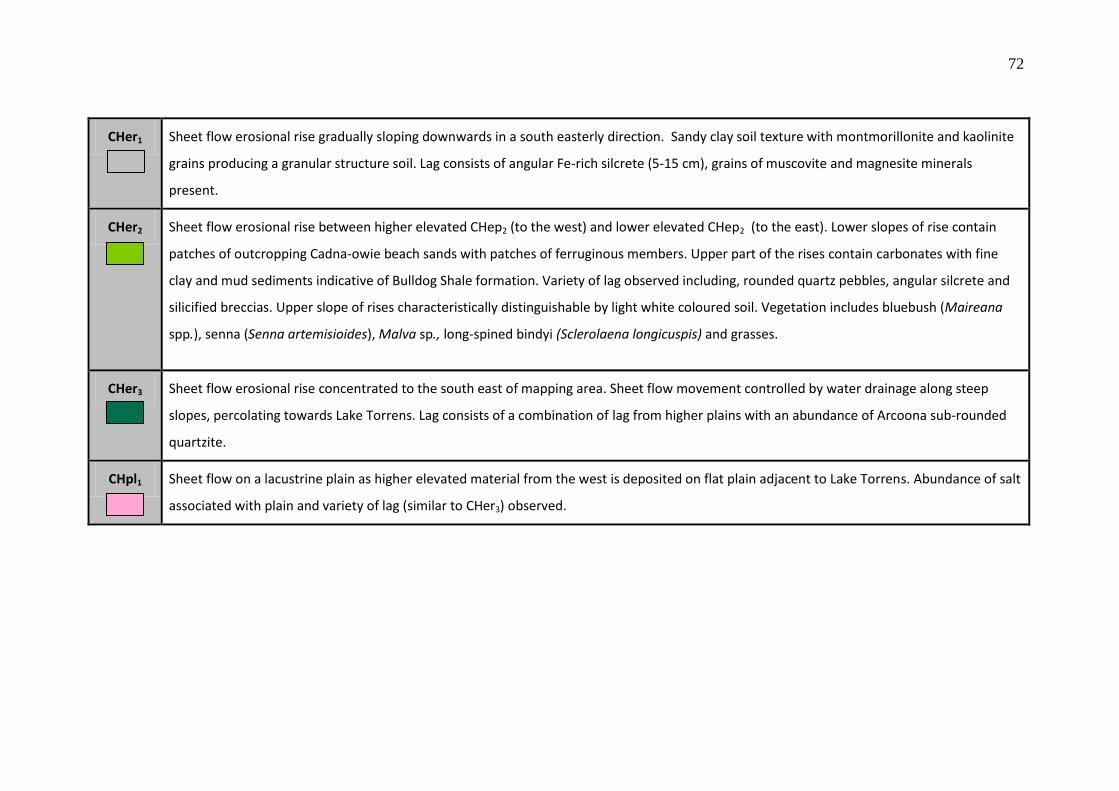
72
CHer1 Sheet flow erosional rise gradually sloping downwards in a south easterly direction. Sandy clay soil texture with montmorillonite and kaolinite
grains producing a granular structure soil. Lag consists of angular Fe-rich silcrete (5-15 cm), grains of muscovite and magnesite minerals
present.
CHer2 Sheet flow erosional rise between higher elevated CHep2 (to the west) and lower elevated CHep2 (to the east). Lower slopes of rise contain
patches of outcropping Cadna-owie beach sands with patches of ferruginous members. Upper part of the rises contain carbonates with fine
clay and mud sediments indicative of Bulldog Shale formation. Variety of lag observed including, rounded quartz pebbles, angular silcrete and
silicified breccias. Upper slope of rises characteristically distinguishable by light white coloured soil. Vegetation includes bluebush (Maireana
spp.), senna (Senna artemisioides), Malva sp., long-spined bindyi (Sclerolaena longicuspis) and grasses.
CHer3 Sheet flow erosional rise concentrated to the south east of mapping area. Sheet flow movement controlled by water drainage along steep
slopes, percolating towards Lake Torrens. Lag consists of a combination of lag from higher plains with an abundance of Arcoona sub-rounded
quartzite.
CHpl1 Sheet flow on a lacustrine plain as higher elevated material from the west is deposited on flat plain adjacent to Lake Torrens. Abundance of salt
associated with plain and variety of lag (similar to CHer3) observed.
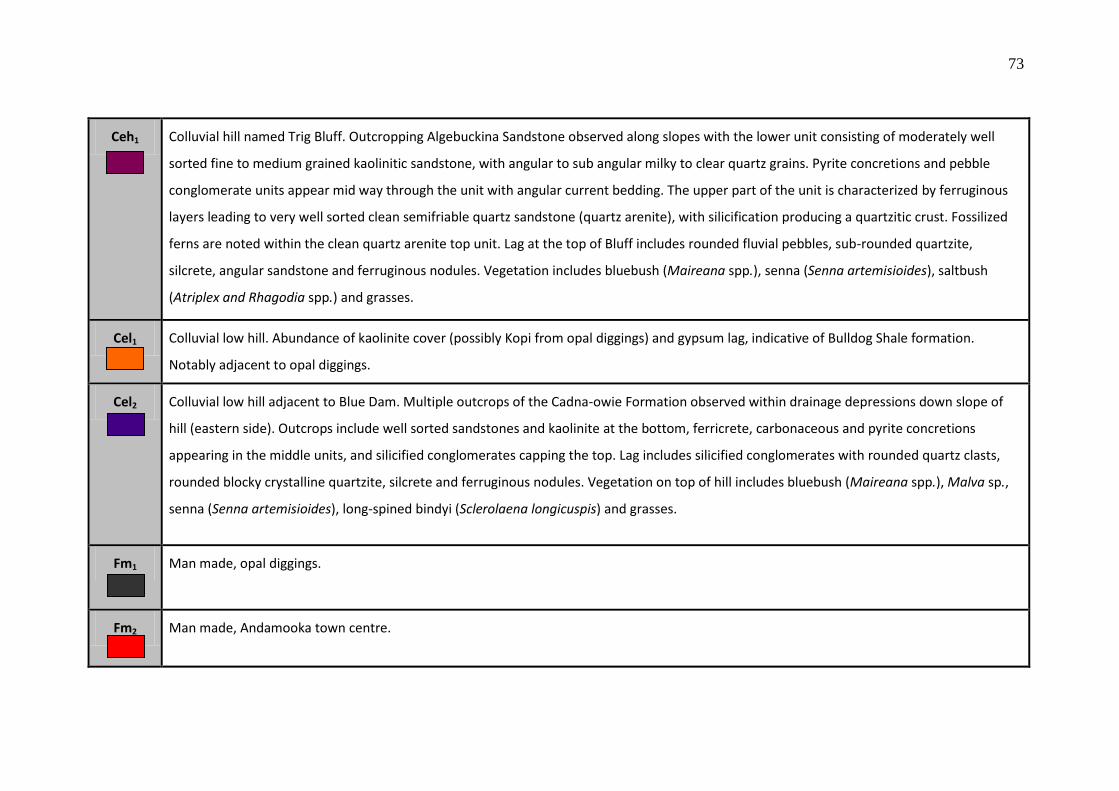
73
Ceh1 Colluvial hill named Trig Bluff. Outcropping Algebuckina Sandstone observed along slopes with the lower unit consisting of moderately well
sorted fine to medium grained kaolinitic sandstone, with angular to sub angular milky to clear quartz grains. Pyrite concretions and pebble
conglomerate units appear mid way through the unit with angular current bedding. The upper part of the unit is characterized by ferruginous
layers leading to very well sorted clean semifriable quartz sandstone (quartz arenite), with silicification producing a quartzitic crust. Fossilized
ferns are noted within the clean quartz arenite top unit. Lag at the top of Bluff includes rounded fluvial pebbles, sub-rounded quartzite,
silcrete, angular sandstone and ferruginous nodules. Vegetation includes bluebush (Maireana spp.), senna (Senna artemisioides), saltbush
(Atriplex and Rhagodia spp.) and grasses.
Cel1 Colluvial low hill. Abundance of kaolinite cover (possibly Kopi from opal diggings) and gypsum lag, indicative of Bulldog Shale formation.
Notably adjacent to opal diggings.
Cel2 Colluvial low hill adjacent to Blue Dam. Multiple outcrops of the Cadna-owie Formation observed within drainage depressions down slope of
hill (eastern side). Outcrops include well sorted sandstones and kaolinite at the bottom, ferricrete, carbonaceous and pyrite concretions
appearing in the middle units, and silicified conglomerates capping the top. Lag includes silicified conglomerates with rounded quartz clasts,
rounded blocky crystalline quartzite, silcrete and ferruginous nodules. Vegetation on top of hill includes bluebush (Maireana spp.), Malva sp.,
senna (Senna artemisioides), long-spined bindyi (Sclerolaena longicuspis) and grasses.
Fm1 Man made, opal diggings.
Fm2 Man made, Andamooka town centre.

74
ISul1 Longitudinal sand dunes located in the west of mapping area adjacent to CHep1. Unit consists of aeolian deposited quartz sands with an
abundance of iron present within the unit. RLU distinguishable by abundance of diverse vegetation which includes bluebushes, Cyprus pines
and Acacias.
ISul2 Longitudinal sand dunes located in north of mapping area with a carbonate influence (observed by patches of white calcrete within the soil)
due to presence of underlying limestone.
Laf1 Lacustrine flood plain with overlying lag from the higher plains to the west.
Lpl1 Dry endorheic rift saline basin termed Lake Torrens, depositing lacustrine fine salts and sediments.
SMep1 Moderately weathered outcropping Andamooka Limestone, distinguishable by 'elephant skin' appearance and abundance of lichen
overgrowth.

11. Appendices
Appendix 1
Surface soil and lag samples
Sample Soil Lag Location Landform Texture Colour pH Lag Vegetation Extra Notes
RSP1-001
Y Y 0712171 E 6629524 N
Cel2 CL 2.5 Yr 4/8
5.5 Poorly sorted, ranging from well sorted alluvial pebbbles (10-15 cm) to older sub-angular silcrete and angular quartzite cobbly in size (6-20 cm).
Grasses, saltbush, bluebush, long-spined bindyi
Iron rich red-brown soil. Sample taken on top of Hill 1, adjacent to Blue Dam
RSP1-002
Y Y 0712278 E 6629535 N
Cel2 CS 2.5 Yr 4/8
5.5 Silicified conglomerates with rounded quartz clasts, rounded blocky crystalline quartzite, silcrete and ferruginous nodules.
Grasses, saltbush, bluebush
Bottom of Hill 1
RSP2-001
Y Y 0712293 E 6629225 N
Cel2 LS 5 Yr 4/6 6.5 Silicified conglomerates with rounded quartz clasts, rounded blocky crystalline quartzite, silcrete and ferruginous nodules.
Shrubs, grasses, Malva sp.
Bottom of Hill 1 adjacent to ferruginous outcrop
RSP2-002
Y Y 0712280 E 6629224 N
Cel2 LS 5 Yr 4/6 6 Silicified conglomerates with rounded quartz clasts, rounded blocky crystalline quartzite, silcrete and ferruginous nodules.
Shrubs, grasses

Sample Soil Lag Location Landform Texture Colour pH Lag Vegetation Extra Notes
RSP2-003
Y Y 0712132 E 6629294 N
Cel2 SL 7.5 Yr 4/4
5.5 Silicified conglomerates with rounded quartz clasts, rounded blocky crystalline quartzite, silcrete and ferruginous nodules.
Small shrubs, grasses, saltbush, bluebush
Fine brown soil taken on top of Hill 1 further south
RSP3-001
Y Y 0711132 E 6630866 N
CHep2 CL 5 Yr 5/4 6.5 Sub-angular to rounded iron stained quartzite (1-20 cm), rounded silcrete (2-10 cm), thinly layered flat quartzite (5-10 cm), rounded fluvial pebbles, potch opal, cemented kaolinite pebbles small rounded hematite and goethite nodules.
Bladder / old man saltbush, copper-burrs
Fine brown soil occurrence of mud cracks, large plain area
RSP4-001
Y Y 0710709 E 6636522 N
ISul2 S 5 Yr 5/4 8.5 Little limestone lag. Acacia (Mulga), grasses, saltbush, bluebush
Sand dunes adjacent to outcropping Andamooka Limestone and Saltpan
RSP5-001
Y Y 0708926 E 6635140 N
CHep2 LSCL 5 Yr 5/4 6.5 Sub-angular to rounded iron stained quartzite (1-20 cm), rounded silcrete (2-10 cm), thinly layered flat quartzite (5-10 cm), rounded fluvial pebbles, potch opal, cemented kaolinite pebbles small rounded hematite and goethite nodules.
Chenopods
RSP6-001
Y Y 0703603 E 6626983 N
CHep4 SCL 5 Yr 5/4 9 Small iron rich (goethite) quartzite pebbles (only on surface), siderite, and silcrete.

Sample Soil Lag Location Landform Texture Colour pH Lag Vegetation Extra Notes
RSP7-001
Y N 0704468 E 6626991 N
ISul1 S 2.5 Yr 4/6
6 No lag. Lots of vegetation variety, including Acacia
RSP8-001
Y Y 0693594 E 6626791 N
CHep SCL 5 Yr 4/6 9-9.5
Flat angular crystalline quartzite (5-10 cm) with thin (2 mm) bedding preserved.
Grasses, bluebush
RSP9-001
Y N 0681178 E 6600519 N
ISul S 10 R 4/8
7.5 No lag.
RSP10-001
Y N 0702946 E 6637772 N
ISul1 S 10 R 4/8
6 No lag. Acacia Crest of ISul1 unit on edge of plains (CHep1)
RSP10-002
Y Y 0703041 E 6637684 N
CHep1 CS 2.5 Yr 4/6
7.5 Varying grain shape and sizes of silcrete (jasper), quartzite, small hematite angular nodules, rounded quartz fragments, silicified conglomerates with small rounded quartz clasts.
Bluebush Boundary of CHep1, adjacent to ISul units
RSP11-001
Y Y 0705405 E 6636283 N
CHer1 SC 5 Yr 4/6 7 Angular Fe-rich silcrete (5-15 cm), grains of muscovite and magnesite minerals present.
Gradual rise from lower elevated CHep2 to higher elevated CHep2
RSP12-001
Y Y 0707323 E 6632268 N
CHep2 CL 5 Yr 4/6 9 Sub-angular to rounded iron stained quartzite (1-20 cm), rounded silcrete (2-10 cm), thinly layered flat quartzite (5-10 cm), rounded fluvial pebbles, potch opal, cemented kaolinite pebbles small rounded hematite and goethite nodules.
Healthy flowering Acacia
Mud cracks observed on surface due to shrink swell of clay content
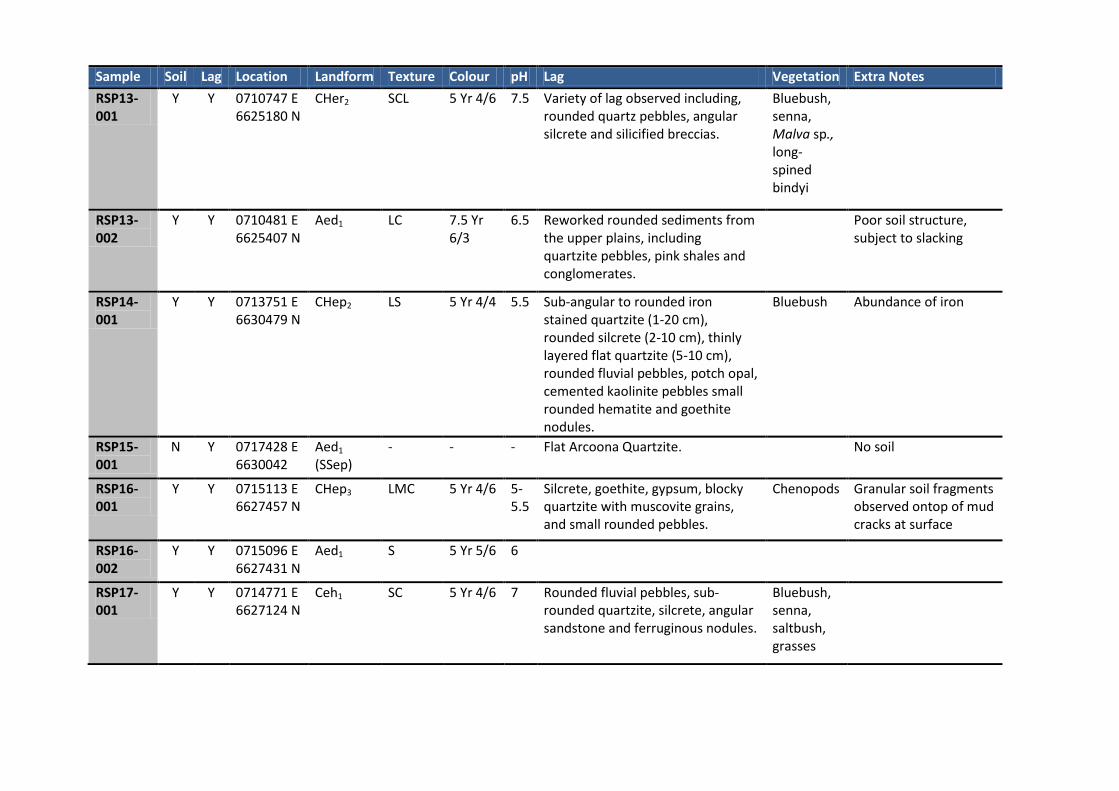
Sample Soil Lag Location Landform Texture Colour pH Lag Vegetation Extra Notes
RSP13-001
Y Y 0710747 E 6625180 N
CHer2 SCL 5 Yr 4/6 7.5 Variety of lag observed including, rounded quartz pebbles, angular silcrete and silicified breccias.
Bluebush, senna, Malva sp., long-spined bindyi
RSP13-002
Y Y 0710481 E 6625407 N
Aed1 LC 7.5 Yr 6/3
6.5 Reworked rounded sediments from the upper plains, including quartzite pebbles, pink shales and conglomerates.
Poor soil structure, subject to slacking
RSP14-001
Y Y 0713751 E 6630479 N
CHep2 LS 5 Yr 4/4 5.5 Sub-angular to rounded iron stained quartzite (1-20 cm), rounded silcrete (2-10 cm), thinly layered flat quartzite (5-10 cm), rounded fluvial pebbles, potch opal, cemented kaolinite pebbles small rounded hematite and goethite nodules.
Bluebush Abundance of iron
RSP15-001
N Y 0717428 E 6630042
Aed1 (SSep)
- - - Flat Arcoona Quartzite. No soil
RSP16-001
Y Y 0715113 E 6627457 N
CHep3 LMC 5 Yr 4/6 5-5.5
Silcrete, goethite, gypsum, blocky quartzite with muscovite grains, and small rounded pebbles.
Chenopods Granular soil fragments observed ontop of mud cracks at surface
RSP16-002
Y Y 0715096 E 6627431 N
Aed1 S 5 Yr 5/6 6
RSP17-001
Y Y 0714771 E 6627124 N
Ceh1 SC 5 Yr 4/6 7 Rounded fluvial pebbles, sub-rounded quartzite, silcrete, angular sandstone and ferruginous nodules.
Bluebush, senna, saltbush, grasses

Sample Soil Lag Location Landform Texture Colour pH Lag Vegetation Extra Notes
RSP18-001
Y Y 0707475 E 6626278 N
CHep1 SCL 5 Yr 5/6 8.5 Varying grain shape and sizes of silcrete (jasper), quartzite, small hematite angular nodules, rounded quartz fragments, silicified conglomerates with small rounded quartz clasts and potch opal closer to opal diggings.
Bluebush
RSP19-001
Y Y 0709838 E 6623119 N
CHep1 SC 5 Yr 5/8 7 Varying grain shape and sizes of silcrete (jasper), quartzite, small hematite angular nodules, rounded quartz fragments, silicified conglomerates with small rounded quartz clasts and potch opal closer to opal diggings.
Pearl bluebush

Appendix 2
Digital elevation model (using SRTM values) of Andamooka mapping area showing interpreted position of current opal digging boundaries (red
outline)

Appendix 3
ASTER band ratio images
True colour image for the Andamooka Mapping area. Important to note the presence of dense cloud cover to the west (a) and light cloud cover to
the east (b) and their cloud shadows. These clouds and shadows will ultimately affect the processed ASTER images and hence should be
ignored.
A B

Red: Iron Oxides (B3/B2), Green: Ferrous iron i.e. non-mafic rocks (B3/B7), Blue: Clays (B4/B7)

Red: Clay ((B5xB7)/B6
2), Green: Amphibole (B6/B8), Laterite (B4/B5)

Red: Silica ((B11xB11)/B10/B12), Green: Carbonate (B13/B14), Blue: Basic (B12/B13)

Red: B7, Green: B4, Blue: B2
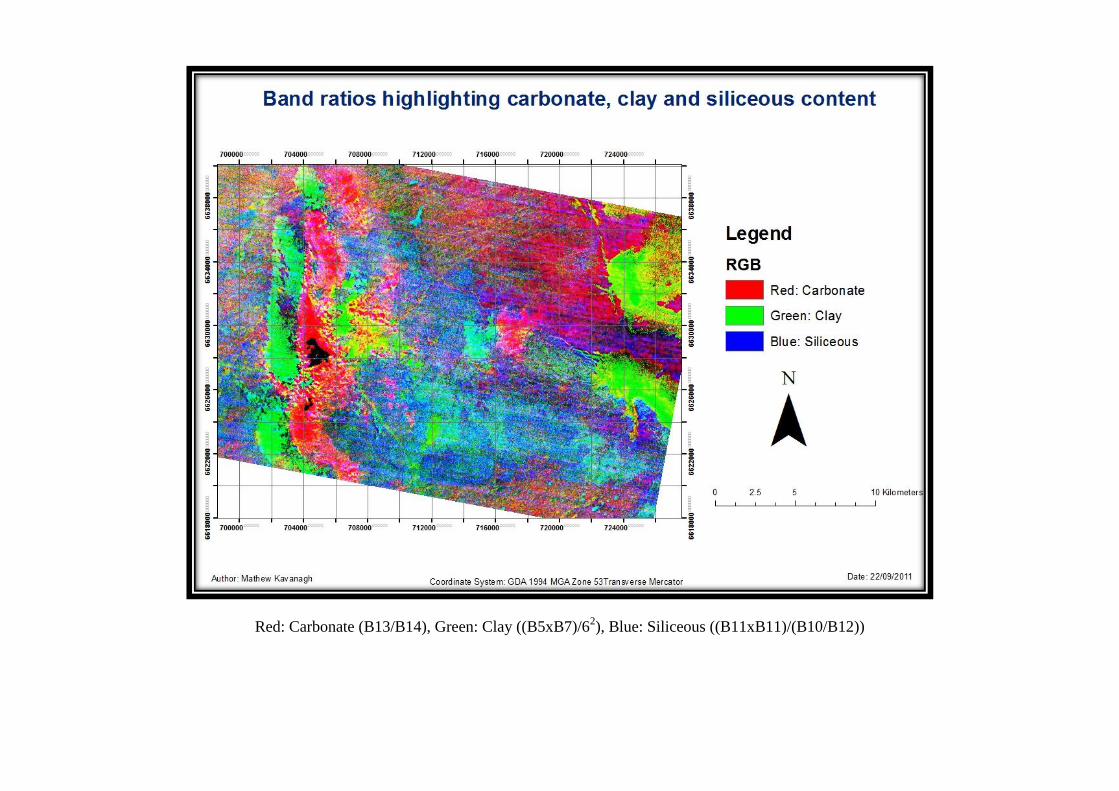
Red: Carbonate (B13/B14), Green: Clay ((B5xB7)/62), Blue: Siliceous ((B11xB11)/(B10/B12))

Red: Phengite (B5/B6), Green: Muscovite (B7/B6), Blue: Kaolinite (B7/B5)
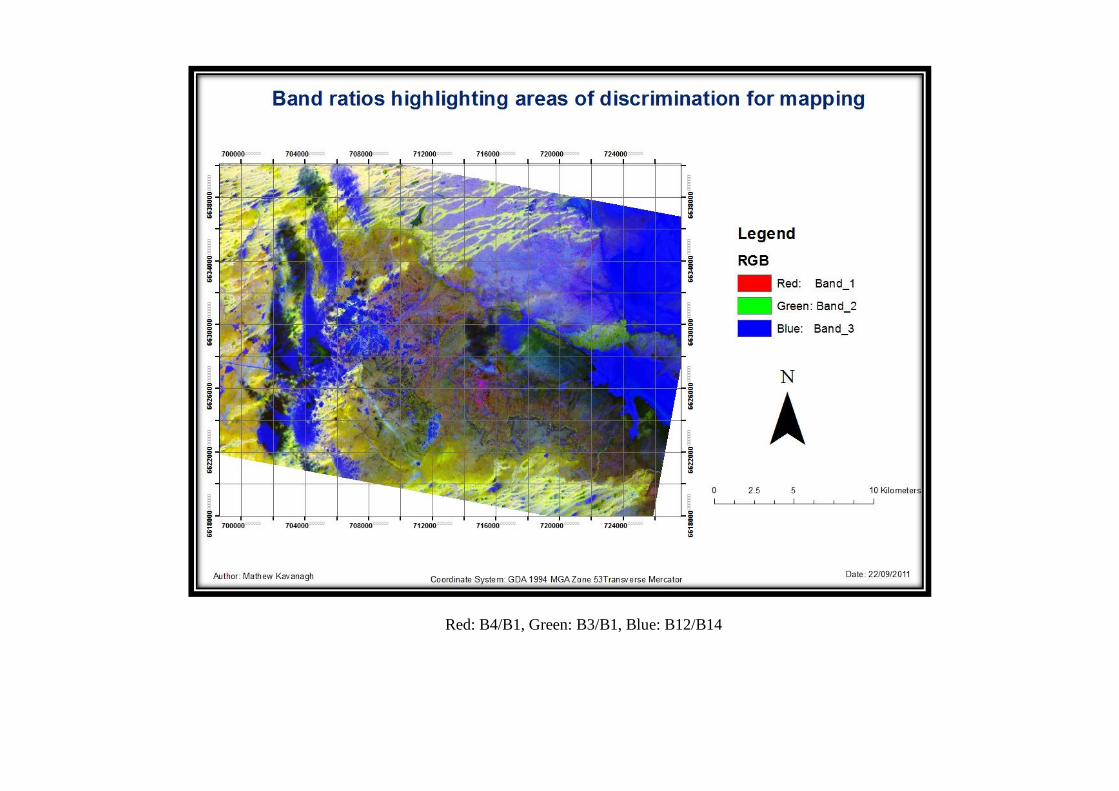
Red: B4/B1, Green: B3/B1, Blue: B12/B14

Appendix 4
Supervised classification (minimum distance to mean)
Supervised Classification performed in ERDAS Imagine, using field observations and sample locations as training sites to distinguish average
spectral signatures for the defined classes.
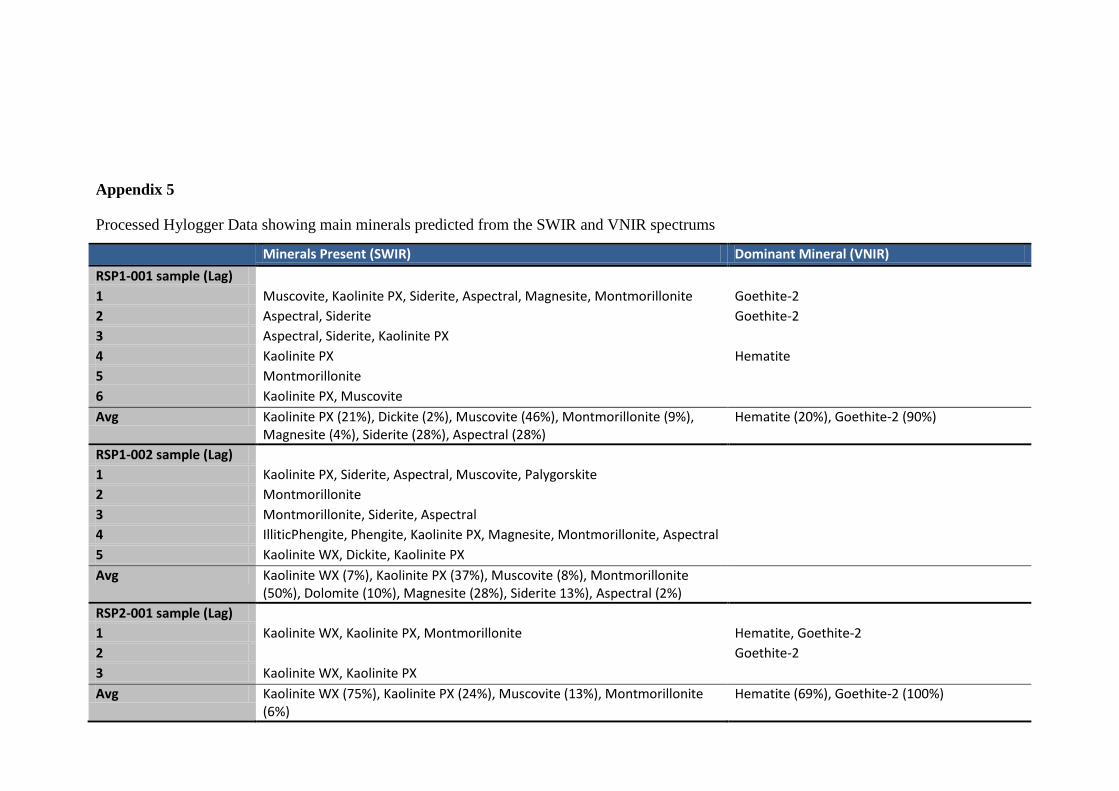
Appendix 5
Processed Hylogger Data showing main minerals predicted from the SWIR and VNIR spectrums
Minerals Present (SWIR) Dominant Mineral (VNIR)
RSP1-001 sample (Lag)
1 Muscovite, Kaolinite PX, Siderite, Aspectral, Magnesite, Montmorillonite Goethite-2
2 Aspectral, Siderite Goethite-2
3 Aspectral, Siderite, Kaolinite PX
4 Kaolinite PX Hematite
5 Montmorillonite
6 Kaolinite PX, Muscovite
Avg Kaolinite PX (21%), Dickite (2%), Muscovite (46%), Montmorillonite (9%), Magnesite (4%), Siderite (28%), Aspectral (28%)
Hematite (20%), Goethite-2 (90%)
RSP1-002 sample (Lag)
1 Kaolinite PX, Siderite, Aspectral, Muscovite, Palygorskite
2 Montmorillonite
3 Montmorillonite, Siderite, Aspectral
4 IlliticPhengite, Phengite, Kaolinite PX, Magnesite, Montmorillonite, Aspectral
5 Kaolinite WX, Dickite, Kaolinite PX
Avg Kaolinite WX (7%), Kaolinite PX (37%), Muscovite (8%), Montmorillonite (50%), Dolomite (10%), Magnesite (28%), Siderite 13%), Aspectral (2%)
RSP2-001 sample (Lag)
1 Kaolinite WX, Kaolinite PX, Montmorillonite Hematite, Goethite-2
2 Goethite-2
3 Kaolinite WX, Kaolinite PX
Avg Kaolinite WX (75%), Kaolinite PX (24%), Muscovite (13%), Montmorillonite (6%)
Hematite (69%), Goethite-2 (100%)
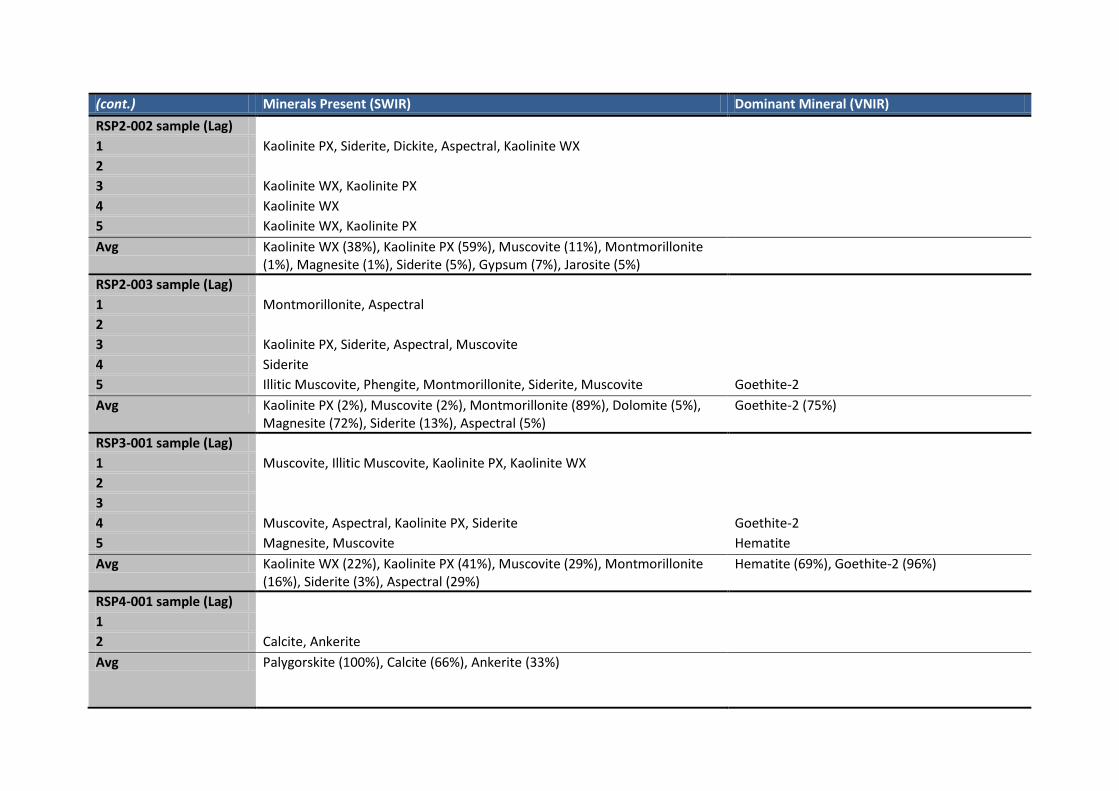
(cont.) Minerals Present (SWIR) Dominant Mineral (VNIR)
RSP2-002 sample (Lag)
1 Kaolinite PX, Siderite, Dickite, Aspectral, Kaolinite WX
2
3 Kaolinite WX, Kaolinite PX
4 Kaolinite WX
5 Kaolinite WX, Kaolinite PX
Avg Kaolinite WX (38%), Kaolinite PX (59%), Muscovite (11%), Montmorillonite (1%), Magnesite (1%), Siderite (5%), Gypsum (7%), Jarosite (5%)
RSP2-003 sample (Lag)
1 Montmorillonite, Aspectral
2
3 Kaolinite PX, Siderite, Aspectral, Muscovite
4 Siderite
5 Illitic Muscovite, Phengite, Montmorillonite, Siderite, Muscovite Goethite-2
Avg Kaolinite PX (2%), Muscovite (2%), Montmorillonite (89%), Dolomite (5%), Magnesite (72%), Siderite (13%), Aspectral (5%)
Goethite-2 (75%)
RSP3-001 sample (Lag)
1 Muscovite, Illitic Muscovite, Kaolinite PX, Kaolinite WX
2
3
4 Muscovite, Aspectral, Kaolinite PX, Siderite Goethite-2
5 Magnesite, Muscovite Hematite
Avg Kaolinite WX (22%), Kaolinite PX (41%), Muscovite (29%), Montmorillonite (16%), Siderite (3%), Aspectral (29%)
Hematite (69%), Goethite-2 (96%)
RSP4-001 sample (Lag)
1
2 Calcite, Ankerite
Avg Palygorskite (100%), Calcite (66%), Ankerite (33%)

(cont.) Minerals Present (SWIR) Dominant Mineral (VNIR)
RSP5-001 sample (Lag)
1 Aspectral, Siderite, Illitic Muscovite, Muscovite,
2 Siderite, Kaolinite PX, Kaolinite WX
3 Kaolinite PX
4
5
6 Kaolinite PX, Aspectral Hematite, Goethite-2
7 Kaolinite PX
8 Kaolinite WX Hematite
Avg Kaolinite WX (9%), Kaolinite PX (36%), Muscovite (6%), Montmorillonite (9%), Siderite (3%), Aspectral (45%)
Hematite (50%), Goethite-2 (25%)
RSP6-001 sample (Lag)
1 Montmorillonite Goethite-2
2 Aspectral Goethite-2
3 Montmorillonite, Siderite, Aspectral Hematite, Goethite
4 Siderite, Aspectral
Avg Kaolinite PX (12%), Montmorillonite (75%), Palygorskite (50%), Aspectral (18%)
Hematite (22%), Goethite-2 (77%)
RSP8-001 sample (Lag)
1 Kaolinite PX, Kaolinite WX, Muscovite
2 Muscovite, Kaolinite PX, Kaolinite WX, Montmorillonite Hematite
Avg Kaolinite WX (30%), Kaolinite PX (69%), Muscovite (40%), Montmorillonite (8%), Illitic Muscovite (1%)
Hematite (100%), Goethite-2 (100%)
RSP10-002 sample (Lag)
1 Kaolinite PX, Kaolinite WX Hematite, Goethite-2
2 Kaolinite PX, Siderite Goethite-2
Avg Kaolinite PX (34%) & WX (63%), Muscovite (36%), Montmorillonite (7%), Seridite (2%), Illitic muscovite (10%)
Hematite (86%), Goethite-2 (100%)

(cont.) Minerals Present (SWIR) Dominant Mineral (VNIR)
RSP11-001 sample (Lag)
1 Aspectral, Kaolinite PX, Siderite
2 Kaolinite PX, Siderite
3 Kaolinite PX, Siderite
Avg Kaolinite Px (57%), Muscovite (12%), Montmorillonite (12%), Magnesite (7%), Siderite (25%), Aspectral (17%)
RSP12-001 sample (Lag)
1 Kaolinite WX, Kaolinite PX
2 Magnesite, Montmorillonite, Siderite, Aspectral, Kaolinite PX Goethite-2
3 Kaolinite WX
4 Kaolinite WX Hematite
5 Kaolinite WX
6 Aspectral Goethite-2
Avg Kaolinite WX (70%), Kaolinite PX (20%), Muscovite (20%), Montmorillonite (49%), Magnesite (1%), Siderite (4%), Aspectral (3%), Illitic Muscovite (7%)
Hematite (16%), Goethite-2 (96%)
RSP13-001 sample (Lag)
1 Muscovite, Kaolinite PX, Aspectral, Siderite Goethite-2
2 Aspectral Goethite-2, Goethite-1
3 Aspectral, Siderite Goethite-2
Avg Kaolinite PX(4%), Muscovite (5%), Siderite (4%), Aspectral (89%) Goethite2 (58%), Goethite-1 (2%)
RSP13-002 sample (Lag)
1 Kaolinite PX, Siderite, Magnesite, Kaolinite WX Goethite-2
2 Aspectral Goethite-2
3 Kaolinite WX, Kaolinite PX, Montmorillonite, Aspectral Hematite, Goethite-1, Goethite-2
4 Siderite, Kaolinite PX
5 Kaolinite WX
Avg Kaolinite WX (59%), Kaolinite PX (19%), Muscovite (1%), Montmorillonite (72%), Magnesite (4%), Siderite (17%), Aspectral (3%), illitic Muscovite (1%)
Hematite (61%), Goethite-2 (77%), Goethite-1 (22%)
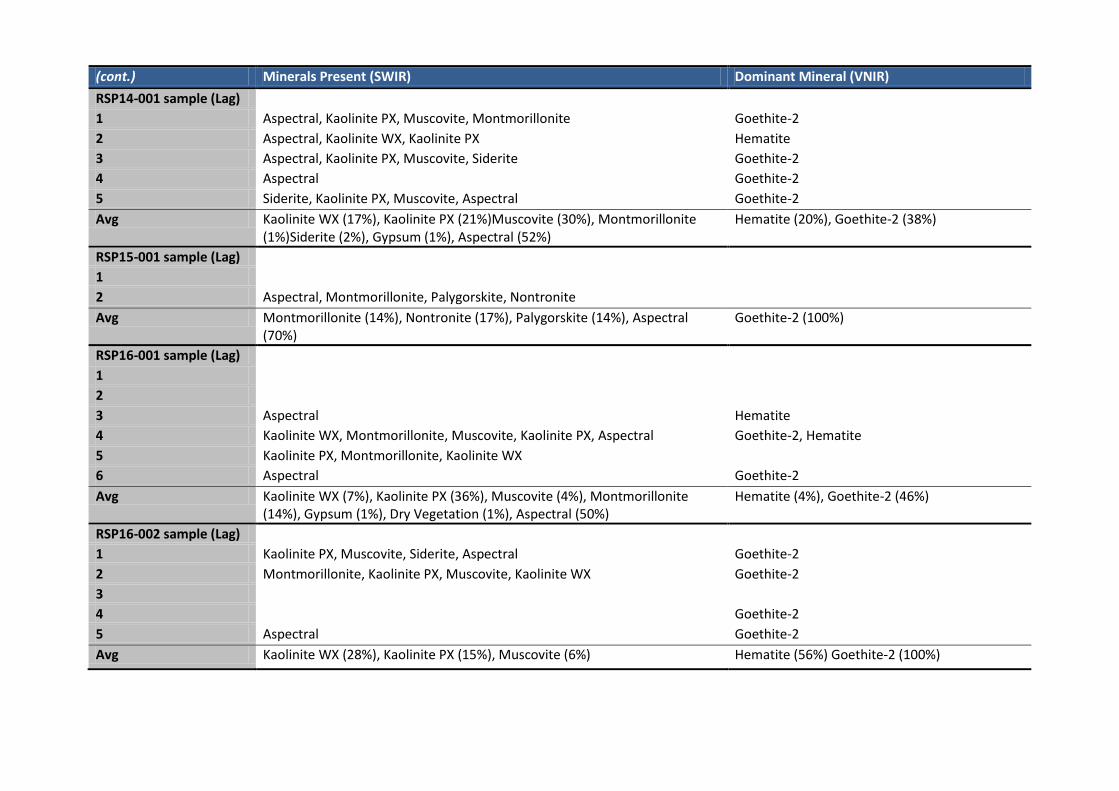
(cont.) Minerals Present (SWIR) Dominant Mineral (VNIR)
RSP14-001 sample (Lag)
1 Aspectral, Kaolinite PX, Muscovite, Montmorillonite Goethite-2
2 Aspectral, Kaolinite WX, Kaolinite PX Hematite
3 Aspectral, Kaolinite PX, Muscovite, Siderite Goethite-2
4 Aspectral Goethite-2
5 Siderite, Kaolinite PX, Muscovite, Aspectral Goethite-2
Avg Kaolinite WX (17%), Kaolinite PX (21%)Muscovite (30%), Montmorillonite (1%)Siderite (2%), Gypsum (1%), Aspectral (52%)
Hematite (20%), Goethite-2 (38%)
RSP15-001 sample (Lag)
1
2 Aspectral, Montmorillonite, Palygorskite, Nontronite
Avg Montmorillonite (14%), Nontronite (17%), Palygorskite (14%), Aspectral (70%)
Goethite-2 (100%)
RSP16-001 sample (Lag)
1
2
3 Aspectral Hematite
4 Kaolinite WX, Montmorillonite, Muscovite, Kaolinite PX, Aspectral Goethite-2, Hematite
5 Kaolinite PX, Montmorillonite, Kaolinite WX
6 Aspectral Goethite-2
Avg Kaolinite WX (7%), Kaolinite PX (36%), Muscovite (4%), Montmorillonite (14%), Gypsum (1%), Dry Vegetation (1%), Aspectral (50%)
Hematite (4%), Goethite-2 (46%)
RSP16-002 sample (Lag)
1 Kaolinite PX, Muscovite, Siderite, Aspectral Goethite-2
2 Montmorillonite, Kaolinite PX, Muscovite, Kaolinite WX Goethite-2
3
4 Goethite-2
5 Aspectral Goethite-2
Avg Kaolinite WX (28%), Kaolinite PX (15%), Muscovite (6%) Hematite (56%) Goethite-2 (100%)

(cont.) Minerals Present (SWIR) Dominant Mineral (VNIR)
RSP17-001 sample (Lag)
1 Montmorillonite
2 Montmorillonite, Kaolinite PX
3 Montmorillonite
4
5 Montmorillonite
6 Kaolinite WX, Kaolinite PX
7
Avg Kaolinite WX (7%), Kaolinite PX (36%), Muscovite (10%), Montmorillonite (63%), Dolomite (4%), Magnesite (26%), Sideriet (10%), Gypsum (7%)
RSP18-001 sample (Lag)
1 Siderite, Montmorillonite Hematite, Goethite-2
2 Siderite, Kaolinite PX, Kaolinite Wx
3
Avg Kaolinite PX (41%) & WX (33%), Muscovite (41%), Montmorillonite (16%), Siderite (25%)
Hematite (33%), Goethite-2 (66%)
RSP19-001 sample (Lag)
1 Siderite, Aspectral
2 Goethite-2
3 Kaolinite PX, Montmorillonite Goethite-2
4 Kaolinite PX, Siderite
5 Goethite-2
Avg Kaolinite PX (61%), Montmorillonite (30%), Siderite (23%), Aspectral (15%) Hematite (22%), Goethite-2 (88%)

Sample (Soil) Minerals Present (SWIR) Dominant Mineral (VNIR)
RSP1-001 Montmorillonite, Dickite, Kaolinite WX
RSP1-002 Montmorillonite, Kaolinite WX
RSP2-001 Kaolinite WX Hematite
RSP2-002 Kaolinite WX
RSP2-003 Montmorillonite
RSP3-001 Montmorillonite
RSP4-001 Palygorskite, Montmorillonite
RSP5-001 Montmorillonite, Kaolinite WX
RSP6-001 Montmorillonite, Palygorskite, Kaolinite Px
RSP7-001 Montmorillonite, Kaolinite WX, Kaolinite PX
RSP8-001 Montmorillonite, Kaolinite PX
RSP9-001 Montmorillonite, Kaolinite PX, Kaolinite WX
RSP10-001 Montmorillonite, Kaolinite PX, Kaolinite WX
RSP10-002 Montmorillonite, Kaolinite WX
RSP11-001 Montmorillonite, Kaolinite WX
RSP12-001 Montmorillonite, Kaolinite WX
RSP13-001 Montmorillonite, Kaolinite PX, Wood
RSP13-002 Kaolinite WX, Montmorillonite
RSP14-001 Muscovite, Kaolinite PX, Montmorillonite
RSP16-001 Montmorillonite, Kaolinite PX, Kaolinite WX
RSP16-002 Montmorillonite, Kaolinite PX, Kaolinite WX
RSP17-001 Montmorillonite, Kaolinite PX Goethite-2
RSP18-001 Montmorillonite, Kaolinite PX, Palygorskite
RSp19-001 Montmorillonite