landsat analysis for uranium exploration in · pdf file · 2010-11-16tertiary...
TRANSCRIPT

LANDSAT ANALYSIS FOR URANIUM EXPLORATION IN NORTHEASTERN TURKEY
by
Keenan Lee
U.S. Geological Survey, Denver, Colorado 80225
Colorado School of Mines, Golden, Colorado 80401
Open File Report 83^99
1983
This report is preliminary and has not been edited or reviewed for conformitywith U.S. Geological Survey standards

LANDSAT ANALYSIS FOR URANIUM EXPLORATION
IN NORTHEAST TURKEY
Keenan Lee
U.S. Geological Survey, Denver, CO
Colorado School of Mines, Golden, CO
ABSTRACT
No uranium deposits are known in the Trabzon, Turkey region, and
consequently, exploration criteria have not been defined. Nonetheless, by
analogy with uranium deposits studied elsewhere, exploration guides are
suggested to include dense concentrations of linear features, lineaments
especially with northwest trend, acidic plutonic rocks, and alteration
indicated by limonite.
A suite of digitally processed images of a single Landsat scene served as
the image base for mapping 3,376 linear features. Analysis of the linear
feature data yielded two statistically significant trends, which in turn
defined two sets of strong lineaments. Color composite images were used to
map acidic plutonic rocks and areas of surficial limonitic materials.
The Landsat interpretation yielded a map of these exploration guides that
may be used to evaluate relative uranium potential. One area in particular
shows a high coincidence of favorable indicators.
INTRODUCTION
This study of Landsat images was undertaken as part of a cooperative
effort between the U.S. Geological Survey and the Mineral Research and
Exploration Institute of Turkey (MTA). The Trabzon area of northeastern
Turkey was selected by Mssrs. Sedat Uz and Ibrahim Cetinturk of MTA as an area
with uranium potential. The utility of Landsat analyses in uranium explo-
1

ration has been demonstrated by Raines and others (1978), Offield, Miller, and
others (in press), Rnepper (in press), and Raines (in press).
The purpose of this study is to provide early input to a program of
regional exploration for uranium. Objectives are to provide a linear features
map, a lineament map, and a geologic interpretation that would be useful in
future uranium exploration.
The Trabzon study area, outlined on figure 1, includes about 70 percent
of a full Landsat frame (Path 186 Row 32). The area is the central one-third
of an area of interest to MTA (S. Uz and I. Cetinturk, written commun.,
1980). The area is along the southeast coast of the Black Sea, about 100 km
from the U.S.S.R. Elevations range from sea level to slightly above 3,000
m. Relief is high in the north, where slopes of the east-west Pontic
Mountains rise steeply from the Black Sea to about 3,000 m (fig. 2). South of
the Pontic Mountains divide, relief is moderate on the Anatolian Plateau, with
major drainages like the Harsit and Coruh rivers flowing west and east. The
southern part of the area is drained by the Euphrates River. Vegetation
appears dense in the Pontic Mountains and sparse to the south.
The geology of the Trabzon area is quite complex, mostly because of
Tertiary convergent-plate tectonism that has strongly deformed large areas and
juxtaposed lithologies of diverse origins (Sengor and others, 1980).
Brinkmann (1976) provided a summary of the geology of Turkey, and a brief
description of the Trabzon 2° x 3° geologic map (1:500,000) was provided by
Gattinger and others (1962).
The oldest sedimentary rocks are Permo-Carboniferous flysch deposits and
Permian shelf facies. Paleozoic metamorphic rocks, including mica schists,
quartzites, metagraywackes, quartz phyllites, graphite schists, and marbles,
may be the metamorphic equivalents of these same rocks (fig. 3). Thick
2

sequences of Mesozoic and Tertiary shelf and trough sediments were deposited
from Jurassic (Lias) time through late Miocene, while ophiolites were
accumulating in the Tethys Sea to the south.
Two major periods of plutonisva occurred, a late Paleozoic (Variscan)
phase of granite intrusions and Tertiary (Alpidic) emplacement of granites,
granodiorites, quartz monzonites, and syenites. Gattinger and others (1962,
p. 41) reported that metamorphic rocks were observed "in the uppermost zones
of the granites" between Gurausane and Kelkit (a region referred to in this
report as the Yasdar-Kose Mountains, see fig. 2 for locations).
On a global scale, northeastern Turkey is at the convergent margin of the
African (Arabian) and Eurasian plates, and as such, has experienced general
north-south compression, including subduction during the closing of the Tethys
Sea. On a more local scale, the North Anatolian Fault, which crosses the
southern part of the study area (fig. 1), is a dextral strike-slip fault that
represents a transform boundary between the smaller Turkish and Black Sea
plates.
No uranium deposits have been reported in the study area, but preliminary
studies by MTA (S. Uz and I. Cetinturk, written commun., 1980) show the older
acidic plutonic rocks to be relatively rich in uranium, up to 18 ppm, whereas
the Tertiary plutons are barren. Radioactive anomalies were found in the
older acidic plutonic rocks and in overlying volcanics and fluvial
sediments. A northwest system of faults contains "acidic fillings with light
colors" that show wallrock alteration, sulfide mineralization, and rarely,
pitchblende (S. Uz and I. Cetinturk, written commun., 1980).
Because the area of interest outlined by MTA crosses three Landsat
scenes, the center scene was chosen for initial processing and analysis. The
purpose of digital processing was to provide the images for interpretation of
3

geologic features that might indicate areas of relatively greater potential
for uranium deposits. These features (discussed later) are dense
concentrations of linear features, northwest lineaments, Paleozoic acidic
plutonic rocks, and surficial limonite. A color infrared (CIR) image and a
color-ratio composite (CRC) image were produced to aid in lithologic
discrimination, in the hope of separating older from younger acidic plutonic
rocks. The CRC image also was used to generate a limonite map useful for
detecting areas of sulfide alteration. A Band 5/Band 6 ratio image was
processed to be used in seeking anomalous vegetation patterns. Enhanced black
and white images were used in addition to the above images to perform a
lineament analysis that would determine those areas most favorable
structurally for uranium occurrence.
Digital processing of Landsat multispectral scanner scene 20211-07214 (21
August 1975, fig. 4) provided the images used for analysis. Processing
included concatenation, skewing, destriping, contrast stretching, edge
enhancement, band ratioing and color compositing (described by Offield,
Knepper, and others, in press). Products generated at the U.S. Geological
Survey's Image Processing Laboratory include: black and white single band
images with two different contrast stretches (2 percent bilinear stretch about
the median and a gaussian cumulative distribution function (CDF) stretch), box
filter edge-enhanced band images, color infrared composites (Bands 4, 5, 7),
color coded Band 5/Band 6 ratio images, and color ratio composites (4/5, 4/6,
6/7). Offield, Knepper, and others (in press) describe these procedures used
rather routinely; Siegal and Gillespie (1980, p. 209-214) should be consulted
for detailed information.

LIMONITE -MAPPING
The color-ratio-composite (CRC) image was generated using the following
ratios: Band 4/Band 5 (0.5-0.6 y m/0.6-0.7p m), Band 4/Band 6 (0.5-0.6 y m/0.7-
0.8 ym), and Band 6/Band 7 (0.7-0.8 ym/O.8-1.1 ^m). The 4/5 ratio values
were coded red, the 4/6 ratio blue, and the 6/7 ratio green. In such a coding
scheme, limonitic areas will image green because ferric ion absorption
(crystal field transitions) near 0.9 p m causes the 6/7 ratio to be high, and
the intense ferric ion absorption centered in the near ultraviolet
(intervalence charge transfer between ferric and oxygen ions) causes the 4/5
and 4/6 ratios to be low. From the CRC, green areas were mapped as surfaces
with limonite coatings (goethite and/or hematite).
Figure 5 is a map of limonitic areas derived from the CRC, which shows
two contrasting areas - a northern area with almost no limonite and a southern
area with abundant limonite. The cause of the difference is, almost surely,
vegetation; the northern area corresponds to the north slope of the Pontic
Mountains, where thick forests obscure the ground surface. The Anatolian
region to the south appears relatively free of vegetation, but even here the
mountainous regions, like the Yasdar and Kose mountains between Gumusane and
Kelkit (fig. 2), show thick vegetation that precludes mapping of limonitic
surfaces.
In addition to the vegetation constraint, the utility of the map is
reduced further by apparent limonitic coatings on alluvial surfaces. As an
exploration aid, therefore, the limonite map is severely limited.

LINEAMENT ANALYSIS
Linear Feature Mapping
Linear features (LF) were mapped by visual inspection of all of the
digitally processed Landsat images and from a drainage map derived from EROS
standard product images that provided sidelap and different-date stereo
models. The approach was to map all linear elements or features that were
recognized in the images, regardless of their source or nature, excluding only
those linear features known to represent roads, canals, etc. (Sawatzky and
others, 1975).
An overlay of linear features was compiled from interpretation of each of
the four black/white CDF-stretched bands - that is, a single composite LF map
was made that included alJL LFs seen sequentially on the four images. This
overlay was then combined with other similar composite overlays to produce a
master compilation (called "All LFs" in later illustrations). Thus seven
different LF compilations were used: (1) CDF-stretched band images, (2)
linear-stretched band images, (3) edge-enhanced band images, (4) 5/6 color-
sliced images, (5) color IR composites (edge-enhanced and not), (6) color-
ratio-composites, and (7) drainage map.
The master compilation represents, then, all LFs mapped on all images,
with redundancies (it is hoped) eliminated. This compilation, shown as figure
6, includes 3,376 linear features, and it doubtless represents over-sampling
of the area.
One of the original research goals of this project was to determine if
significant differences exist between LF populations interpreted from
different types of images (and, incidentally, from mapping by different
geologists) and to try to determine if there is a "best" image. These data
subsets have not yet been analyzed.
6

Statistical analysis of the linear feature map required digitization of
the LF endpoints and subsequent data conversions using interactive computer
programs (Knepper, 1975; Sawatzky and Raines, 1977, 1981). Briefly, the
linear feature endpoints are converted to longitude/latitude coordinates, and
LF lengths and azimuths are calculated. These data are then available for
plotting programs that produce maps of the LFs and LF concentrations and for
various statistical analysis routines.
Spatial Distribution of Linear Features
Figure 6 shows all linear features compiled from all of the Landsat
images interpreted. This map and those that follow are UTM projections at
approximately 1:1,500,000 scale.
Figure 7. maps the concentrations of all LFs of the Trabzon study area.
Contour values are relative numbers that represent the number of LFs per unit
area; in this example the unit cell is 4 km square. Clearly, the LFs are not
uniformly distributed.
Length Distribution of Linear Features
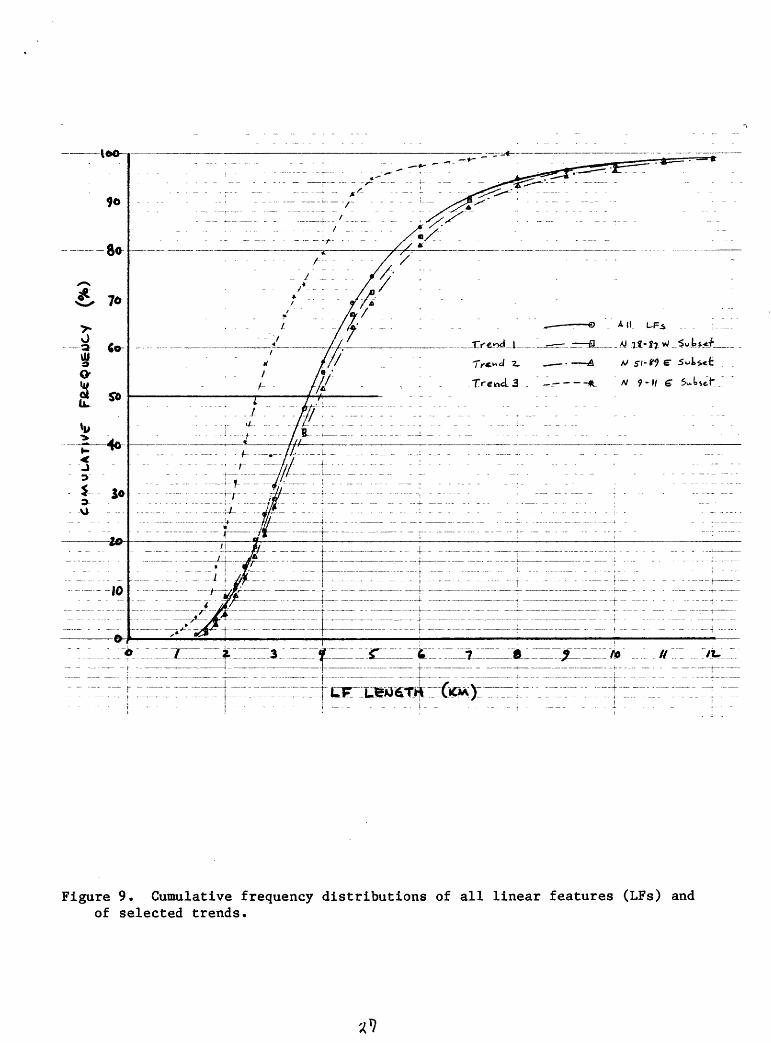
Figure 8 is a histogram of the total LF population showing frequency of
occurrence by length, in kilometers. The 3,376 LFs range from about 800 m to
17.4 km, with a mean length of 3.69 km and a median length of 3.73 km. A
cumulative frequency distribution is shown in figure 9. Although a log
conversion of the data was not done, the lengths are doubtless lognormally
distributed (Podwysocki, 1974; written commun., 1982).
From a comparison of figures 10 and 11, showing respectively the shortest
7 percent of the LFs and the longest 5 percent, it appears to me that the
shortest LFs are more uniformly (randomly?) distributed, whereas the longest
LFs show more clearly preferred directions and concentrations.

Azimuth Distribution of Linear Features
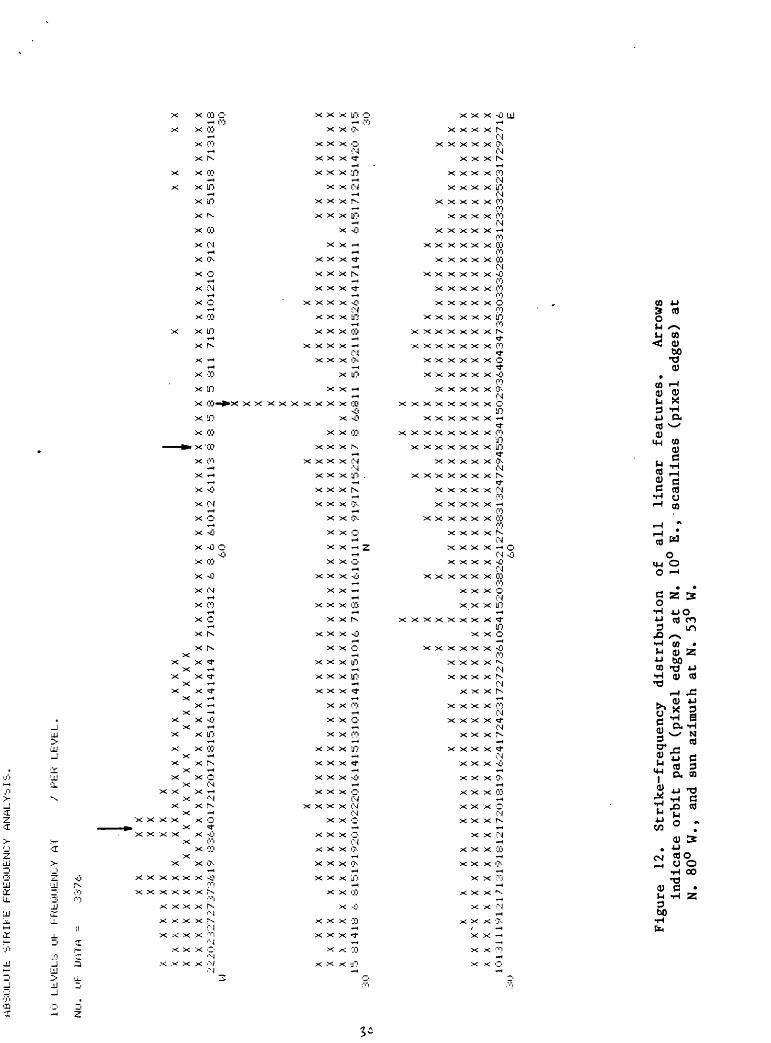
A strike-frequency histogram (fig. 12) shows the frequency of occurrence
of all LFs. Pixel-edge directions are N. 10° E. and N. 80° W. (280 degrees),
and the sun azimuth is S. 53° E. (307 degrees).
Linear Feature Interpretation
Significant Trends
Using a significance value (defined by Sawatzky and Raines, 1981) of 90
percent, statistically significant trends are defined at five different
azimuths, as shown in figure 13. There appear three main trends, a WNW trend,
a narrow NNE trend, and a broad ENE trend. To determine if the two WNW trends
are distinct, maps of these two subsets were compared, but finding no visual
distinction between the two, they were combined into a single significant
trend: Trend 1, defined as N. 78°-87° W. (273-282). A similar procedure
carried out with the two ENE trends resulted also in combining these two into
a single significant trend: Trend 2, defined as N. 51°-89° E. (51-89).
The LFs that trend N. 9°-ll° E. are considered not to constitute a
significant trend, for the following reasons:
(1) The LFs show little systematic spatial distribution (fig. 14); in
particular, they do not form a strong trend parallel to their strike (fig.
15).
(2) The LFs in this azimuth are distinctly shorter than average (fig.
9),
and
(3) this is the orbital path direction, and as such, it is the direction
of the pixel edges. This may be simply coincidence, but during LF mapping I*
believed that I was seeing edge effects and tried not to map them. Also, this
trend appears on the strike-frequency histogram (fig. 12) as two lows flanking
8

an anomalously high, narrow trend interval. Further work on data subsets,
especially comparing edge-enhanced with non-edge-enhanced images, may help
clarify this question.
Because it was unknown that the 90 percent significance value used to
define significant trends was necessarily the proper value, an attempt was
made to interpret trends with significance values less than 90 percent.
Exclusive of the three significant trends just discussed, the azimuth group
with the next highest frequency of occurrence is N. 75°-76° W. (284-285).
Because this subset shows little information (fig. 16), the search for
significant trends ended.
Trend 1
The characteristics of the NW Trend 1 are described by:
Figure 9 - cumulative frequency distribution of lengths,
Figure 17 - spatial distribution, and
Figure 18 - concentrations of LFs.
Trend 2
The characteristics of the NE Trend 2 are described by:
Figure 9 - cumulative frequency distribution of lengths,
Figure 19 - spatial distribution, and
Figure 20 - concentrations of LFs.
Because Trend 2 is so broad, smaller subsets can be examined in 10-degree
increments, as shown in figures 21-24.

Discussion
Although there are variations in detail, two prominent trends of LFs
appear, a WNW trend and a broad ENE trend, with a marked paucity of LFs in
between. A brief summary description of LFs at all azimuths follows:
N. 70°-90° W.: This interval contains, a trend that is apparent in all
data subsets.
N. 40°-70° W.: No significant trends occur. A few long linear features
occur in the south of the area. A broad minimum centers about N. 51°
W.; the sun azimuth is N. 53° W. Linear features in this azimuth
region may be seen less clearly, and subsequently mapped at lower
frequencies, because of the sun (discussed below).
N. 0°-40° W.: There may be a significant set of long LFs on the north
slope of the Pontic Mountains. When a subset of LFs from this area
alone was examined, a N. 15°-22° W. interval was defined using a 90
percent significance value. Similarly, a subset of LFs greater than
10 km long shows significant intervals at N. 15°-16° W. and N. 20°-
22° W. (subset data are not included in this report).
N. 0°-15° E.: A well-defined, narrow trend N. 9°-ll° E. appears in the
central part of the image. None of these LFs is long, and there
appears to be little pattern to their distribution. These LFs
probably are due to pixel-edge effects.
N. 15°-50° E.: No pervasive trends occur.
N. 50°-90° E.: This interval contains the strongest of the two
significant trends; the trend appears in all data subsets of all
lengths and in all areas. This trend probably represents the younger
set of fractures, based on the logic that Variscan fractures would
occur only in Paleozoic rocks (probably less than 20 percent of image
10

area), except for those later reactivated, whereas younger Alpide
fractures would occur in Paleozoic, Mesozoic, and lower Tertiary
rocks.
An argument might be made for combining the ENE trends with the WNW
trends, to form a single, 50°-wide trend. Such a trend might possibly
incorporate a continuum of linear features, representing an arcuate pattern of
fractures.
Because all linear feature data were derived from a single Landsat scene,
it is difficult to separate out the effects of the system from the natural
linear feature distribution. An attempt to do this was made in rejecting the
N. 9°-ll° E. trend of LFs, the pixel edge direction, but it is likely that the
second pixel edge effect (N. 79°-80° W., the scanline direction) is operable
as well, although these LFs could not be readily isolated in the data set.
Logic and observations elsewhere (Sawatzky and Lee, 1974) would suggest
that linear features are selectively enhanced by the imaging "systems" as a
function of viewing-illumination azimuths. This system effect would
selectively subdue linear features in the solar illumination direction (N. 53°
W.) and selectively enhance linear features oriented northeast (Briceno and
Lee, in press; Briceno and others, 1982). The extent of this selective effect
in this study is unknown.
Lineaments
As used in this report, a lineament is an elongate zone of small alined
linear features. Except for some lineaments that appear clearly in the image
itself, the recognition of lineaments is based on linear feature analysis and
is the final interpretation of this analysis. The basis of lineament
recognition is interpreting those linear trends, or clusters, that occur
within the mapped linear features. By way of illustration, a homogeneous area
11

with a single fracture direction would show LFs distributed uniformly over the
image, and one statistically significant trend would emerge in the analysis,
but no lineament would be mapped. Thus in interpreting lineaments by the.
methodology used here, one normally selects a significant azimuth trend,
analyzes only that subset of LFs oriented within that azimuth interval by
contouring their density distribution, and selects any alined concentrations
of LFs.
Figure 25 shows the lineaments that were interpreted from the northern
part of the study area. With the exception of the Harsit lineament, all
northwest lineaments are based on the distribution of northwest LFs (Trend 1),
and all northeast lineaments similarly are derived from plots of northeast
(Trend 2) LFs. Geologic rationale would suggest such lineaments to be
representations of deep-seated fault zones or shear zones, along which
recurring motions or adjustments take place, manifest at the surface by
parallel linear topographic features, usually linear topographic lows, such as
valleys and drainage segments.
The Harsit lineament is an exception to the above in that it is ai
northwest lineament, but it is defined on the basis of northeast linear
features. The clearly defined linear concentration (fig. 20) has a trend of
N. 62° W. (298). By examining subsets of the Trend 2 LFs (figs. 21-24), it
becomes apparent that, although some LFs of all northeast orientations exist,
the lineament is most clearly defined by the subset N. 81°-89° E. (81-89)
(fig. 24).
A geologic explanation for this fracture geometry is not apparent. A
possible model for the Harsit lineament might be found in an example of simple
shear, with the shear couple oriented northwest and acting in a right lateral
sense, with induced en echelon fractures in the shear zone approximately east-
12

west (analogous to fracture cleavage). Given the orientation of the Harsit
lineament as N. 62° W. and an average N. 85° E. for the linear features, the
average angle of intersection is 33°. The right lateral shear accords well
with known current and recent tectonism if the Harsit lineament is similar to
the parallel Erzincan lineament to the south (fig. 25). The Erzincan
lineament is a representation of the North Anatolian Fault, the active right-
lateral strike-slip fault zone (see fig. 1).
EXPLORATION GUIDES
Other studies relating Landsat features to uranium occurrences have shown
a definite correlation between density of linear features and uranium deposits
(Raines and others, 1978; Offield, Miller, and others, in press; Knepper, in
press; Raines, in press). It may be that dense LFs correspond to numerous
fractures that provide both leaching paths in the acidic source rocks and
mobilization pathways along which transport and deposition of uranium take
place. Using this exploration criterion, figure 7 defines three main areas of
dense LF concentrations. Using the 90 contour (relative scale) to define the
areas of densest concentrations of LFs, these areas were transposed to figure
26, where they are seen to lie along the Kop lineament, along the Coruh
lineament, and in the Yasdar-Kose Mountains. Relatively fewer LFs were mapped
in the Pontic Mountains, and they are more dispersed.
Preliminary uranium exploration conducted by MTA has suggested that
northwest fractures will be more favorable than northeast fractures. This
would focus attention on the northwest lineaments shown on figure 26. The
northeast lineaments cannot be discounted, however, because "An alpine revival
of acidic intrusive activity in the (Yasdar-Kose Mountains) region is
indicated by small veins of porphyritic granites, pegmatites, and aplites"
(Gattinger and others, 1962). If a later remobilization of the uranium took
13

place during Alpidic tectonism, deposits may then be related to the more
modern stress field.
The distribution of acidic igneous rocks cannot be interpreted with any
certainty. The distribution of Paleozoic acidic plutonic rocks mapped from
Landsat and shown on figure 26, corresponds in general with the 1:500,000
geologic map (Gattinger and others, 1962), but there may be many more areas of
similar rocks that cannot be recognized because of the vegetation in the
Pontic Mountains. Acidic volcanic rocks have not been mapped. Although in
some cases Eocene volcanics can be mapped on the Landsat composites, acidic
rocks cannot be distinguished from intermediate and basic volcanics.
Limonitic alteration might be associated with uranium vein mineralization
if pyritization occurred during mineralization. Some of the limonitic areas
mapped from the CRC image (fig. 5) are shown in figure 26, but only those that
correspond to bedrock (many of the limonitic areas mapped are in recent
alluvial deposits). Almost no limonite could be seen in the Pontic Mountains,
probably because of vegetation.
Paleozoic metamorphic rocks are not mapped, but they may provide one of
the exploration criteria for allogenic deposits. Where graphite schists are
common (Gattinger and others, 1962), especially around the older granites of
the Yasdar-Kose Mountains, they may have provided reductants for uraniferous
fluids.
Exploration guides for vein-type uranium deposits may include dense
concentrations of linear features, older northwest fractures, presence of
acidic rocks, especially Paleozoic granites and syenites and younger acidic
volcanic rocks, limonitic alteration, and possibly older metamorphic rocks.
Figure 26 is a summary compilation, derived from information shown in previous
figures, of these exploration features.
14

SUMMARY
Landsat data have been digitally enhanced to provide images from which
geologic information was extracted. Geologic interpretation has yielded
guides that may be used in the regional exploration for uranium.
From enhanced images of one Landsat scene, several thousand linear
features were mapped, with a median length of 3.7 km. Statistical analysis of
the linear feature data defined two significant azimuth trends - a west-
northwest trend (N. 78°-87° W.) and a broad northeast trend (N. 51°-89° E.).
By generating contour maps of the relative concentrations of the linear
features in each of these two trend intervals, derivative lineaments, usually
of the same orientations, were defined. Nine strong lineaments occur, with
thirteen smaller or weaker lineaments. Some pairs of west-northwest and east-
northeast lineaments seem to merge, and they may, in fact, represent one long,
continuous, arcuate lineament (for example, the Harsit-Coruh lineaments, see
fig. 26). Known uranium deposits elsewhere correlate with dense accumulations
of linear features and with lineaments.
Color infrared composites, a color-coded Band 5/Band 6 image that
enhances vegetation density, and a color-ratio-composite image were used to
map granitic areas south of the Pontic Mountains. These granites have an
anomalously high uranium content and may be source rocks.
Limonite distribution also was mapped, in nonvegetated areas south of the
Pontic Mountains, by using the color-ratio-composite image, but the results
are marginal. Uranium concentrations may be associated with sulfide
mineralization and alteration, and may therefore show surface limonite derived
from pyrite.
A composite map of exploration guides was derived (fig. 26) from the
mapping of the above geologic features on the Landsat images. Inspection of
15

this map may be helpful in future uranium exploration, because several areas
of interest emerge. Notably, the Yasdar-Kose Mountains show a high
coincidence of favorable indicators.
Because the nature of uranium deposits, if any, has not been established,
the exploration criteria suggested here remain to be tested by exploration in
these areas. Optimum use of these exploration guides will come with field
checking, detailed field mapping, and the eventual ability to determine which
of the guides is (are) the most effective.
REFERENCES CITED
Briceno, H. 0., and Lee, Keenan, in press, Applications of Landsat data to
geologic mapping in tropical jungle environment - Caroni River Basin,
Venezuela: Proc. 16th Intl. Symp. Remote Sensing of Environment, Buenos
Aires.
Briceno, H. 0., Lee, Keenan, and Knepper, D. H., Jr., 1982, Analisis de
lineamientos en ambiente de selva tropical, a partir de imagenes de
Landsat y SLAR - cuenca media del Rio Caroni, Venezuela (Analysis of
lineaments derived from Landsat and SLAR images in a tropical jungle
environment - middle Caroni River Basin, Venezuela) (abs.): 1st
Venezuelan Geophys. Gong., Proc., Caracas, 1982, Venez. Assoc. Geophys.,
p. 60-61.
Brinkmann, Roland, 1976, Geology of Turkey: Elsavier Sci. Publ. Co.,
Amsterdam, 158 p.
Gattinger, T. E., comp., Erentoz, Cahit, and Ketin, Ihsan, eds., 1962, Turkiye
jeoloji haritasi 1:500,000 olcekli-Trabzon (Geologic map of Turkey,
1:500,000 scale - Trabzon [Quadrangle]): Maden Tetkik ve Arama Enstitusu,
Ankara, 75 p.
16

Knepper, D. H., Jr., ed., 1975, Geologic and mineral and water resources
investigations in western Colorado, using ERTS-1 data: Final Report, NASA
Contract NAS 5-21778: Colo. School of Mines, Remote Sensing Rept. 75-1,
p. 95-135.
____ in press, Sandstone uranium deposits and Landsat linear features in the
southern Colorado Plateau - some observations: Symp. uranium exploration
methods, Paris, 1982, Organization for Economic Cooperation and
Development.
Of field, T. W., Knepper, D. H., Jr., Sawatzky, D. L., and Raines, G. L., in
press, Regional settings of uranium occurrence: Preliminary Landsat
studies - Introduction: Symp. uranium exploration methods, Paris, 1982,
Organization for Economic Cooperation and Development.
Of field, T. W., Miller, G. B., Raines, G. L., and Ramaekers, Paul, in press,
Unconformity-vein uranium setting in Saskatchewan, Canada - preliminary
Landsat study: Symp. uranium exploration methods, Paris, 1982,
Organization for Economic Cooperation and Development.
Podwysocki, M. H., 1974, An analysis of fracture trace patterns in areas of
flat-lying sedimentary rocks for the detection of buried geologic struc
ture: Goddard Space Flight Center, Greenbelt, Md., (X-923-74-200) 67 p.
Raines, G. L., in press, Regional analysis of Landsat data concerning
unconformity-vein uranium deposits, Pine Creek Geosyncline, Australia:
Symp. uranium exploration methods, Paris, 1982, Organization for Economic
Cooperation and Development.
Raines, G. L. , Offield, T. W., and Santos, E. S., 1978, Remote sensing and
subsurface definition of facies and structure related to uranium deposits,
Powder River Basin, Wyoming: Econ. Geology, v. 73, no. 1, p. 1706.
17

Sawatzky, D. L., and Lee, Keenan, 1974, New uses of shadow enhancement:
Remote Sensing of Earth Resources, v. 3, p. 1-18.
Sawatzky, D. L., Prost, G. L., Lee, Keenan, and Knepper, D. H., Jr., 1975,
Geological significance of features observed in Colorado from orbital
altitudes: Proc. First Earth Resources Survey Symp., NASA, Houston, v.
IB, p. 713-760.
Sawatzky, D. L., and Raines, G. L., 1977, Analysis of lineament trends and
intersections (abs.): Geol. Soc. America Abstracts with Programs, v. 9,
no. 6, p. 759.
_____ 1981, Geologic uses of linear feature maps from small-scale images, in
O'Leary, D. W., and Earl, J. L., eds., 3rd Intl. Conf. New Basement
Tectonics, Proc.: Denver, Basement Tectonics Comm., p. 91-100.
Sengor, A. M. C., Yilmaz, Yucel, and Ketin, Ihsan, 1980, Remnants of pre-Late
Jurassic ocean in northern Turkey: fragments of Permian-Triassic Paleo-
Tethys?: Geol. Soc. America Bull-., Pt. I, v. 91, p. 599-609.
Siegal, B. S., and Gillespie, A. R., 1980, Remote sensing in geology: John
Wiley and Sons, New York, 702 p.
18

N
/
TURKISH PL.ATE.
MAR AS
ARABIAN PLATE
s X. .-^* X/
L t Mfi A **
"" j
K»A.RELATIVE MVOT10M
Figure 1. Location of study area with respect to regional tectonic elements (from Brinkmann, 1976).

4l*o«'
r« looi i i:
Figure 2. Index map of study area.

Figure 3. Geologic sketch map of northern part of study area (simplified from Gattinger and others, 1962).

So /oo
Figure 4. Landsat image of Trabzon study area (not enhanced).

SoZfc
Figure 5. Map of limonitic areas (stippled pattern) derived from color-ratio- composite image. North of dashed line, and in topographically high areas south of line, limonite mapping incomplete because of dense vegetationcover.

41: 0:00
40:30:00
40: 0:00
+
39:30:00
CM SO SO
CM
O
OO
01 1-
oOO
So «-, 1 1 1
O
OO
(0
04O OO
KM
Figure 6. All LFs compiled from all sources. Scale of this map and following maps is about 1:1,500,000.

41: 0:00 +
40:30:00
40: 0:00
39:30:00
O4 VO
o o
VO
o o o
o
CMo
oo
Soztz
loo
Figure 7. Concentrations of all linear features and derived lineaments. Contour values are relative numbers (southern part of map area was not of interest for uranium exploration; lineaments not continued south of latitude 39°50').

LENGTH FREQUENCErtCUM FREQ REL FREQ 4-
INTERVAL '
X 00j . 40:;> . sot . 20t . 602 . 002.402 . SO3 . 203.60'4 . 00* . 401 . SO5 . 205 . 60S. 00S.40s. so7.207.603 . 003.403 , 809 . 20?.60D . 00J . 40D . SO1 . 201 . 602 . 002 . 402.803 . 203 . 604 . 004.404 . 805.205 . 60'-.>. 006.406. . 807.20
0.400 . SO1 . 201 .602 . 002.402 . 803 . 203 . 604.004.404 . 805 . 205.606 . 006 . 406 . 807.207.608 . 008.40S . SO9 . 209.60
10. 0010.401 0 . 801 1 . 201 1 . 6012.0012. 4012. SO13.201 3 . 601 4 . 0014.4014.801 5 . 2015.6016.001 6 . 4016.801 7 . 2017.60
01
1353160'*L7'-->
37538734931728723416714810194o o
7055o o251515199171316y554!;!
40 -,'. '2C)1o2
1JL!
01
1467
227500875
1 26216111 92822ls244926 1 6276428652959304231123167320532303245326032793288330533 1 8333433423347335233563359336:333633366336833703370337 13371337333743376
0 . 000 . 030. 391 . 574.748. 0911.111 1 . 461 0 . 349 . 398 . 506.934.954.382.992.782.462.071.631. 130.740.440.440 . 560.270 . 500. 390.470.240. 150. 150.120 . 090. 120 . 000 . 090 . 060 . 060 . 000.030 . OO0 . 060 . 030. 06
ft
ft
ft
#
ft ft
ft' ft
ft-
ft-
ft'
ft-
ft-
ft-
ft-
ft-ft
ft-
ft-
ft
ft
ft
3-
-ft
ft
ft -ft -ft -ft -ft ft -ft -ft -ft -ft # -ft -ft -ft -ft -ft ft -ft -ft -ft ft ft -ft -ft -ft -ft -ft -ft -ft -ft -ft -ft -ft -ft -ft -ft -ft -ft -ft -ft -ft -ft -ft -ft -ft * -ft -ft -ftft ft -ft -ft ft ft- -ft # ft -ft -ft ft -ft -ft -ft -ft -ft -ft -ft -ft -ft -ft -ft -ft -ft -ft -ft -ft -ft -ft -ft -ft -ft -ft -ft -ft -ft -ft
ft -ft -ft -ft -ft -ft -ft -ft -ft -ft -ft -ft -ft -ft -ft -ft * -ft -ft -ft -ft -ft -ft -ft -ft -ft -ft -ft -ft -ft -ft -ft -ft -ft -ft -ft
ft -ft -ft -ft -ft -ft -ft -ft -ft -ft -ft -ft -ft -ft -ft -ft -ft -ft * -ft -ft -ft -ft -ft -ft -ft -ft -ft -ft ft -ft -ft -ft -ft -ft ft- -ft -ft -ft -ft -ft -ft -ft -ft -ft -ft -ft -ft -ft -ft -ft -A- -ft
ft -ft -ft * -ft -ft -ft -ft -ft -ft -ft -ft -ft -ft * -ft -ft ft -ft * -ft -ft -ft # -ft -ft -s- -ft ft- -ft -ft-a- ft -ft -ft -ft -ft -ft -ft -ft -ft -ft ft -S-ft-tt -ft -ft -ft -ft -ft
ft -ft -ft -ft -ft -ft -ft -ft ft * -ft -> -ft -ft -ft ft -ft -ft -ft -ft
Figure 8. Histogram of lengths of all linear features, in kilometers, (cum freq = cumulative frequency; rel freq = relative frequency).
- -* - 7^ $ 3 f
;
|
| |
r n fe 7 ft jtl - A» - # 'Vw ~ r
1 ' !1 x1 % I
LP L_^J06Trt ClCVV) i '^ 1 X , 1 !
Figure 9. Cumulative frequency distributions of all linear features (LFs) and of selected trends.

41: 0:00 + ' \+ + +- »
39:30:00
40:30:00 + - -fc ' ', rf- r
*"<
I I'40: 0:00 + l% +
/I
\
,' " , *.'» -*
'I . .
CM SO
O
0o
CM VO
CMO
bo
o so\ 1 1 1 1 1
O
0
00
o(M 0
oo
loo
Figure 10. All linear features less than 2 km long,

41: 0:00 + +
40:30:00
40: 0:00
39:30:00
VDCM VO
o o o
o
OM O Oo
1=1 loo
KN\
Figure 11. All linear features more than 8 km long,
ABSOLUTE STRIKE FREQUENCY ANALYblS.
10 LEVELS Uh FREQUENCY AT
NU
. U
F IJ
A'T
A
-» 3
37
6
/ P
ER
LE
VE
L.
X X
X X
X X
XX
X X
XX
X X
X2
22023272
w
X X
Xx
:< x
xX
X X
X15
8
14
18
30
X:<
x x "
xX
X X
X1
01311191
su
X X
X X
XX
X
X X
X X
XX
X
XX
X X
X1
73
73
61
9
X X
XX
XX
X X
X6
81
51
91
X X
X X
X X
X X
X X
21
71
31
91
X X'
X X
X X
XX
XX
XX
X X
X X
33
64
01
7 XX
X
XX
X X
XX
X X
X
X XX
XX
X X
XX
XX
X X
X X
XX
X
XX
XX
X
X X
XX
XX
X2
12
01
71
81
51
61
1141414
XX
XX
XX
XX
X
X X X920102220161415
X X
XX
X X
XX
X X
X
XX
XX
XX
XX
X
X X X X
X X
X X
XX
XX
X
X X
X X
X X
X X
X X
7 7
10
13
XX
XX
X1
31
01
31
41
51
51
01
6
XX
XX
XX
X8
12
17
20
18
19
16
24
17
24
X X X
X X
X X
2817
X X
X X
X X
X X
X X X X X X
X X
XX
XX
X
X X
12
6 XX
XX
X
X X
8
66
0
X X
X X
XI
X X
X
X X
X X
X X
X X
X X
X X
X X
X X
X X
X X
X X
X X
X X
X6
10
12
61113
8
8
5
8
5
811
715
8101210
912
8
7 5
15
18
713
X X7
18
11
16
10
11
10
X X X X X X X
X X
X X
27
27
36
10
54
15
X X XX
XX
XX
X2038
N
X X
X X
X X
X X
26
21
26
0
X X X X
t X X X X X XX
X X
XX
XX
XX
X
XX
XX
XX
XX
X
X
XX
XX
XX
XX
XX
X
X
XX
XX
XX
XX
X
XX
XX
XX
XX
XX
XX
XX
XX
XX
XX
XX
XX
XX
XX
X
XX
XX
91
91
71
52
21
7
8
66811
51
92118152614171411
6151712151420
X X
X X
X X
XX
X X
XX
XX
X
XX
XX
X
XX
XX
XX
XX
XX
XX
XX
XX
XX
XX
XX
X
XX
XX
XX
XX
XX
XX
XX
XX
XX
XX
XX
XX
XX
X
XX
XX
X X
XX
XX
XX
XX
XX
XX
XX
XX
XX
XX
Xx
xx
xx
xx
xx
xx
xx
xx
xx
xx
xx
xx
xx
xx
XX
X
XX
XX
XX
XX
XX
XX
XX
X
XX
XX
XX
XX
X
X X
X X
18
18
30 X
X X
X X
915
30
X X X
X X
X X
7383 1
32
47
29
45
53
4 1
50293640
43
47
35
30
33
36
28
38
3 1
23
33
25
23
1 7
29
27
1 6 E
Figure
12.
Stri
ke-f
requ
ency
distribution
of
all
line
ar features.
Arro
ws
indicate orbit
path
(pixel ed
ges)
at N.
10°
E.,
scanlines
(pix
el edges) at
N.
80
° W.
, and
sun
azim
uth
at N.
53°
W.

LMF1K1CAL bIRIKE f-REQUENCY ANALYSIS.
10 LEVELS
IJF- HREUUENCY AT
15 PER LEVEL.
PERCENT HZ1MUIH fOR SMOOTHING =
1.67
NO.
OF-
DATA =
3376
sX
XX
XX
XX
XX
X-.
" A
S
X X X X X 'lY
'X
XX
XX
XX
XX
XX
X >
7C/1
X X
X X
X X
X X
X X
X X
, 1 ;
> ;:
-T
V>
f K
\C\
X X X X X
/X X X X X
1 -
X X X X X in
X X X X X X-.
/ - -
\ X X X X X7
01
X X X X >85f
X X
X X
X X
X X
13
55
X X
xxxx
xxxx
xxxx
50
49
42
41
::
XXX
X X
X X
X X
X X
XX
X
XX
XX
XX
XX
XX
XX
XX
XX
X
XX
XX
XX
XX
XX
XX
XX
XX
X
504942413942352824303531262020222828293032292121182124263330333032313129272O
27384O
3838
XXX
XXXXXXXXXX
XXXXXXXXXX
X X
XXXXXX XXXXXX
xxxxxxxxxxxx
X X
X X
X X
X X
4951
TREND 3
X X
X X
X X
X X
X X
X X
X X X41374038322
X
XX
XX
X33344
X X
X X
X X
342
X X X X484
XX
XX
X942 X
X X
X X
X X
X X X X
X X X X53584
X X X X249 5O 4
X X X X
X X X X 95
X X X X9474
X X X X
xxx'
xxxx
x xxxxxxxxxxxxxxx
xxxxxxxxxxxxxxxxxxxxxxxxxxxxxxxxxxxxxxxxxxxxxxx
xxxxxxxxxxxxxxxxxxxxxxxxxxxxxxxxxxxxxxxxxxxxxx
xxxxxxxxxxxxxxxxxxxxxxxxxxxxxxxxxxxxxxxxxxxxxx
X X X
X X
X X
X X
?S9SftSridSd^:^S^/-/^VAv?A4.drt4.1 ̂^A1 :^A4.S^7^7:^1 i^n^RASSI S4S44731 : 7fiSrt4JiR4S5ftS4R95SR74S4-:^1 323844444 1
49434434
X X X X 95
N
^X^Tx>(\V^_^
Px'*'~*V
^x">
fx
x xxxxxxxx
x ?S
»^>^\
^^x,-
^_-»
«*""
'^'^
XXXXXXXXXXXXXXXXX X
X ^^*x^
/ X
X X
X '
* X
XXXXXXXXXXXXXXXXXXXXXX XXT
xxxxxxxxxxxxxxxxxxxxxxxxxxxxxxxxxxxxxxxxx
xxxxxxxxxxxxxxxxxxxxxxxxxxxxxxxxxxxxxxxxxxxxxx
xxxxxxxxxxxxxxxxxxxxxxxxxxxxxxx xxxxxxxxxxxxxxx
xxxxxxxxxxxxxxxxxxxxxxxxxxxxxxxxxxxxxxxxxxxxxx
xxxxxxxxxxxxxxxxxxxxxxxxxxxxxxxxxxxxxxxxxxxxxx
FiS7S'
:iS'"/S7ASA4.A4A7'
1 '
"/("> 7
' -1
("»7Qft
1->73P:4t:-!S"74:~:A
1T/A
1
1 (")
rt'
T-1!
" 7'~:'
:!>4
4vi~
>1 S SI 930^'SI T-""/ftv9v7
'" >979'?fi7Sl SI -SAv'
60
/ X X X X X '3'
30
**\ X X X X X
X X X X X .9 E
Figu
re
13.
Smoothed strike-frequency distribution of
all
linear features.
Tren
d intervals
indi
cate
d wh
ere
sign
ific
ance
va
lue
greater
than
90
perc
ent.

\\
\J
41: 0:00
40:30:00 -j- -H ' ' i i
40: 0:00 / +
i i
39:30:00
CM SO
O O
SO
CM O
Oo
oo
So
oo
loo
Figure 14. Subset of linear features with N. 9°-ll° E. orientations (9-11)

\\\
_ _ _ _I
41: 0:00
40:30:00
40: 0:00
39:30:00
CM SO
Oo
CM VD O4O Oo
oo
oo
loo
Figure 15. Concentrations of linear features with N. 9°-ll° E. orientations (9-11).

\
\_ J.
41: 0:00 +
40:30:00 +o
40: 0:00
o
39:30:00
SO
Oo
CM SO CM O
oo
OO
CM O Oo
So looI'll
KMV
Figure 16. Concentrations of linear features with N. 75°-76° W. orientations (284-285).

\ __ J
41: 0:00 + + +
40:30:00 + " ~ '
40: 0:00
39:30:00
CM VD
O O
CMVD CM0 O O
O O
040 O O
So loo
Figure 17. Map of Trend 1 linear features - N. 78°-87° W. (273-282)

\
41: 0:00
40:30:00 +
40: 0:00
39:30:00
vo CM
oo oo
So
oo ooloo
Figure 18. Concentrations of Trend 1 linear features - N. 78°-87° W. (273- 282)- and derived lineaments (north of 39°50 f ).

41: 0:00
40:30:00
40: 0:00
+
39:30:00
:»^-5?^55?<tfr
(A VO
Oo
VO CM O Oo
oo
oo
KM.
Figure 19. Map of Trend 2 linear features - N. 51°-89° E. (51-89)
37

41: 0:00 +
40:30:00
40: 0:00
39:30:00 +
CMvo
oo
CM VO
CMo
oo
5b
oo
loo
CM O
oo
Figure 20. Concentrations of Trend 2 linear features - N. 51°-89° E. (51-89) and derived lineaments (north of 39°50').

T\
41: 0:00 +
40:30:00 +
40: 0:00
39:30:00
vo
o o
CM VO CM O
Oo o o ooloo
Figure 21. Concentrations of Trend 2 linear features - subset N. 51°-60° E. (51-60). Annotated lineaments include all of those lineaments derived from all of the Trend 2 linear features.

41: 0:00 +
40:30:00
40: 0:00
39:30:00
vo
oo
VD (M O OO
CMooo
/oo
Figure 22. Concentrations of Trend 2 linear features - subset N. 61°-70° E. (61-70). Annotated lineaments include all of those lineaments derived from all Trend 2 linear features.

/
\_ __ _ __ __^& ::r__41: 0:00 -f
40:30:00
40: 0:00
39:30:00
so
o o
VD
o o oo
(M O Oo
5b
_L I L
loo
Figure 23. Concentrations of Trend 2 linear features - subset N. 71°-80° E. (71-80). Annotated lineaments include all of those lineaments derived from all Trend 2 linear features.

\\\
41: 0:00
40:30:00
40: 0:00
39:30:00
SO
Oo
so CM O
oo OoSo
Ooloo
Figure 24. Concentrations of Trend 2 linear features - subset N. 81°-89° E. (81-89). Annotated lineaments include all of those lineaments derived from all Trend 2 linear features.

So too
Figure 25. Lineaments derived from linear features analysis (dashed lines are weaker lineaments).

I I L
1/*""^7 P*Jeo»oic acidic plwfaiic rocks
/' \ Circular
^^-* Llmanific bedrock
Figure 26. Exploration guides for uranium derived from Landsat images