land use and land management risks to water quality in ... · land use and land management risks to...
TRANSCRIPT

Land use and land management risks to water quality
in Southland
April 2010
Land use and land management risks to water quality in Southland
Report prepared for Environment Southland
April 2010
R M Monaghan, A Semadeni-Davies, R W Muirhead, S Elliott and U Shankar
DISCLAIMER: While all reasonable endeavour has been made to ensure the accuracy of the investigations and the information contained in this report, AgResearch expressly disclaims any and all liabilities contingent or otherwise that may arise from the use of the information.
COPYRIGHT: All rights are reserved worldwide. No part of this publication may be copied, photocopied, reproduced, translated, stored in a retrieval system, or transmitted in any form or by any means, electronic, mechanical, photocopying, recording, or otherwise, without the prior written permission of AgResearch Ltd.
Report prepared for Environment Southland April 2010 Land Use and land management risks to water quality in Southland i
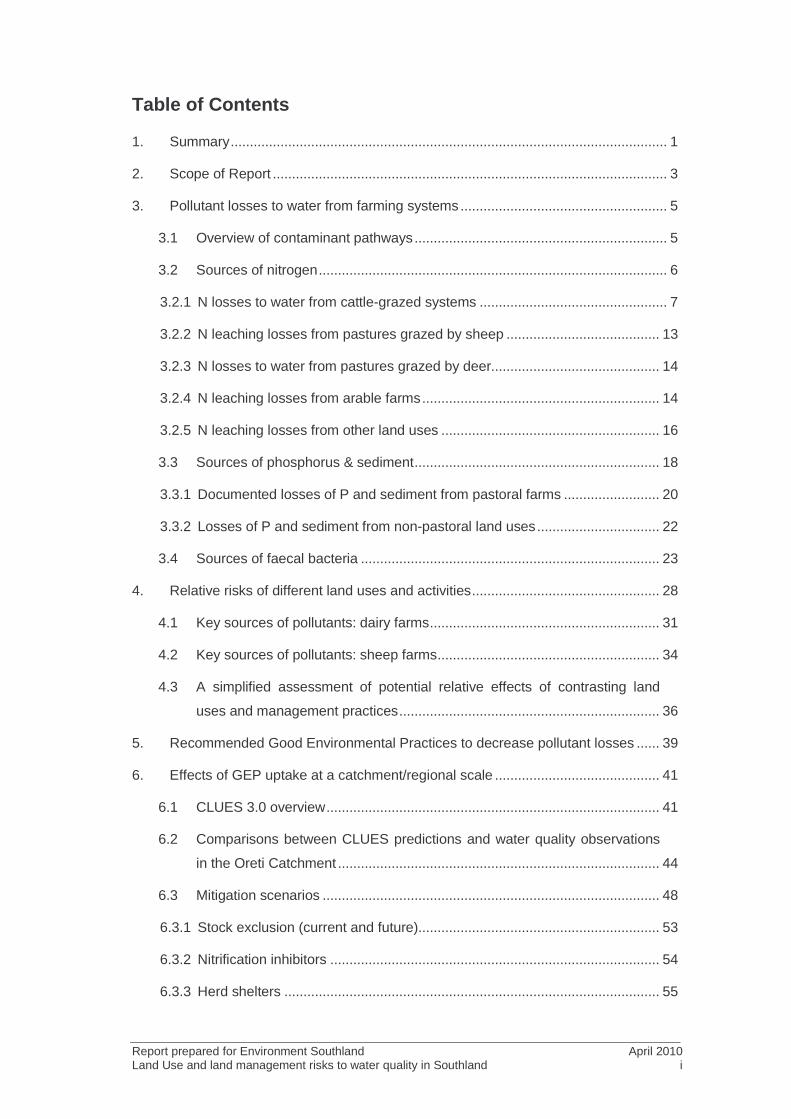
Table of Contents
1.� Summary .................................................................................................................. 1�
2.� Scope of Report ....................................................................................................... 3�
3.� Pollutant losses to water from farming systems ...................................................... 5�
3.1� Overview of contaminant pathways .................................................................. 5�
3.2� Sources of nitrogen ........................................................................................... 6�
3.2.1� N losses to water from cattle-grazed systems ................................................. 7�
3.2.2� N leaching losses from pastures grazed by sheep ........................................ 13�
3.2.3� N losses to water from pastures grazed by deer............................................ 14�
3.2.4� N leaching losses from arable farms .............................................................. 14�
3.2.5� N leaching losses from other land uses ......................................................... 16�
3.3� Sources of phosphorus & sediment ................................................................ 18�
3.3.1� Documented losses of P and sediment from pastoral farms ......................... 20�
3.3.2� Losses of P and sediment from non-pastoral land uses ................................ 22�
3.4� Sources of faecal bacteria .............................................................................. 23�
4.� Relative risks of different land uses and activities ................................................. 28�
4.1� Key sources of pollutants: dairy farms ............................................................ 31�
4.2� Key sources of pollutants: sheep farms .......................................................... 34�
4.3� A simplified assessment of potential relative effects of contrasting land
uses and management practices .................................................................... 36�
5.� Recommended Good Environmental Practices to decrease pollutant losses ...... 39�
6.� Effects of GEP uptake at a catchment/regional scale ........................................... 41�
6.1� CLUES 3.0 overview ....................................................................................... 41�
6.2� Comparisons between CLUES predictions and water quality observations
in the Oreti Catchment .................................................................................... 44�
6.3� Mitigation scenarios ........................................................................................ 48�
6.3.1� Stock exclusion (current and future)............................................................... 53�
6.3.2� Nitrification inhibitors ...................................................................................... 54�
6.3.3� Herd shelters .................................................................................................. 55�
Report prepared for Environment Southland April 2010 Land Use and land management risks to water quality in Southland ii
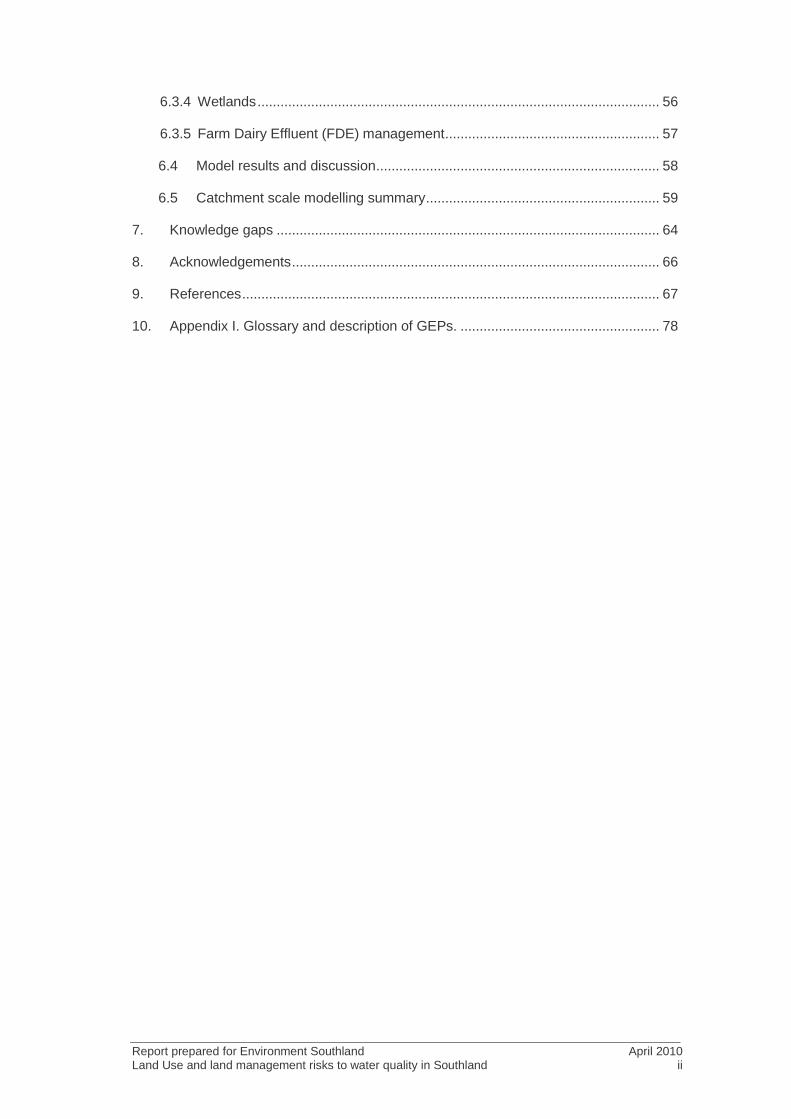
6.3.4�Wetlands ......................................................................................................... 56�
6.3.5� Farm Dairy Effluent (FDE) management ........................................................ 57�
6.4� Model results and discussion .......................................................................... 58�
6.5� Catchment scale modelling summary ............................................................. 59�
7.� Knowledge gaps .................................................................................................... 64�
8.� Acknowledgements ................................................................................................ 66�
9.� References ............................................................................................................. 67�
10.� Appendix I. Glossary and description of GEPs. .................................................... 78�
Prepared for Environment Southland April 2010 Land use and land management risks to water quality in Southland 1
1. Summary
This review documents some of the effects of agricultural land use practices on water
quality in Southland. This forms one of the information summaries that Environment
Southland have requested as they prepare their Discharge Plan that will address
discharges to land and the cumulative effects of intensive land use. In this report we (i)
review the scientific literature and findings from on-going experimental trials that
examine losses of the four contaminants specifically identified in Environment
Southland's Water Plan (N, P, sediment and faecal micro-organisms), (ii) provide a
comparative assessment of the relative risks of contaminant loss from different farming
and management systems, (iii) provide an assessment of the cost, effectiveness and
cost-effectiveness of some of the most promising Good Environmental Management
Practices (GEPs) to mitigate the effects of farming on water quality, and (iv) make an
assessment of the potential of some of the most cost-effective GEPs for improving water
quality at a catchment scale, using the Oreti catchment as a case study example.
Research trials clearly show that subsurface drainage is the main pathway of N transfers
from agricultural land to water, with nitrate accounting for between 80-90% of the
dissolved N discharged in drainage. A review of the scientific literature indicates that
nitrate leaching losses from dairy pastures are greater than from sheep or deer,
although the actual amounts of N leached vary considerably depending on soil, climate
and management factors (refer Tables 3.1-3.3 and Figure 4.1). For equivalent N inputs
and cattle stocking rates, drainage N losses from free-draining soils tend to be greater
than from poorly drained soils, due to greater soil denitrification rates in poorly drained
soils. Grazed winter forage crops have been identified as having relatively large N
leaching losses on a per hectare basis and are the subject of on-going research.
Cropping systems also show a large potential to lose nitrate-N in drainage, although
adherence to some key GEPs can greatly decrease these losses. In the case of P,
sediment and faecal micro-organisms, additional pathways and sources contribute
losses to water such as artificial subsurface drainage, overland flow and direct
deposition. The yields of P, sediment and faecal micro-organisms discharged from land
to water vary considerably depending on soil, climate and management factors.
However, the variability introduced by these factors tends to obscure any obvious land
use effects (refer Figure 3.2). Models are therefore important tools to account for
variation in resources (soil, slope, rainfall) and management (e.g. nutrient inputs, FDE
management, riparian protection) and thereby estimate nutrient and microbial losses
from different farming systems.
Report prepared for Environment Southland April 2010 Land Use and land management risks to water quality in Southland 2
Because individual contaminants have different sources and transport pathways, no
single mitigation action can effectively decrease the losses of all contaminants at the
same time, but some can have multiple benefits. Mitigations to decrease N losses need
to target animal urine patches (nitrification inhibitors, off-paddock wintering) which are
identified as the key source of N leached from grazed pastures. For cropping systems,
some of the key management practices that have been shown to minimise N leaching
are the use of cover crops, ensuring fertilization rates are matched to crop demand (and
applications avoid periods of high leaching), avoiding late summer/early autumn
cultivation of pastures and using minimum tillage techniques. Management practices to
decrease P and E. coli losses from pastoral land uses need to target stream fencing and
the improved management of farm dairy effluent. Fortunately, many of the mitigation
practices identified in this report will have multiple benefits. For example, in addition to
significantly decreasing direct inputs of faecal P to streams, stream fencing will also
decrease direct inputs of E. coli and N. Other benefits, such as protecting stream and
riparian habitats from the harmful effects of bed and bank erosion due to animal
treading, will also be incurred. However, it is also acknowledged that “best practice” in
terms of on-farm management can only minimise losses to a point that is dependent on
land use and soil and landscape features. Due to difficult-to-control pathways such as
artificial drainage networks and/or large volumes of overland flow, contaminant losses to
water from farms located on heavy soil types are likely to remain relatively high.
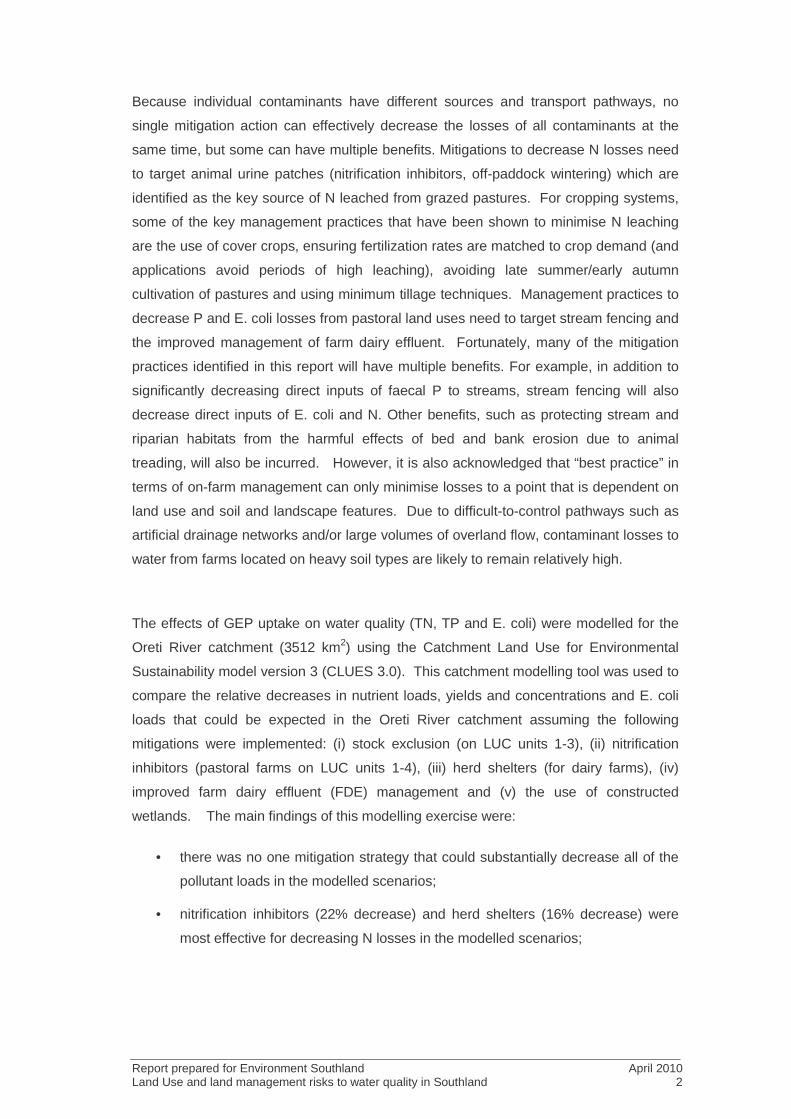
The effects of GEP uptake on water quality (TN, TP and E. coli) were modelled for the
Oreti River catchment (3512 km2) using the Catchment Land Use for Environmental
Sustainability model version 3 (CLUES 3.0). This catchment modelling tool was used to
compare the relative decreases in nutrient loads, yields and concentrations and E. coli
loads that could be expected in the Oreti River catchment assuming the following
mitigations were implemented: (i) stock exclusion (on LUC units 1-3), (ii) nitrification
inhibitors (pastoral farms on LUC units 1-4), (iii) herd shelters (for dairy farms), (iv)
improved farm dairy effluent (FDE) management and (v) the use of constructed
wetlands. The main findings of this modelling exercise were:
• there was no one mitigation strategy that could substantially decrease all of the
pollutant loads in the modelled scenarios;
• nitrification inhibitors (22% decrease) and herd shelters (16% decrease) were
most effective for decreasing N losses in the modelled scenarios;
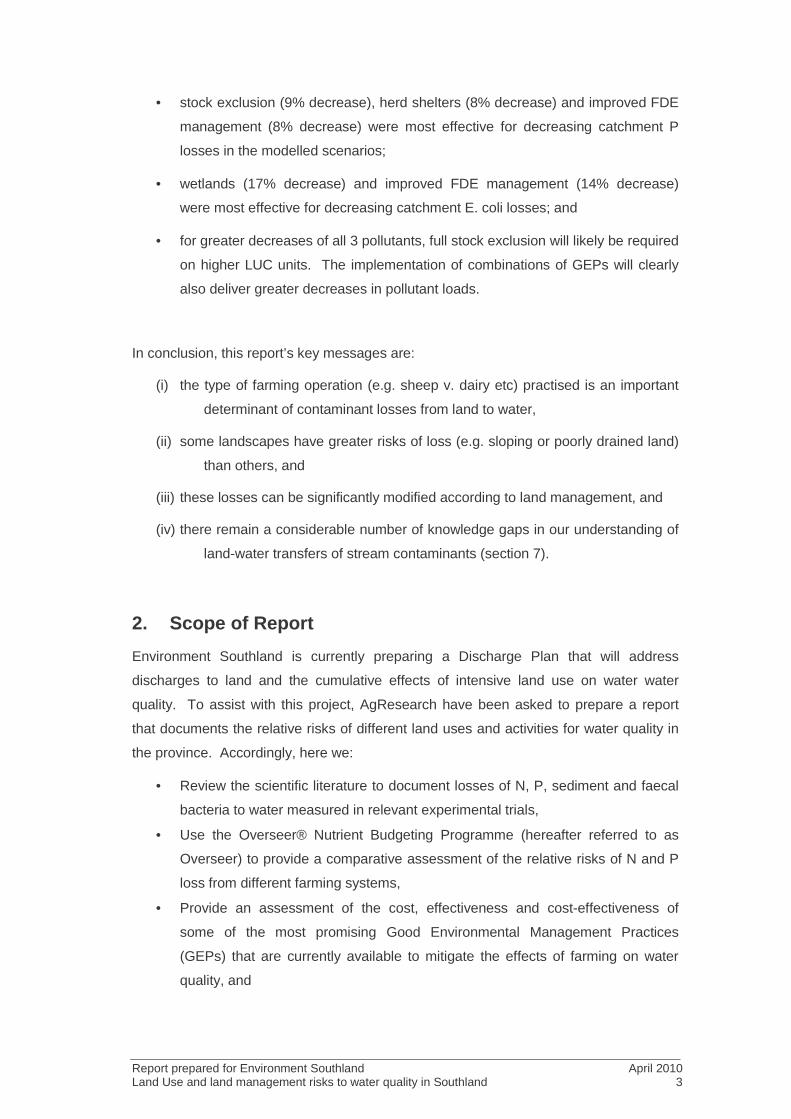
Report prepared for Environment Southland April 2010 Land Use and land management risks to water quality in Southland 3
• stock exclusion (9% decrease), herd shelters (8% decrease) and improved FDE
management (8% decrease) were most effective for decreasing catchment P
losses in the modelled scenarios;
• wetlands (17% decrease) and improved FDE management (14% decrease)
were most effective for decreasing catchment E. coli losses; and
• for greater decreases of all 3 pollutants, full stock exclusion will likely be required
on higher LUC units. The implementation of combinations of GEPs will clearly
also deliver greater decreases in pollutant loads.
In conclusion, this report’s key messages are:
(i) the type of farming operation (e.g. sheep v. dairy etc) practised is an important
determinant of contaminant losses from land to water,
(ii) some landscapes have greater risks of loss (e.g. sloping or poorly drained land)
than others, and
(iii) these losses can be significantly modified according to land management, and
(iv) there remain a considerable number of knowledge gaps in our understanding of
land-water transfers of stream contaminants (section 7).
2. Scope of Report
Environment Southland is currently preparing a Discharge Plan that will address
discharges to land and the cumulative effects of intensive land use on water water
quality. To assist with this project, AgResearch have been asked to prepare a report
that documents the relative risks of different land uses and activities for water quality in
the province. Accordingly, here we:
• Review the scientific literature to document losses of N, P, sediment and faecal
bacteria to water measured in relevant experimental trials,
• Use the Overseer® Nutrient Budgeting Programme (hereafter referred to as
Overseer) to provide a comparative assessment of the relative risks of N and P
loss from different farming systems,
• Provide an assessment of the cost, effectiveness and cost-effectiveness of
some of the most promising Good Environmental Management Practices
(GEPs) that are currently available to mitigate the effects of farming on water
quality, and
Report prepared for Environment Southland April 2010 Land Use and land management risks to water quality in Southland 4
• Make an assessment of the potential of some of the most cost-effective GEPs
for improving water quality at a catchment and regional scale.
Although the context of this report is the Southland province, research information from
other relevant parts of the country is drawn upon where necessary to fill some key
knowledge gaps.
This report is focused solely on agricultural non-point source discharges and does not
address other potential sources of contaminants in the rural environment e.g. industrial
discharges (e.g. whey), septic tanks, large colonies of wildfowl, etc.
List of abbreviations used:
cfu – colony forming units; MPN – most probable number
CLUES – Catchment Land Use and Environmental Sustainability
CSA – critical source area
DCD – dicyandiamide (a nitrification inhibitor)
E. coli – Escherichia coli, often used as an indicator of faecal pollution.
FDE – Farm dairy effluent
FMOs – faecal microorganisms
LUC – Land Use Capability
N – nitrogen; TN – total N; DON – dissolved organic N
P – phosphorus; TP – total phosphorus; DRP – dissolved reactive phosphorus
REC – river environment classification
SU/ha – stock units per hectare
FDE (Farm Dairy Effluent) - The wash-down water collected from the dairy farm milking
parlour and holding yard.
GEPs - Good Environmental Practices. This termed is used to refer to management
practices that deliver environmental benefit. This term is favoured above “Best
Management Practice” (BMP) because “Best” implies better than others; in practice,
often there are a number of management practices that can achieve good environmental
outcomes. And “best” today may potentially be unsuitable in the future. A case in point
is the 2-pond effluent treatment system promoted in the 1980s: although it represented a
step forward in the management of FDE at the time, we now recognise that further
Report prepared for Environment Southland April 2010 Land Use and land management risks to water quality in Southland 5
improvements in FDE management can be achieved through the use of appropriate land
application systems. Some of the GEPs of most relevance to Southland are described
in Appendix I.
3. Pollutant losses to water from farming systems
3.1 Overview of contaminant pathways
For clarity, described below are the key pathways and terms used to describe the
transfer of pollutants from land to water (and are shown pictorially in Figure 3.1):
Runoff – the term used to describe that part of precipitation which ends up in streams or
lakes (i.e. the combined flow of surface water, subsurface drainage and groundwater
pathways, but not deep drainage).
Overland flow (or surface runoff). That part of precipitation which flows overland to
streams or directly to lakes. Overland flow is typically enriched in P (dissolved and
particulate forms), sediment, faecal bacteria and ammonium-N, but little nitrate-N.
Subsurface flow (or drainage). That part of precipitation which infiltrates the soil and
moves to streams or lakes as ephemeral, shallow, perched or ground water flow. In
contrast to overland flow, subsurface drainage is usually the dominant pathway involved
in the transfer of mobile pollutants such as nitrate from soil to water. In agricultural
landscapes, the downward movement (or leaching) of subsurface flow can be
intercepted by artificial drainage systems such as mole-pipe drains. Much local and
international research has documented how this artificial drainage pathway can also
deliver significant quantities of less mobile pollutants such as P, sediment and faecal
bacteria to surface waters. Preferential flow through macropores to mole-pipe systems
are attributes that allow these soil-water transfers to occur.
Variable (or Critical) Source Areas - it is recognised that many of the less mobile stream
pollutants such as P, sediment, ammonium-N and faecal bacteria are not sourced from
the entire catchment but instead from smaller areas within a catchment. The dominance
of these small areas, often also termed critical source areas (CSAs), is dependent upon
many factors, including soil type, topography, management (e.g., inputs of fertiliser and
manure) and transport processes that are in turn dependent upon environmental and
hydrological conditions. The interaction between these factors is complex and varies
spatially and temporally. However, in general, CSAs are defined by a high concentration
of pollutant available to flow and a high potential for flow, equating to a high potential for
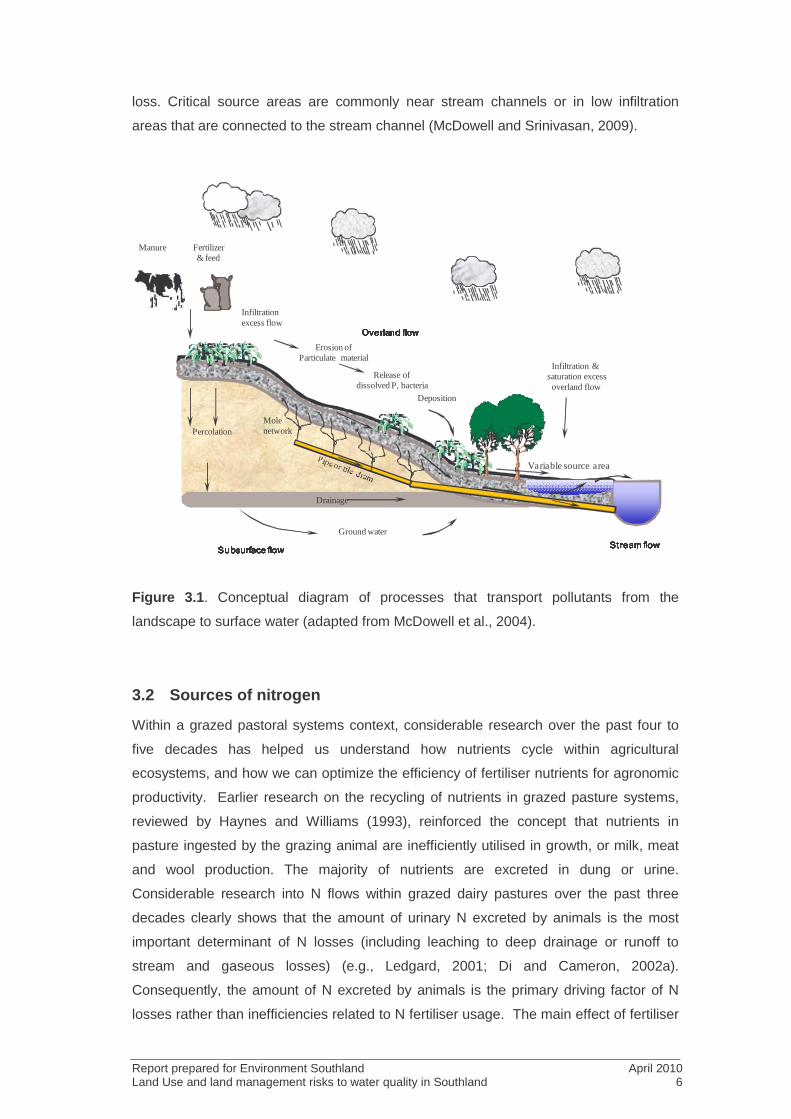
Report prepared for Environment Southland April 2010 Land Use and land management risks to water quality in Southland 6
loss. Critical source areas are commonly near stream channels or in low infiltration
areas that are connected to the stream channel (McDowell and Srinivasan, 2009).
Drainage
Ground water
Release ofdissolved P, bacteria
Fertilizer& feed
Percolation
� � � � � � � � � � � �� � � � � � � � � � � �� � � � � � � � � � � �� � � � � � � � � � � �
� � � � � � � �� � � � � � � �� � � � � � � �� � � � � � � �
Manure
Erosion ofParticulate material
Deposition
Infiltrationexcess flow
Variable source area
Infiltration & saturation excessoverland flow
� � � � � � � �� � � � � � � �� � � � � � � �� � � � � � � �
Mole network
Figure 3.1. Conceptual diagram of processes that transport pollutants from the
landscape to surface water (adapted from McDowell et al., 2004).
3.2 Sources of nitrogen
Within a grazed pastoral systems context, considerable research over the past four to
five decades has helped us understand how nutrients cycle within agricultural
ecosystems, and how we can optimize the efficiency of fertiliser nutrients for agronomic
productivity. Earlier research on the recycling of nutrients in grazed pasture systems,
reviewed by Haynes and Williams (1993), reinforced the concept that nutrients in
pasture ingested by the grazing animal are inefficiently utilised in growth, or milk, meat
and wool production. The majority of nutrients are excreted in dung or urine.
Considerable research into N flows within grazed dairy pastures over the past three
decades clearly shows that the amount of urinary N excreted by animals is the most
important determinant of N losses (including leaching to deep drainage or runoff to
stream and gaseous losses) (e.g., Ledgard, 2001; Di and Cameron, 2002a).
Consequently, the amount of N excreted by animals is the primary driving factor of N
losses rather than inefficiencies related to N fertiliser usage. The main effect of fertiliser
Report prepared for Environment Southland April 2010 Land Use and land management risks to water quality in Southland 7
N use on N cycling efficiency in grazed pastures is therefore indirect, with N fertiliser
inputs, which allow for an increase in pasture production and animal stocking rate, also
increasing urine N excretion. A variety of studies have quantified the potential for N in
urine to leach through pasture soils (e.g. Fraser et al. 1994). The timing of urine
deposition strongly influences the potential for urine N to leach through pasture soils,
with large losses typically observed for urine deposited shortly prior to the on-set of
drainage. For clover-based dairy pastures, nitrogen fertiliser is generally not a major
direct source of N loss, as it is applied in relatively low rates and used strategically to
supplement N supply from biological N fixation (Ledgard et al., 1999a; Monaghan et al.,
2005; Di and Cameron, 2002b). Soil type exerts a considerable influence on the amount
of nitrate-N leached from the soil profile, with greater losses observed for shallow stony
soils compared to heavier-textured and/or poorly drained soils where a proportionally
greater amount of soil nitrate is removed via denitrification processes (Scholefield et al.,
1993).
Other non-pastoral land uses such as cropping and horticulture are also recognised as
potentially significant sources of N losses to water. Their potential importance is also
briefly described in sections 3.2.4 and 3.2.5 below.
3.2.1 N losses to water from cattle-grazed systems
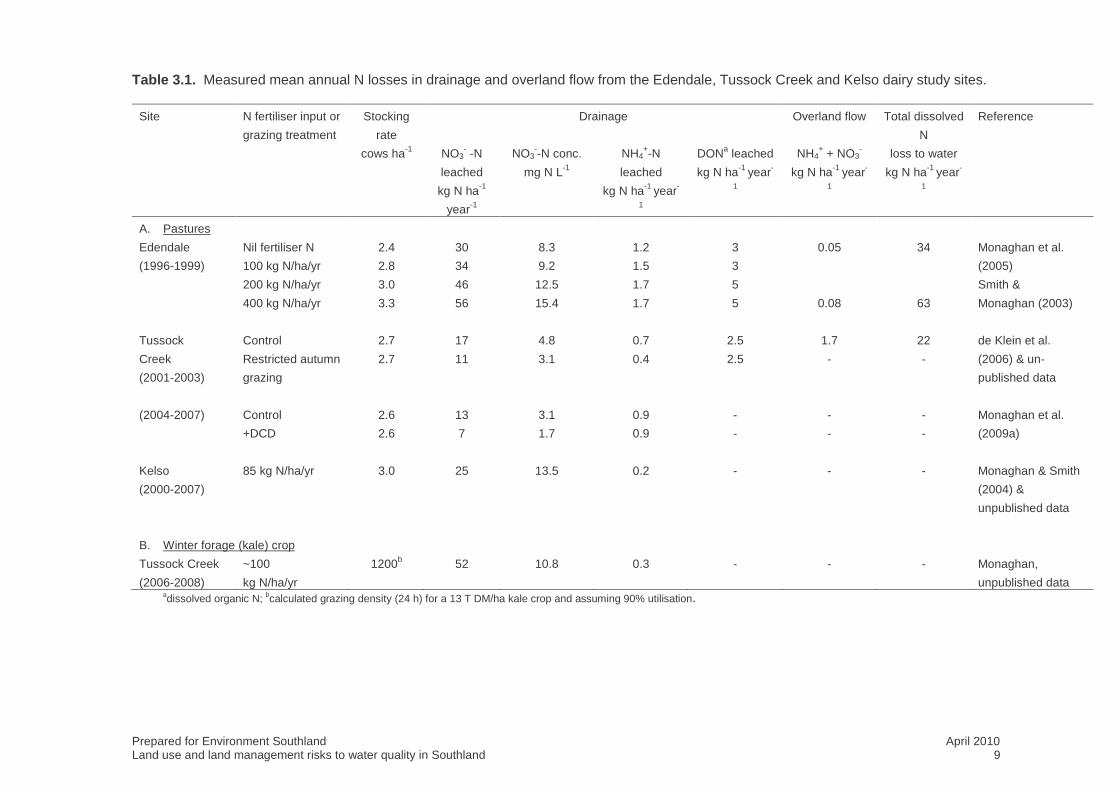
There are 3 key dairy experimental sites examining nutrient losses to water that are of
particular relevance to Southland: Edendale, Tussock Creek and Kelso. Although the
latter is located in West Otago, it has a mole-pipe drained Pallic soil that is similar to
many of those now used for dairy farming in Southland. Measured N losses from each
of these multi-year trials under dairy grazing management are documented in Table 3.1.
Some of the key points to note are:
• Nitrate-N represented between 80-90% of the dissolved N measured in drainage
at the Edendale and Tussock Creek sites. Ammonium-N (3-4%) and dissolved
organic N (8-10%) fractions were much smaller proportions of the total
drainage N loads.
• Overland flow was not a major source of dissolved N exiting the Edendale (<1%
of runoff N flux) or Tussock Creek (<10% of runoff N flux) sites.
• For equivalent N inputs and cattle stocking rates, drainage N losses from the
more freely drained Edendale site (Woodlands-Waikoikoi soils) were greater
than from the poorly drained Tussock Creek site (Pukemutu soil), most likely
reflecting the greater soil denitrification rates in the Pukemutu soil.
Report prepared for Environment Southland April 2010 Land Use and land management risks to water quality in Southland 8
• Mean nitrate-N concentrations in drainage waters exceeded 10 mg L-1 at the
Kelso site (10.8 mg L-1), and at the Edendale site for the treatments where
annual N fertiliser inputs were 200 kg N ha-1year-1 or greater, and for the
“grazed” winter forage (kale) site.
The large nitrate leaching losses of 52 kg N ha-1 year-1 recorded from the winter forage
crop trial arise due to (i) relatively large amounts of mineral N remaining in the soil in late
autumn following pasture cultivation and forage crop establishment the preceding
spring, and (ii) the deposition of much excretal N onto the grazed forage crop during
winter when plant uptake is low. These losses are high relative to those measured
under pasture and make a disproportionately large contribution to total dairy system
losses, considering winter forage crops commonly make up 10-20% of farm area. The
application of DCD had no significant effect on decreasing N leaching losses from
grazed winter forage crops at the Southland site (data not shown). In Southland, winter
grazing forms part of the pasture renewal cycle where a fraction of the farm goes into a
‘break crop’ for two or three years each time pasture is renewed. This cycle results in
the following sequence of activities:
(i) Spray off/plough in pasture
(ii) Establish crop (essentially a vegetable crop);
(iii) Graze crop in winter (intensive break feeding over winter);
(iv) Fallow until spring (remaining nutrients lost from topsoil)
(v) Re-establish crop and repeat from (ii).
Thus ‘winter grazing’ is a combination of activities that all have some degree of
associated risk. Unfortunately there is only a small amount of data available to better
define these risks.
Leaching losses have also been reported for a number of other dairy grazing field
studies undertaken elsewhere in NZ. Many of these have been reviewed by others (e.g.
Figure 3.2 and Table 1 in McDowell & Wilcock, 2008) and only some of the details are
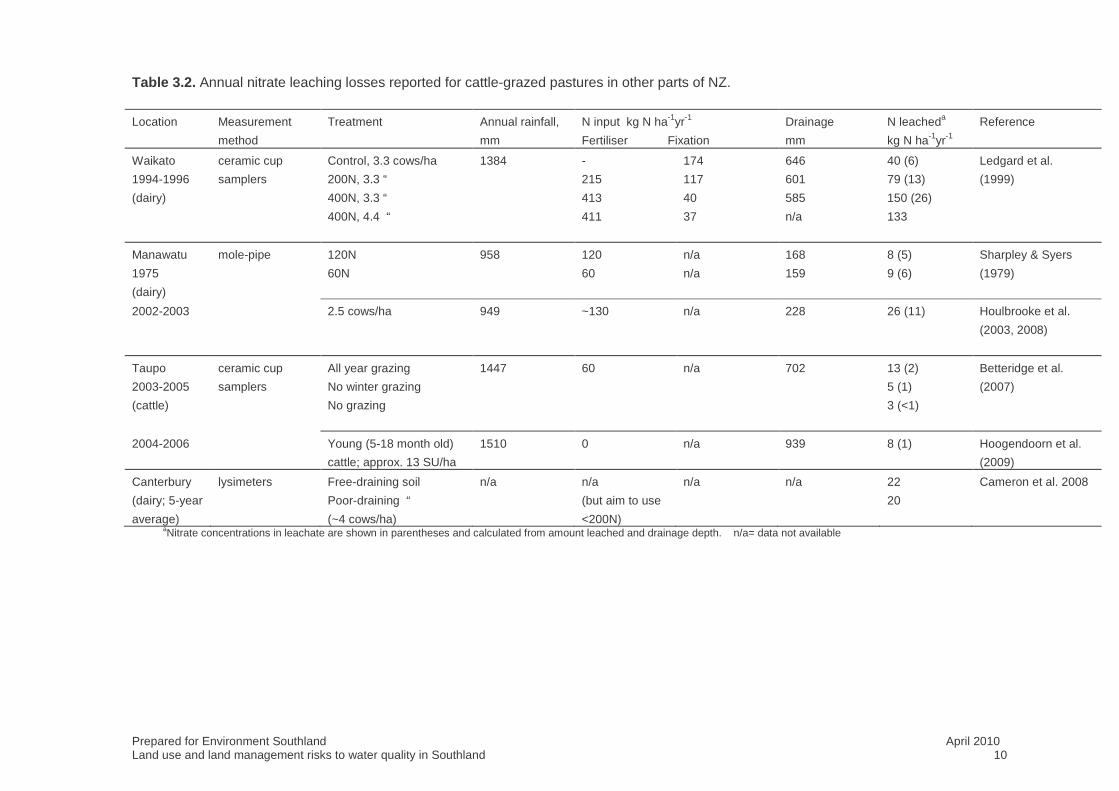
reproduced here in Table 3.2. It is important to distinguish between published studies
that report annual nitrate losses under a range of field treatments, and those that
examine in detail the processes responsible for the leaching of nitrate-N from soil . The
latter are important for helping us to understand some of the key drivers affecting soil
processes and leaching rates, but care should be taken when extrapolating lab or small
plot scales studies to losses at field and farm scales. Results reported in Tables 3.1 and
3.2 are from grazing systems studies and thus come closest to representing what would
occur on equivalent commercial farms.
Prepared for Environment Southland April 2010 Land use and land management risks to water quality in Southland 9
Table 3.1. Measured mean annual N losses in drainage and overland flow from the Edendale, Tussock Creek and Kelso dairy study sites.
Site N fertiliser input or
grazing treatment
Stocking
rate
Drainage Overland flow Total dissolved
N
Reference
cows ha-1 NO3- -N
leached
kg N ha-1
year-1
NO3--N conc.
mg N L-1
NH4+-N
leached
kg N ha-1 year-
1
DONa leached
kg N ha-1 year-
1
NH4+ + NO3
-
kg N ha-1 year-
1
loss to water
kg N ha-1 year-
1
A. Pastures
Edendale Nil fertiliser N 2.4 30 8.3 1.2 3 0.05 34 Monaghan et al.
(1996-1999) 100 kg N/ha/yr 2.8 34 9.2 1.5 3 (2005)
200 kg N/ha/yr 3.0 46 12.5 1.7 5 Smith &
400 kg N/ha/yr 3.3 56 15.4 1.7 5 0.08 63 Monaghan (2003)
Tussock Control 2.7 17 4.8 0.7 2.5 1.7 22 de Klein et al.
Creek
(2001-2003)
Restricted autumn
grazing
2.7 11 3.1 0.4 2.5 - - (2006) & un-
published data
(2004-2007) Control 2.6 13 3.1 0.9 - - - Monaghan et al.
+DCD 2.6 7 1.7 0.9 - - - (2009a)
Kelso
(2000-2007)
85 kg N/ha/yr 3.0 25 13.5 0.2 - - - Monaghan & Smith
(2004) &
unpublished data
B. Winter forage (kale) crop
Tussock Creek
(2006-2008)
~100
kg N/ha/yr
1200b 52 10.8 0.3 - - - Monaghan,
unpublished data adissolved organic N; bcalculated grazing density (24 h) for a 13 T DM/ha kale crop and assuming 90% utilisation.
Prepared for Environment Southland April 2010 Land use and land management risks to water quality in Southland 10
Table 3.2. Annual nitrate leaching losses reported for cattle-grazed pastures in other parts of NZ. Location Measurement
method
Treatment Annual rainfall,
mm
N input kg N ha-1yr-1
Fertiliser Fixation
Drainage
mm
N leacheda
kg N ha-1yr-1
Reference
Waikato
1994-1996
(dairy)
ceramic cup
samplers
Control, 3.3 cows/ha
200N, 3.3 “
400N, 3.3 “
400N, 4.4 “
1384 -
215
413
411
174
117
40
37
646
601
585
n/a
40 (6)
79 (13)
150 (26)
133
Ledgard et al.
(1999)
Manawatu
1975
(dairy)
mole-pipe 120N
60N
958 120
60
n/a
n/a
168
159
8 (5)
9 (6)
Sharpley & Syers
(1979)
2002-2003 2.5 cows/ha 949 ~130 n/a 228 26 (11) Houlbrooke et al.
(2003, 2008)
Taupo
2003-2005
(cattle)
ceramic cup
samplers
All year grazing
No winter grazing
No grazing
1447 60 n/a 702 13 (2)
5 (1)
3 (<1)
Betteridge et al.
(2007)
2004-2006 Young (5-18 month old)
cattle; approx. 13 SU/ha
1510 0 n/a 939 8 (1) Hoogendoorn et al.
(2009)
Canterbury
(dairy; 5-year
average)
lysimeters Free-draining soil
Poor-draining “
(~4 cows/ha)
n/a n/a
(but aim to use
<200N)
n/a n/a 22
20
Cameron et al. 2008
aNitrate concentrations in leachate are shown in parentheses and calculated from amount leached and drainage depth. n/a= data not available
Prepared for Environment Southland April 2010 Land use and land management risks to water quality in Southland 11
Table 3.3. Annual nitrate leaching losses reported for sheep-grazed pastures in NZ.
Location Measurement
method
Treatment Annual rainfall
mm
N input as
Fertiliser Fixation
kg N ha-1yr-1 kg N ha-1 yr-1
Drainage
mm
Nitrate leacheda
kg N ha-1 yr-1
Reference
Taupo ceramic cups 5-18 month old
stock; approx. 15
SU
1510 0 n/a 939 8 (<1) Hoogendoorn et al.
(2009)
Manawatu
1990
cores Grass/clover
Herbal ley
Grass +400N
1040b -
-
400
144
152
0
270 6 (2)
7 (3)
41 (15)
Ruz-Jerez et al.
(1995)
Manawatu
1988
1989
mole-pipe SSP-S
Elemental S
SSP-S
Elemental S
1088
837
-
-
50
50
n/a
n/a
n/a
n/a
304
257
120
100
13 (4)
9 (4)
19 (16)
15 (15)
Heng et al.
(1991)
1990 Control
120N
1014 -
120
n/a
n/a
266
236
35 (13)
43 (18)
Magesan et al.
(1994)
1991 Paddock A
Paddock B
1007 -
-
n/a
n/a
339
300
23 (7)
17 (6)
Magesan et al.
(1996)
Manawatu mole-pipe Grazed +irrig.
Grazed, -irrig.
Ungrazed, +irrig.
Ungrazed, -irrig.
958b -
-
-
-
n/a
n/a
n/a
n/a
403
318
340
216
28 (7)
7 (2)
3 (<1)
3 (1)
Turner et al.
(1979)
Manawatu lysimeters Nil PS, 0N
Nil PS, 300N
34P, 41S, 0N
34P, 41S, 300N
1290 0
300
0
300
27
8
87
10
589 6c
18c
24c
114c
Parfitt et al. (2009)
Canterbury cores lightly-grazed
pasture
660 - n/a n/a 5 Adams & Pattinson
(1984) aNitrate concentrations in leachate are shown in parentheses and calculated from amount leached and drainage depth; bfrom NIWA records; cincludes dissolved organic N
Prepared for Environment Southland April 2010 Land use and land management risks to water quality in Southland 12
Table 3.4. Annual P and sediment losses in drainage, overland flow or stream flow from some grazed pastures/cropland and catchments in NZ; results from additional studies are also documented in McDowell & Wilcock (2008).
Site Region Main treatment TP loss DRP loss Sediment loss Reference
kg P ha-1 year-1 kg P ha-1 year-1 kg ha-1 year-1
Paddock losses
Edendale Southland aDrained, nil N 0.37 0.12 nd Monaghan et al.
(1996-1999) (cattle) aDrained, 400N 0.29 0.10 nd (2005); Smith &
bUn-drained, nil N 0.09 0.03 nd Monaghan (2003)
bUn-drained, 400N 0.23 0.06 nd
Tussock Creek Southland aDrained 0.85 0.39 86 Monaghan, un-published
(2000-2003) (dairy) bUn-drained 0.53 0.22 47 data
Kelso Otago cControl 0.20 0.02 7 Monaghan & Smith (2004) &
McDowell et al. (2005) (2000-2003) (dairy) cEffluent-treated 0.41 0.05 7
Windsor Otago b,dCattle winter crop 0.71 0.23 330 McDowell & Houlbrooke
b,dSheep winter crop b,dSheep pasture
0.47
0.31
0.14
0.17
180
32
(2008)
Lumsden Southland bDeer winter crop 2 0.13 1,012 McDowell & Stevens (2008)
Catchment yields
Bog Burn Southland Mixed landuse catchment 0.43 0.23 58 Monaghan et al. (2007)
Oteramika Southland Mixed landuse catchment 0.85 Nd 237 Thorrold et al. (1998)
Waikakahi Canterbury Predominantly dairy 0.83 0.56 46 Monaghan et al. (2009b)
Inchbonnie Westland Dairy 5.02 2.27 883 Wilcock et al. (2007)
Waiokura Taranaki Dairy 0.86 0.20 190 Wilcock et al. (2007)
Toenepi Waikato Predominantly dairy 0.93 0.35 53 Wilcock et al. (2007)
Glenomaru Southland Deer 0.21 0.03 88 McDowell (2009a)
Waimea Southland Deer 0.22 0.04 11 McDowell (2009a)
Telford Otago Deer 3.0 0.04 3,940 McDowell (2009b)
Deer (wallows removed) 0.22 0.02 1,560 McDowell (2009b)
Invermay Otago Deer 0.8 0.03 4,480 McDowell (2007) acombined losses in mole-pipe drainage and overland flow; boverland flow losses only; cmole-pipe drainage losses only; dexpressed as approximate annual losses
Prepared for Environment Southland April 2010 Land use and land management risks to water quality in Southland 13
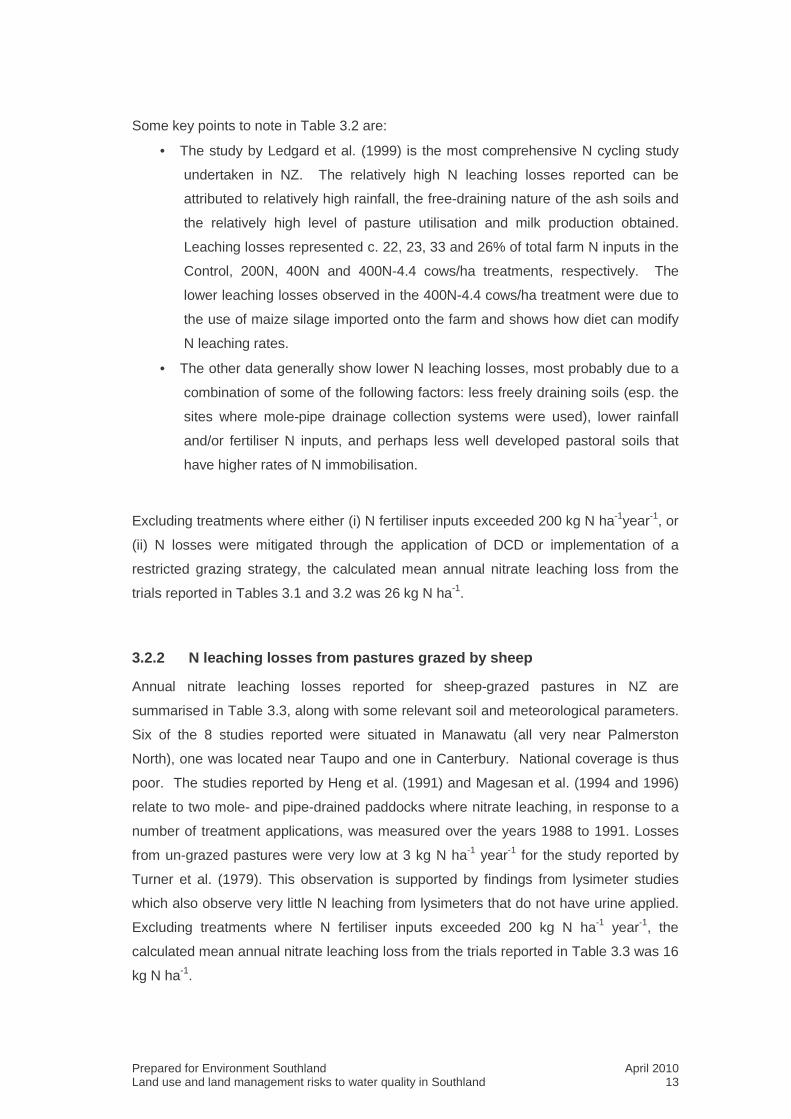
Some key points to note in Table 3.2 are:
• The study by Ledgard et al. (1999) is the most comprehensive N cycling study
undertaken in NZ. The relatively high N leaching losses reported can be
attributed to relatively high rainfall, the free-draining nature of the ash soils and
the relatively high level of pasture utilisation and milk production obtained.
Leaching losses represented c. 22, 23, 33 and 26% of total farm N inputs in the
Control, 200N, 400N and 400N-4.4 cows/ha treatments, respectively. The
lower leaching losses observed in the 400N-4.4 cows/ha treatment were due to
the use of maize silage imported onto the farm and shows how diet can modify
N leaching rates.
• The other data generally show lower N leaching losses, most probably due to a
combination of some of the following factors: less freely draining soils (esp. the
sites where mole-pipe drainage collection systems were used), lower rainfall
and/or fertiliser N inputs, and perhaps less well developed pastoral soils that
have higher rates of N immobilisation.
Excluding treatments where either (i) N fertiliser inputs exceeded 200 kg N ha-1year-1, or
(ii) N losses were mitigated through the application of DCD or implementation of a
restricted grazing strategy, the calculated mean annual nitrate leaching loss from the
trials reported in Tables 3.1 and 3.2 was 26 kg N ha-1.
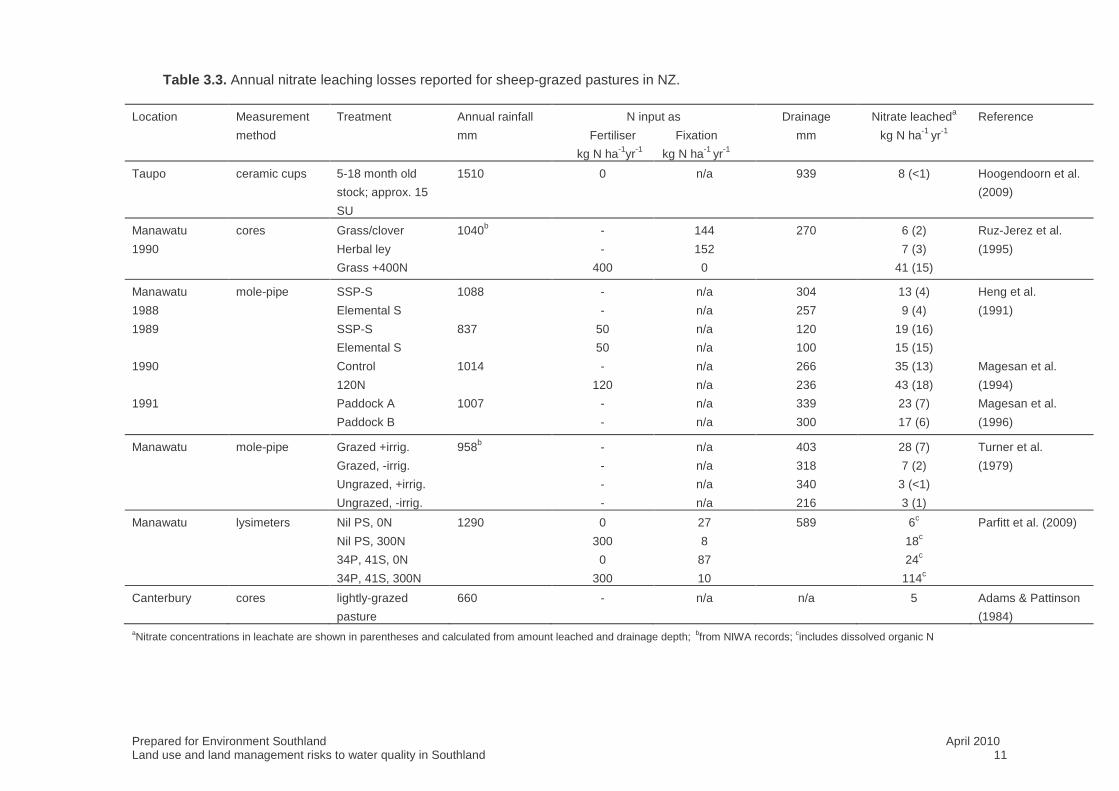
3.2.2 N leaching losses from pastures grazed by sheep
Annual nitrate leaching losses reported for sheep-grazed pastures in NZ are
summarised in Table 3.3, along with some relevant soil and meteorological parameters.
Six of the 8 studies reported were situated in Manawatu (all very near Palmerston
North), one was located near Taupo and one in Canterbury. National coverage is thus
poor. The studies reported by Heng et al. (1991) and Magesan et al. (1994 and 1996)
relate to two mole- and pipe-drained paddocks where nitrate leaching, in response to a
number of treatment applications, was measured over the years 1988 to 1991. Losses
from un-grazed pastures were very low at 3 kg N ha-1 year-1 for the study reported by
Turner et al. (1979). This observation is supported by findings from lysimeter studies
which also observe very little N leaching from lysimeters that do not have urine applied.
Excluding treatments where N fertiliser inputs exceeded 200 kg N ha-1 year-1, the
calculated mean annual nitrate leaching loss from the trials reported in Table 3.3 was 16
kg N ha-1.
Report prepared for Environment Southland April 2010 Land Use and land management risks to water quality in Southland 14
3.2.3 N losses to water from pastures grazed by deer
Nitrogen losses to water from deer pastures have been reported in publications by
McDowell & Wilcock (2008) and McDowell (2009). These document area-specific loads
for streams draining catchments (4-280 ha) located in Southland and Otago.
Unpublished data have also been collected at a deer grazing trial near Taupo (Coby
Hoogendoorn pers comm.). Reported leaching losses range between 3 and 19 kg N ha-
1 year-1. These relatively low yields of N reflect the low intensity of extensive deer
farming (but not finishing properties), which often occupies Class IV to VII land, and the
fact that N returns in deer urine are closer to those of sheep than cattle.
3.2.4 N leaching losses from arable farms
To the authors’ knowledge, most of the water quality-related research reported for
arable cropping systems focuses on N leaching losses, and to a lesser extent, sediment.
Much of this comes from research from the US and Western Europe where large parts
of the agricultural landscape may undergo frequent and intensive cultivation as part of
crop establishment. Intensive cultivation accelerates the mineralisation of soil organic N
and also requires that the land remains without growing plant cover for at least some of
the time. If these periods coincide with times of drainage, there is large potential for the
leaching of N due to the substantial amounts of mineral N that may accumulate in the
soil as a result of mineralization and/or un-used fertiliser N.
Research undertaken in Canterbury has documented N leaching losses from arable
cropping systems. Some of the pertinent points from this research are summarised
briefly below:
• Francis et al. (1992) measured N leaching losses of 78, 40 and 5 kg N ha-1
following the cultivation of a temporary leguminous pasture in March, May or
July, respectively. Similar findings reported by Francis et al. (1995a and 1995b)
also highlighted the importance of ensuring that the length of fallow period
between cultivation and the on-set of leaching is minimized as much as
possible. Indeed, in the study reported by Francis et al. (1992), delaying
cultivation of the pasture until spring did not cause any significant decrease in
wheat yield or N uptake by the following crop. Francis et al. (1995b) reported
leaching losses from the March fallow treatment ranged from 72-106 kg N ha-1.
In contrast, losses from the May fallow treatment ranged from 8-52 kg N/ha.
Report prepared for Environment Southland April 2010 Land Use and land management risks to water quality in Southland 15
• Francis et al. (1994) compared N leaching losses from fallow fields and
leguminous and non-leguminous grain crops. Leaching losses declined in the
order fallow > legumes > non-legumes (110 > 72 > 37 kg N/ha, respectively).
• A long term tillage trial, known as the Millennium Tillage Trial, found that the
presence of winter cover crops had a marked effect on N leaching losses. Over
a seven-year period (2001-2007), winter N leaching averaged 28 kg N ha-1 year-
1 under a range of different tillage practices (intensive, minimum and no-tillage)
from winter fallow soil. The presence of winter cover crops decreased this 7-
year average loss to 15 kg N ha-1 year-1 (FAR, 2008). When comparing tillage
methods, intensive tillage followed by winter fallow resulted in the highest N
leaching losses (30 kg N ha-1 year-1). However, N leaching was greatest from
no-tillage treatments when comparing soils supporting winter cover crops. This
result was thought to be due to the poor winter crop establishment on the no-
tillage plots due to slug damage.
• Thomas et al. (2005) provide some modelled estimates of N leaching losses
from “typical” cropping rotations in Canterbury. Over the whole rotation, the
average N leaching loss estimated by the Overseer model was c. 48 kg N ha-1
year-1, equivalent to about 34% of the fertiliser N applied.
• Using the GLEAMS simulation model, Lilburne et al. (2003) demonstrated the
importance of having plant uptake of N during autumn and winter months to
minimise N leaching losses under wheat production. This work also recognised
the greater N leaching risk posed by cropping on shallow soil types.
These trials and modelling analyses indicate (i) very large losses, sometimes in excess
of 100 kg N ha-1yr-1, may occur from paddocks used for cropping, and (ii) the magnitude
of N leaching loss is very dependent on climate, management and soil risk factors (e.g.
Lilburne et al. 2003). The type of crop grown and presence of winter cover crops can
also have a major influence on the amount of nitrate-N that is leached, due mainly to
variations between crops in their synchrony of N demand with supply from the soil or
fertiliser (Francis 1995; FAR 2008). Some of the key management practices that have
been shown to minimise N leaching are the use of cover crops, ensuring fertilization
rates are matched to crop demand (and applications avoid periods of high leaching),
avoiding late summer/early autumn cultivation of pastures, using minimum tillage
techniques and the application of the nitrification inhibitor DCD (Francis, 1995; Francis
et al., 1998; FAR 2008). These practices are particularly recommended for cropping on
shallow soils. On a positive note, research suggests that well-managed cropping
systems should leach relatively little nitrate-N if close attention is paid to the above
management considerations.
Report prepared for Environment Southland April 2010 Land Use and land management risks to water quality in Southland 16
3.2.5 N leaching losses from other land uses
Vegetable and bulb production
Intensive field vegetable production systems have the potential to lose very large
amounts of N via nitrate leaching. This is due to the ample quantities of fertiliser which
are often used to grow the crop and the large amounts of N that can be left behind in
crop residues. The net result is that large amounts of residual soil mineral N often
remain in the soil after harvest of the crop. There are, however, surprisingly few
published studies where direct measurement of N (or P) losses to water have been
made from such production systems.
Neeteson et al. (1999) document the amounts of residual soil mineral N left behind
following a range of vegetable crops and use a computer model to derive estimates of
nitrate-N leaching during the following winter and spring. Crops such as spinach, leeks,
celeriac and cauliflower were shown to leave large amounts of residual soil mineral N in
the soil following harvest, generally ranging between 50 and 220 kg N ha-1. Modelling
analysis suggested that subsequent leaching losses from these crops were also very
high and of a similar magnitude to the amount of soil mineral N left in the soil post-
harvest.
More locally, Francis et al. (2003) document N leaching losses from winter potato and
winter greens (spinach, cauliflower or cabbage) grown near Pukekohe. On average,
potato fields received the greatest amount of N fertiliser (481 kg N ha-1), had the
greatest soil mineral N content in June (184 kg N ha-1) and had the greatest leaching
loss (114 kg N ha-1). These leaching losses were c. 7.5-fold greater than nitrate-N
leaching losses measured on a nearby dairy farm. Losses from the winter greens were
intermediate between the potato and dairy land uses. The large leaching losses from
the winter crops were attributable to the large applications of fertiliser N before winter
and the rapid mineralisation of residues from the previous greens. The authors noted
that the measured losses from the potato and spinach crops were similar to those
measured in other studies (P.H. Williams, unpubl. data & Williams et al. 2000).
Bulb production is a growing industry in Southland. Unfortunately we have a very poor
understanding of the likely impacts of this land use activity on water quality in the
province. As for cropping systems, judicious tillage and fertiliser management practices
may be able to minimise the risks associated with this farming activity.
Report prepared for Environment Southland April 2010 Land Use and land management risks to water quality in Southland 17
Forestry
Catchment monitoring studies indicate that N leaching losses from forestry land uses
vary according to land use history, the management of the forest and the time elapsed
since planting. It is generally believed that changing land use from pasture to forestry
decreases nutrient losses from the land. Decreased fertiliser inputs, decreased rates of
nitrogen fixation and soil erosion, and removal of the grazing animal are key factors that
decrease nutrient yields from forested catchments (Quinn & Ritter 20003). Although
logging of the forest does increase nutrient yields, this effect is generally short-lived and
does not negate the benefits of decreased yields compared to pastoral land if assessed
over the life-time of the forestry rotation (i.e. planting, forest growth, logging and re-
planting) (Quinn & Ritter 2003). Evidence from recent Environment Court proceedings
concerning the effects of land use on Lake Taupo water quality provides a useful
summary of the likely N yields to water from forested land (Environment Court 2008).
During the science caucusing process, scientists generally agreed that pines planted
into improved pasture may lose between 8 to 12 kg N ha-1year-1. This will eventually
decrease to a long-term equilibrium rate of 2-3 kg N ha-1 year-1. These long-term forest
losses are small compared to losses assigned to other land uses in the Lake Taupo
catchment (e.g. 29 and 9 kg N ha-1 year-1 for dairy and non-dairy pastures, respectively).
Given the higher rainfall and free-draining pumice soils in the Taupo region, we would
also note that the N yields reported above for Taupo are likely to be higher than
expected for Southland.
Shrub-land
The above Environment Court proceedings also drew attention to the role that woody
nitrogen-fixing species such as gorse and broom may have as sources of N leaching
into Lake Taupo. Unpublished technical evidence collected by Scion suggests that N
leaching losses from land covered in gorse may be a significant source of N in
catchments that has been over-looked until now. However, we note that the assigned N
leaching rates for woody nitrogen-fixing species such as gorse and broom used in the
Lake Taupo decision (Environment Court 2008) were the same as for unimproved land
i.e. 2 kg N ha-1 year-1.

Report prepared for Environment Southland April 2010 Land Use and land management risks to water quality in Southland 18
3.3 Sources of phosphorus & sediment
Sources of P losses from dairy farms tend to vary more than for N. Phosphorus losses
depend heavily on spatial and temporal factors and the type of management practices
employed on farm, such as how FDE or manures are handled, and the degree of
protection of streams banks and beds from erosion and animal treading. Phosphorus
losses from intensively grazed pastures arise from dissolution and loss of particulate
material from the soil, washing-off of P from recently grazed pasture plants, dung
deposits and fertilizer additions (McDowell et al., 2007). These authors estimated the
relative proportions of fertilizer-, dung-, plant- and soil-derived P lost from a non-effluent
paddock at an Olsen P of 30 mg kg-1 to be 10, 30, 20 and 40%, respectively. Wide
variations in these proportions will occur depending on soil Olsen P concentration,
stocking rate and the timing of fertilizer applications relative to runoff. All except from
fertilizer additions are influenced by the action of grazing, whether it is the ripping of
pasture plants or the influence of treading on soil erosion and surface runoff potential.
Clover-based pasture dairy systems typically have relatively large P fertiliser usage to
maintain adequate soil P fertility for optimum clover growth. Of the P recycled via the
grazing cow, most is excreted in dung and in a soluble form (Kleinman et al., 2005).
Dung therefore represents a concentrated form of readily available P that can have a
large impact on surface water quality if voided directly into water. Stock access to
streams, FDE pond treatment systems, and FDE/manure applications to land are
therefore key land management practices that can potentially contribute substantially to
farm P losses (Byers et al., 2005; Hickey et al., 1989).
Non-pastoral land uses can also be important sources of P and sediment, particularly
via soil erosion. This is discussed further in section 3.3.2.
Prepared for Environment Southland April 2010 Land use and land management risks to water quality in Southland 19
P lo
ss (
kg P
ha-1
yr-1
)
0.0
0.5
1.0
1.5
2.0
2.5
3.0
3.58.0
10.0
N lo
ss (
kg N
ha-1
yr-1
)
0
5
10
15
20
25
30
35
40
45
50
55
60
None Sheep Mixed Deer Dairy
Sed
imen
t los
s (k
g ha
-1 y
r-1)
0
500
1000
1500
2000
2500
3000
3500
4000
���
���
���
Figure 3.2. Box plots showing the median, bounded by the 25th and 75th percentiles,
the 10th and 90th percentiles as whiskers, and any outliers as dots, for (a) N, (b)
P, and (c) sediment annual loads for each class of land use. “None” refers to
non-agricultural rural land uses, such as exotic plantation and native forest,
while ‘mixed’ refers to a catchment with more than one type of land-use class
(from McDowell & Wilcock 2008).
Report prepared for Environment Southland April 2010 Land Use and land management risks to water quality in Southland 20
Unlike N, overland flow accounts for a large proportion of the total P lost from dairy
farms. Although overland flow volumes are usually small relative to the volumes of
water discharged in sub-surface drainage, the enrichment of P in the topsoil relative to
deeper soil layers and the entrainment of soil and dung P in this flow makes it a
concentrated source of P and other potential stream contaminants such as ammonium-
N and faecal micro-organisms. Despite much research on P loss from agricultural soils,
the contributions from overland flow sources are still difficult to define because of
problems associated with spatial and temporal variability, making sampling and
measurement of flows under field conditions very difficult. Current understandings
suggest that near stream areas are important sources of overland flow, as are
impervious areas connected to the stream and areas of land underlain by artificial
drainage systems (McDowell and Srinivasan 2009). Where artificial sub-surface
drainage systems exist, loads of P lost can still be the same as losses in overland flow
from un-drained land, presumably due to the entrainment of particulate and dissolved P
as water moves through the macropores and fissures to tile or pipe drains (Haygarth et
al., 1998; Hooda et al., 1999; Monaghan et al., 2005; Sharpley & Syers 1979).
3.3.1 Documented losses of P and sediment from pastoral farms
In contrast to N, fewer studies have been undertaken to document annual yields of P
and sediment loss from pastoral farms. Those that have been reported in the literature
are summarised in Table 3.4. Also shown in Table 3.4 are the measured losses of P
and sediment from trial work undertaken in Southland by AgResearch but not yet
published in the science literature. Some of the key points to note in Table 3.4 are:
• Overland flow was not a major source of P in runoff exiting the drained plots at
Edendale, contributing only 10% of the Total P load recorded. However, where
plots where left un-drained and received high inputs of N fertiliser (and
consequently high stocking rates), total P losses in overland flow increased to
c. 0.23 kg P ha-1year-1.
• Mole-pipe drainage at the Tussock Creek site discharged approximately 35 kg
sediment ha-1 year-1. This represented 40% of the total sediment discharge
from the drained plots, with the balance (51 kg ha-1 year-1) coming via overland
flow. The mean annual loss of sediment in overland flow from un-drained plots
at this site was 47 kg ha-1, despite overland flow volumes in this treatment (67
mm year-1) being greater than in drained plots (54 mm year-1).
• In contrast to Tussock Creek, total P and sediment losses in mole-pipe drainage
from the dairy pasture (no FDE applied) at the Kelso site were 0.20 and 7 kg
ha-1 year-1, respectively. For the FDE-treated plot at this site, mean annual
Report prepared for Environment Southland April 2010 Land Use and land management risks to water quality in Southland 21
total P losses increased to 0.41 kg ha-1, due mostly to the preferential flow of
some of the applied FDE through the mole-pipe network.
• Dissolved reactive P (DRP) represented between 14-55% (mean of 33%) of the
paddock-scale P losses from pastures (excluding deer) reported in Table 3.4.
Of the catchment-scale P yields (excluding deer catchments) reported in Table
3.4, this range was 23-67% (mean of 45%).
• Some of the other important treatment and landuse contrasts evident in Table
3.4 are:
o P and sediment losses from cattle-grazed winter forage crops were
greater than from sheep-grazed winter forage cropland.
o These losses from sheep-grazed winter forage cropland were greater
than from sheep-grazed pastures.
o P and sediment losses from land grazed by deer were particularly high
at up to 3 and 4,480 kg ha-1 year-1, respectively. These reflect the large
amounts of erosion that deer can potentially cause, particularly when
allowed access to streams and wet areas. Accordingly, the mean ratio
of DRP:TP loads for the 5 deer catchment studies reported in Table 3.4
was 0.093. Losses from winter forage crops grazed by deer were also
particularly high and probably exacerbated by the lack of ground cover
and poor surface soil condition due to hoof treading.
o Poorly-timed applications of FDE to the Kelso trial site increased P
losses from 0.20 to 0.41 kg ha-1year-1.
o The very high rainfall (4,500 mm year-1) in the Inchbonnie catchment
(West Coast) contributed to the very high P and sediment yields
recorded.
o Although leaving the soils at Edendale and Tussock Creek in an un-
drained state did increase P losses in overland flow, total P discharges
in overland flow and mole-pipe drainage from these un-drained
treatments were lower than from the equivalent drained soils. This
suggests that installing mole-pipe drainage systems in poorly-drained
soils in Southland is likely to slightly increase P losses, rather than
decrease losses.
Some of the key conclusions and practical implications from the studies reported
above are:
(i) Mole-pipe drainage can make a relatively large contribution to P losses
from drained soils.
Report prepared for Environment Southland April 2010 Land Use and land management risks to water quality in Southland 22
(ii) These losses are exacerbated by poorly-timed applications of FDE.
(iii) In terms of P losses, a general order of ranking would be: deer pasture &
winter forage cropland > cattle-grazed winter cropland > sheep-grazed
winter cropland = FDE-treated pasture> cattle-grazed pasture > sheep-
grazed pasture.
(iv) For sediment, this ranking would be: deer > cattle-grazed winter cropland
> sheep-grazed winter crop-land > cattle-grazed pasture = sheep-grazed
pasture.
The above rankings are broadly consistent with those evident in the box plots presented
by McDowell & Wilcock (2008; Figure 3.2). These box plots also show that there are
very large ranges in reported losses of N, P and sediment within any given land use.
These large ranges indicate how resource (soil, slope, rainfall) and management (e.g.
nutrient inputs, riparian protection) risks combine to greatly modify pollutant losses for
any given land use. Due to these resource and management factors, models that
account for this variability are essential for predicting losses from farming systems.
3.3.2 Losses of P and sediment from non-pastoral land uses
In a review of P transfers from agricultural land, Haygarth & Jarvis (1999) note that
tillage practices on cropped land can have a direct effect on P losses. The loss of crop
cover is a particularly important issue that can leave bare soil exposed to the erosive
force of rain drop impacts. Although intensive cultivation can disturb the soil increasing
the risk of erosion, the stratification and enrichment of P in the topsoil, and subsequent
overland flow, means that minimum tillage may not yield as much benefit as some think.
However, contour ploughing is a simple precaution that can help to decrease runoff and
therefore the risk of P loss. The reported losses of P from tilled or cropped land that
were documented by Haygarth & Jarvis (1999) ranged between 0.1 and 6.2 kg P ha-1
year-1. The latter yield was recorded in surface runoff from a corn field in Ohio, USA.
The application of manures to cropland can also increase the risk of P transfer to water,
either due to large losses that may occur shortly after applying manure to land, or due to
the build-up of soil P concentrations following repeated applications of manure-P to land.
This latter risk is a particular concern for many feedlot farms in the USA, where
insufficient land may be available to avoid applying the large amounts of manure-P
generated by the confined animals (pigs and poultry in particular).
Forestry blocks can also be important sources of P and sediment loss to water. Some
documented losses are reported below:
Report prepared for Environment Southland April 2010 Land Use and land management risks to water quality in Southland 23
• Cooper & Thomsen (1988) report P and sediment losses from the Purukohukou
native forest of 0.12 and 27 kg ha-1 year-1, respectively. They observed that
although total P yields from the pine catchment were 4-fold higher than from
native forest in the 5 years after logging, these were still 4-fold lower than
recorded for pasture.
• Quinn & Stroud (2002) report P and sediment losses from a native forest
catchment at Whatawhata of 0.58 and 320 kg ha-1 year-1, respectively.
• Quinn & Ritter (2003) observed how increases in catchment N and P yields after
logging are short-lived and that high yields in year 1 are compensated for by
lower yields in subsequent years. In a comparison of pine, native and pasture
catchments, they noted that P losses from pines in the 9-12 year period after
logging were c. 18-fold lower than recorded for the pasture catchment..Losses
from the native forest catchment were broadly similar to those lost from the pine.
• Wilcock (1986) reports median specific yields of P from native forests, un-
disturbed exotic forests, and disturbed (i.e., recently logged) exotic forests of
0.2, 0.1 and 0.5 kg ha-1 year-1, respectively. The reported equivalent median
yields for sediment losses were 300, 500 and 700 kg ha-1 year-1, respectively.
3.4 Sources of faecal bacteria
There are even fewer studies, compared to N and P, that have documented losses of
faecal micro-organisms from pastoral farms. For reasons of cost and sampling logistics,
Escherichia coli (E. coli) is the microbial organism most commonly measured in runoff
waters and is used as an indicator of faecal pollution rather than an indicator of
pathogenic risk per se. There are a number of guidelines that are used as threshold
guidelines for microbial water quality. Some of the most frequently used ones are
indicated below:
• Water used for human consumption should have no faecal micro-organisms
present.
• Concentrations of faecal coliform bacteria in stock drinking water should not
exceed 1000 per 100 ml.
• The 95th percentile of samples taken from water bodies used for contact
recreation should not exceed 260 E. coli per 100 ml.
Report prepared for Environment Southland April 2010 Land Use and land management risks to water quality in Southland 24
The concentrations and loads of E. coli in mole-pipe drainage have been measured at
the Kelso and Tussock Creek experimental sites. These measurements were also
made on overland flow samples collected at the latter site to identify whether mole-pipe
drainage or overland flow was the more important pathway of E. coli losses at a
paddock scale. The main treatment (un-replicated) effect evaluated at the Kelso site
was the addition of FDE to one of the plots. Over the first measurement period (2001-
2003), the load and volume-averaged concentration of E. coli in mole-pipe drainage
from the plot that did not receive FDE was 9.2 x 10¹⁰ cfu ha-1 year-1 and 520 cfu 100 ml-
1, respectively. For the effluent-treated plot, these values increased to 1.7 x 10¹¹ cfu ha-
1 year-1 and 9,540 cfu 100 ml-1, respectively. When a low rate (K-line) sprinkler system,
instead of a travelling irrigator, was used to apply FDE to both plots throughout 2004-
2007, mean annual loads and volume-averaged concentrations of E. coli decreased to
4.1 x 10¹⁰ cfu ha-1 year-1 and 2,100 cfu 100 ml-1, respectively. Results from this
experimental work were used to construct the EFFDRAIN model which has been used
to predict farm scale-equivalent loads of effluent pollutants lost in mole-pipe drainage
under contrasting scenarios of pond storage and FDE application depths and rates
(Monaghan & Smith 2004; Monaghan et al. 2010, in press).
The concentrations and loads of E. coli in mole-pipe drainage and surface runoff from
the experimental plots at Tussock Creek have been continuously measured over the
2001-2003 period. This experimental site is managed as an established dairy pasture
stocked at 2.7 cows ha-1. In contrast to the Kelso site, no applications of FDE have been
made to the trial plots. Figure 3.3 shows how E. coli concentrations in both drainage and
surface runoff flows were (i) relatively high, and (ii) generally decreased as the interval
between grazing and subsequent drainage or runoff events increased. Surprisingly,
there did not appear to be any significant relationship between event size and E. coli
concentration (data not shown). The mean volume-averaged concentrations of E. coli in
collected mole-pipe drainage and surface runoff flows were 4.9 x 10³ and 2.6 x 10⁴ cfu
100 ml-1, respectively. Of the calculated mean paddock yield of 2.1 x 10¹¹ cfu ha-1 year-
1, approximately 66% of the yield was derived from surface runoff with the remainder
coming via mole-pipe drainage. These results demonstrate the large contribution that
surface runoff makes to paddock scale losses of faecal micro-organisms. Leaving the
soil un-drained increased E. coli yields in surface runoff by 23%, although is likely to
decrease E. coli yields in subsurface drainage. Although subsurface drainage losses of
E. coli were not measured in the un-drained soil treatment, we might conclude that,
while leaving the soil at Tussock Creek in an un-drained state is likely to increase E. coli
losses in surface runoff, it is unlikely to significantly increase paddock yields overall.

Report prepared for Environment Southland April 2010 Land Use and land management risks to water quality in Southland 25
Figure 3.3. E. coli concentrations in mole-pipe drainage and surface runoff from a
Southland dairy pasture (Tussock Creek experimental site, 2001-2003;
Monaghan et al. unpublished data).
Whilst relatively high concentrations of E. coli have been measured in drainage and
surface runoff at the Kelso and Tussock Creek sites, it should be noted that most of
these flow events typically occur from late autumn until mid spring. Discharges during
summer months, when river and stream recreational use is highest, are fortunately
infrequent. The environmental risks posed from winter and spring discharges of E. coli
in farm runoff are difficult to assess. However, flood events have very poor microbial
water quality, probably due to E. coli reservoirs in stream sediments (Muirhead et al.,
2004; Davies-Colley et al., 2008), but this moves rapidly through the stream network.
As a general rule, storm-flow loads are important for water quality in receiving water
bodies such as lakes and coastal areas where they may affect fishing, shellfish
collection or aquaculture, whereas base-flow loads are important for water quality in the
stream itself (Muirhead et al., 2008).
Another factor that complicates our understanding of E. coli (and P) loss from farms is
the fact that not all areas of the landscape contribute to flow pathways of loss. Those
that do are termed critical source areas and are characterised as being directly
“connected” to water bodies (McDowell & Srinivasan 2009). Examples of critical source
����������������
��������
����������������
���������
�
�
�
� � �� � �� ��� ��
�����������
����
�������
����
������������ �!���
��������
������
�����������������
���������������

Report prepared for Environment Southland April 2010 Land Use and land management risks to water quality in Southland 26
areas for E. coli are those areas of the landscape that have mole-pipe drained soils,
areas where overland flow can escape directly to streams, farm tracks and deer wallows
(e.g. Monaghan & Smith 2009; McDowell, 2008). To complicate things even further,
risk modelling analysis by Muirhead et al. (2010) suggests that water fowl can also be a
potentially significant source of faecal bacteria in rural streams (Figure 3.4). The context
surrounding this analysis suggests inputs by water fowl become important when (i)
currently recommended GEPs, such as improved effluent management, stock exclusion
and the elimination of stock crossings, have been implemented, and (ii) large
populations of fowl inhabit stream reaches.
Figure 3.4. Distributions of the modelled daily loads of E. coli discharged to the stream
from different farm managements or from ducks living in the stream. Horizontal lines are
the median values, boxes are the 25th to 75th percentiles, whiskers the 10th and 90th
percentiles and points the 5th and 95th percentile values. Modelling analysis from
Muirhead et al. (2010) and based on an average of 4 ducks per stream kilometre.
Recent studies have also documented some of the risks associated with intensive land
management and faecal pollution of ground and surface waters elsewhere in New
Zealand. Close et al. (2008) report some of the effects of intensive dairy farming and
border dyke irrigation on E. coli and Campylobacter concentrations in shallow
groundwater within the Waikakahi catchment, South Canterbury. Of the 135
Direct Stream 2 Pond APS High Low Ducks
Load
of E
. col
i to
the
stre
am(h
a-1 d
ay-1
)
101
102
103
104
105
106
107
108
109
1010
Inputs Crossings Effluent Management System
Report prepared for Environment Southland April 2010 Land Use and land management risks to water quality in Southland 27
groundwater samples taken, E. coli and Campylobacter were detected in 75% and 12%
of the cases, respectively. Border dyke irrigation was identified as an important factor
contributing to the increased risk of infection from Campylobacter during the irrigation
season. Studies by Malcolm Mcleod from Landcare Research have identified coarse soil
structure (large structural cracks) or soils with a drainage impediment (containing
wetting and drying cracks) as contributing to the rapid transport of faecal micro-
organisms (contained in applied FDE) via preferential flow (McLeod et al. 2008, McLeod
et al. 2004, Aislabie et al. 2001). Based on this work, some of the soil orders/subgroups
and soil characteristics identified as having a high risk of preferential flow include:
• Organic soils,
• Ultic soils
• Granular soils
• Melanic soils
• Podzol soils
• Gley and perch-gley soils
• mottled subsoils
• peaty soils
• skeletal and pedal soils
• soils with a slowly permeable layer
• soils with coarse soil structure
• soils with a high KSAT:K-40 ratio.
These risk attributes are discussed in more detail within a Southland context in the
report by Houlbrooke & Monaghan (2009; pages 15 and 16).
Animal access to streams for drinking or crossing provides a direct input of faecal
material to water (McDowell, 2008; Davies-Colley et al., 2004). Ruminant faeces are a
concentrated source of faecal indicator organisms: concentrations ranging from 2-200 x
105 and 2-400 x 104 cfu g-1 wet faeces have been reported for cattle and sheep faeces,
respectively (McDowell et al., 2008). Assuming each cattle and sheep faecal deposit
weighs approximately 2 and 0.1 kg, respectively (Haynes & Williams, 1993), these
values translate to loads of up to 8 x 10⁹ and 2 x 10⁹ cfu per faecal pat, respectively.
These relatively large numbers demonstrate how direct deposition of faecal material into
Report prepared for Environment Southland April 2010 Land Use and land management risks to water quality in Southland 28
streams can increase the concentrations of faecal micro-organisms in water-ways
draining pastoral land (Muirhead et al., 2008).
Wilcock et al. (2007) document concentrations of E. coli that were measured in streams
draining 5 predominantly dairy farmed catchments in NZ. Median concentrations for the
Toenepi (Waikato), Waiokura (Taranaki), Pigeon (West Coast), Waikakahi (Canterbury)
and Bog Burn (Southland) catchments were 367, 1250, 640, 290 and 530 MPN 100 ml-1,
respectively. Suggested key sources of this stream pollutant included discharges from
2-pond effluent treatment systems (Toenepi & Waiokura), irrigation wipe-off water
(Waikakahi), mole-pipe drainage (Bog Burn) and surface runoff from grazed pastures
(all catchments).
4. Relative risks of different land uses and activities
This section makes an assessment of the relative risks posed by contrasting land use
activities in Southland. For N and P losses, we use the Overseer model to make some
projections of N and P losses from contrasting land use scenarios within the setting of
the Bog Burn catchment. The lower part of this study catchment is covered by the
poorly-drained Pukemutu soil, which is also present at the Tussock Creek experimental
site. Modelled N losses are also presented for the Oteramika catchment in Eastern
Southland, where the more freely-drained Edendale silt loam is the major soil group
present.
In the case of E. coli losses, we use an inventory of identifiable potential sources to
indicate relative losses from some of the model farms evaluated. As stated earlier,
models are important tools that are needed to account for some of the resource (soil,
slope, rainfall) and management (e.g. nutrient inputs, FDE management, riparian
protection) risks that are known to contribute to the variability observed in nutrient and
microbial losses from different farming systems.
Overseer estimates of N and P losses for model farm systems set within the Bog Burn
catchment are shown in Figure 4.1. For this exercise we assumed that the hypothetical
deer units would be located on the steeper country in the head-waters of the catchment.
Farms are loosely based on data reported in MAF Monitor Farm reports (MAF 2007),
Monaghan et al. (2007), literature values and local knowledge.
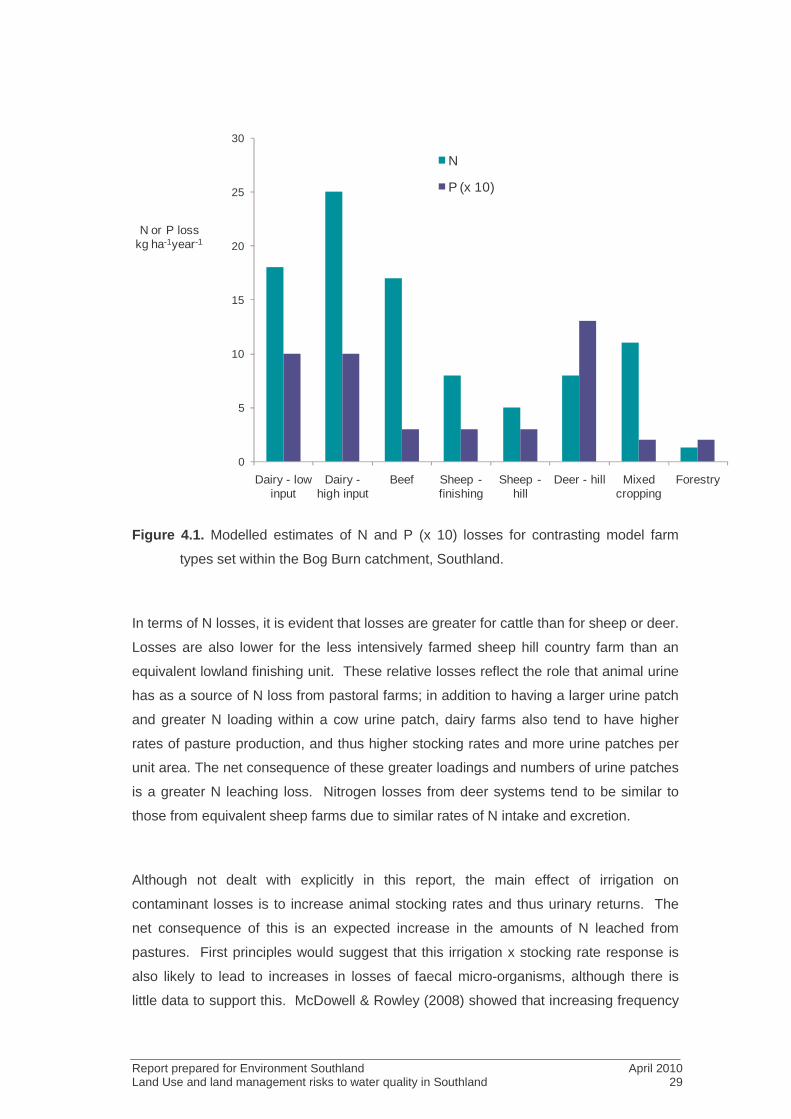
Report prepared for Environment Southland April 2010 Land Use and land management risks to water quality in Southland 29
0
5
10
15
20
25
30
Dairy - low input
Dairy -high input
Beef Sheep -finishing
Sheep -hill
Deer - hill Mixed cropping
Forestry
N or P losskg ha-1year-1
N
P (x 10)
Figure 4.1. Modelled estimates of N and P (x 10) losses for contrasting model farm
types set within the Bog Burn catchment, Southland.
In terms of N losses, it is evident that losses are greater for cattle than for sheep or deer.
Losses are also lower for the less intensively farmed sheep hill country farm than an
equivalent lowland finishing unit. These relative losses reflect the role that animal urine
has as a source of N loss from pastoral farms; in addition to having a larger urine patch
and greater N loading within a cow urine patch, dairy farms also tend to have higher
rates of pasture production, and thus higher stocking rates and more urine patches per
unit area. The net consequence of these greater loadings and numbers of urine patches
is a greater N leaching loss. Nitrogen losses from deer systems tend to be similar to
those from equivalent sheep farms due to similar rates of N intake and excretion.
Although not dealt with explicitly in this report, the main effect of irrigation on
contaminant losses is to increase animal stocking rates and thus urinary returns. The
net consequence of this is an expected increase in the amounts of N leached from
pastures. First principles would suggest that this irrigation x stocking rate response is
also likely to lead to increases in losses of faecal micro-organisms, although there is
little data to support this. McDowell & Rowley (2008) showed that increasing frequency
Report prepared for Environment Southland April 2010 Land Use and land management risks to water quality in Southland 30
of flood irrigation or stocking rate increased P losses in wipe-off (range 0.7 to 12.6 kg P
ha-1 year-1).
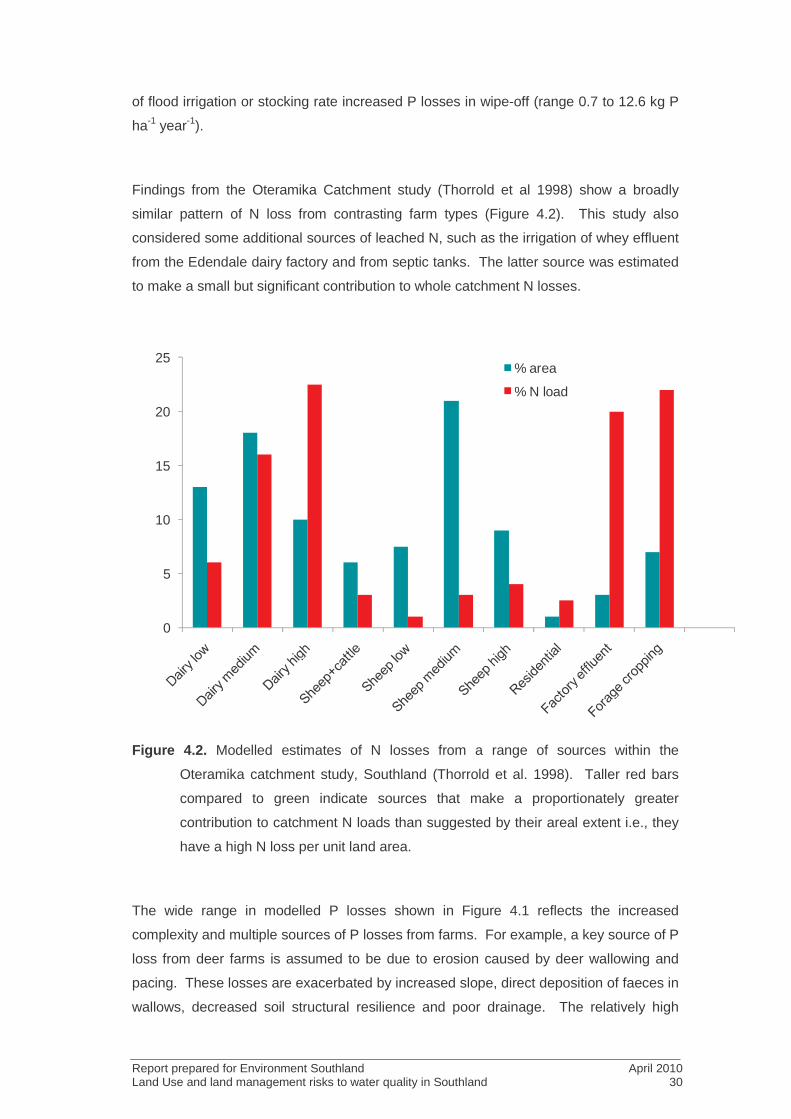
Findings from the Oteramika Catchment study (Thorrold et al 1998) show a broadly
similar pattern of N loss from contrasting farm types (Figure 4.2). This study also
considered some additional sources of leached N, such as the irrigation of whey effluent
from the Edendale dairy factory and from septic tanks. The latter source was estimated
to make a small but significant contribution to whole catchment N losses.
Figure 4.2. Modelled estimates of N losses from a range of sources within the
Oteramika catchment study, Southland (Thorrold et al. 1998). Taller red bars
compared to green indicate sources that make a proportionately greater
contribution to catchment N loads than suggested by their areal extent i.e., they
have a high N loss per unit land area.
The wide range in modelled P losses shown in Figure 4.1 reflects the increased
complexity and multiple sources of P losses from farms. For example, a key source of P
loss from deer farms is assumed to be due to erosion caused by deer wallowing and
pacing. These losses are exacerbated by increased slope, direct deposition of faeces in
wallows, decreased soil structural resilience and poor drainage. The relatively high
0
5
10
15
20
25% area
% N load
Report prepared for Environment Southland April 2010 Land Use and land management risks to water quality in Southland 31
losses modelled for dairy farms are due to contributions from rain-fed mole-pipe
drainage, overland flow and losses of FDE applied to poorly- and/or artificially-drained
soils when soil conditions are too wet. In contrast, the relatively low losses estimated for
sheep land use reflects the lower soil Olsen P concentrations and stocking rates
typically found on these farms.
The modelled N and P losses for Forestry land use in Figure 4.1 are estimates
representing the average for a plantation life cycle (i.e. spread over growth and harvest
phases). These losses were derived from the literature (Wilcock, 1986; Cooper and
Thomsen, 1988; Quinn and Ritter, 2003) and are generally low relative to the modelled
losses for other farm types.
4.1 Key sources of pollutants: dairy farms
The pie charts shown in Figure 4.3 illustrate the relative importance of the different
sources of N, P and E. coli discharged from a model dairy farm. This method of
presenting data can help to identify where mitigation efforts can be most effectively
targeted. The information used to construct the pie charts in Figure 4.3 comes from an
inventory of measured and modelled data. For overland flow and mole-pipe drainage
sources, summary measured data were taken directly from the Tussock Creek dairy
grazing trial. Due to similar soil types, this data agrees well with the model estimates
derived using Overseer for the model Bog Burn dairy farm presented in Figure 4.1. In
the case of pollutant losses due to the preferential flow of FDE through mole-pipe
drainage systems, the EFFDRAIN model (Monaghan & Smith 2004) was used to
calculate yields based on measured climate data and soil water deficits recorded at the
Tussock Creek site and assuming that one month’s effluent pond storage was used on
the model dairy farm. Direct deposition of pollutants due to cows grazing un-fenced
stream reaches was modelled using the algorithms contained in the BMPToolbox
(Monaghan, 2009; Bagshaw 2002), which in this case assumed that cows deposited 3%
of their excreta in the stream. Given that approximately 85% of stream reaches on dairy
farms in the Bog Burn catchment are fenced, direct excretal deposition is much higher
than typically expected, but is used here to illustrate the large potential effect that animal
access to streams can have on pollutant losses from farms. Note also that our modelling
analysis here does not consider any additional effects that animal access to streams can
be expected to have e.g. stream bank and bed erosion due to hoof damage leading to
increased losses of P and sediment.
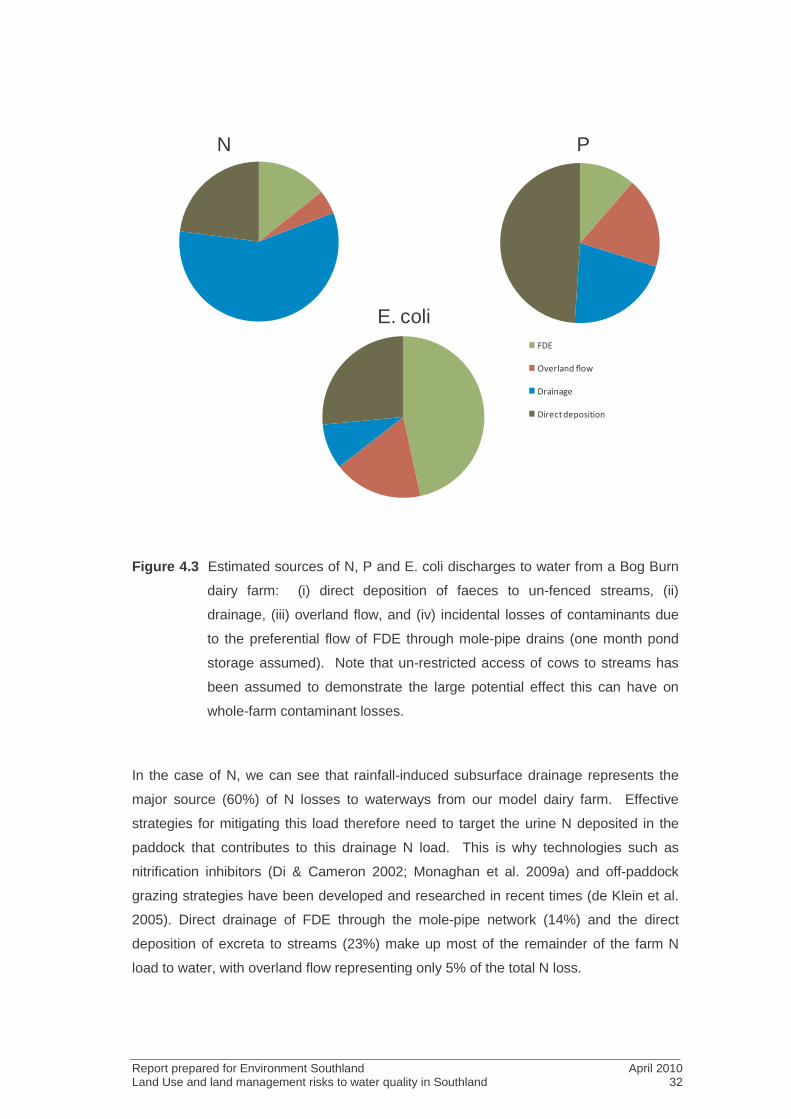
Report prepared for Environment Southland April 2010 Land Use and land management risks to water quality in Southland 32
"����#�
���
������������
��������
�����!���"�#�!���
N P
E. coli
Figure 4.3 Estimated sources of N, P and E. coli discharges to water from a Bog Burn
dairy farm: (i) direct deposition of faeces to un-fenced streams, (ii)
drainage, (iii) overland flow, and (iv) incidental losses of contaminants due
to the preferential flow of FDE through mole-pipe drains (one month pond
storage assumed). Note that un-restricted access of cows to streams has
been assumed to demonstrate the large potential effect this can have on
whole-farm contaminant losses.
In the case of N, we can see that rainfall-induced subsurface drainage represents the
major source (60%) of N losses to waterways from our model dairy farm. Effective
strategies for mitigating this load therefore need to target the urine N deposited in the
paddock that contributes to this drainage N load. This is why technologies such as
nitrification inhibitors (Di & Cameron 2002; Monaghan et al. 2009a) and off-paddock
grazing strategies have been developed and researched in recent times (de Klein et al.
2005). Direct drainage of FDE through the mole-pipe network (14%) and the direct
deposition of excreta to streams (23%) make up most of the remainder of the farm N
load to water, with overland flow representing only 5% of the total N loss.
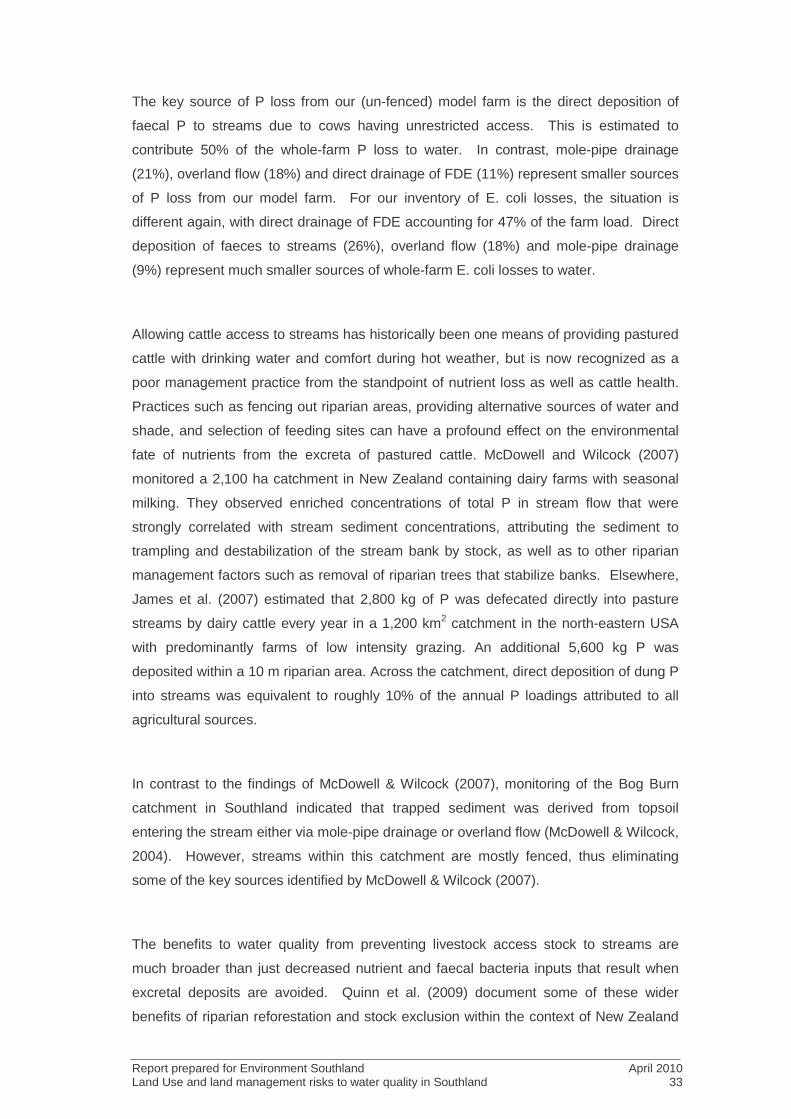
Report prepared for Environment Southland April 2010 Land Use and land management risks to water quality in Southland 33
The key source of P loss from our (un-fenced) model farm is the direct deposition of
faecal P to streams due to cows having unrestricted access. This is estimated to
contribute 50% of the whole-farm P loss to water. In contrast, mole-pipe drainage
(21%), overland flow (18%) and direct drainage of FDE (11%) represent smaller sources
of P loss from our model farm. For our inventory of E. coli losses, the situation is
different again, with direct drainage of FDE accounting for 47% of the farm load. Direct
deposition of faeces to streams (26%), overland flow (18%) and mole-pipe drainage
(9%) represent much smaller sources of whole-farm E. coli losses to water.
Allowing cattle access to streams has historically been one means of providing pastured
cattle with drinking water and comfort during hot weather, but is now recognized as a
poor management practice from the standpoint of nutrient loss as well as cattle health.
Practices such as fencing out riparian areas, providing alternative sources of water and
shade, and selection of feeding sites can have a profound effect on the environmental
fate of nutrients from the excreta of pastured cattle. McDowell and Wilcock (2007)
monitored a 2,100 ha catchment in New Zealand containing dairy farms with seasonal
milking. They observed enriched concentrations of total P in stream flow that were
strongly correlated with stream sediment concentrations, attributing the sediment to
trampling and destabilization of the stream bank by stock, as well as to other riparian
management factors such as removal of riparian trees that stabilize banks. Elsewhere,
James et al. (2007) estimated that 2,800 kg of P was defecated directly into pasture
streams by dairy cattle every year in a 1,200 km2 catchment in the north-eastern USA
with predominantly farms of low intensity grazing. An additional 5,600 kg P was
deposited within a 10 m riparian area. Across the catchment, direct deposition of dung P
into streams was equivalent to roughly 10% of the annual P loadings attributed to all
agricultural sources.
In contrast to the findings of McDowell & Wilcock (2007), monitoring of the Bog Burn
catchment in Southland indicated that trapped sediment was derived from topsoil
entering the stream either via mole-pipe drainage or overland flow (McDowell & Wilcock,
2004). However, streams within this catchment are mostly fenced, thus eliminating
some of the key sources identified by McDowell & Wilcock (2007).
The benefits to water quality from preventing livestock access stock to streams are
much broader than just decreased nutrient and faecal bacteria inputs that result when
excretal deposits are avoided. Quinn et al. (2009) document some of these wider
benefits of riparian reforestation and stock exclusion within the context of New Zealand
Report prepared for Environment Southland April 2010 Land Use and land management risks to water quality in Southland 34
hill country. These benefits include decreases in water temperatures and streambed
cover by fines and macrophytes, and improvements in stream macroinvertebrate
populations.
Belsky et al. (1999) also document some of the wider influences (generally deleterious)
that livestock have on riparian ecosystems in the western United States.
The above analysis demonstrates how the key sources of stream pollutants vary
depending on the contaminant of interest. This is somewhat unfortunate because it
implies that no single mitigation action on a dairy farm can effectively decrease the
losses of all contaminants at the same time. Hence, mitigations to decrease N losses
need to target animal urine patches (nitrification inhibitors, off-paddock wintering),
whereas mitigations to decrease P and E. coli losses need to target stream fencing and
the improved management of FDE. However, it is important to acknowledge that each
mitigation will have multiple benefits e.g. stream fencing to decrease P losses will also
decrease E. coli and N losses, by 26% and 13% in the case of our model farm,
respectively.
4.2 Key sources of pollutants: sheep farms
A similar inventory of key sources can be also constructed for a model sheep farm,
again using the Bog Burn catchment and soils as a case study setting. Although we
have relatively little experimental data to back up our inventory assumptions (particularly
for P and E. coli), we can use the Overseer model and the BMPToolbox to make an
assessment of the effects of allowing sheep grazing access to streams. Some of the
assumptions we have made here to perform this assessment are (i) 1 out of every 150
dung pats deposited by sheep lands directly in the stream, (ii) background N and P
losses in overland flow and subsurface drainage combined are 8 and 0.4 kg ha/yr,
respectively (Fig. 4.1) and (iii) background E. coli losses in overland flow and subsurface
drainage combined are 1.4 x 10¹¹ cfu ha-1 year-1. The latter assumes that E. coli losses
from a mole-pipe drained Pallic soil in Southland under dry stock farming are lower than
measured for dairy pastures, and decreased in proportion to the lower sheep stocking
rate assumed (14 SU ha-1) relative to dairy land use (20 SU ha-1).
The pie charts shown in Figure 4.4 illustrate the relative importance of the different
sources of N, P and E. coli discharged from the model sheep farm. As noted for dairy,
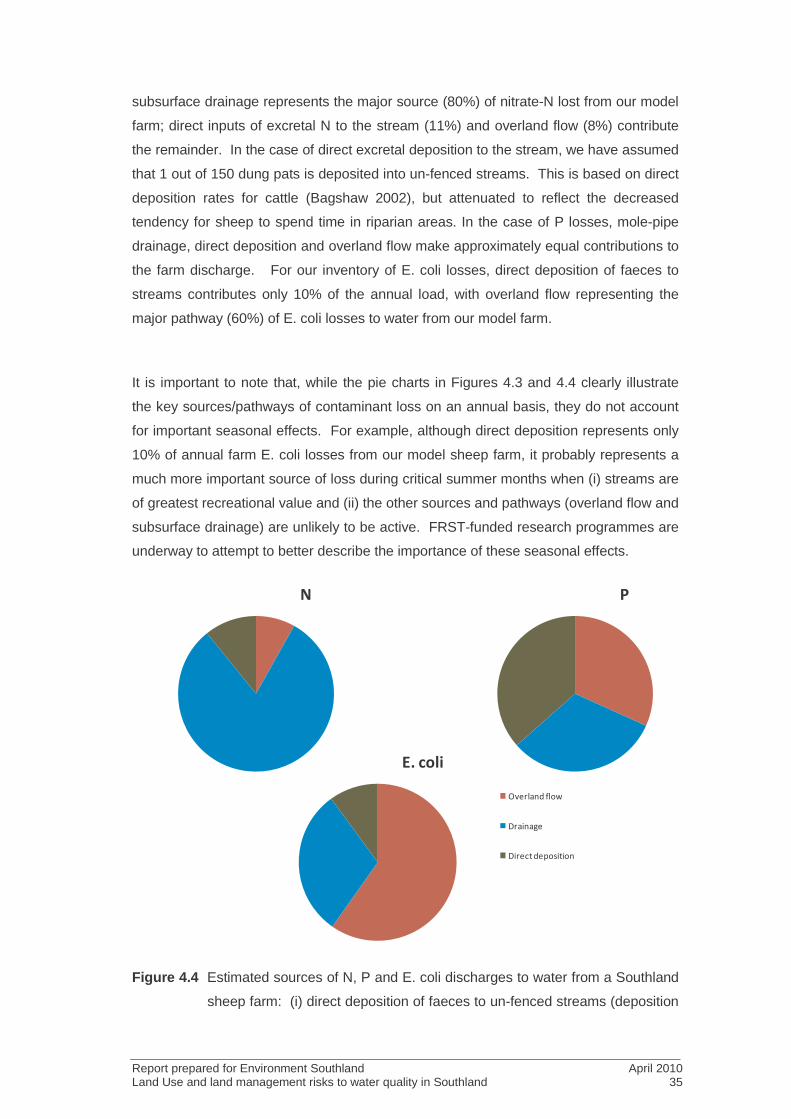
Report prepared for Environment Southland April 2010 Land Use and land management risks to water quality in Southland 35
subsurface drainage represents the major source (80%) of nitrate-N lost from our model
farm; direct inputs of excretal N to the stream (11%) and overland flow (8%) contribute
the remainder. In the case of direct excretal deposition to the stream, we have assumed
that 1 out of 150 dung pats is deposited into un-fenced streams. This is based on direct
deposition rates for cattle (Bagshaw 2002), but attenuated to reflect the decreased
tendency for sheep to spend time in riparian areas. In the case of P losses, mole-pipe
drainage, direct deposition and overland flow make approximately equal contributions to
the farm discharge. For our inventory of E. coli losses, direct deposition of faeces to
streams contributes only 10% of the annual load, with overland flow representing the
major pathway (60%) of E. coli losses to water from our model farm.
It is important to note that, while the pie charts in Figures 4.3 and 4.4 clearly illustrate
the key sources/pathways of contaminant loss on an annual basis, they do not account
for important seasonal effects. For example, although direct deposition represents only
10% of annual farm E. coli losses from our model sheep farm, it probably represents a
much more important source of loss during critical summer months when (i) streams are
of greatest recreational value and (ii) the other sources and pathways (overland flow and
subsurface drainage) are unlikely to be active. FRST-funded research programmes are
underway to attempt to better describe the importance of these seasonal effects.
"����#�
������������
��������
�����!���"�#�!���
$ %
Figure 4.4 Estimated sources of N, P and E. coli discharges to water from a Southland
sheep farm: (i) direct deposition of faeces to un-fenced streams (deposition
Report prepared for Environment Southland April 2010 Land Use and land management risks to water quality in Southland 36
of 0.7% of excreta assumed), (ii) drainage, and (iii) overland flow. Note that
un-restricted access of sheep to streams has been assumed to demonstrate
the potential effect this can have on whole-farm contaminant losses.
4.3 A simplified assessment of potential relative effects of contrasting
land uses and management practices
Based upon the literature reviewed in section 3 of this document, and the comparative
assessments shown above, we have attempted to provide a simple index in Table 4.1
showing the effects that different land uses and land use practices have on contaminant
losses from farms. It is important to recognise that landscape and management factors
strongly influence absolute losses. However, this simplified assessment does illustrate
the potential effects of land use and practice for equivalent landscape and management
factors. It is evident from Table 4.1 and Figure 4.1 that changes in land use can have a
profound effect on contaminant losses to water. Some obvious examples include:
• Switching from low intensity land uses, such as sheep or forestry, to dairy
farming will result in greater losses of N to water.
• These shifts are also likely to result in greater losses of P, sediment and faecal
micro-organisms if they occur on heavy soils and/or management practices on
the converted farms are poor.
• Changing land use to deer farming is likely to increase losses of P and sediment
unless riparian areas and seeps/bogs are well protected.
• Changing from sheep farming to mixed cropping is also likely to lead to
increased losses of some contaminants, although this will be heavily dependent
on how the cropping system is managed. Factors that exacerbate N leaching
losses on the mixed cropping farm include having a large proportion of the farm
in crop, pre-winter tillage, applying high rates of N fertiliser to crops and
practising conventional cultivation instead of direct drilling. Losses of P and
sediment from the mixed cropping farms will also depend heavily on
management factors such as cultivation of slopes, sowing up and down slopes
and leaving soil exposed during periods of surplus rainfall. Conversely, the use
of GEPs such as contour ploughing, cover crops, and expert fertiliser decision
support tools may help to decrease losses.
Prepared for Environment Southland April 2010 Land use and land management risks to water quality in Southland 37
Table 4.1. A simplified index of the potential relative effects of different land uses and management practices on farm contaminant losses
for equivalent landscape and management factors (flat topography assumed for all farm types). More crosses = greater losses.
Land use Soil type Management practice N loss P loss E. coli loss Sediment loss
Dairy free-draining < 2 weeks FDE storage; no stock
exclusion; forage crop wintering X X X X X X X X X X X X X X
- with stock exclusion X X X X X X X X X X
- stock exclusion & FDE storage X X X X X X X
- & off-paddock wintering X X X X X X
Dairy poor-draining < 2 weeks FDE storage; no stock
exclusion; forage crop wintering X X X X X X X X X X X X X X X X X X X X
- with stock exclusion X X X X X X X X X X X X X X X
- stock exclusion & FDE storage X X X X X X X X X X
- & off-paddock wintering X X X X X X X
Sheep free-draining 15 SU ha-1; streams unfenced X X X X X X X
free-draining 15 SU ha-1; streams fenced X X X X X
poor-draining 15 SU ha-1; streams unfenced X X X X X X X X X X
Report prepared for Environment Southland April 2010 Land Use and land management risks to water quality in Southland 38
15 SU ha-1; streams fenced X X X X X X X X
Cropping shallow soils Sub-optimala X X X X X X X X X X
Optimal (fert., cultivation timing) X X X X X X
deeper soils Optimal (fert., cultivation timing) X X X X X
Deer all 15 SU ha-1; streams un-fenced X X X X X X X X X X X X X X X X X X X
free-draining 15 SU ha-1; streams fenced X X X X X X
poor-draining 15 SU ha-1; streams fenced X X X X X X X X X X X
Horticulture Winter vegetables Potentially very
high b
Potentially very
high b
n/a Potentially very
high b
Forestry X X X ?b awith respect to (i) fertilization amounts and timing, and (ii) tillage method and timing.
bvery dependent on management practices (e.g. forestry harvesting). For horticultural crops, fertilisation timing and rates, residue management
and cultivation practices will heavily modify losses.
Prepared for Environment Southland April 2010 Land use and land management risks to water quality in Southland 39
5. Recommended Good Environmental Practices to
decrease pollutant losses
Based on our review and inventory analyses above, we can recommend some key
GEPs that decrease contaminant losses from farms (Table 5.1). Also provided are
some rankings according to the relative cost-effectiveness of each GEP. This metric
provides an assessment of where we are likely to get the “biggest bang for buck”. In
other words, a high cost-effectiveness implies that relatively large decreases in
contaminant losses can be achieved per $ of mitigation expenditure. Estimates of the
annualised net cost of implementing each mitigation measure was used to calculate a
range of cost-effectiveness values based upon information within the BMPToolbox
(Monaghan, 2009). For simplicity, this assumes a number of default costs, such as the
opportunity cost of capital (8%), depreciation, maintenance, additional labour and feed,
and revenue foregone as a result of land lost to production. Any financial benefits
expected from implementing measures are deducted from the net overall annualised
cost. These benefits can be particularly important where a measure increases
productivity (e.g. extra pasture growth from the use of nitrification inhibitors) or
decreases farm operational costs such as avoiding off-farm cow wintering fees if the
animals are wintered under a Herd Shelter on the home farm. Strictly speaking, any
assessment of mitigation costs and effectiveness should be conducted on a farm-
specific basis due to the variable nature of farm management systems and landscape
features. However, on a regional basis, such an exercise would be impossible to do for
every permutation. Hence, the information in Table 5.1 provides an indicative
assessment of the relative cost-effectiveness of a range of GEPs relevant to “typical”
Southland farms.
The recommended GEPs shown in Table 5.1 are limited to those that have been shown
to be effective in the field and cheap to implement. Some are effective in decreasing
multiple contaminants (e.g. the improved effluent management practices) while others
target a specific contaminant (e.g. nitrification inhibitors). Nutrient budgeting and stock
exclusion are GEPs common to all pastoral land uses that are known to be highly cost-
effective. Improved effluent management practices are another set of measures that are
highly cost-effective mitigation measures for dairy farms. The next tier of GEPs that can
be described as being of “medium” cost effectiveness include “facilitated” wetlands and
nitrification inhibitors (all pastoral land uses) and off-paddock dairy grazing systems
such as wintering shelters and/or restricted autumn grazing practices. The bottom tier of
mitigation measures that are relatively cost-ineffective within a Southland context
include grass buffer strips, incorporation of low N feeds into the diet and the use of
Report prepared for Environment Southland April 2010 Land Use and land management risks to water quality in Southland 40
constructed wetlands. It should be noted that our assessment of the cost-effectiveness
of constructed wetlands does not fully capture the ancillary benefits of these structures
such as habitat, biodiversity and aesthetic values and sediment capture.
Table 5.1. Suggested GEPs that can decrease contaminant losses from farms. A brief
description of each GEP is provided in Appendix I.
Land use GEP Cost-effectiveness
Dairy Nutrient budgeting High Stock exclusion from streams High Effluent storagea High Low rate effluent applicationa High Nitrification inhibitors Medium Off-paddock winteringb Medium Restricted autumn grazing Medium Facilitated wetlandsc Medium Elimination of stock stream crossings Varies according to
bridging costs Constructed wetlands Medium-low Grass buffer strips Low Incorporating low N feeds into diets Low
Sheep/beef/deer Nutrient budgeting High Stock exclusion from streams High Facilitated wetlands Medium Nitrification inhibitors Medium Elimination of stock stream crossings Varies according to
bridging costs Constructed wetlands Medium-low Grass buffer strips Low Cropping Use of fertiliser calculators High Judicious timing of cultivation High Decreased tillage intensity High Cover crops High arefer to Houlbrooke & Monaghan (2009) for more detailed assessments of soil-
topographical categories where these improved effluent management systems are
required; bassuming cows are wintered in/on structures where full effluent containment
is achieved; cwetlands targeted at naturally poorly drained and relatively un-productive
parts of the landscape such as seeps and bogs (McKergow et al. 2008).
Report prepared for Environment Southland April 2010 Land Use and land management risks to water quality in Southland 41
6. Effects of GEP uptake at a catchment/regional scale
The effects of GEP uptake on water quality (TN, TP and E. coli) for the Oreti River
catchment (3512 km2) was simulated by NIWA using the Catchment Land Use for
Environmental Sustainability model version 3 (CLUES 3.0). CLUES was run with default
settings (no mitigation) and six mitigation scenarios to simulate: stock exclusion (current
and future levels); nitrification inhibitors; herd shelters; improved farm dairy effluent
(FDE) management; and constructed wetlands.
6.1 CLUES 3.0 overview
CLUES is a modelling system for assessing the effects of land use change on water
quality and socio-economic factors at a minimum scale of sub-catchments (~10 km2 and
above). CLUES was developed by NIWA in collaboration with Lincoln Ventures, Harris
Consulting, AgResearch, HortResearch, Crop and Food Research, and Landcare
Research for the Ministry of Agriculture and Forestry (MAF) and the Ministry for the
Environment (MfE). CLUES couples a number of existing models within a GIS-platform
and is provided to users as a front-end interface within ArcGIS (Figure 6.1). Water
quality results provided by CLUES are:
• Nutrient loads (kg year-1) - in-stream cumulative loads for total nitrogen (TN) and
total phosphorus (TP) for each river reach.
• Sediment load (kilo-tonnes/year) - in-stream cumulative load of total suspended
solids (TSS) for each river reach
• E. coli loads (1015 or one “peta” of organisms/year) – in-stream cumulative
organism count for each river reach
• Nutrient concentration (mg/m3) - in-stream N and P median concentrations for
each river reach.
• Nutrient yields (kg/ha/year) - nutrient load divided by the contributing area.
Provided in two forms:
Cumulative yield - the in-stream cumulative yield which represents the total yield
for each reach and its up-stream tributaries.
Generated yield - the yield generated by each sub-catchment which is delivered
to the stream network.
• Generated Sediment yield (tonnes/ha/year) - yield of TSS generated by each
sub-catchment. This information can be used to identify sources of sediment.
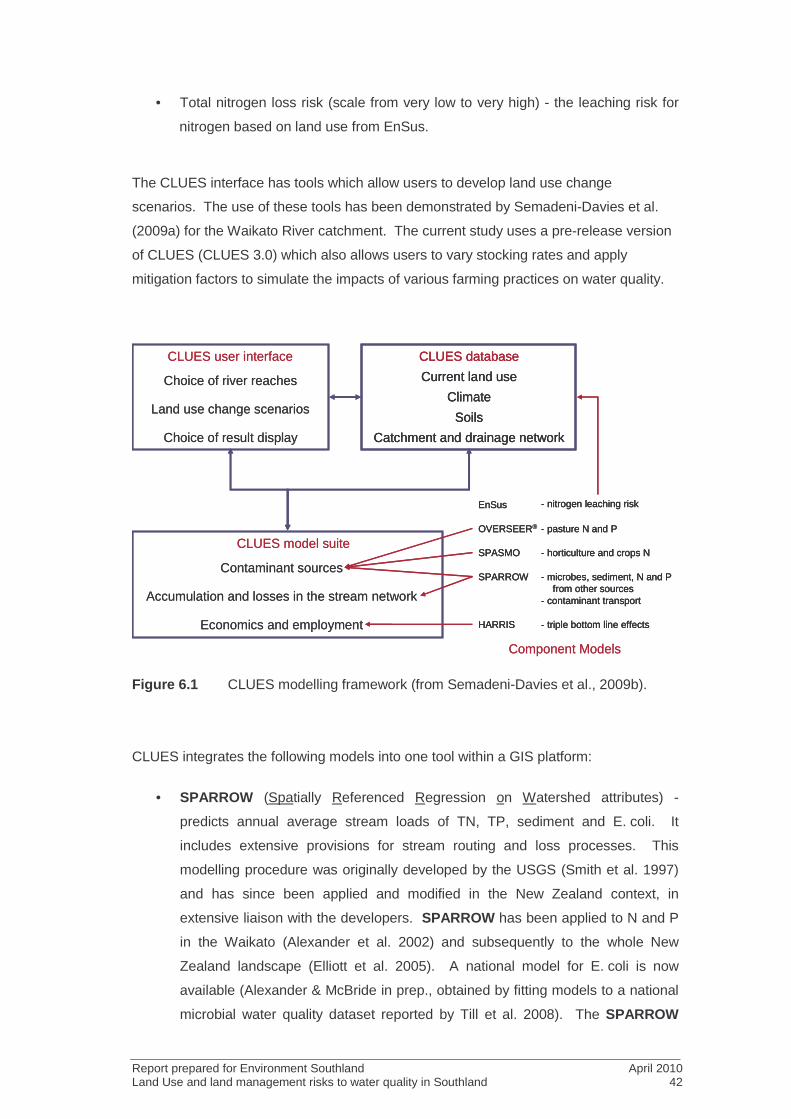
Report prepared for Environment Southland April 2010 Land Use and land management risks to water quality in Southland 42
• Total nitrogen loss risk (scale from very low to very high) - the leaching risk for
nitrogen based on land use from EnSus.
The CLUES interface has tools which allow users to develop land use change
scenarios. The use of these tools has been demonstrated by Semadeni-Davies et al.
(2009a) for the Waikato River catchment. The current study uses a pre-release version
of CLUES (CLUES 3.0) which also allows users to vary stocking rates and apply
mitigation factors to simulate the impacts of various farming practices on water quality.
Accumulation and losses in the stream network
Economics and employment
Contaminant sources
CLUES model suite- pasture N and POVERSEER®
- horticulture and crops NSPASMO
- microbes, sediment, N and P from other sources
- contaminant transport
SPARROW
- nitrogen leaching riskEnSus
- triple bottom line effectsHARRIS
Land use change scenarios
Choice of result display
Choice of river reaches
CLUES user interface
Climate
Catchment and drainage network
Current land use
CLUES database
Soils
Component Models
Accumulation and losses in the stream network
Economics and employment
Contaminant sources
CLUES model suite- pasture N and POVERSEER® - pasture N and POVERSEER®
- horticulture and crops NSPASMO - horticulture and crops NSPASMO
- microbes, sediment, N and P from other sources
- contaminant transport
SPARROW - microbes, sediment, N and P from other sources
- contaminant transport
SPARROW
- nitrogen leaching riskEnSus - nitrogen leaching riskEnSus
- triple bottom line effectsHARRIS - triple bottom line effectsHARRIS
Land use change scenarios
Choice of result display
Choice of river reaches
CLUES user interface
Climate
Catchment and drainage network
Current land use
CLUES database
Soils
Climate
Catchment and drainage network
Current land use
CLUES database
Soils
Component Models
Figure 6.1 CLUES modelling framework (from Semadeni-Davies et al., 2009b).
CLUES integrates the following models into one tool within a GIS platform:
• SPARROW (Spatially Referenced Regression on Watershed attributes) -
predicts annual average stream loads of TN, TP, sediment and E. coli. It
includes extensive provisions for stream routing and loss processes. This
modelling procedure was originally developed by the USGS (Smith et al. 1997)
and has since been applied and modified in the New Zealand context, in
extensive liaison with the developers. SPARROW has been applied to N and P
in the Waikato (Alexander et al. 2002) and subsequently to the whole New
Zealand landscape (Elliott et al. 2005). A national model for E. coli is now
available (Alexander & McBride in prep., obtained by fitting models to a national
microbial water quality dataset reported by Till et al. 2008). The SPARROW
Report prepared for Environment Southland April 2010 Land Use and land management risks to water quality in Southland 43
sediment transport routines were assessed by Elliott et al. (2008) and
simulations compared favourably with measured sediment load data.
• SPASMO (Soil Plant Atmosphere System Model, HortResearch) - calculates the
N budget for five horticultural enterprise scenarios. Detailed simulations for
many cases (combinations of crops, climate, fertiliser use) have been run (using
a daily time step) to build look-up tables that CLUES queries. It has been
validated against data from grazed pasture (Rosen et al. 2004) and pasture
treated with herbicide (Close et al. 2003; Sarmah et al. 2004).
• OVERSEER® (AgResearch, Wheeler et al. 2006) - computes nutrient leaching
for dairy, sheep and beef and deer. It provides annual average estimates of N
losses from these land uses, given information on rainfall, soil order, topography
and fertiliser applications. Within CLUES, OVERSEER losses vary as a function
of soil order, rainfall, stocking rate, land use class and region. For other
variables, such as fertiliser application rates, typical values are used based on
the region and land use.
• TBL (Triple Bottom Line, Harris Consulting) - estimates economic output from
different land use types (pasture, horticulture, forestry and cropping), in terms of
Cash Farm Surplus (CFS), Total GDP and Total Employment from that land use,
given as a function of output. The calculations are based on the MAF farm
monitoring models.
• EnSus (Environmental Sustainability, Landcare Research) - provides maps of
nitrogen leaching risk, used as an adjunct to interpretation of CLUES results. It
is based on studies of nitrogen losses at national and regional scales (Hewitt
and Stephens, 2002; Parfitt et al. 2006).
CLUES does not contain a groundwater model. Rather, it is assumed that water
percolating into the ground will emerge in the same surface water catchment.
The base areal unit of CLUES is the sub-catchment which comes from the NIWA River
Environment Classification (REC) of the national stream and sub-catchment network1.
Each sub-catchment is associated with a river reach and has a unique identity number
— there are 6696 reaches in the Oreti catchment. Predictions of the water quality and
financial indicators given above can be made for any reach.
1 http://www.niwa.co.nz/ncwr/rec
Report prepared for Environment Southland April 2010 Land Use and land management risks to water quality in Southland 44
Geo-spatial data needed to run CLUES are provided at national, regional, catchment
and sub-catchment levels. Terrain data is at 30m resolution. In addition to REC, data
sets provided are current land use, runoff (derived from rainfall less evapotranspiration),
slope, soil data (from the Land Resources Inventory, LRI, Fundamental Soils Layer2 –
Wilde et al., 2004) and point sources and lakes. The current land use layer provided
with CLUES was developed with extensive reference to the LCDB2 (Land Cover
Database)3, AgriBase (AsureQuality Ltd)4, and LENZ (Land Environments of New
Zealand)5 land use geo-databases. Considerable effort was expended, with Landcare
Research, to ensure that the spatial data coverage was as accurate as possible.
Pastoral land use is based on 2001 conditions, and will not reflect recent dairy
conversions. Further details on the modelling framework can be found in Woods et al.
(2006).
New to CLUES 3.0 is the ability to create farm practice scenarios which enhance or
mitigate contaminant yields at the sub-catchment scale. These can be applied to river
reaches using interactive selection tools or by supplying CLUES with a scenario table for
those catchments affected. Percentage changes in stocking rates, nutrient losses to
water and E. coli release from dairy, sheep and beef and deer farms can be used to
simulate farm practices. These tools are at the heart of the present report.
6.2 Comparisons between CLUES predictions and water quality
observations in the Oreti Catchment
CLUES was run for the entire Oreti catchment and compared with available nutrient
measurements in order to assess model performance. The comparison was made at
three locations (Figure 6.2; Table 6.1) in order to assess model performance in the Oreti
catchment. Two of the sites (Riverton Highway Bridge and Lumsden) are in the National
Water Quality Network (Smith and Maasdam, 1994; Ballantine and Davies-Colley,
2009), and the measurements are based on 20 years of data. The third site (Bog Burn)
was monitored as part of the Best Practice Catchments for Sustainable Dairying
programme (Wilcock et al., 2007; Parshotam and Elliott, 2009). For the comparison,
CLUES was run using default settings (i.e., no mitigation) and for the current level of
stock exclusion (see Section 6.3.1). The stock exclusion analysis is included in the
2 http://soils.landcareresearch.co.nz/contents/index.aspx 3 http://www.mfe.govt.nz/issues/land/land-cover-dbase/classes.html 4 http://www.asurequality.com/corporate/it_services/agribase.cfm 5 http://www.landcareresearch.co.nz/services/informatics/LENZ/about.asp
Report prepared for Environment Southland April 2010 Land Use and land management risks to water quality in Southland 45
comparison as approximately 75% of dairy cattle and 35% of dry stock (sheep and beef)
are currently excluded in areas with a land use capability (LUC) rating of 1 to 3
(Environment Southland: Morgan, G., pers. comm., 2010).
Figure 6.2 Location of water quality observation points in the Oreti River catchment.
The flow rates within CLUES match the measured flows well (Table 6.1) suggesting that
there is no large-scale loss or gain of water into or out of the catchment. However, it is
known that some stream reaches in the upper catchment lose water to the local
unconfined groundwater systems. Riparian aquifers may provide seasonal storage
throughout the catchment, and in the lower reaches, streams may be fed from confined
aquifers which are recharged beyond the local surface water catchment (personal
communication, Karen Wilson, Environment Southland groundwater scientist). Hence,
CLUES is used to provide a ‘big picture’ of surface water quality, rather than a
comprehensive and detailed view of the complex groundwater-surface water
hydrological system.

Report prepared for Environment Southland April 2010 Land Use and land management risks to water quality in Southland 46
The results for TN are given in Table 6.2 and for TP in Table 6.3.
The TN loads, concentrations and yields match those measured well, except for the
Riverton HB site. This discrepancy is unlikely to reflect recent dairy intensification,
because the measurements are based on a 20-year average. Also, considering that the
model performs satisfactorily for the dairy-dominated Bog Burn site, the differences at
Riverton HB are unlikely to be related to dairy land use. The under-prediction may
reflect delayed responses to historical land-use changes. Some of the confined aquifers
in the regional have groundwater ages in the order of 100 years (personal
communication, Karen Wilson, Environment Southland). However the surficial
unconfined aquifers have much shorter residence times, in the order of 10 years, and
would not show such a slow response to historical land development or intensification.
The under-prediction could also relate to underestimation of the intensity of sheep and
beef land-uses in the lower catchment.
For TP, the predictions for load and yield are satisfactory for Bog Burn and Riverton HB,
but the model over-predicts the load and yield at Lumsden, which has relatively
undeveloped land-uses.
The model over-predicts TP concentrations at Lumsden and Riverton HB by a
considerable degree. This is partly a reflection of load over-estimation (at Lumsden),
but also reflects the way that median concentrations are calculated from the flow-
weighted concentration, which in turn is calculated from the load and flow rate. For
Riverton HB and Lumsden, the model predicts that the median concentration is
approximately half of the flow-weighted concentration, whereas the measurements show
that the median concentration is approximately a quarter of the flow-weighted
concentration. This reflects a greater degree of flashiness or seasonal variability in
concentrations, which may be due to in-stream uptake during baseflow and re-
mobilisation during storm flow in these low-P and P-limited streams.
While the model reflects overall trends in loads and concentrations, the absolute values
are sometimes inaccurate, especially for TP. Hence, it is best to focus on the relative
changes predicted under various mitigation scenarios, rather than the absolute values.
Report prepared for Environment Southland April 2010 Land Use and land management risks to water quality in Southland 47
Table 6.1. Water quality monitoring site information with observed and CLUES
simulated mean discharge.
Lumsden Riverton Highway
Bridge Bog Burn
NZ River Reach 15033324 15058642 15046046
Up-stream catchment area
(km2) 1129 2143 21
Source National Water Quality
Network
National Water Quality
Network
Wilcock et al.,
2007
Mean discharge
(m3/s)
CLUES 28.6 42.5 0.3
Measured 27.1 38.0 0.3
Table 6.2. Observed and CLUES-simulated total nitrogen (TN) loads and
concentrations (default settings and current stock exclusion). Concentrations
are medians.
Lumsden Riverton Highway Bridge Bog Burn
TN Load (t y-1)
Predicted
(default) 345 1036 22
Predicted
(current stock exclusion) 342 980 19
Measured 470 1602 21
TN concentration (mg m-3)
Predicted
(default) 333 624 1381
Predicted
(current stock exclusion) 330 590 1216
Measured 480 885 1100
TN Yield (kg ha-1 y-1)
Predicted
(default) 3.1 4.8 10.5
Predicted
(current stock exclusion) 3.0 4.6 9.3
Measured 4.2 7.5 10.1
Report prepared for Environment Southland April 2010 Land Use and land management risks to water quality in Southland 48
Table 6.3. Observed and CLUES-simulated total phosphorus (TP) loads and
concentrations (default settings and current stock exclusion). Concentrations are
medians.
Lumsden Riverton Highway Bridge Bog Burn
TP Load (t y-1)
Predicted
(default) 42 80 0.7
Predicted
(current stock exclusion) 42 75 0.5
Measured 21 63 1.0
TP concentration (mg m-3)
Predicted
(default) 18.6 30.8 52.6
Predicted
(current stock exclusion) 18.4 28.7 40.8
Measured 5.3 13.9 50.0
TP Yield (kg ha-1 y-1)
Predicted
(default) 0.4 0.4 0.3
Predicted
(current stock exclusion) 0.4 0.3 0.3
Measured 0.2 0.3 0.5
6.3 Mitigation scenarios
The effect of implementing mitigations in a particular sub-catchment or selection of sub-
catchments was simulated using CLUES 3.0 by specifying the percentage decrease in
nutrient loss and E. coli generated by dairy or sheep and beef farming for each of the
sub-catchments targeted. The mitigation factors for the scenarios and their decrease
factors are summarised in Table 6.4 and were provided by AgResearch. For each sub-
catchment investigated, the mitigation factors were weighted according to the
proportional area satisfying the mitigation criteria given in the table. This was done by
splitting each sub-catchment into mitigation and no-mitigation zones using standard GIS
tools and then calculating the percentage area of the total sub-catchment area for each
zone in MS Excel using pivot tables. The mitigation factors were then attenuated
accordingly. Current stock exclusion was assumed to coincide with simulation of
Report prepared for Environment Southland April 2010 Land Use and land management risks to water quality in Southland 49
nitrification inhibitors, herd shelters, wetlands and FDE management where these
mitigations were applied to areas with an LUC of 1-3.
Table 6.4. Assumed mitigation factors in farm losses of N, P and E. coli under a
range of mitigation scenarios (Oreti River catchment). Figures in italics/bold are
best guesses.
Mitigation type
Mitigation Criteria Mitigation
(% decrease)
Soil
drainage
Land Use
Capability Landuse N P
E.
coli
CLUES default
(no mitigation) All All All 0% 0% 0%
Stock exclusion from
streams – current
situation1
Not
specified 1-3 Dairy 15% 30% 15%
Dry stock (all sheep
and beef) 3.5% 10.5% 3.5%
Stock exclusion from
streams – future
mitigation2
Not
specified 1-3
Dairy 20% 40% 20%
Dry stock (all sheep
and beef) 10% 30% 10%
Nitrification inhibitors3 Not
specified 1-4
Dairy and dry-stock
(sheep and beef
intensive)
30% 0% 0%
Herd shelters3 Not
specified 1-4 Dairy 30% 10% 10%
Wetlands3 Poorly
drained Not specified
Dairy and dry-stock
(all sheep and beef) 25% 0% 20%
Improved FDE
management3
Free
draining Not specified Dairy 5% 5% 5%
Poorly
draining Not specified Dairy 10% 10% 40%
1Assumes current stock exclusion of 75% dairy cattle and 35% sheep and beef in LUC classes 1-3. 2Assumes total stock exclusion of all stock in LUC classes 1-3. 3Scenario simulated in combination with current stock exclusion.
The following GIS layers were used to select areas where mitigation should be applied:
• Land Use Capability (LUC) taken from the LRI (Newsome, 1995). LUC classes
for the Oreti catchment are given in Figure 6.3. A full description of LUC classes
and their application nationwide can be found in Lynn et al. (2009).
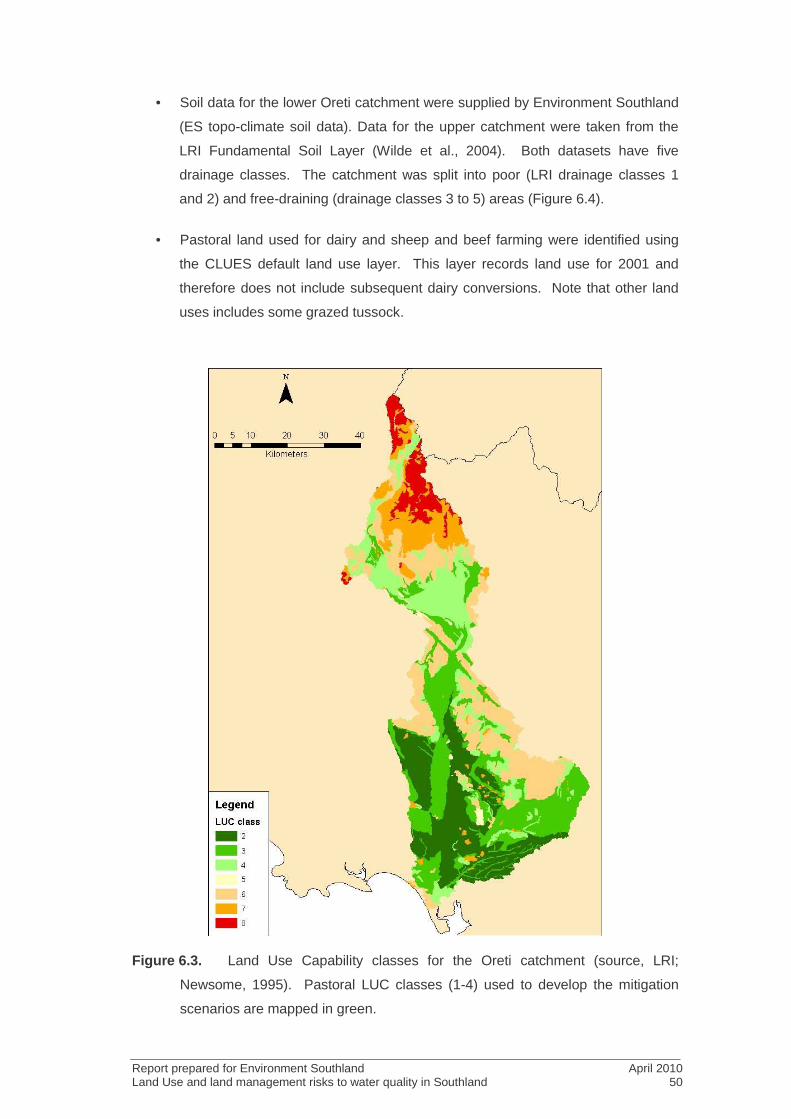
Report prepared for Environment Southland April 2010 Land Use and land management risks to water quality in Southland 50
• Soil data for the lower Oreti catchment were supplied by Environment Southland
(ES topo-climate soil data). Data for the upper catchment were taken from the
LRI Fundamental Soil Layer (Wilde et al., 2004). Both datasets have five
drainage classes. The catchment was split into poor (LRI drainage classes 1
and 2) and free-draining (drainage classes 3 to 5) areas (Figure 6.4).
• Pastoral land used for dairy and sheep and beef farming were identified using
the CLUES default land use layer. This layer records land use for 2001 and
therefore does not include subsequent dairy conversions. Note that other land
uses includes some grazed tussock.
Figure 6.3. Land Use Capability classes for the Oreti catchment (source, LRI;
Newsome, 1995). Pastoral LUC classes (1-4) used to develop the mitigation
scenarios are mapped in green.
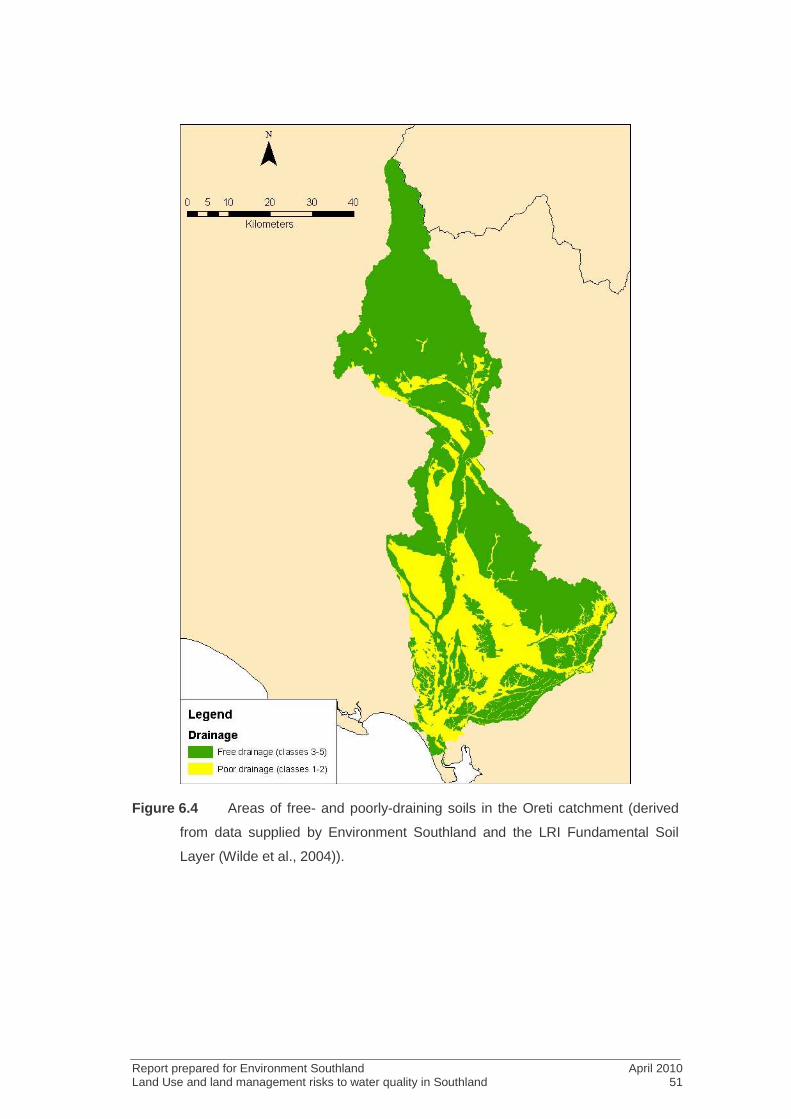
Report prepared for Environment Southland April 2010 Land Use and land management risks to water quality in Southland 51
Figure 6.4 Areas of free- and poorly-draining soils in the Oreti catchment (derived
from data supplied by Environment Southland and the LRI Fundamental Soil
Layer (Wilde et al., 2004)).
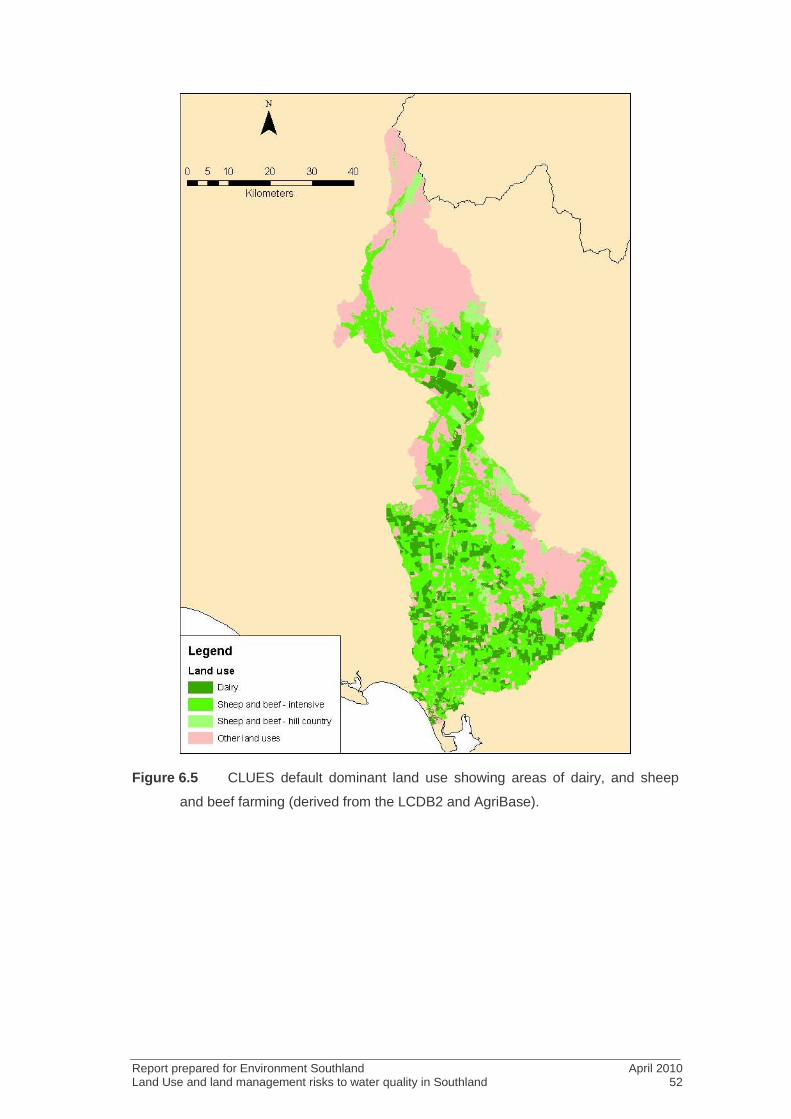
Report prepared for Environment Southland April 2010 Land Use and land management risks to water quality in Southland 52
Figure 6.5 CLUES default dominant land use showing areas of dairy, and sheep
and beef farming (derived from the LCDB2 and AgriBase).
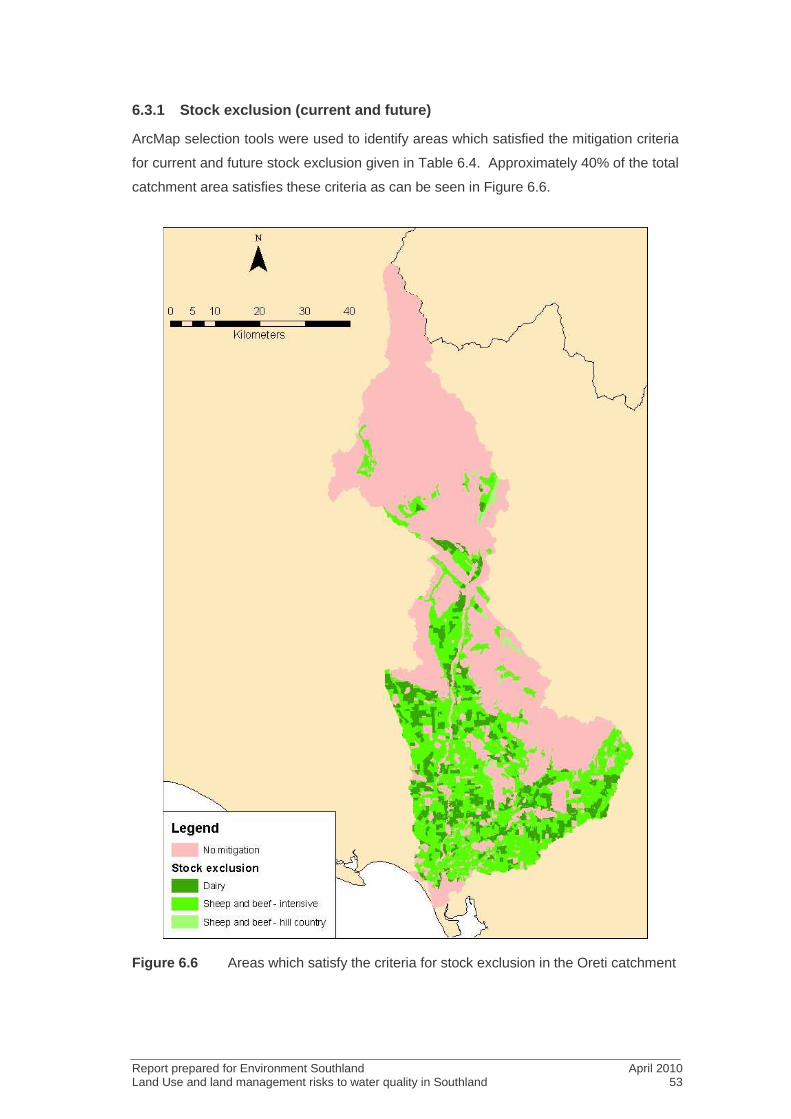
Report prepared for Environment Southland April 2010 Land Use and land management risks to water quality in Southland 53
6.3.1 Stock exclusion (current and future)
ArcMap selection tools were used to identify areas which satisfied the mitigation criteria
for current and future stock exclusion given in Table 6.4. Approximately 40% of the total
catchment area satisfies these criteria as can be seen in Figure 6.6.
Figure 6.6 Areas which satisfy the criteria for stock exclusion in the Oreti catchment

Report prepared for Environment Southland April 2010 Land Use and land management risks to water quality in Southland 54
6.3.2 Nitrification inhibitors
Nitrification inhibitors were applied to areas in LUC classes 1-4 that were either dairy or
intensive sheep and beef farming. For areas with an LUC of 1-3, nitrification inhibitors
were applied in addition to current stock exclusion. Approximately 50% of the total
catchment area, marked in green on Figure 6.7, satisfies the criteria for nitrification
inhibitors given in Table 6.4.
Figure 6.7 Areas which satisfy the criteria for nitrification inhibitors (with and without
current stock exclusion).
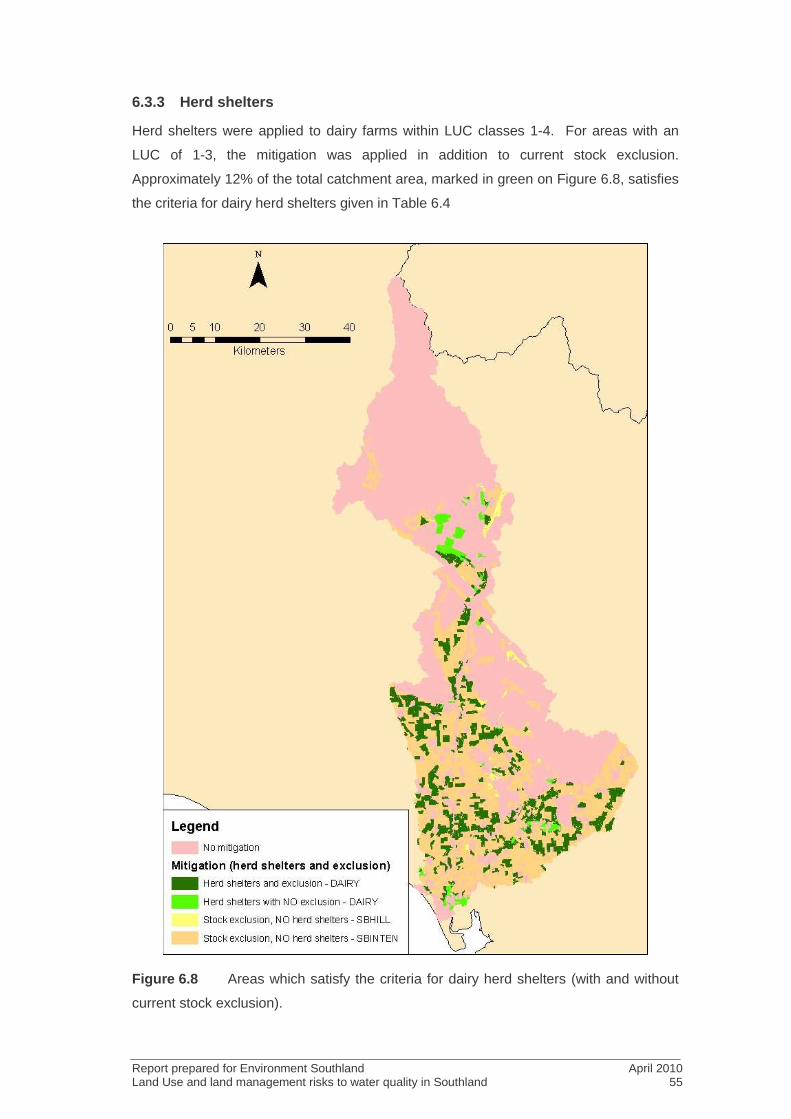
Report prepared for Environment Southland April 2010 Land Use and land management risks to water quality in Southland 55
6.3.3 Herd shelters
Herd shelters were applied to dairy farms within LUC classes 1-4. For areas with an
LUC of 1-3, the mitigation was applied in addition to current stock exclusion.
Approximately 12% of the total catchment area, marked in green on Figure 6.8, satisfies
the criteria for dairy herd shelters given in Table 6.4
Figure 6.8 Areas which satisfy the criteria for dairy herd shelters (with and without
current stock exclusion).
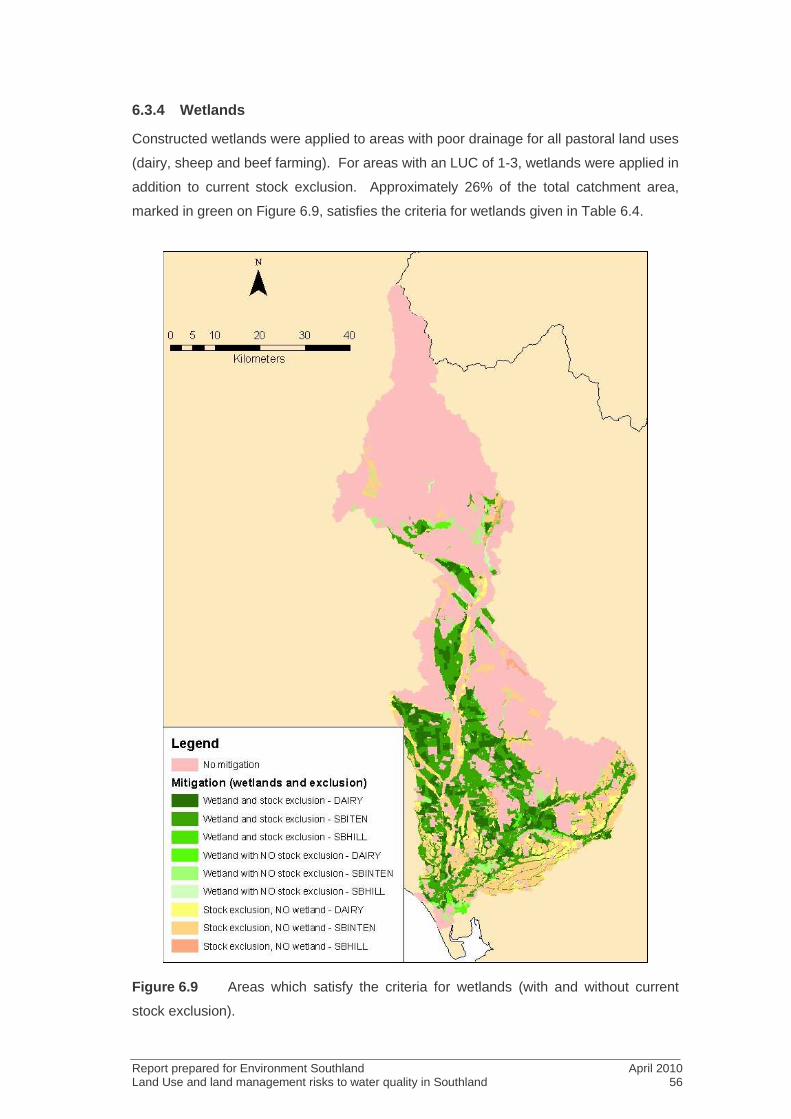
Report prepared for Environment Southland April 2010 Land Use and land management risks to water quality in Southland 56
6.3.4 Wetlands
Constructed wetlands were applied to areas with poor drainage for all pastoral land uses
(dairy, sheep and beef farming). For areas with an LUC of 1-3, wetlands were applied in
addition to current stock exclusion. Approximately 26% of the total catchment area,
marked in green on Figure 6.9, satisfies the criteria for wetlands given in Table 6.4.
Figure 6.9 Areas which satisfy the criteria for wetlands (with and without current
stock exclusion).
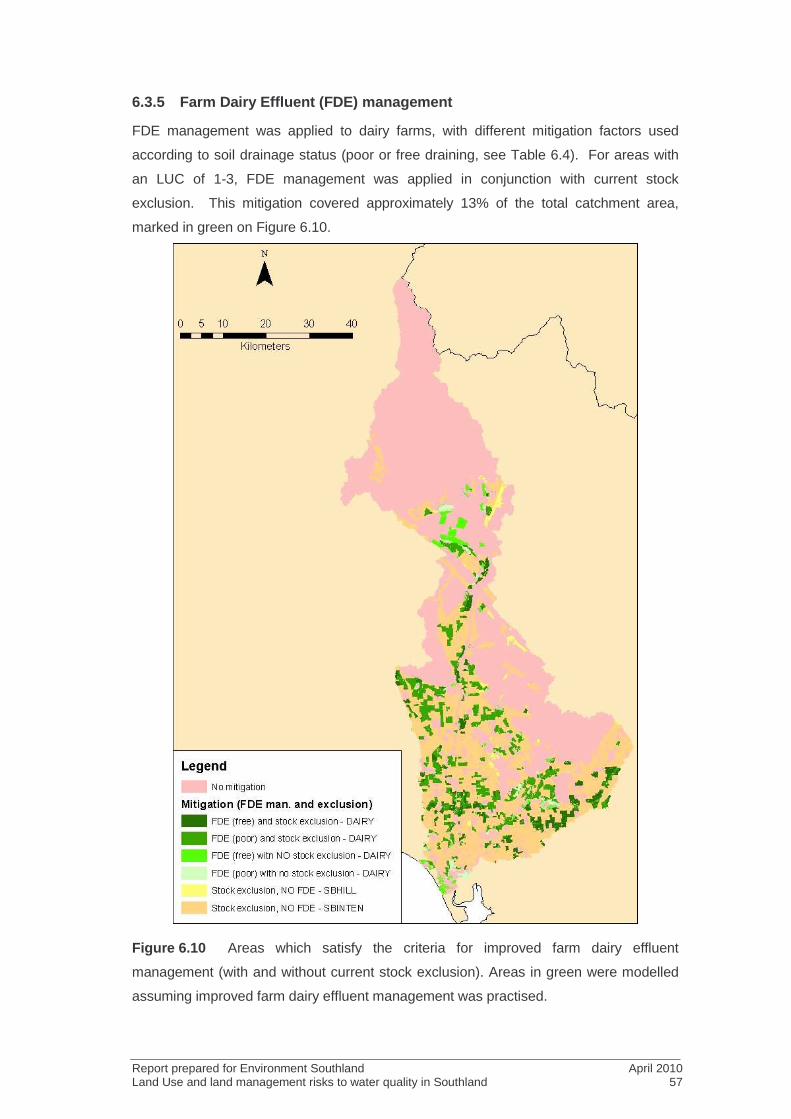
Report prepared for Environment Southland April 2010 Land Use and land management risks to water quality in Southland 57
6.3.5 Farm Dairy Effluent (FDE) management
FDE management was applied to dairy farms, with different mitigation factors used
according to soil drainage status (poor or free draining, see Table 6.4). For areas with
an LUC of 1-3, FDE management was applied in conjunction with current stock
exclusion. This mitigation covered approximately 13% of the total catchment area,
marked in green on Figure 6.10.
Figure 6.10 Areas which satisfy the criteria for improved farm dairy effluent
management (with and without current stock exclusion). Areas in green were modelled
assuming improved farm dairy effluent management was practised.
Report prepared for Environment Southland April 2010 Land Use and land management risks to water quality in Southland 58
6.4 Model results and discussion
Results from the CLUES default and mitigation scenario runs are given in Table 6.5 and
Figures 6.11 and Figure 6.12. Table 6.5 gives the water quality indicator values
simulated for Oreti River terminal reach (NZ reach number 15060397) which flows into
the Oreti tidal inlet. The loads and yields are in-stream values, which mean that they
represent the cumulative totals, less losses and attenuation, of the reach and up-stream
tributaries. The calculation of concentration is fairly new to CLUES (see Semadeni-
Davies et al., 2009b), and is a median concentration which represents concentrations for
typical flow conditions.
The greatest decrease in simulated TN is achieved with the nitrification inhibitor
scenario; this is not surprising given that 50% of the catchment meets the criteria for
inhibitor application and inhibitors have the highest TN decrease factor. However,
nitrogen inhibitors do not decrease TP or E. coli. Herd shelters and wetlands offer
decreases in TN of around 15%. The decreases in TN simulated with the future stock
exclusion and improved FDE management scenarios are only slightly greater, with
respect to the default load and concentration, than those that could be expected with
current stock exclusion alone.
For TP, the future stock exclusion scenario gives the greatest decrease in TP, but the
differences between the different scenarios are not great and there is generally little
decrease over what can be expected with current stock exclusion alone.
The greatest decrease in simulated E. coli is achieved by wetlands, followed by
improved FDE management. As with TP, it is assumed that the use of nitrification
inhibitors does not decrease E. coli beyond the decrease achieved by current stock
exclusion.
Figure 6.11 and Figure 6.12 give an indication of the nutrient sources and areas which
can expect the greatest nutrient decreases under the different mitigation scenarios. The
spatial pattern of yield decreases is related to the areal extent of the scenarios (see
Section 6.3) and their mitigation factors (Table 6.4) respectively. The areas with the
highest default-generated yields largely coincide with areas with pastoral land use (see
Figure 6.5). It should be noted that for TN, the only sub-catchments with a generated
yield greater than 60 kg ha-1 yr-1 contained point sources (i.e., two meat-works and a
sewage outflow) discharging to the stream network. These sub-catchments similarly
had the greatest TP generated yields (i.e., >4 kg ha-1 yr-1). As the affected sub-
catchments were small, the point sources have been marked to show their location.
Nitrification inhibitors had the greatest spatial decrease in TN generated yields
catchment wide, which reflects this scenario's widespread application. This mitigation
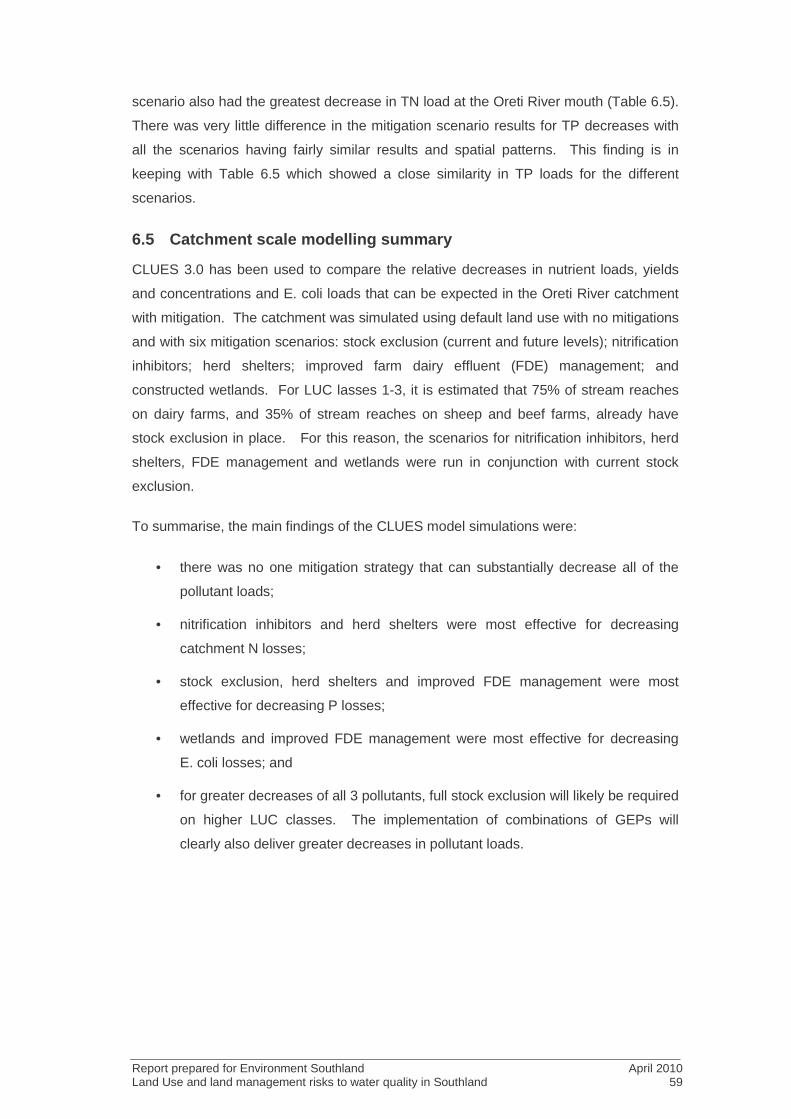
Report prepared for Environment Southland April 2010 Land Use and land management risks to water quality in Southland 59
scenario also had the greatest decrease in TN load at the Oreti River mouth (Table 6.5).
There was very little difference in the mitigation scenario results for TP decreases with
all the scenarios having fairly similar results and spatial patterns. This finding is in
keeping with Table 6.5 which showed a close similarity in TP loads for the different
scenarios.
6.5 Catchment scale modelling summary
CLUES 3.0 has been used to compare the relative decreases in nutrient loads, yields
and concentrations and E. coli loads that can be expected in the Oreti River catchment
with mitigation. The catchment was simulated using default land use with no mitigations
and with six mitigation scenarios: stock exclusion (current and future levels); nitrification
inhibitors; herd shelters; improved farm dairy effluent (FDE) management; and
constructed wetlands. For LUC lasses 1-3, it is estimated that 75% of stream reaches
on dairy farms, and 35% of stream reaches on sheep and beef farms, already have
stock exclusion in place. For this reason, the scenarios for nitrification inhibitors, herd
shelters, FDE management and wetlands were run in conjunction with current stock
exclusion.
To summarise, the main findings of the CLUES model simulations were:
• there was no one mitigation strategy that can substantially decrease all of the
pollutant loads;
• nitrification inhibitors and herd shelters were most effective for decreasing
catchment N losses;
• stock exclusion, herd shelters and improved FDE management were most
effective for decreasing P losses;
• wetlands and improved FDE management were most effective for decreasing
E. coli losses; and
• for greater decreases of all 3 pollutants, full stock exclusion will likely be required
on higher LUC classes. The implementation of combinations of GEPs will
clearly also deliver greater decreases in pollutant loads.
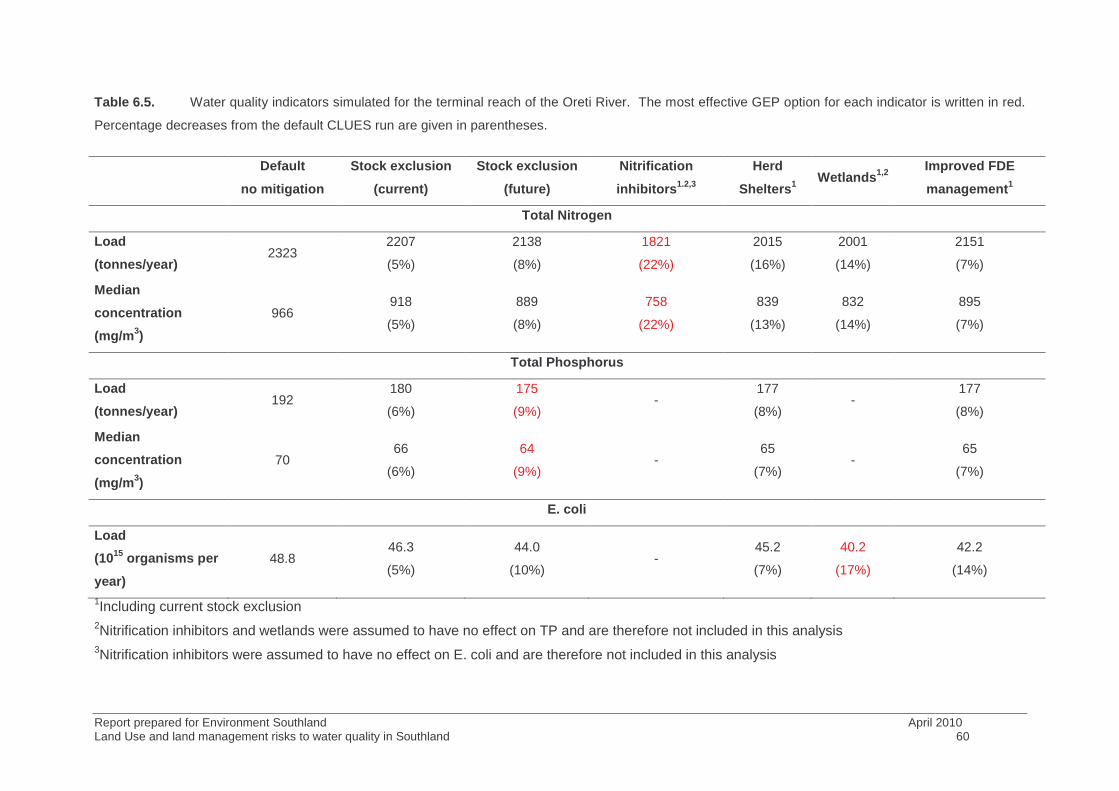
Report prepared for Environment Southland April 2010 Land Use and land management risks to water quality in Southland 60
Table 6.5. Water quality indicators simulated for the terminal reach of the Oreti River. The most effective GEP option for each indicator is written in red.
Percentage decreases from the default CLUES run are given in parentheses.
Default
no mitigation
Stock exclusion
(current)
Stock exclusion
(future)
Nitrification
inhibitors1.2,3
Herd
Shelters1 Wetlands1,2
Improved FDE
management1
Total Nitrogen
Load
(tonnes/year) 2323
2207
(5%)
2138
(8%)
1821
(22%)
2015
(16%)
2001
(14%)
2151
(7%)
Median
concentration
(mg/m3)
966 918
(5%)
889
(8%)
758
(22%)
839
(13%)
832
(14%)
895
(7%)
Total Phosphorus
Load
(tonnes/year) 192
180
(6%)
175
(9%) -
177
(8%) -
177
(8%)
Median
concentration
(mg/m3)
70 66
(6%)
64
(9%) -
65
(7%) -
65
(7%)
E. coli
Load
(1015 organisms per
year)
48.8 46.3
(5%)
44.0
(10%) -
45.2
(7%)
40.2
(17%)
42.2
(14%)
1Including current stock exclusion 2Nitrification inhibitors and wetlands were assumed to have no effect on TP and are therefore not included in this analysis 3Nitrification inhibitors were assumed to have no effect on E. coli and are therefore not included in this analysis
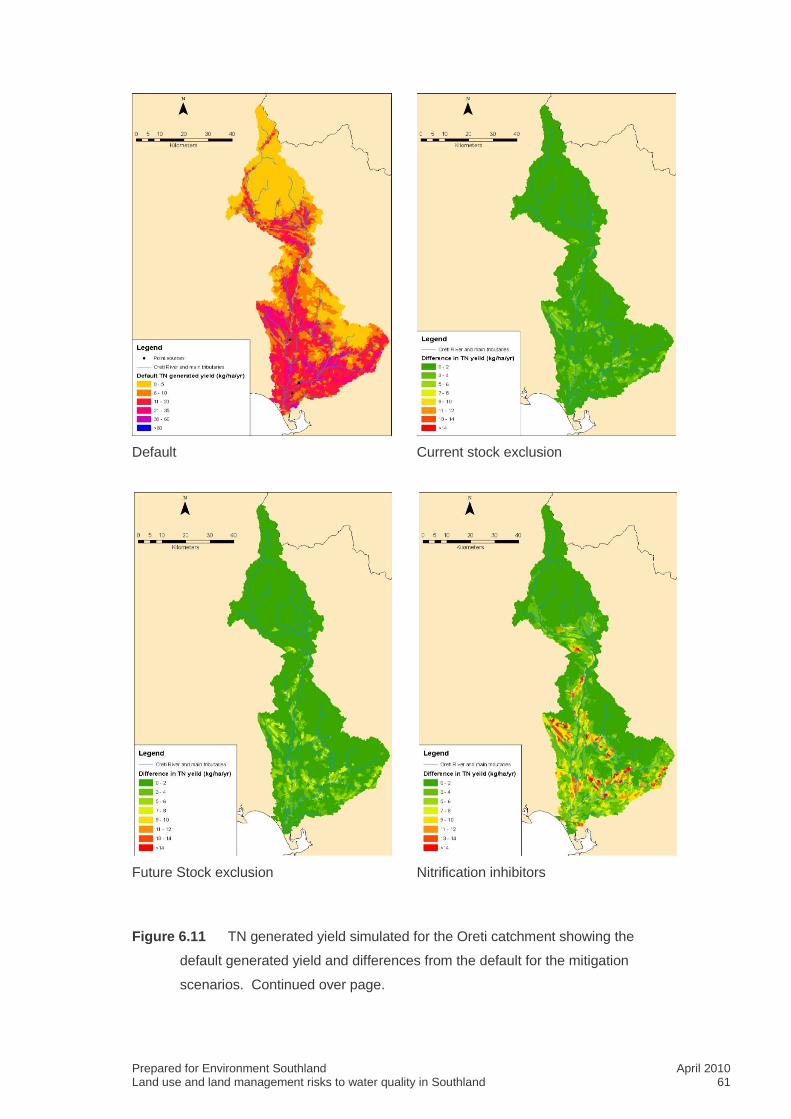
Prepared for Environment Southland April 2010 Land use and land management risks to water quality in Southland 61
Default
Current stock exclusion
Future Stock exclusion
Nitrification inhibitors
Figure 6.11 TN generated yield simulated for the Oreti catchment showing the
default generated yield and differences from the default for the mitigation
scenarios. Continued over page.
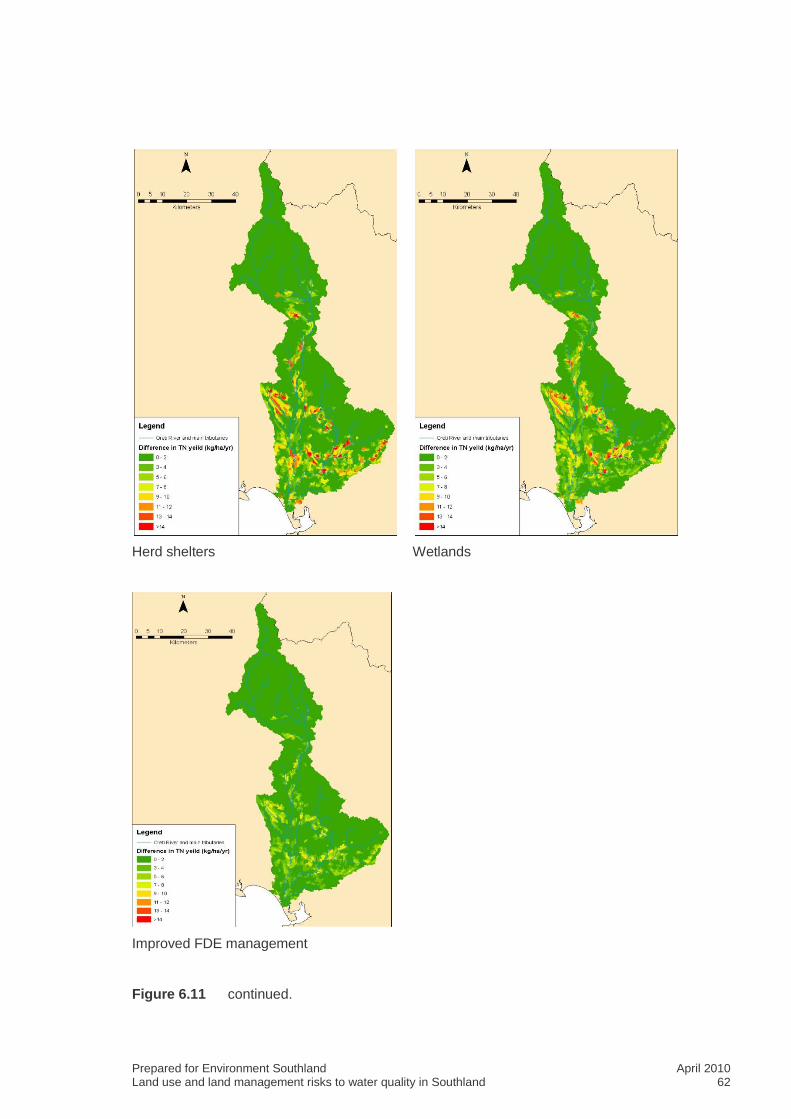
Prepared for Environment Southland April 2010 Land use and land management risks to water quality in Southland 62
Herd shelters
Wetlands
Improved FDE management
Figure 6.11 continued.
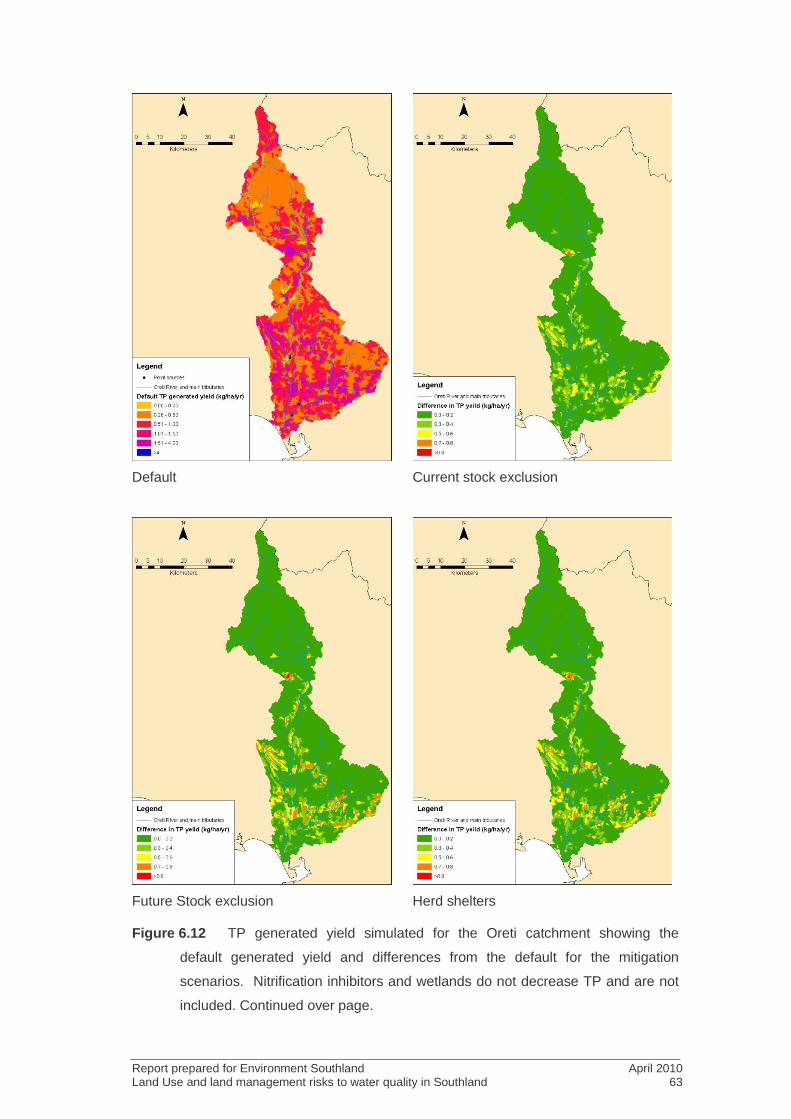
Report prepared for Environment Southland April 2010 Land Use and land management risks to water quality in Southland 63
Default
Current stock exclusion
Future Stock exclusion
Herd shelters
Figure 6.12 TP generated yield simulated for the Oreti catchment showing the
default generated yield and differences from the default for the mitigation
scenarios. Nitrification inhibitors and wetlands do not decrease TP and are not
included. Continued over page.
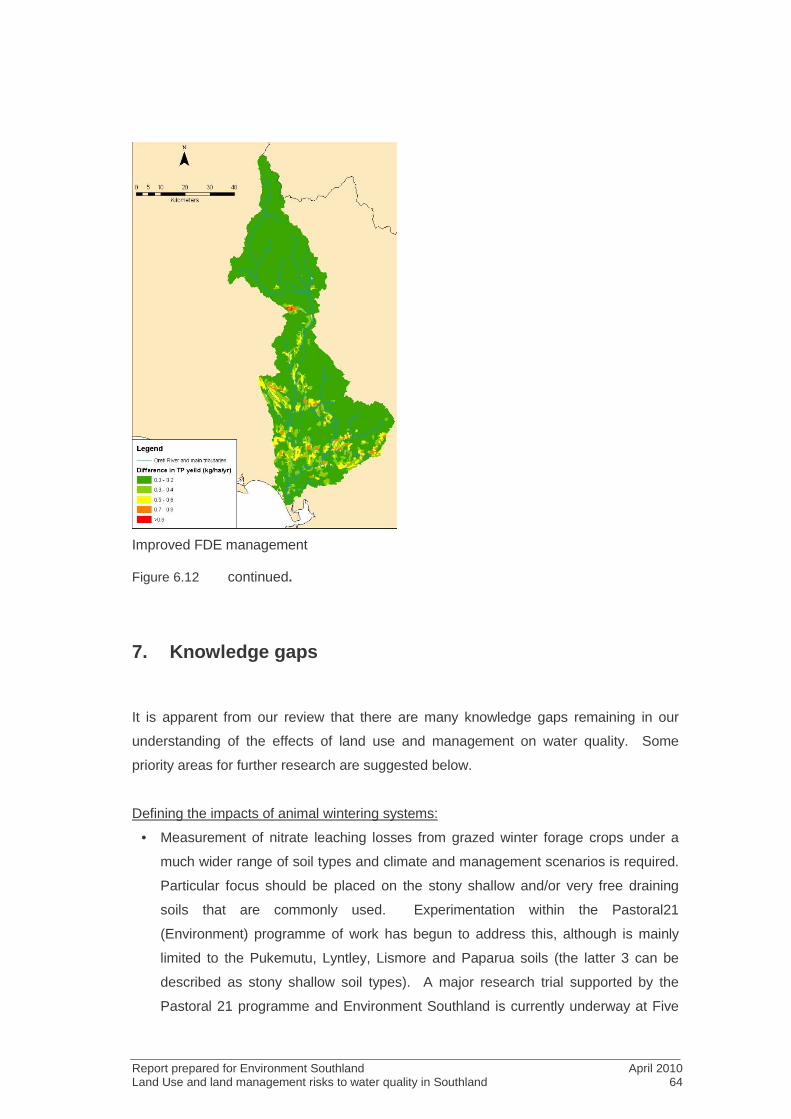
Report prepared for Environment Southland April 2010 Land Use and land management risks to water quality in Southland 64
Improved FDE management
Figure 6.12 continued.
7. Knowledge gaps
It is apparent from our review that there are many knowledge gaps remaining in our
understanding of the effects of land use and management on water quality. Some
priority areas for further research are suggested below.
Defining the impacts of animal wintering systems:
• Measurement of nitrate leaching losses from grazed winter forage crops under a
much wider range of soil types and climate and management scenarios is required.
Particular focus should be placed on the stony shallow and/or very free draining
soils that are commonly used. Experimentation within the Pastoral21
(Environment) programme of work has begun to address this, although is mainly
limited to the Pukemutu, Lyntley, Lismore and Paparua soils (the latter 3 can be
described as stony shallow soil types). A major research trial supported by the
Pastoral 21 programme and Environment Southland is currently underway at Five

Report prepared for Environment Southland April 2010 Land Use and land management risks to water quality in Southland 65
Rivers to provide data relevant to shallow stony soils in Northern Southland. At
completion, it will provide 3 full years of leaching data under treatments of with and
without a nitrification inhibitor (DCD) applied.•
• A better understanding is required of flow pathways and the factors that contribute
to the variability evident where loads of P and sediment have been documented
under winter forage grazing.
• There is only one limited, small scale runoff plot study reporting the role of grazed
winter forage crops as sources of E. coli. As noted for P, a better understanding of
flow pathways and yields of E. coli in runoff from these crops is required.
Improving our understanding of contaminant losses to water from dry stock farms:
• Field experimental data documenting contaminant losses to water from dry stock
farms is sparse, and the little information we do have mostly comes from trials
conducted near Palmerston North. There is a need for more datasets, under a
broader range of climate and landscape features, and documenting losses of
multiple contaminants. Assessments of the relative effects of dry stock classes
against dairy land use would be especially helpful, particularly for P, sediment and
E. coli losses.
Improving our understanding of contaminant losses to water from horticultural farms:
• To the authors knowledge, no data is available that documents contaminant losses
to water from intensive horticultural operations such as bulb production. Given its
growing prevalence in Southland, this is an important knowledge gap that needs to
be addressed.
Better description of spatial and temporal patterns of contaminant losses:
• Our current modelling frameworks do not adequately account for spatial and
temporal variability in contaminant losses from farms. Improved understanding of
this variability is important if we are to better define when mitigation practices will
have their greatest effect (e.g. the case for stock exclusion, as described in section
4.2) and where mitigations should be targeted (the CSA management concept).
FRST-funded research programmes are currently being proposed to address these
issues. These improved understandings are required if we are to ensure we get the
greatest value from mitigation expenditure.
More detailed CLUES modelling of current and future land uses
The CLUES modelling analysis has highlighted two issues which could be addressed
with further CLUES simulation:
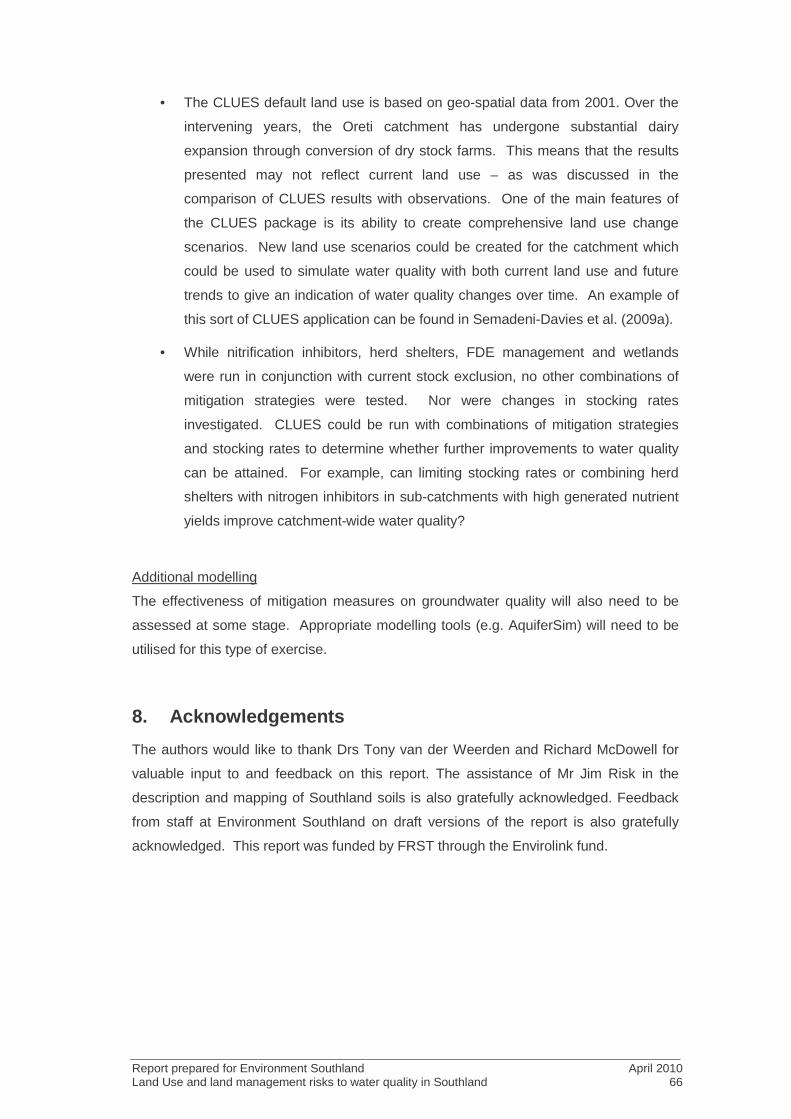
Report prepared for Environment Southland April 2010 Land Use and land management risks to water quality in Southland 66
• The CLUES default land use is based on geo-spatial data from 2001. Over the
intervening years, the Oreti catchment has undergone substantial dairy
expansion through conversion of dry stock farms. This means that the results
presented may not reflect current land use – as was discussed in the
comparison of CLUES results with observations. One of the main features of
the CLUES package is its ability to create comprehensive land use change
scenarios. New land use scenarios could be created for the catchment which
could be used to simulate water quality with both current land use and future
trends to give an indication of water quality changes over time. An example of
this sort of CLUES application can be found in Semadeni-Davies et al. (2009a).
• While nitrification inhibitors, herd shelters, FDE management and wetlands
were run in conjunction with current stock exclusion, no other combinations of
mitigation strategies were tested. Nor were changes in stocking rates
investigated. CLUES could be run with combinations of mitigation strategies
and stocking rates to determine whether further improvements to water quality
can be attained. For example, can limiting stocking rates or combining herd
shelters with nitrogen inhibitors in sub-catchments with high generated nutrient
yields improve catchment-wide water quality?
Additional modelling
The effectiveness of mitigation measures on groundwater quality will also need to be
assessed at some stage. Appropriate modelling tools (e.g. AquiferSim) will need to be
utilised for this type of exercise.
8. Acknowledgements
The authors would like to thank Drs Tony van der Weerden and Richard McDowell for
valuable input to and feedback on this report. The assistance of Mr Jim Risk in the
description and mapping of Southland soils is also gratefully acknowledged. Feedback
from staff at Environment Southland on draft versions of the report is also gratefully
acknowledged. This report was funded by FRST through the Envirolink fund.
Report prepared for Environment Southland April 2010 Land Use and land management risks to water quality in Southland 67
9. References
Adams JA, Pattinson JM (1984) Nitrate leaching losses under a legume-based crop
rotation in Central Canterbury, New Zealand. New Zealand Journal of Agricultural
Research 28, 101-107.
Aislabie J, Smith JJ, Fraser R, McLeod M (2001) Leaching of bacterial indicators of
faecal contamination through four New Zealand soils. Australian Journal of Soil
Research 39, 1397-1406.
Alexander, RB, Elliott, S.; Ude Shankar; McBride, G.B. (2002). Estimating the sources of
nutrients in the Waikato River Basin, New Zealand. Water Resources Research
38(12): 1268–1280.
Bagshaw, C.S. (2002) Factors influencing direct deposition of cattle faecal material in
riparian zones. MAF (New Zealand Ministry of Agriculture and Forestry) Technical
Paper No. 2002/19. http://www.maf.govt.nz/mafnet/rural-nz/sustainable-resource-
use/resource-management/cattle-faecal-material/index.htm (accessed 22 March
2007).
Ballantine, DJ, Davies Colley, RJ (2009). Water quality trends at NRWQN sites for 1989-
2007. NIWA Client Report HAM2009-026. Ministry for the Environment, Wellington.
39 p.p.
Belsky, A.J. Matzke, A. and Uselman, S. (1999) Survey of livestock influences on
stream and riparian ecosystems in the western United States. Journal of Soil and
Water Conservation 54, 419-431.
Betteridge K, Hoogendoorn CJ, Thorrold BS, Costall DA, Ledgard SF, Park-Ng ZA,
Theobald PW (2007) Nitrate leaching and productivity of some farming options in the
Lake Taupo catchment. Proceedings of the New Zealand Grasslands Association 69,
123-129.
Byers, H.L. Cabrera, M.L. Matthews, M.K. Franklin, D.H. Andrae, J.G. Radcliffe, D.E.
McCann, M.A. Kuykendall, H.A. Hoveland, C.S. and Calvert, V.H. (2005)
Phosphorus, sediment, and Escherichia coli loads in unfenced streams of the
Georgia Piedmont, USA. Journal of Environmental Quality 34, 2293-2300.
Cameron, K.C., Di, H.J., Moir, J. 2008. Nitrate leaching results on Lincoln University
dairy farm. Information handout from the Focus day at the Lincoln university dairy
farm, 8 May 2008. http://www.siddc.org.nz/docs/FDayHandoutMay08.pdf (accessed
20.11.2009).
Report prepared for Environment Southland April 2010 Land Use and land management risks to water quality in Southland 68
Close M, Dann R, Ball A, Pirie R, Savill M, Smith Z (2008) Microbial groundwater quality
and its health implications for a border-strip irrigated dairy farm catchment, South
Island, New Zealand. Journal of Water and Health 6, 83-98.
Close, ME, Pang, L, Magesan, GN, Lee, R, Green, SR (2003). Field study of pesticide
leaching in an allophanic soil in New Zealand. 2: Comparison of simulations from four
leaching models. Australian Journal of Soil Research 41, 825–846.
Cooper, A.B., Thomsen, C.E., 1988. Nitrogen and phosphorus in streamwaters from
adjacent pasture, pine and native forest catchments. N. Z. J. Marine Freshwater
Res. 22, 279-291.
Davies-Colley, R.J., E. Lydiard and J.W. Nagels (2008) Stormflow-dominated loads of
faecal pollution from an intensively dairy-farmed catchment. Water Science and
Technology 57(10): 1519-1523.
Davies-Colley, R.J., J.W. Nagels, R.A. Smith, R.G. Young and C.J. Phillips (2004)
Water quality impact of a dairy cow herd crossing a stream. New Zealand Journal of
Marine and Freshwater Research 38: 569-576.
de Klein, C.A.M., Smith, L.C. and Monaghan, R.M. 2006. Restricted autumn grazing to
decrease nitrous oxide emissions from dairy pastures in Southland, New Zealand.
Agriculture, Ecosystems & Environment 112: 192-199
Di, H,J. and Cameron, K.C. (2002a) Nitrate leaching in temperate agroecosystems:
sources, factors and mitigating strategies. Nutrient Cycling in Agroecosystems 64,
237-256.
Di, H.J. and Cameron, K.C. (2002b). Nitrate leaching and pasture production from
different nitrogen sources on a shallow stony soil under flood irrigated dairy pasture.
Australian Journal of Soil Research 40, 317-334.
Elliott, A.H.; Alexander, R.B.; Schwarz, G.E.; Shankar, U; Sukias, J.P.S.; McBride, G.B.
(2005). Estimation of nutrient sources and transport for New Zealand using the hybrid
mechanistic–statistical model SPARROW. Journal of Hydrology (NZ) 44(1): 1–27.
Elliott, A.H.; Alexander, R.B.; Schwarz, G.E.; Shankar, U; Sukias, J.P.S.; McBride, G.B.
(2005). Estimation of nutrient sources and transport for New Zealand using the hybrid
mechanistic–statistical model SPARROW. Journal of Hydrology (NZ) 44(1): 1–27.
Elliott, A.H.; Shankar, U.; Hicks, D.M.; Woods, R.A.; and Dymond, J.R. (2008)
SPARROW regional regression for sediment yields in New Zealand rivers. Sediment
Dynamics in Changing Environments (Proceedings of a symposium held in
Christchurch, New Zealand, December 2008). IAHS Publ. 325, 2008.
Report prepared for Environment Southland April 2010 Land Use and land management risks to water quality in Southland 69
Elliott, A.H.; Shankar, U.; Hicks, D.M.; Woods, R.A.; and Dymond, J.R. (2008)
SPARROW regional regression for sediment yields in New Zealand rivers. Sediment
Dynamics in Changing Environments (Proceedings of a symposium held in
Christchurch, New Zealand, December 2008). IAHS Publ. 325, 2008.
Environment Court 2008. Interim decision of the Environment Court. Decision No. A
123/2008, concerning land use effects on Lake Taupo Water Quality.
FAR (2008). Millenium Tillage Trial – Nitrate leaching over winter (2001-2007).
Foundation for Arable Research Factsheet No. 80, July 2008.
Francis, G.S., Trimmer, L.A., Tregurtha, C.S., Williams, P.H., Butler, R.C. (2003). Winter
nitrate leaching losses from three land uses in the Pukekohe area of New Zealand.
New Zealand Journal of Agricultural Research 46, 215-224.
Francis, G.S. (1995). Management practices for minimising nitrate leaching after
ploughing temporary leguminous pastures in Canterbury, New Zealand. Journal of
Contaminant Hydrology 20, 313-327.
Francis, G.S., Haynes, R.J., Speir, T.W., Williams, P.H. (1995a). The effects of a
nitrification inhibitor on leaching losses and recovery of mineralized nitrogen by a
wheat crop after ploughing-in temporary leguminous pastures. Fertilizer Research
41, 33-39.
Francis, G.S., Haynes, R.J., Williams, P.H. (1995b). Effects of the timing of ploughing-in
temporary leguminous pastures and two winter cover crops on nitrogen
mineralization, nitrate leaching and spring wheat growth. Journal of Agricultural
Science 124, 1-9.
Francis, G.S., Haynes, R.J., Williams, P.H. (1994). Nitrogen mineralization, nitrate
leaching and crop growth after ploughing-in leguminous and non-leguminous grain
crop residues. Journal of Agricultural Science 123, 81-87.
Francis, G.S., Haynes, R.J., Sparling, G.P., Ross, D.J., Williams, P.H. (1992). Nitrogen
mineralization, nitrate leaching and crop growth following cultivation of a temporary
leguminous pasture in autumn and winter. Fertilizer Research 33, 59-70.
Fraser, M. Cameron, K.C. and Sherlock, R.R. (1994) Lysimeter study of the fate of
nitrogen in animal urine returns to irrigated pasture. European Journal of Soil Science
45, 439-447.
Haygarth, P.M. Hepworth, L. and Jarvis, S.C. (1998) Forms of phosphorus transfer in
hydrological pathways from soil under grazed grassland. European Journal of Soil
Science 49, 65-72.
Report prepared for Environment Southland April 2010 Land Use and land management risks to water quality in Southland 70
Haygarth, P.M., Jarvis, S.C. (1999) Transfer of phosphorus from agricultural soils.
Advances in Agronomy 66, 195-249.
Haynes, R.J. and Williams, P.H. (1993) Nutrient cycling and soil fertility in the grazed
pasture ecosystem. Advances in Agronomy 49, 119-199
Heng L. K., White R. E., Bolan N. S. and Scotter D. R. (1991) Leaching losses of major
nutrients from a mole-drained soil under pasture. New Zealand Journal of Agricultural
Research 34 325-334.
Hewitt, A.; Stephens, P. 2002: EnSus: integrated spatial risk analysis framework for
determining best management practices for environmental sustainability. Soil
Horizons 8: 9–10.
Hickey, C.W. Quinn, J.M. and Davies-Colley, R.J. (1989) Effluent characteristics of
dairy shed oxidation ponds and their potential impacts on rivers. New Zealand
Journal of Marine and Freshwater Research 23, 569-584.
Hooda, P.S. Moynagh, M. Svoboda, I.F. Edwards, A.C. Anderson, H.A. and Sym, G.
(1999) Phosphorus loss in drainflow from intensively managed grassland soils.
Journal of Environmental Quality 28, 1235-1242.
Hoogendoorn, C.J., Betteridge, K., Ledgard, S.F.,Costall, D.A., Park, Z. A., Theobald, P.
W. 2010. Nitrogen leaching from sheep, cattle and deer grazed pastures in the Lake
Taupo catchment in New Zealand. Paper in preparation
Houlbrooke DJ, Horne DJ, Hedley MJ, Snow VO, Hanly JA (2008) Land application of
farm dairy effluent to a mole and pipe drained soil: implications for nutrient
enrichment of winter-spring drainage. Australian Journal of Soil Research 46, 45-52.
Houlbrooke DJ, Monaghan RM (2009) The influence of soil drainage characteristics on
contaminant leakage risk associated with the land application of farm dairy effluent.
AgResearch Client Report for Environment Southland. 28p.
Houlbrooke DL, Horne DJ, Hedley MJ, Hanley JA, Snow VO (2003) The impact of
intensive dairy farming on the leaching losses of nitrogen and phosphorus from a
mole and pipe drained soil. In 'Proceedings of the New Zealand Grassland
Association' pp. 179-184.
James, E. Kleinman, P. Veith, T. Stedman, R. and Sharpley, A. (2007). Phosphorus
contributions from pastured dairy cattle to streams of the Cannonsville Watershed,
New York. Journal of Soil and Water Conservation 62, 40-47.
Kleinman, P.J.A. Wolf, A.M. Sharpley, A.N. Beegle, D.B. and Saporito, L.S. (2005)
Survey of water-extractable phosphorus in livestock manures. Soil Science Society of
America Journal 69, 701-708.
Report prepared for Environment Southland April 2010 Land Use and land management risks to water quality in Southland 71
Ledgard, S.F. Penno, J.W. and Sprosen, M.S. (1999) Nitrogen inputs and losses from
clover/grass pastures grazed by dairy cows, as affected by nitrogen fertilizer
application. Journal of Agricultural Science, Cambridge 132, 215-225.
Ledgard, S.F. (2001) Nitrogen cycling in low input legume-based agriculture, with
emphasis on legume/grass pastures. Plant and Soil 228, 43-59.
Lilburne, L.R., Webb, T.H., Francis, G.S. (2003). Relative effect of climate, soil, and
management on risk of nitrate leaching under wheat production in Canterbury, New
Zealand. Australian Journal of Soil Research 41, 699-709.
Lynn, I.H., Manderson, A.K., Page, M.J., Harmsworth, G.R., Eyles, G.O., Douglas, G.B.,
Mackay, A.D. and Newsome, P.J.F. (2009) Land Use Capability Survey Handbook –
a New Zealand handbook for the classification of land, 3rd edition. Hamilton,
AgResearch; Lincoln, Landcare Research, Lower Hutt, GNS Science. 163p.
MAF 2007. Pastoral Monitoring Report 2007. NZ Ministry of Agriculture and Forestry
http://www.maf.govt.nz/mafnet/rural-nz/statistics-and-forecasts/farm-
monitoring/2007/pastoral/ (accessed 15 February 2009).
Magesan G. N., White R. E. and Scotter D. R. (1996) Nitrate leaching from a drained,
sheep-grazed pasture. I. Experimental results and environmental implications.
Australian Journal of Soil Research 34 55-67
Magesan G. N., White R. E., Scotter D. R. and Bolan N. S. (1994) Estimating leaching
losses from sub-surface drained soils. Soil Use and Management 10 87-93
McDowell R.W. (2009a) Maintaining good water and soil quality in catchments
containing deer farms. Int. J. River Basin Mgmt 7:187-195
McDowell RW (2009b) The use of safe wallows to improve water quality in deer farmed
catchments. New Zealand Journal of Agricultural Research 52, 81-90.McDowell
(2009b). NZJAR 52: 81-90
McDowell, R.W. (2008) Water quality of a stream recently fenced-off from deer. New
Zealand Journal of Agricultural Research, 51: 291-298.
McDowell, R.W., B.J.F. Biggs, A.N. Sharpley and L. Nguyen (2004) Connecting
phosphorus loss from agricultural landscapes to surface water quality. Chemistry and
Ecology 20: 1-40.
McDowell, R.W., D.J. Houlbrooke, R.W. Muirhead, K. Muller, M. Shepherd and S.P.
Cuttle (2008) Grazed pastures and surface water quality. Nova Science Publishers
Inc, New York (238p).

Report prepared for Environment Southland April 2010 Land Use and land management risks to water quality in Southland 72
McDowell RW, Houlbrooke DJ (2008) Phosphorus, nitrogen and sediment losses from
irrigated cropland and pasture grazed by cattle and sheep. Proceedings of the New
Zealand Grassland Association 70, 77-83.
McDowell, R.W., Monaghan, R.M., Smith, L.C., Koopmans, G.F., Stewart, I. (2005)
Enhanced losses of phosphorus in mole-tile drainage water following short-term
applications of dairy effluent to pasture. In Water Pollution: New Research (A.R.
Burk, Ed.), Nova Science Publishers, Hauppage, NY. Pp. 55-76.
McDowell RW, Nash DM, Robertson F (2007) Sources of phosphorus lost from a grazed
pasture soil receiving simulated rainfall. Journal of Environmental Quality 36:1281-
1288.
McDowell RW, Rowley D (2008) The fate of phosphorus under contrasting border-check
irrigation regimes. Australian Journal of Soil Research 46:309-314.
McDowell, R.W, and M.S. Srinivasan (2009) Identifying critical source areas for water
quality: 2. Validating the approach for phosphorus and sediment losses in grazed
headwater catchments. Journal of Hydrology 379, 68-80.
McDowell RW, Stevens DR (2008) Potential waterway contamination associated with
wintering deer on pastures and forage crops. New Zealand Journal of Agricultural
Research 51, 287-290.
McDowell RW, Wilcock RJ (2008) Water quality and the effects of different pastoral
animals. New Zealand Veterinary Journal 56, 289-296.
McDowell RW (2007) Water quality in headwater catchments with deer wallows. Journal
of Environmental Quality 36, 1377-1382.
McDowell, R.W. and Wilcock, R.J. (2007) Sources of sediment and phosphorus in
stream flow of a highly productive dairy farmed catchment. Journal of Environmental
Quality 36, 540-548.
McDowell, R.W. and Wilcock, R.J. (2004) Particulate phosphorus transport within
stream flow of an agricultural catchment. Journal of Environmental Quality 33, 2111-
2121.
McKergow, L.A., Tanner, C.C., Monaghan, R.M. 2008. Attenuation toolbox for pastoral
agriculture: selecting the right tool for the job. In: Carbon and Nutrient Management
in Agriculture. (Eds L.D. Currie and L.J. Yates). Occasional Report No. 21, Fertiliser
and Lime Research Centre, Massey University, Palmerston North, New Zealand.
pp.479-494.

Report prepared for Environment Southland April 2010 Land Use and land management risks to water quality in Southland 73
McLeod M, Aislabie J, Ryburn J, McGill A (2008) Regionalising potential for Microbial
bypass flow through New Zealand soils. Journal of Environmental Quality 37, 1959-
1967.
McLeod M, Aislabie J, Ryburn J, McGill A (2004) Microbial and chemical tracer
movement through Granular, Ultic and Recent soils. New Zealand Journal of
Agricultural Research 47, 557-563.
McLeod M, Aislabie J, Ryburn J, McGill A, Taylor M (2003) Microbial and chemical
tracer movement through two Southland soils, New Zealand. Australian Journal of
Soil Research 41, 1163-1169.
McLeod M, Aislabie J, Smith J, Fraser R, Roberts A, Taylor M (2001) Viral and chemical
tracer movement through contrasting soils. Journal of Environmental Quality 30,
2134-2140.
Monaghan, R.M., Houlbrooke, D.J., Smith, L.C. 2010. The use of low-rate sprinkler
application systems for applying Farm Dairy Effluent to land. Paper submitted to
the New Zealand Journal of Agricultural Research.
Monaghan, R.M., Smith, L.C. 2009. Contaminant runoff from dairy farm laneways in the
Bog Burn catchment: Year 1 Results. Client report to SFF, submitted June 2009.
Monaghan, R.M., Smith, L.C., Ledgard, S.F. 2009a. The effectiveness of a granular
formulation of dicyandiamide (DCD) in limiting nitrate leaching from a grazed dairy
pasture. New Zealand Journal of Agricultural Research 52: 145-159.
Monaghan, R.M., Carey, P.L., Wilcock, R.J., Drewry, J.J., Houlbrooke, D.J., Quinn, J.M.,
Thorrold, B.S. 2009b. Linkages between land management activities and stream
water quality in a border dyke-irrigated pastoral catchment. Agriculture, Ecosystems
& Environment 129:201-211.
Monaghan, R.M. 2009. The BMP Toolbox - selecting the right Best Management
Practice for mitigating farming impacts on water quality. In: Nutrient Management in a
Rapidly Changing World. (Eds L.D. Currie and C.L. Lindsay). Occasional Report No.
22, Fertiliser and Lime Research Centre, Massey University, Palmerston North, New
Zealand. pp.328-335.
Monaghan, R.M., de Klein, C.A.M., and Muirhead, R.W. (2008) Prioritisation of farm
scale remediation efforts for decreasing losses of nutrients and faecal indicator
organisms to waterways: a case study of New Zealand dairy farming. Journal of
Environmental Management 87(4): 609-622.
Monaghan, R. M., Wilcock, R. J., Smith, L. C., Tikkisetty, B., Thorrold, B. S. and Costall
D. 2007. Linkages between land management activities and water quality in an
Report prepared for Environment Southland April 2010 Land Use and land management risks to water quality in Southland 74
intensively farmed catchment in southern New Zealand. Agriculture, Ecosystems &
Environment 118:211-222.
Monaghan, R.M., Paton, R.J., Smith, L.C., Drewry, J.J. and Littlejohn, R.P. 2005. The
impacts of nitrogen fertilisation and increased stocking rate on pasture yield, soil
physical condition and nutrient losses in drainage from a cattle-grazed pasture.
New Zealand Journal of Agricultural Research 48: 227-240.
Monaghan, R.M. and Smith, L.C. 2004. Minimising surface water pollution resulting
from farm-dairy effluent application to mole-pipe drained soils. II. The contribution of
preferential flow of effluent to whole-farm pollutant losses in subsurface drainage
from a West Otago dairy farm. New Zealand Journal of Agricultural Research 47:
417-428.
Muirhead R.W., R.J. Davies-Colley, A.M. Donnison and J.W. Nagels (2004) Faecal
bacterial yields in artificial flood events: quantifying in-stream stores. Water
Research 38: 1215-1224.
Muirhead, R.W., Elliott, A.H., Monaghan, R.M. (2010). A framework to assess the effect
of dairy farms and wild fowl on microbial water quality. Manuscript in preparation
Muirhead, R.W., Monaghan, R.M., Donnison, A.M., Ross, C. (2008) Effectiveness of
current best management practices to achieve faecal microbial water quality
standards. In: Carbon and nutrient management in agriculture. (Eds L.D. Currie and
L.J. Yates). Occasional Report No. 21. Fertilizer and Lime Research Centre, Massey
University, Palmerston North, New Zealand. pp. 382-397.
Muirhead, R.W., Houlbrooke, D.J., Monaghan, R.M. (2010). Risk assessment of farm
dairy effluent irrigation systems: faecal indicator organisms. In press Proceedings of
the New Zealand Land Treatment Collective Annual Conference – Managing wastes
in rural and agricultural landscapes, Dunedin, 17-19 March 2010.
Newsome, P.F.J. (1995). Directory of geographic databases within Manaaki Whenua -
Landcare Research. Edition 1. Manaaki Whenua - Landcare Research, Palmerston
North, NZ
Parfitt, R.L.; MacKay, A.D.; Ross, D.J.; Budding, P.J. 2009: Effects of soil fertility on
leaching losses of N, P and C in hill country. New Zealand Journal of Agricultural
Research 52: 69-80.
Parfitt, R.L.; Schipper, L.A.; Baisden, W.T.; Elliott, A.H. (2006). Nitrogen inputs and
outputs for New Zealand in 2001 at national and regional scales. Biogeochemistry
80: 71–88.
Report prepared for Environment Southland April 2010 Land Use and land management risks to water quality in Southland 75
Parshotam, A. and Elliott, S. (2009) Application of CLUES to five monitored dairy
catchments in New Zealand. NIWA Client Report: HAM2009-132. Prepared for
AgResearch.
Quinn, J.M., Croker, G.F., Smith, B.D., Bellingham, M.A. (2009). Integrated catchment
management effects on flow, habitat, instream vegetation and macroinvertebrates in
Waikato, New Zealand, hill-country streams. New Zealand Journal of Marine and
Freshwater Research 43, 775-802.
Quinn, J.M., Ritter, E., 2003. Effects of pine forest logging on stream water and nutrient
yields in a Central North Island catchment. Proceedings of the Rotorua Lakes Water
Quality Society: Practical Management for Good Lake Water Quality. 9 – 10 October
2003, pp143-151.
Quinn, J.M., Stroud, M.J. (2002). Water quality and sediment and nutrient export from
New Zealand hill-land catchments of contrasting land use. New Zealand Journal of
Marine and Freshwater Research 36(2): 409-429.
Rosen, M.R., Reeves, R.R., Green, S.R., Clothier, B.E., Ironside, N. (2004). Prediction
of groundwater nitrate concentration contamination after closure of an unlined sheep
feed lot in New Zealand. Vadose Zone Journal 3: 990–1006.
Ruz Jerez B. E., White R. E. and Ball P. R. (1995) A comparison of nitrate leaching
under clover-based pastures and nitrogen-fertilized grass grazed by sheep. Journal
of Agricultural Science 125 361-369.
Sarmah, A.J.; Close, M.E.; Pang, L.; Lee, R.; Green, S.R. (2004). Field study of
pesticide leaching in a Himatangi sand (Manawatu) and a Kiripaka bouldery clay
loam (Northland). 2. Simulation using LEACHM, HYDRUS–1D, GLEAMS, and
SPASMO models. Australian Journal of Soil Research 43(4): 471–489.
Semadeni-Davies, A., Shankar, U., and Elliott, S. (2009 a) Using CLUES to Identify
Impact Catchments – Waikato River Catchment Pilot Study. Prepared for AgRearch,
NIWA client report: HAM2009-101
Semadeni-Davies, A., Shankar, U., McBride, G. and Elliott, S. (2009 b) The CLUES
Project: Tutorial manual for CLUES 2.0.6. Commissioned by Ministry of Agriculture
and Forestry, NIWA Client Report: HAM2009-146
Scholefield, D., Tyson, K. C., Garwood, E. A., Armstrong, A. C., Hawkins, J., and Stone,
A. C. (1993). Nitrate leaching from grazed grassland lysimeters: effects of fertilizer
input, field drainage, age of sward and patterns of weather. Journal of Soil Science
44, 601-613.
Report prepared for Environment Southland April 2010 Land Use and land management risks to water quality in Southland 76
Sharpley, A.N. and Syers, J.K. (1979) Loss of nitrogen and phosphorus in tile drainage
as influenced by urea and grazing animals. New Zealand Journal of Agricultural
Research 22, 127-131
Smith, D.G.; Maasdam, R. (1994). New Zealand's National River Water Quality Network
1. Design and physico-chemical characterisation. New Zealand Journal of Marine
and Freshwater Research 28: 19-35.
Smith, L.C. and Monaghan, R.M. 2003. Nitrogen and phosphorus losses in overland
flow from a cattle-grazed pasture in Southland. New Zealand Journal of Agricultural
Research 46: 225-238.
Smith, R.A.; Schwarz, G.E.; Alexander, R.B. (1997). Regional interpretation of water-
quality monitoring data. Water Resources Research 33: 2781–2798.
Till, D.; McBride, G.; Ball, A.; Taylor, K.; Pyle, E. (2008, in press). Large-scale
microbiological study: Rationale, results and risks. Journal of Water and Health 6(4):
443–460.
Thomas, S.M., Ledgard, S.F., Francis, G.S. (2005). Improving estimates of nitrate
leaching for quantifying New Zealand's indirect nitrous oxide emissions. Nutrient
Cycling in Agroecosystems 73, 213-226.
Thorrold, B.S., Rodda, H. and R.M. Monaghan 1998. Modelling landuse effects on
water quality in the Oteramika catchment. AgResearch Client Report to Southland
Regional Council on the Oteramika Trial Catchment Project. 47 pp.
Turner M. A., Tillman R. W. and Syers J. K. (1979) Losses of phosphorus and nitrogen
forms in subsurface drainage water as influenced by phosphate fertilizer, grazing
animals and irrigation treatments. Progress in Water Technology 11 287-294
Wheeler, D.M.; Ledgard, S.F.; Monaghan, R.M.; McDowell, R; DeKlein, C.A.M. (2006).
OVERSEER® nutrient budget model - what it is, what it does. pp 231–236. In:
Implementing sustainable nutrient management strategies in agriculture. Eds L D
Curries and J A Hanly. Occasional Report 19, Fertilizer and Lime Research Centre,
Massey University, Palmerston North, New Zealand
Wilcock, R. J., 1986. Agricultural run-off: a source of water pollution in New Zealand? N.
Z. J. Agric. Sci. 20, 98-103.
Wilcock, R.J., Monaghan, R. M., Thorrold, B. S., Meredith, A.S., Betteridge, K., Duncan,
M. J. 2007. Land-water interactions in five contrasting dairy catchments: issues and
solutions. Land Use and Water Resources Research 7: 2.1-2.10.
Report prepared for Environment Southland April 2010 Land Use and land management risks to water quality in Southland 77
Wilcock, R.J.; Monaghan, R.M.; Thorrold, B.S.; Meredith, A.S.; Betteridge, K.; Duncan,
M.J. (2007). Land-water interactions in five contrasting dairying catchments: issues
and solutions. Land Use and Water Resources Research. 7: 2.1–2.10.
Wilde, R.H., Willoughby, E.J. and Hewitt A.E. (2004) Data Manual for the National Soils
Database ,Spatial Extension. Landcare Research New Zealand Ltd.
Williams, P.H., Tregurtha, R.J., Tregurtha, C.S., Francis, G.S. (2000). Influence of the
time of fertiliser application on nitrate leaching from winter vegetable crops grown in
Pukekohe, New Zealand. In: Adams, J.A.; Metherell, A.K. ed. Soil 2000: New
Horizons for a New Century. Australian and New Zealand Joint Soils Conference,
December 3-8. New Zealand Society of Soil Science, Lincoln University. Pp. 223-
224. 215-224.
Woods, R.; Elliott, S.; Shankar, U.; Bidwell, V.; Harris, S.; Wheeler, D.; Clothier, B.;
Green, S.; Hewitt, A.; Gibb, R. & Parfitt, R. (2006). The CLUES Project: Predicting
the Effects of Land use on Water Quality – Stage II. NIWA report CHC2006–096,
prepared for Ministry of Agriculture and Forestry.
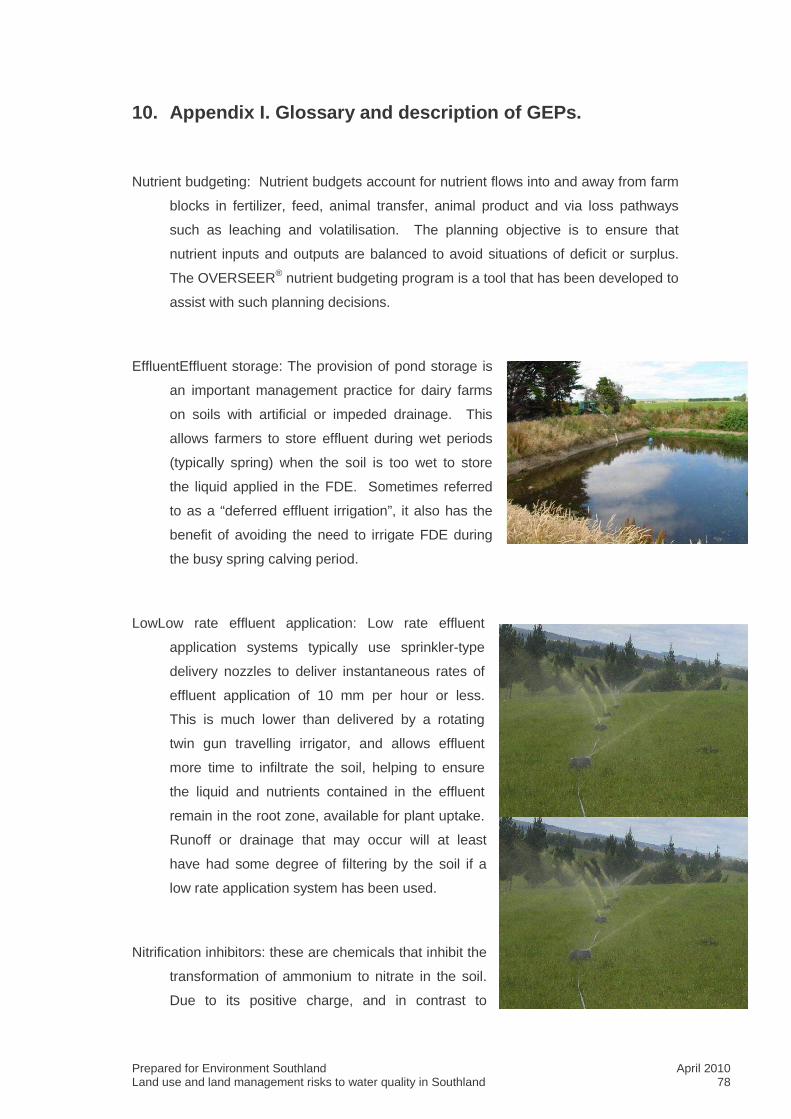
Prepared for Environment Southland April 2010 Land use and land management risks to water quality in Southland 78
10. Appendix I. Glossary and description of GEPs.
Nutrient budgeting: Nutrient budgets account for nutrient flows into and away from farm
blocks in fertilizer, feed, animal transfer, animal product and via loss pathways
such as leaching and volatilisation. The planning objective is to ensure that
nutrient inputs and outputs are balanced to avoid situations of deficit or surplus.
The OVERSEER® nutrient budgeting program is a tool that has been developed to
assist with such planning decisions.
EffluentEffluent storage: The provision of pond storage is
an important management practice for dairy farms
on soils with artificial or impeded drainage. This
allows farmers to store effluent during wet periods
(typically spring) when the soil is too wet to store
the liquid applied in the FDE. Sometimes referred
to as a “deferred effluent irrigation”, it also has the
benefit of avoiding the need to irrigate FDE during
the busy spring calving period.
LowLow rate effluent application: Low rate effluent
application systems typically use sprinkler-type
delivery nozzles to deliver instantaneous rates of
effluent application of 10 mm per hour or less.
This is much lower than delivered by a rotating
twin gun travelling irrigator, and allows effluent
more time to infiltrate the soil, helping to ensure
the liquid and nutrients contained in the effluent
remain in the root zone, available for plant uptake.
Runoff or drainage that may occur will at least
have had some degree of filtering by the soil if a
low rate application system has been used.
Nitrification inhibitors: these are chemicals that inhibit the
transformation of ammonium to nitrate in the soil.
Due to its positive charge, and in contrast to
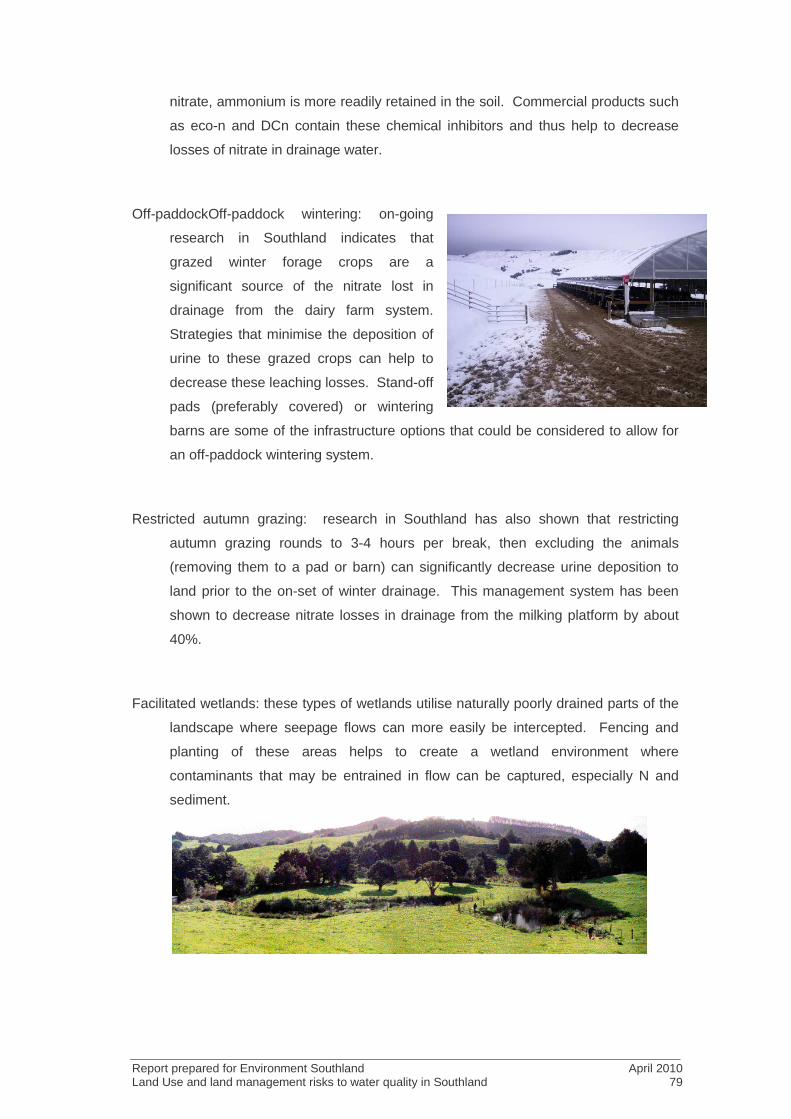
Report prepared for Environment Southland April 2010 Land Use and land management risks to water quality in Southland 79
nitrate, ammonium is more readily retained in the soil. Commercial products such
as eco-n and DCn contain these chemical inhibitors and thus help to decrease
losses of nitrate in drainage water.
Off-paddockOff-paddock wintering: on-going
research in Southland indicates that
grazed winter forage crops are a
significant source of the nitrate lost in
drainage from the dairy farm system.
Strategies that minimise the deposition of
urine to these grazed crops can help to
decrease these leaching losses. Stand-off
pads (preferably covered) or wintering
barns are some of the infrastructure options that could be considered to allow for
an off-paddock wintering system.
Restricted autumn grazing: research in Southland has also shown that restricting
autumn grazing rounds to 3-4 hours per break, then excluding the animals
(removing them to a pad or barn) can significantly decrease urine deposition to
land prior to the on-set of winter drainage. This management system has been
shown to decrease nitrate losses in drainage from the milking platform by about
40%.
Facilitated wetlands: these types of wetlands utilise naturally poorly drained parts of the
landscape where seepage flows can more easily be intercepted. Fencing and
planting of these areas helps to create a wetland environment where
contaminants that may be entrained in flow can be captured, especially N and
sediment.
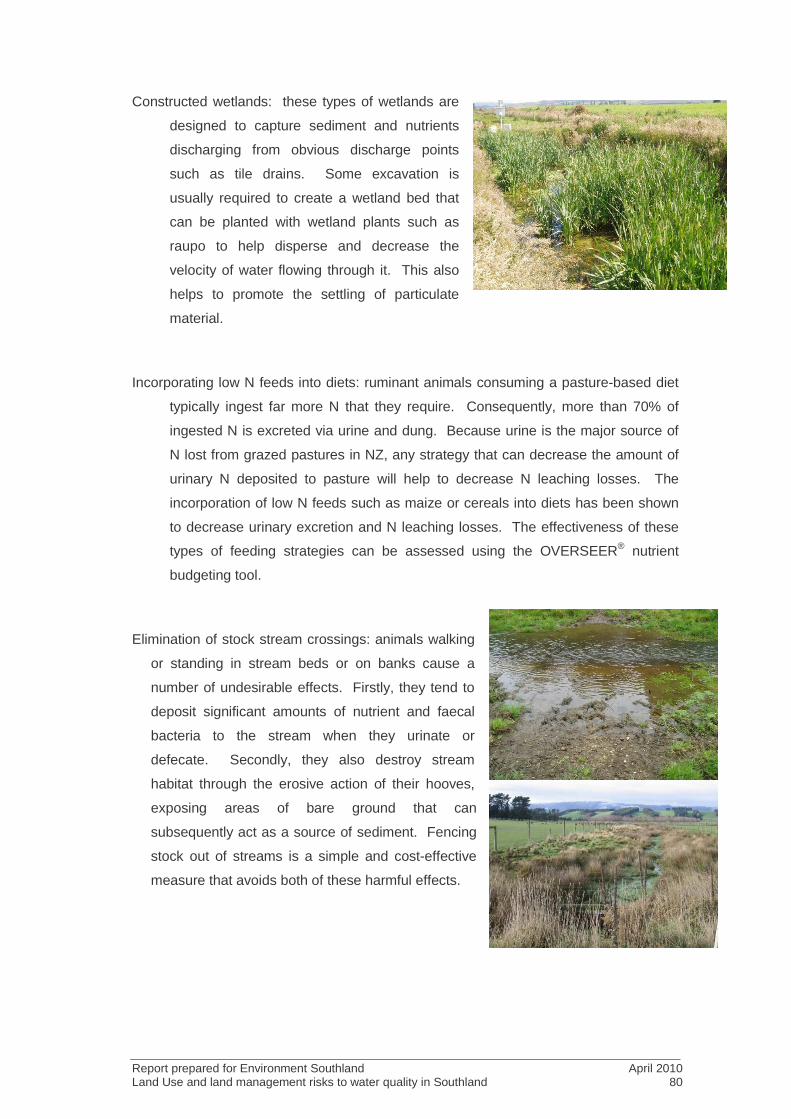
Report prepared for Environment Southland April 2010 Land Use and land management risks to water quality in Southland 80
Constructed wetlands: these types of wetlands are
designed to capture sediment and nutrients
discharging from obvious discharge points
such as tile drains. Some excavation is
usually required to create a wetland bed that
can be planted with wetland plants such as
raupo to help disperse and decrease the
velocity of water flowing through it. This also
helps to promote the settling of particulate
material.
Incorporating low N feeds into diets: ruminant animals consuming a pasture-based diet
typically ingest far more N that they require. Consequently, more than 70% of
ingested N is excreted via urine and dung. Because urine is the major source of
N lost from grazed pastures in NZ, any strategy that can decrease the amount of
urinary N deposited to pasture will help to decrease N leaching losses. The
incorporation of low N feeds such as maize or cereals into diets has been shown
to decrease urinary excretion and N leaching losses. The effectiveness of these
types of feeding strategies can be assessed using the OVERSEER® nutrient
budgeting tool.
Elimination of stock stream crossings: animals walking
or standing in stream beds or on banks cause a
number of undesirable effects. Firstly, they tend to
deposit significant amounts of nutrient and faecal
bacteria to the stream when they urinate or
defecate. Secondly, they also destroy stream
habitat through the erosive action of their hooves,
exposing areas of bare ground that can
subsequently act as a source of sediment. Fencing
stock out of streams is a simple and cost-effective
measure that avoids both of these harmful effects.

Report prepared for Environment Southland April 2010 Land Use and land management risks to water quality in Southland 81
Grass buffer strips: A grass buffer or filter strip is a fenced-off area containing dense
grasses that runoff water passes through before reaching a water body. These
areas act as infiltration or deposition zones that are particularly effective at
intercepting particulate material. Their recommended size varies depending on
soil and landscape features. It is particularly important that they are located in
areas where surface runoff is known to occur or converge. Recent upgrades to
the OVERSEER® model also allow users to evaluate the effectiveness of this
mitigation practice.