land use and land cover change in the san antonio and guadalupe river basins
DESCRIPTION
Land Use and Land Cover Change in the San Antonio and Guadalupe River Basins. Rachel Mills Department of Marine Science November 20, 2008. Objectives. Identify San Antonio and Guadalupe River Basins Analyze Discharge and Stream Flow Data Analyze Land Use/Land Cover Data - PowerPoint PPT PresentationTRANSCRIPT

Land Use and Land Cover Change in the San Antonio and Guadalupe River Basins
Rachel MillsDepartment of Marine Science
November 20, 2008

Objectives
• Identify San Antonio and Guadalupe River Basins
• Analyze Discharge and Stream Flow Data
• Analyze Land Use/Land Cover Data
• Analyze Observations vs. Discharge

San Antonio and Guadalupe River Basin
Length =230 miAvg Disch = 1200 cfsBasin Area = 2023 mi^2
Length = 240 miAvg Disch = 400 cfsBasin Area = 934 mi^2

Guadalupe Basin
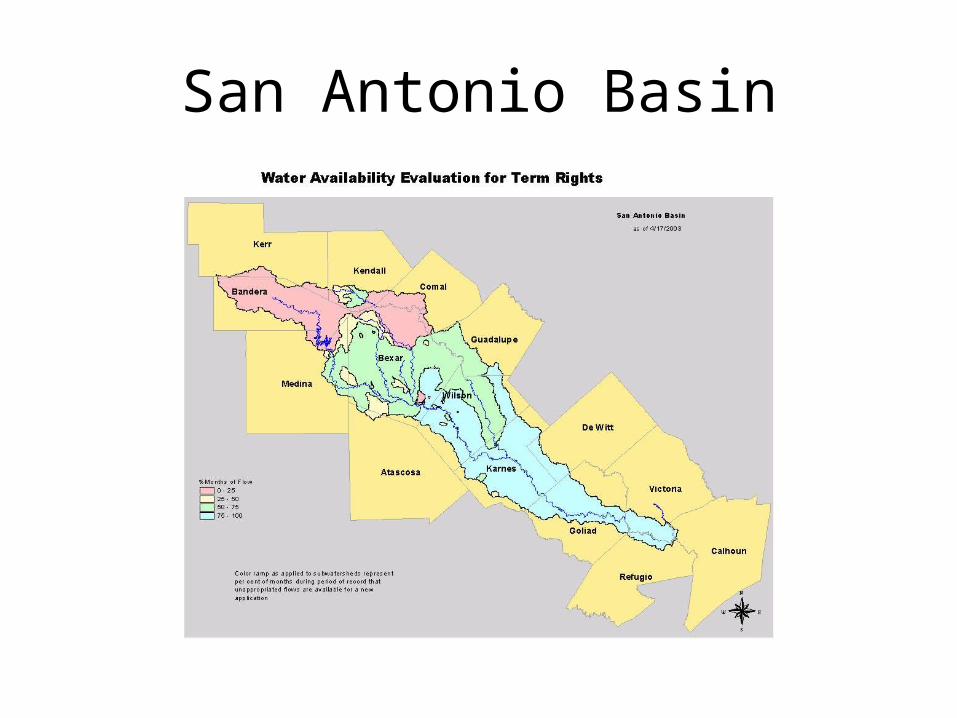
San Antonio Basin

Weekly River Discharge
Guadalupe River
San Antonio River

Annual Discharge
19361938
19401942
19441946
19481950
19521954
19561958
19601962
19641966
19681970
19721974
19761978
19801982
19841986
19881990
19921994
19961998
20002002
20042006
0
1000
2000
3000
4000
5000
6000
7000
Guadalupe Annual Dishcharge
Year
Disc
harg
e (c
fs)
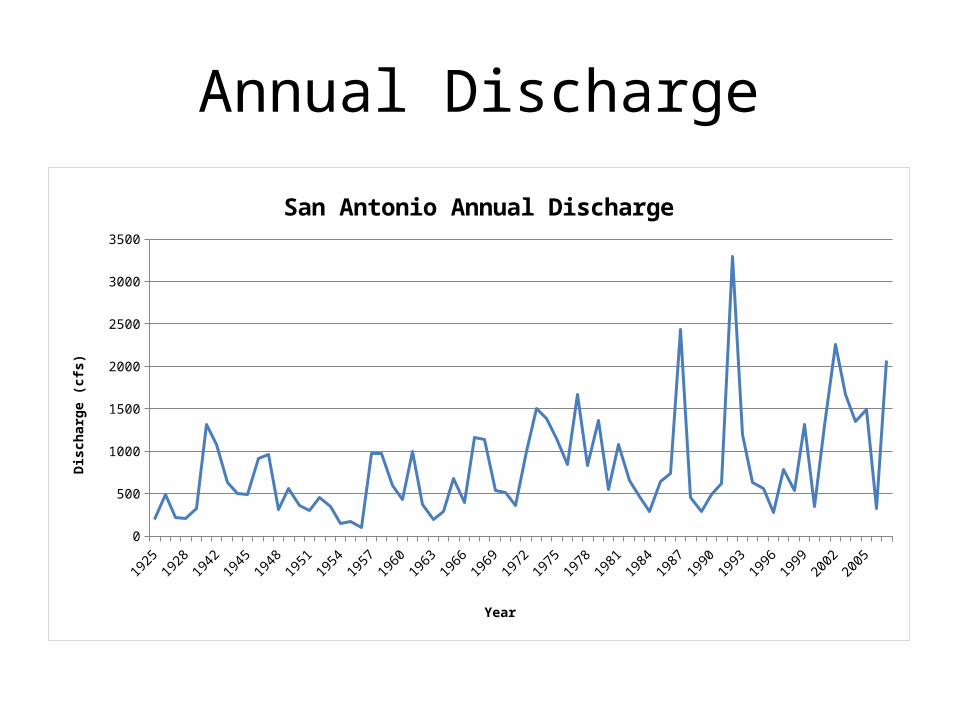
Annual Discharge
19251927
19401942
19441946
19481950
19521954
19561958
19601962
19641966
19681970
19721974
19761978
19801982
19841986
19881990
19921994
19961998
20002002
20042006
0
500
1000
1500
2000
2500
3000
3500
San Antonio Annual Discharge
Year
Disc
harg
e (c
fs)

Streamflow

Land Use

Land Cover Change

Land Cover ChangeCategory 1992 2001Open water 183865 204403Urban 2322486 2568680Barren 37931 52851Forest 7819649 6933025Grassland/Shrub 10828073 11292678Agriculture 7296467 7300536Wetlands 826000 962298
% Land Cover Change = 6.445
Still to come…
• Storm events and Land Use Land Cover Change*To be finished
• Calculate number of Observations for levels of Discharge (High and low flow events)*To be finished

Questions??Thank you!