land and undersea field testing of very low frequency rf
TRANSCRIPT

TECHNICAL REPORT TR 3078 December 2017
Land and Undersea Field Testing of Very Low Frequency RF Antennas
and Loop Transceivers
Dr. Jack Dea Dusan Radosevic
Nghia Tran Jose Chavez
Dr. Burton Neuner III
Approved for public release.
SSC Pacific
San Diego, CA 92152-5001
SB
SSC Pacific San Diego, California 92152-5001
M. K. Yokoyama, CAPT, USN
Commanding Officer
W. R. Bonwit
Executive Director
ADMINISTRATIVE INFORMATION
The work described in this report was performed for the Office of Naval Research (ONR)
Forward Deployed Energy and Communications Outpost (FDECO) Innovative Naval Prototype
(INP) Program by the Radiation Technologies Branch (Code 56480) of the Maritime Systems
Division (Code 56400), Space and Naval Warfare Systems Center Pacific (SSC Pacific), San Diego,
CA. Further support was provided by The Communications and Engineering Support Branch (Code
55320), the Advanced Photonic Technologies Branch (Code 55360), Mission Systems Engineering
Branch (Code 56170), and the Unmanned Systems Science and Technology (Code 71710).
This is a work of the United States Government and therefore is not copyrighted. This work may
be copied and disseminated without restriction.
The citation of trade names and names of names of manufacturers is not to be construed as official government
endorsement or approval of commercial products or services referenced in this report.
WFS S100-L is a registered trademark of WFS Technologies Ltd.
Crown® XLS 2500 is a registered trademark of Harmon
B&K Precision® 3003 is a registered trademark of B&K Precision Corporation
Sony PCM M-10 Digital Recorder is a registered trademark of Sony
Stanford Research Inc. is a registered trademark of Bell Electronics
Smart Pro is a registered trademark of TRIPP●LITE
SubConn is a registered trademark of MacArtney Underwater Technology
Seatooth® S100 is a registered trademark of WFS Technologies Ltd.
Released by
Jim Spencer, Head
Radiation Technologies Branch
Under authority of
Mark H. Berry, Head
Maritime Systems Division

iii
EXECUTIVE SUMMARY
The Office of Naval Research “Forward Deployed Energy and Communications Outpost
(FDECO)” Program is an Innovative Naval Prototype (INP). One of the critical wireless data link
methods under the program is very low frequency (VLF) radio frequency (RF) communication in the
ocean environment. This report presents experiments and findings for VLF RF communications
using both commercial off-the-shelf (COTS) transceivers acquired from vendor Wireless For Subsea
(WFS) and low-cost loop antennas that were designed and built at Space and Naval Warfare Systems
Center Pacific (SSC Pacific). The WFS Technologies, Ltd. system was tested for its capabilities,
which include power consumption, error rate, signal strength, signal-to-noise ratio, and extrapolated
range. Similar capabilities of the SSC Pacific-built loop transceiver system were also determined.
The report presents the mechanical and logistical aspects of sea testing. The results verified that both
transceiver systems performed as designed. The results also showed that the WFS system has a
subsea link range up to 30 meters using 10 watts of power, while the loop antenna system has a range
of 30 meters using 6.4 watts. Several follow-on experiments that build upon the successes described
are proposed.

iv
CONTENTS
EXECUTIVE SUMMARY ...........................................................................................................III
1. INTRODUCTION ................................................................................................................... 1
2. BASIC CONSIDERATIONS .................................................................................................. 1
2.1 VLF RF HARDWARE: WFS TRANSCEIVERS ............................................................ 1
2.2 VLF RF HARDWARE: SSC PACIFIC LOOP ANTENNAS ........................................... 4
2.3 EXPERIMENTAL CONCEPT ....................................................................................... 5
3. EQUIPMENT SETUP ............................................................................................................ 7
4. SURFACE TESTING............................................................................................................. 8
5. UNDERSEA TESTING .........................................................................................................12
6. NOISE ANALYSIS ...............................................................................................................18
7. SUMMARY ...........................................................................................................................20
8. FUTURE RESEARCH CONCEPTS .....................................................................................20
8.1 EXTENDING COMMUNICATION RANGE BY LOWERING FREQUENCY ................20
8.2 IDEAL THEORETICAL 1/R DECAY AT LOW FREQUENCIES ...................................20
8.3 UNDERWATER-TO-AIR VLF ANTENNA OF MODEST SIZE .....................................21
8.4 UNDERWATER DEPTH GAUGE AND SEA STATE GAUGE .....................................21
8.5 HIGH-Q ANTENNA FOR LONG-DISTANCE COMMUNICATIONS ............................21
8.6 HIGH-EFFICIENCY CLASS E AMPLIFIERS ..............................................................21
8.7 INTEGRATING VLF RF INTO A UNIFIED MULTI-MODAL MODEM ..........................22
8.8 ACTIVE FEEDBACK RECEIVING SYSTEM ..............................................................22
8.9 VARIABLE BANDWIDTH RECEIVER ........................................................................22
8.10 LONG-DISTANCE COMMUNICATIONS USING FIXED-SITE VLF RF ......................22
8.10.1 COVERAGE PREDICTION FOR DIXON TRANSMISSION .....................................22
REFERENCES .........................................................................................................................25
Figures
1. Photograph of a pair of WFS S100-L transceivers.................................................................. 2
2. Serial interface to laptop computer ......................................................................................... 2
3. Screen shot of the Engineering tab. Test Commands sends command codes to the
unit under control. Test Data sends text to other WFS units. The Text History window to
the right records sent and received messages ........................................................................... 3
4. A 1-meter-diameter loop antenna with 20 turns of wires. The wood cradle supports the
loop during storage, transport, and land-based field testing ....................................................... 4
5. Typical transmit/receive scenario ........................................................................................... 5
6. Data show that Equation (6) correctly describes the signal from the vertical transmitter
but does not correctly describe the signal from the horizontal transmitter ................................... 6
7. The two basic configurations. The WFS units are represented by rectangles and the
air loops are represented by ovals ............................................................................................. 7

v
8. Transmit system is shown on the left. Receive system is shown on the right ......................... 8
9. The two air loop antennas are supported by wood cradles. The WFS Technologies, Ltd.
transceivers were placed on the ground (out of view). The UPS is the large black box
near the middle of the photo and it powers the network analyzer (on a cart) on the left .............. 9
10. Standard short cabling provided by WFS Technologies, Ltd. A male 12-pin connector
plugs into the WFS S-100L. The pigtail includes power cables, and an RS-232 connector.
An RS-232 to USB adapter is also shown .................................................................................10
11. The 15-meter extension cable, with 12-pin female and male connectors .............................10
12. Signal reception of 21.7-kilohertz WFS transmissions with the air loop antenna at
various separations. The 1/r3 theory is also shown. Extrapolation of the curve to the
background noise level (2 microvolts) suggests a range of around 85 meters, using
24-Volts, 0.42 amps, and thus ~ 10 watts .................................................................................11
13. Signal reception of 21.7-kilohertz CW (continuous wave) signals from air loop
transmitter. The data points are shown and the 1/r3 decay curve is also plotted. The
exact modeling curve using Equation (3) is shown in yellow. Extrapolation of the curve
to the background noise level (2 microvolts) suggests a range of around 100 meters,
using 59 Volts, 0.13 amps, and thus ~ 7.7 watts .......................................................................12
14. One WFS unit just before deployment. A lead weight is strapped to one end of the
unit. A 2” x 4” board will float on the surface and allow the monitoring of the WFS modem
orientation as it descends to the bottom. The air loop is tied to the middle of the
WFS unit ...................................................................................................................................13
15. Floats on the upper rim of the loop will hold the loop upright ...............................................14
16. Data points of WFS transmission at sea at 21.7 kilohertz. The 1/r3 theory no
longer fits because of additional attenuation by the skin depth effect. Extrapolation of
the curve to the background noise level suggests a range of around 30 meters
using 10 watts ...........................................................................................................................14
17. This plot shows reception of VLF transmission in the air-to-air configuration
(0 meters depth) and in the air-to-sea configuration at three different depths ............................15
18. A long plank orients the air loop underwater ........................................................................16
19. A closer look at the loop orientation using a long plank .......................................................16
20. Loop-to-loop antenna transmission underwater at 20 kilohertz. Extrapolation of the
curve to background noise (2 microvolts) suggests a range of 30 meters, using
just 6.4 watts .............................................................................................................................17
21. Broadband noise from the UPS (~ 35 decibels above background) is seen in the three
upper data sets recorded by the network analyzer. The 21.7-kilohertz VLF signals are
visible, but noise is substantial. The two lower plots were taken with a digital recorder
and without the UPS to capture background noise at the sea surface and sea bottom..............18

vi
22. Background noise as taken with the low-noise amplifier and the digital recorder. The
peak points at 25 kilohertz are signals from the Navy’s Jim Creek VLF transmitter. Surface
signals (red squares) are attenuated by 28 decibels when the receiver descends to sea
bottom (purple stars). Theoretical attenuation is calculated to be 31 decibels; thus, there
is a difference of only 3 decibels between observation and theory ............................................19
23. Day time coverage prediction for Dixon transmission at 10 kilowatt and at 55.5 kilohertz.
The noise bandwidth is 1 kilohertz ............................................................................................23
Tables
1. Listing of command codes and the effects ............................................................................. 4
2. Reception depth for 55.5-kilohertz signals for three bandwidths ............................................24

1
1. INTRODUCTION
This report documents the results of surface and sea testing with WFS Technologies, Ltd.
transceiver units and Space and Naval Warfare Systems Center Pacific (SSC Pacific)-developed loop
antennas. The development and testing of loop antennas were important for the following reasons: a
separate method was required for full-performance characterization of Wireless for Subsea (WFS)
transceivers, commercial off-the-shelf (COTS) units possess proprietary software and are costly
(requiring acquisition contracts for procurement), and in-house designs provide rapid prototyping
flexibility in light of new concepts and requirements.
Testing for this project was supported by The Office of Naval Research (ONR) “Forward
Deployed Energy and Communications Outpost (FDECO)” Program. The FDECO Program is an
Innovative Naval Prototype (INP). As part of the FDECO Program, the Communications technical
group (or tier, led by Jose Chavez) purchased WFS Technologies, Ltd. transceivers for use as the
electromagnetic part of the integrated communications network. In addition to VLF technology, the
group is also pursuing free-space optical (FSO) and acoustic links for wireless communication, but
these technologies are outside the scope of this report.
All field experiments faced technical challenges—especially the sea trials—but tests were
successful and conclusions were drawn. These issues and results are detailed in this report.
Future program concepts for VLF links may include all-through-water (ATW) or air-water
interface (AWI) communications. One of the wireless data link methods planned for the program is
very low frequency (VLF) radio-frequency (RF) communication in the natural environment of
oceanic seawater.
2. BASIC CONSIDERATIONS
Electromagnetic (EM) communications are relevant for both long and short distances. Historically,
VLF RF communications for naval applications have been “long range” by design, where signals
propagate through the atmosphere for hundreds or thousands of kilometers, and then extend into
seawater at certain depths to reach relevant platforms. As a complementary technology, inductive-
type VLF RF systems exist to provide “short-range” communications over meters to 100s of meters,
using smaller form factors. While the EM frequencies are similar, the hardware sets are quite
different: long-range VLF broadcasts rely on massive antenna stations (~ 100s of meters) and
consume substantial power (e.g., kilowatts to megawatts), while short-range VLF units are small
(around 1 meter in size), are user-portable, and consume low power (e.g., 0.1 watt to 100 watt). A
review of VLF RF propagation physics and numerical calculations were presented in an ONR
Technical Report (Bowen, Fraser-Smith, and McGill, 1992).
2.1 VLF RF HARDWARE: WFS TRANSCEIVERS
The main units of interest are the WFS Seatooth S100-L transceivers. Procured for short-range
VLF communication as a set of three COTS transceivers (modems and antennas integrated into
pressure vessels) in fiscal year 2016, Figure 1 shows a pair of the hardware.

2
Figure 1. Photograph of a pair of WFS S100-L transceivers.
The WFS units are magnetic induction antennas. The proprietary design is based on a metal core
(typically a long rod of ferromagnetic material) with the transmitting conductor wrapped around the
core in many winding turns; the design is referred to as “ferrite core.” The magnetic core reduces the
size of the unit by concentrating the ambient magnetic flux. The selling points of the WFS S100-L
units are that they are portable, ready for deployment underwater, have an underwater range of
15 meters at 512 bps, can be powered by external voltage or internal battery pack, are depth-rated to
100 meters, are operated via simple messaging though a graphical user interface (GUI) or serial
connection, and provide a secure communication link that emits no acoustical interference. Other
features of the WFS S100-L units include the serial interface and support resources on the intuitive
GUI and the user’s manual (WFS Technologies, Ltd., 2017). The Seatooth® Serial Connect interface
to laptop computer is shown in Figure 2.
Figure 2. Serial interface to laptop computer.

3
The GUI application is loaded to the laptop computer from the CD. Once opened, the GUI gives
the user command of the different functions and uses of the WFS S-100L unit. There are several
main tabs on the GUI. One tab allows the user to log in events and store the logs. Another tab allows
communications in either wired mode or wireless mode. For underwater communications, the mode
will almost always be wireless. Another tab allows the user to use the units in default mode or in
network mode. In default mode, every WFS S-100L unit is addressed as “0”. For example, if there
are five WFS S-100L units communicating with each other, the one that is broadcasting will be
received by the other four units because the broadcast is to all units addressed “0”. If the user sets the
unit to the less common network mode, each WFS unit will have its own unique address, such as
address “11” and address “16”. In the network mode, the communications is between assigned units,
such as between unit 11 and unit 16. An important tab within the GUI is the Engineering tab (Figure
3). In the Engineering tab, the user can send and receive messages between WFS units and send
command codes (Table 1) to the working unit. The user can send direct commands by typing in the
circled “Command” box and pressing “Send”. The Auto-Wake feature (circled) can be disabled for
commands sent through this tab, and it will not disable the feature for any other tab.
Figure 3. Screen shot of the Engineering tab. Test Commands sends command codes to the unit under control. Test Data sends text to other WFS units. The Text History window to the right records sent and received messages.

4
Table 1. Listing of command codes and the effects.
Commands Parameters Effect
?swv N/A Returns software version.
?uid N/A Returns the unique ID of device (not fitted on all models)
Idxf N/A Indexes file system.
?log Log ID Returns details of Log (not including the timestamp)
logr Log ID Deletes log
logc Byte count of sensor
Creates a new log file with a record size (Byte Count)
?lid N/A Returns a list of all log file IDs
mane N/A Enables Manchester Encoding, should be used for long range communication
mand N/A Disables Manchester Encoding
?man N/A Returns whether or not Manchester Encoding is enabled
2.2 VLF RF HARDWARE: SSC PACIFIC LOOP ANTENNAS
The SSC Pacific-developed loop antenna, on the other hand, does not have a magnetic core but
compensates for this limitation by having a large cross-sectional area. Figure 4 shows a photograph
of a 20-turn, 1-meter-diameter loop designed and built in-house.
Figure 4. A 1-meter-diameter loop antenna with 20 turns of wires. The wood cradle supports the loop during storage, transport, and land-based field testing.

5
The basic theory for transmission is communications through the induction field. For an
understanding of the process consider a small current element, Idl, where I is the current and dl is a
small length. This current element induces an incremental field, dB, by the following equation
(Physics Lab, 2017):
𝑑𝐵 =𝜇𝑜
4𝜋
𝐼×�̂�
𝑟2. (1)
Integrating the above equation over the loop circumference yields the total field found at a distance r
from the loop (Research and Education Association, 1983).
2/322
2
)(2 ar
aNIB rms
rms
, (2)
where μ = μo =12.57x10⁻⁷ for the air loop and μ=μmaterial for the WFS antenna. The symbol µ stands
for the permeability of the antenna core. For an air loop, µ= µo, but for a loaded antenna, µ=
µmaterial= µrµo, where µr is the relative permeability of the material. N is the number of turns (N = 20
for loop), Irms is the drive current, rms is the root mean square, a is the diameter of the loop or the
core, and r is the distance between the transmitter and receiver. When r is much larger than a,
Equation (2) approximates to
3
2
2r
aNIB rms
rms
. (3)
Equation (3) illustrates the 1/r3 dependence of the signal on distance.
2.3 EXPERIMENTAL CONCEPT
Figure 5 shows a drawing of a typical transmit/receive scenario. Each of the WFS units and loop
antennas can both transmit and receive.
Figure 5. Typical transmit/receive scenario.

6
The reception equation for any induction antenna is provided by Johnson and Jasik (1961a).
rmseffrms BareaNV *** , (4)
where N = number of turns of wire, areaeff is the effective area, ω is the radian frequency, and Brms is
found from Equation (3). The symbol ω represents radian frequency that is also equal to 2πf, where f
is the frequency. The effective area of the air loop is its actual physical area (π a2/4), but the effective
area of the WFS is the product of the core area and the relative permeability.
Equation (3) shows that the signal decreases rapidly with distance, r. In submerged operation under
the sea, another effect comes into play. The conducting seawater attenuates the signal through the
skin depth effect. The skin depth is given by:
of
1 , (5)
where σ is the seawater conductivity (σ = 4 mhos/meter) and f is the frequency. One skin depth
equals the depth of water to attenuate a signal by a factor of 1/e (or 0.368). Hence, a receiving
antenna on the sea floor whose depth is equal to 5 skin depths will receive a signal attenuated by
a factor, 1/e5 (or 0.0067).
In undersea environments, the signal strength (in volts) is given by.
/**** r
rmseffrms eBareaNV . (6)
The rms value is used for convenience only. Other measures such as Vpeak and Vavg are all
equivalent to each other. Equation (6) shows that the reception voltage is attenuated by the 1/r3 factor
and the skin depth factor. However, the data from the measurements show that the skin depth in the
horizontal direction is different from the skin depth in the vertical direction. Figure 6 shows the
scenario.
Figure 6. Data show that Equation (6) correctly describes the signal from the vertical transmitter but does not correctly describe the signal from the horizontal transmitter.

7
The explanation is that in vertical transmission, the ocean is effectively infinitely extended in the
horizontal direction and the signal receives uniform attenuation. In the horizontal transmission, the
signals traverse a mixed path of air and water. Hence, it is not possible to properly estimate the
effective skin depth outside of a more detailed analysis or through a numerical simulation.
Nevertheless, we were able to make some sense of horizontal transmission data as discussed in
Section 5.
3. EQUIPMENT SETUP
The WFS units and the loops can be arranged in either the co-planar position or the co-axial
position as shown in Figure 7.
Figure 7. The two basic configurations. The WFS units are represented by rectangles and the air loops are represented by ovals.
The first tests involved both configurations. However, it became apparent during sea testing that
repositioning is difficult. Figure 10 helps illustrate the complications involved in repositioning the
WFS and loop antenna by 90 degrees. In addition, the WFS manual and the author’s experience show
that the best configuration is the co-planar. Hence, only the co-planar results will be presented.
Figure 8 shows the equipment at both the transmit side and the receive side.

8
Figure 8. Transmit system is shown on the left. Receive system is shown on the right.
The laptop contains the Seatooth application software, which controls the operation of the S100-L
units. Ideally, two laptops are needed for the two systems, but we used one laptop to control both
S100-L units because we had available for use one laptop at the time. The current sensor consists of a
current probe with a digital voltmeter. The power amplifier is a commercial audio amplifier (Crown
XLS 2500). The signal generator is a handheld BK Precision 3003. The 12-Volt, 420-watt-hour
source and the 24-Volt, 160-watt-hour source are battery packs. Each of the WFS S100-L units
consume 10 watts, and would ideally deplete the 24-Volt source in 16 hours. The air loop transmitter,
consuming 6.4 watts, would ideally deplete the 12-Volt source in 65 hours. The low-noise amplifier
has a gain of 103 and was constructed at SSC Pacific using low-noise operational amplifiers. (Note:
the low-noise amplifier was used only for the data collected for Figures 12, 16, 17, and 18.) The
digital recorder is a Sony PCM M-10. The network analyzer is the Stanford Research Inc. model
SR785. The uninterruptible power supply (UPS) is a heavy-duty, 2.2-kilovolt, 1700-watt unit, model
Smart Pro, manufactured by TRIPP●LITE. The 1000-watt inverter runs on 12-Volt batteries and
generates 120-Volt alternating current
4. SURFACE TESTING
Surface measurements were performed outdoors at SSC Pacific’s Lower Model Range area. The
setup is almost exactly as shown in Figure 8 except that the low-noise amplifier was not used. Figure
9 shows a photo of the equipment at the Lower Model Range.

9
Figure 9. The two air loop antennas are supported by wood cradles. The WFS Technologies, Ltd. transceivers were placed on the ground (out of view). The UPS is the large black box near the middle of the photo and it powers the network analyzer (on a cart) on the left.
One WFS unit remains fixed in location while the second unit is placed at increasing separation
distances. The distances were 5, 10, 15, 20, 25, 30, and 35 meters. The two 50-ft (15.24-meter)
SubConn extension cables will allow for a maximum antenna separation of 35 meters, when used
with the two 1-meter SubConn “data plus power” breakout cables and the laptop cords. Figure 10
shows the short cabling provided with a purchased WFS S-100L unit. It includes a male SubConn
12-pin connector on one end and power cords and a RS-232 connector on the other end. The figure
also shows the RS-232 to USB adapter. Figure 11 shows the 15.24-meter extension cable with a
female SubConn 12-pin connector (MCIL12F) on one end and a male SubConn-12 pin connector
(MCIL12M) on the other end.

10
Figure 10. Standard short cabling provided by WFS Technologies, Ltd. A male 12-pin connector plugs into the WFS S-100L. The pigtail includes power cables, and an RS-232 connector. An RS-232 to USB adapter is also shown.
Figure 11. The 15-meter extension cable, with 12-pin female and male connectors.
The results of the surface measurements are shown in Figure 12. There were no errors in the
transmitted text messages, confirmed by visually inspecting the sent and received messages. An
extrapolation of the curve to the background noise level results in an estimated communications
range of around 85 meters using 10 watts.

11
Figure 12. Signal reception of 21.7-kilohertz WFS transmissions with the air loop antenna at various separations. The 1/r
3 theory is also shown. Extrapolation of the curve to the
background noise level (2 microvolts) suggests a range of around 85 meters, using 24-Volts, 0.42 amps, and thus ~ 10 watts.
The first air-loop to air-loop testing had the unusual result that the signal hardly decayed with
separation. Troubleshooting led to the discovery that a long extension cord was conducting the
signal. Removal of the extension cord removed the problem.
Results of the second loop-to-loop testing are shown in Figure 13.

12
Figure 13. Signal reception of 21.7-kilohertz CW (continuous wave) signals from air loop transmitter. The data points are shown and the 1/r
3 decay curve is also plotted. The
exact modeling curve using Equation (3) is shown in yellow. Extrapolation of the curve to the background noise level (2 microvolts) suggests a range of around 100 meters, using 59 Volts, 0.13 amps, and thus ~ 7.7 watts.
The plot shows the data points as well as the 1/r3 decay curve. That curve fits perfectly over the
data points. There is enough information to exactly model the process using Equation (3), which is
plotted on the orange curve. Figure 13 shows that there is substantial difference between theory and
experiment. We guess that at least two effects contribute to the disagreement. The two effects are
misalignment of the two air loops, and ground screen losses due to the presence of a copper ground
screen only a few feet from the loops. We hope to clarify this disagreement with future
measurements. Nevertheless, extrapolation of the decay curve to the background noise level results in
an estimated communications range of around 100 meters using 7.7 watts.
5. UNDERSEA TESTING
SSC Pacific’s “Bayside” area resides at the east side of Point Loma, San Diego, CA, along the San
Diego harbor. Several piers extend from SSC Pacific into the harbor’s coastal seawater. The “Finger
Pier A,” an extension of SSC Pacific’s Pier 160, was the location for the undersea tests. At its farthest
point, the depth was 21 feet, and around 19 feet depth at 15-meter separation. Test issues the team
had to address included how to mount and support the WFS units, how to orient the WFS units, and
how to orient the loop antennas. Two lead weights were strapped to both ends of each WFS unit. The
weights not only act as sinkers but also as feet to support the unit on the sea bottom. The WFS
antennas were oriented parallel to the boardwalk by a floating 2 x 4 inch board with two holes for the
support ropes. Figure 14 shows the lead feet and the board.
13
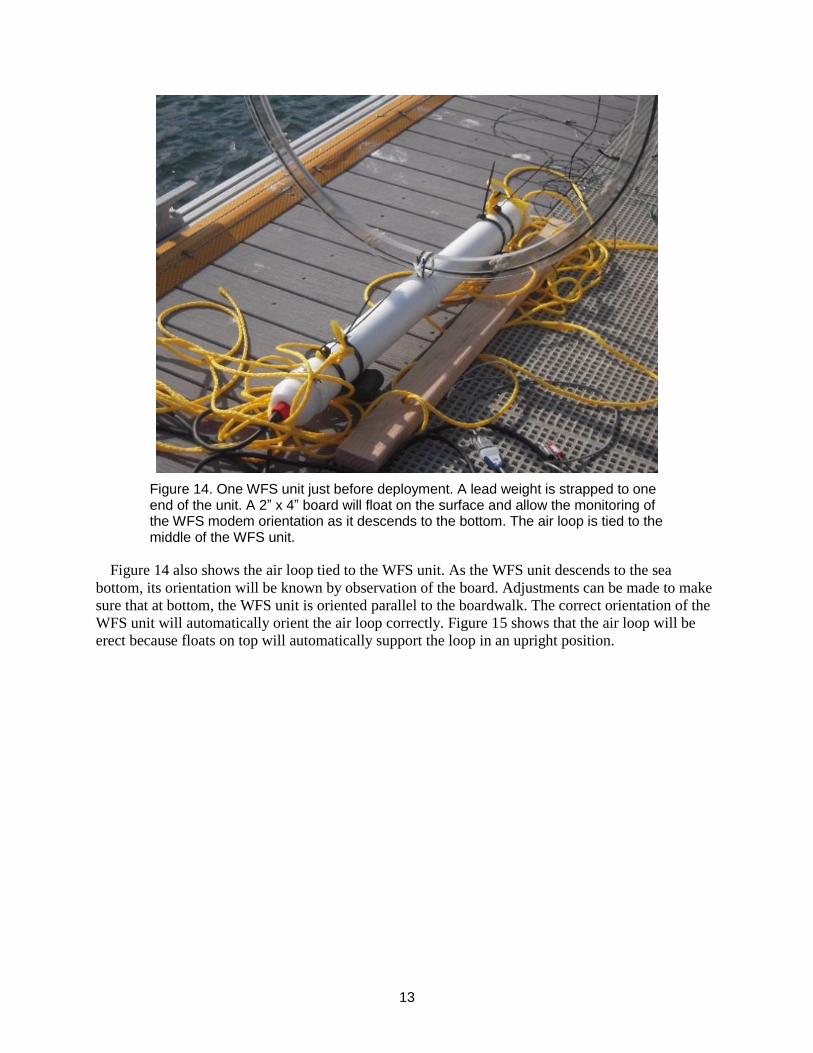
Figure 14. One WFS unit just before deployment. A lead weight is strapped to one end of the unit. A 2” x 4” board will float on the surface and allow the monitoring of the WFS modem orientation as it descends to the bottom. The air loop is tied to the middle of the WFS unit.
Figure 14 also shows the air loop tied to the WFS unit. As the WFS unit descends to the sea
bottom, its orientation will be known by observation of the board. Adjustments can be made to make
sure that at bottom, the WFS unit is oriented parallel to the boardwalk. The correct orientation of the
WFS unit will automatically orient the air loop correctly. Figure 15 shows that the air loop will be
erect because floats on top will automatically support the loop in an upright position.

14
Figure 15. Floats on the upper rim of the loop will hold the loop upright.
The first sea tests of the WFS units were successful. The results are shown in Figure 16. No
transmission errors in the text messages were observed.
Figure 16. Data points of WFS transmission at sea at 21.7 kilohertz. The 1/r3 theory no
longer fits because of additional attenuation by the skin depth effect. Extrapolation of the curve to the background noise level suggests a range of around 30 meters using 10 watts.
15
Notice that the 1/r3 decay no longer fits the curve because of the additional attenuation from the
skin depth effect. At the time of reporting, the skin depth attenuation cannot be easily modeled
because of the complicated mixed air and water paths. The extrapolation of the data curve to the
background noise level shows an underwater communications range of around 30 meters using
10 watts. Also notice that the background noise level on the sea bottom (at 5.8-meter depth) is around
1/20 to that on the surface.
In the next set of sea testing, we attempted to record more data points than just three points. We
attempted to reduce equipment noise by eliminating the UPS. However, it was discovered that the air
loop receiver was not oriented properly during the testing and the data was not used. Nevertheless,
the second sea test was important for recording preliminary data on the difference between air-to-sea
transmission versus all-through-sea transmission. Figure 17 indicates this difference.
It may be possible to fit the reception curve of Figure 16 using an effective skin depth attenuation
on the 1/r3 curve. The skin depth at 21.7 kilohertz is 1.7 meters. A curve fit using an effective skin
depth = 7 x 1.7 = 11.9 meters worked very well. Thus, the transmit/receive signal of the S100-L
transceivers lying on the seabed can be modeled very well by using an effective skin depth found
from curve fitting.
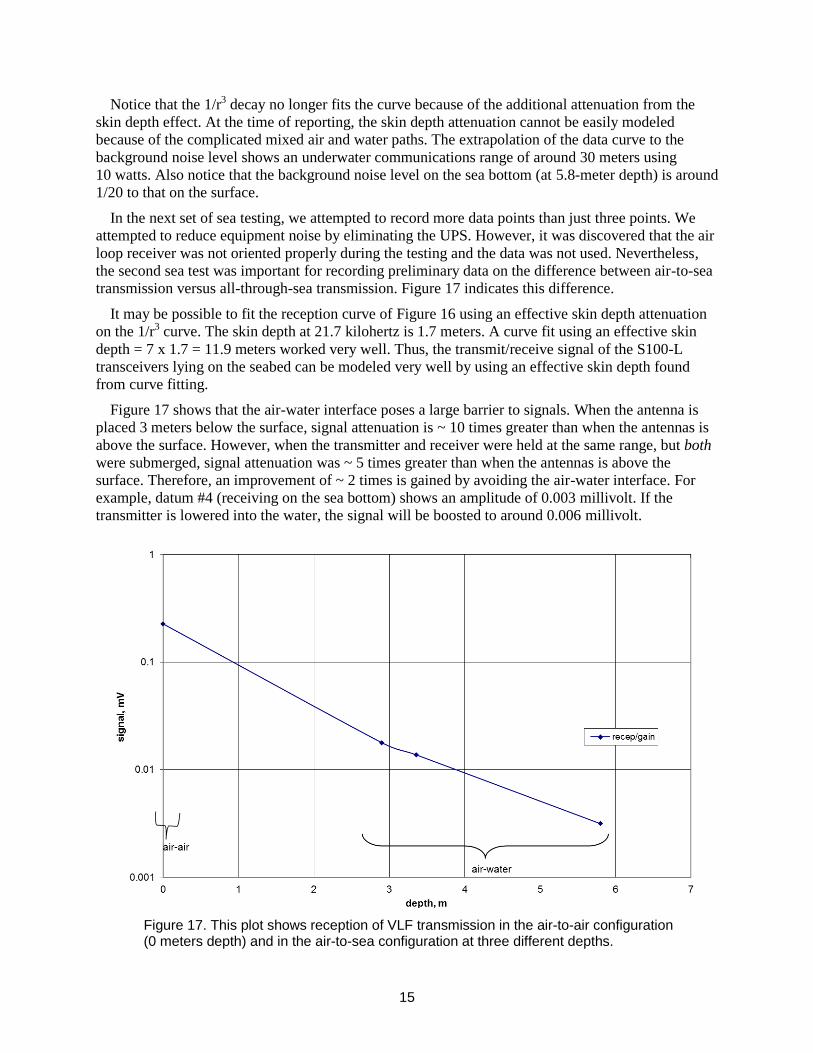
Figure 17 shows that the air-water interface poses a large barrier to signals. When the antenna is
placed 3 meters below the surface, signal attenuation is ~ 10 times greater than when the antennas is
above the surface. However, when the transmitter and receiver were held at the same range, but both
were submerged, signal attenuation was ~ 5 times greater than when the antennas is above the
surface. Therefore, an improvement of ~ 2 times is gained by avoiding the air-water interface. For
example, datum #4 (receiving on the sea bottom) shows an amplitude of 0.003 millivolt. If the
transmitter is lowered into the water, the signal will be boosted to around 0.006 millivolt.
Figure 17. This plot shows reception of VLF transmission in the air-to-air configuration (0 meters depth) and in the air-to-sea configuration at three different depths.

16
The final testing involved the air loop only. The previous testing showed difficulty in orienting the
air loop under water. This testing used an orientation method shown in Figure 18. A close-up view is
shown in Figure 19.
Figure 18. A long plank orients the air loop underwater.
Figure 19. A closer look at the loop orientation using a long plank.
Both the transmitting and receiving loops were oriented using the long plank as shown in the
above figures. Again, the team decided against using the UPS in an effort to reduce switching noise.
Since the UPS powers the network analyzer and wall socket power is not readily available, both
instruments were not used. Instead, the low-noise amplifier and the digital recorder were employed to
record signals.

17
The last series of undersea tests were transmitted at 20 kilohertz instead of 21.7 kilohertz. The
rationale came from a discovery: it was determined that the power amplifier has a cut-off frequency
at around 20 kilohertz. In warm weather, the amplifier will still function at 21.7 kilohertz, but in cold
weather the amplifier ceased reliable function. Operating at 20 kilohertz insured proper power
amplifier performance. Figure 20 shows the data from loop-to-loop undersea transmission.
Figure 20. Loop-to-loop antenna transmission underwater at 20 kilohertz. Extrapolation of the curve to background noise (2 microvolts) suggests a range of 30 meters, using just 6.4 watts.
The above figure shows data attenuated by 1/r3, as well as partial skin depth factor (i.e., VLF
waves propagating along other paths). The estimated range for underwater communications is around
30 m. This is around the same range as estimated for the WFS antennas. However, the power to the
loop is 6.4 watts versus 10 watts for the WFS unit.
We found that a curve fit to Figure 20 had an effective skin depth of 3.3 x 1.7 meter = 5.6 meter
will plot an excellent curve to the data. This result is in contrast to the effective skin depth of 11.9
meters found for the data of Figure 14. When it is considered that Figure 16 shows transmission on
the seabed, but that Figure 20 showed data of transmission several feet above the seabed (from the
1-meter loop mounted above the S100-L unit), the two differing skin depths are understandable: the
seabed has much less conductivity than the seawater and it is expected that the skin depth will be
longer for less-conductive media.

18
6. NOISE ANALYSIS
A thorough understanding of the background noise level is critical when determining the feasibility
and range of any communication method. For example, large attenuation results from the skin effect
in through-water VLF RF propagation, yet the background noise underwater is low, so through-water
VLF communications remain relevant. True background noise cannot be accurately determined if
there are additional, artificial sources. Laboratory equipment can often emit broadband noise; this
detrimental feature was discovered when using the inverter and the UPS in field experiments.
However, if the inverter is used far from the receiver and UPS usage is avoided, then accurate
background noise can be measured. Figure 21 shows large broadband noise from the UPS, which is
around 35 decibels above the background level. The 21.7-kilohertz VLF signals are larger than the
broadband noise for these link ranges, but the link would be dropped at ranges earlier than expected
if the broadband noise remained. The lower two plots were taken with the digital recorder, and
without the UPS, to accurately capture background noise at the sea surface and sea bottom. This
“lower noise” data collection method improves performance. The data also show the digital recorder
cutoff at 48 kilohertz; the three previous “higher noise” plots falsely indicated higher frequency VLF
RF signals.
Figure 22 shows a more detailed look at the low-noise curves. Background noise as taken with the
low-noise amplifier and the digital recorder. Interestingly, the loop antennas detect peak points at
25 kilohertz, which originate from the Navy’s Jim Creek VLF transmitter. The data showed that the
surface signals (red squares) are attenuated by 28 decibels when the receiver descends to sea bottom
(purple stars). Our team uses theory to calculate an attenuation of 31 decibels; thus, there is a
difference of only 3 decibels between observation and theory.
Figure 21. Broadband noise from the UPS (~ 35 decibels above background) is seen in the three upper data sets recorded by the network analyzer. The 21.7-kilohertz VLF signals are visible, but noise is substantial. The two lower plots were taken with a digital recorder and without the UPS to capture background noise at the sea surface and sea bottom.

19
Figure 22. Background noise as taken with the low-noise amplifier and the digital recorder. The peak points at 25 kilohertz are signals from the Navy’s Jim Creek VLF transmitter. Surface signals (red squares) are attenuated by 28 decibels when the receiver descends to sea bottom (purple stars). Theoretical attenuation is calculated to be 31 decibels; thus, there is a difference of only 3 decibels between observation and theory.
Data from Figure 22 showed that the discrepancy between observation and theory is about 3
decibels. Factors that influence theoretical calculations include wave action, uncertainty in seawater
salinity, and the mixed air and water paths of the horizontal transmission signals (which alter the
effective skin depth attenuation). Therefore, the 3-decibel discrepancy is considered quite low, and
the theory provides a good estimate of system performance.
The surface noise of Figure 22 can be converted to magnetic noise density using Equation (6) and
the known line width of the network analyzer. Calculations show that the background magnetic noise
density at 10 kilohertz is around 20 fT/root(Hz). One femtoTesla (fT) is equal to 10-15 Tesla. Our
derived value is close to the 30 fT/root(Hz) value experimentally observed around the world (Bowen,
Fraser-Smith, and McGill, 1992), which verifies that our experimental practices and theoretical
estimates are reasonable and valid.

20
7. SUMMARY
We have performed transmission and reception tests on land and subsea using Wireless for Subsea
WFS Technologies, Ltd. VLF RF transceivers and SSC Pacific-developed loop antennas.
Experimental techniques and instrument methods have been developed to enable ease and accuracy
in measurements. We have determined that surface transmission of WFS Seatooth S100-L units have
a range of 85 meters while consuming 10 watts of power. The loop antennas perform somewhat
better, transmitting at a range of 100 meters while consuming 7.7 watts of power. All data conformed
very well to the 1/r3 law of electromagnetic propagation. In the natural ocean waters of San Diego
harbor, the WFS transceivers exhibited a range of around 30 meters using 10 watts. The loop
antennas also exhibited a range of 30 meters through seawater, but power consumption was estimated
at 6.4 watts. The data showed that signals transmitted in a vertical path from just below the sea
surface to the ocean bottom are attenuated to an extent that is consistent with the skin depth effect.
Underwater attenuation in the horizontal direction is more complex, resulting from multiple
possible propagation paths: (1) waves can pass from the transmitting antenna to receiving antenna
(all through water), (2) out of the water and partially through air, and (3) below the water and
partially through the seabed (which possesses reduced conductivity). Nevertheless, horizontal
attenuation can be estimated, and it was discovered that propagation through the seabed is actually
preferable in some cases, as VLF waves can transmit greater ranges through this medium.
We also showed that it is possible to communicate from above the water’s surface to an antenna on
the ocean’s bottom (and vice versa), but there is a large loss factor for signals traversing the air-water
interface, as expected. We identified and removed interference noise sources and are now able to
measure background magnetic noise density consistent with established, published values.
Overall, by using a COTS antenna-modem transceiver system (WFS) and by developing low-cost
loop antennas in-house (SSC Pacific), the team acquired the knowledge and skills to proceed with
more complex wireless communications experiments in the VLF RF domain.
8. FUTURE RESEARCH CONCEPTS
The experience gained and useful data collected gave the team optimism for the use of VLF band
electromagnetic communications in the undersea environment. We propose several new experimental
tests and development projects to further grow this technology area.
8.1 EXTENDING COMMUNICATION RANGE BY LOWERING FREQUENCY
Equation (4) indicates that as the transmission frequency is lowered, the skin depth increases. This
increase means that the lower frequency signals have more penetration distance through attenuating
media. For example, at the frequency of operation of the WFS S100-L units (21.7 kilohertz), the skin
depth is 1.7 meters. However, if the transmission frequency is lowered to 217 hertz, then the skin
depth becomes 17 meters, a ten-fold improvement. Naturally, bandwidth and bit rate would decrease,
but lower-frequency operations can be used for short message communications.
8.2 IDEAL THEORETICAL 1/R DECAY AT LOW FREQUENCIES
Antenna theory includes 1/r3 (quasi-static), 1/r2 (induction), and 1/r (radiation) terms (Johnson and
Jasik, 1961b). So far, we have discussed only the quasi-static signals. The reason for this limited
discussion is that for electrically small antennas and in conducting media (seawater), the 1/r2 and 1/r
terms are presumed negligible.

21
However, at lower frequencies (e.g., < 1 kilohertz), skin depth attenuation drops and it may be
possible to observe the induction and radiation terms. These terms would extend the range of the
quasi-static signals. This research can be conducted theoretically. If predicted to be observable,
experiments can be conducted in water to measure the effect.
8.3 UNDERWATER-TO-AIR VLF ANTENNA OF MODEST SIZE
As history has shown, Navy VLF transmission stations such as Cutler VLF Station and Jim Creek
VLF Station require antennas that exceed 1000 feet in height and installations that occupy hundreds
of acres of land. The long wavelengths necessitate massive installations. For example, at 30
kilohertz, the wavelength is 10 kilometers, and if the antennas is exceedingly short, electrical
efficiency will be too low.
Conversely, less is known about all-through-water transmissions. It is presumed that underwater
transmissions are inefficient and thus little has been explored. Consider transmissions at 1 kilohertz;
the wavelength at 1 kilohertz underwater is around 60 meters (Research and Education Associates,
1983). A quarter-wave electric antenna would only be 15 meters across.
The underwater antenna could be polarized with propagation straight into the air-sea interface to
maximize penetration of the air-sea interface. It would be expected that most of the radiated power
would be contained in the water, but any radiation that escapes would be useful for long-distance
communications, which is high-risk research, but potentially inexpensive; thus, it should be
considered.
8.4 UNDERWATER DEPTH GAUGE AND SEA STATE GAUGE
Figure 18 shows that signals from the Jim Creek transmitter are attenuated with ocean depth.
Attenuation versus depth tables can be created to help determine the ocean depth when the surface
signal strength is known. In addition, time variations of this attenuation could be used to establish the
sea state at a particular time.
8.5 HIGH-Q ANTENNA FOR LONG-DISTANCE COMMUNICATIONS
So far we have worked with the WFS S100-L units and the 1-meter loop antennas. They are both
broadband antennas. However, we can easily convert the 1-meter loop antenna to a high-Q, longer
range antenna (at the expense of bandwidth). We could accomplish this goal by connecting a
resonating capacitor in series with the 1-meter loop. It is not known how much improvement can be
achieved. Thus, this research is more experimental than theoretical, as the practical limits are tested.
8.6 HIGH-EFFICIENCY CLASS E AMPLIFIERS
The typical efficiency of electronic equipment is usually no more than that of Class A operation,
which is around 20%. For example, the WFS S100-L consumes 10 watts but is expected to output
much less than 10 watts of radiated power. For extended field operations or unmanned operations, it
is often necessary to use equipment of the highest efficiency.
Class D amplifiers using PWM (pulse-width modulation) can achieve 90% efficiency, converting
90% of input power to signal power. However, PWM does not deliver clean signals.
Signals can be made much cleaner if system “amplitude-modulates” the power supply, rather
“signal-modulates” the circuit via PWM.

22
Thus, we propose building a power supply that effectively outputs amplitude-modulated power.
The power supply is then a power source for a Class D or Class E amplifier. For very high frequency
communication, implementing Class E components is a simple solution for high-efficiency operation.
8.7 INTEGRATING VLF RF INTO A UNIFIED MULTI-MODAL MODEM
The “Forward Deployed Energy and Communications Outpost (FDECO)” Program is currently
developing a prototype that possesses a single modem processor that supports multiple wireless
communication paths. Currently, acoustic and free-space optical links are planned, but integrating a
VLF loop antennas is straightforward as well. In particular, the acoustic link operates at frequencies
similar to the WFS S100-L units and the 1-meter loop antennas. This team proposes to adapt the
acoustic modem drivers and protocols to VLF RF communications using the 1-meter loop as the
antenna. In this way, the Navy and FDECO remain flexible, agile, and able to respond to new
requirements.
8.8 ACTIVE FEEDBACK RECEIVING SYSTEM
Surface reception is dependent on antenna gain, antenna orientation, and effective antenna area.
An active antenna system may improve performance. This concept involves the standard receiving
antenna and a second feedback antenna. The standard antenna receives desired signals that are
amplified, filtered, and processed. The amplified, filtered, and process signal is then fed to the second
antenna. Depending on the phase of the secondary signal and the orientation of the second antenna, it
is believed that there will be an overall gain at the standard antenna. The theory is that the secondary
signals create new Poynting vectors that direct energy towards the standard antenna. The Poynting
vector, S, is defined by 𝑆 = �⃑⃑� × �⃑⃑⃑�. If tests of this concept work in air, more testing will be
performed underwater to test the concept for underwater reception.
8.9 VARIABLE BANDWIDTH RECEIVER
Most receiving systems have the bandwidth fixed by the antenna properties and the receiving
electronics. The section below discusses the greater performance possible with the use of a variable
bandwidth receiver. A simple realization of this concept is to install three filters of different
bandwidths inside the receiver. An example is a receiver with a rotary switch that has bandwidth
selections of 100 hertz, 1 kilohertz, and 10 kilohertz. A smaller bandwidth means slower data
transfer but greater depth for reception underwater. Conversely, a wider bandwidth means faster data
transfer but at a shallower depth. Table 2 shows calculations for three different bandwidths.
8.10 LONG-DISTANCE COMMUNICATIONS USING FIXED-SITE VLF RF
The discussions so far involved short-range tactical communications of ranges 100 meters or less.
However, a unique idea suggested by FDECO Communications Technical Lead Jose Chavez
involves the use of large, fixed-site VLF transmitters for long-range, one-way communications with
underwater assets. The large VLF antenna transmitting at tens to hundreds of kilowatts will be able to
communicate with underwater assets at distances of thousands of kilometers. SSC Pacific has access
to the experimental VLF antenna at Dixon, CA. This antenna is 183 meters (600 feet) tall and is
capable of transmitting several tens of kilowatts. Section 8.10.1 discusses recently acquired charts
and calculations related to using the Dixon LF Station antenna for long-distance communications.
8.10.1 COVERAGE PREDICTION FOR DIXON TRANSMISSION
There is interest in communications with underwater receivers using long-distance fixed VLF
transmitters. The VLF/LF antenna facility at Dixon, CA, affords our group the opportunity to
23
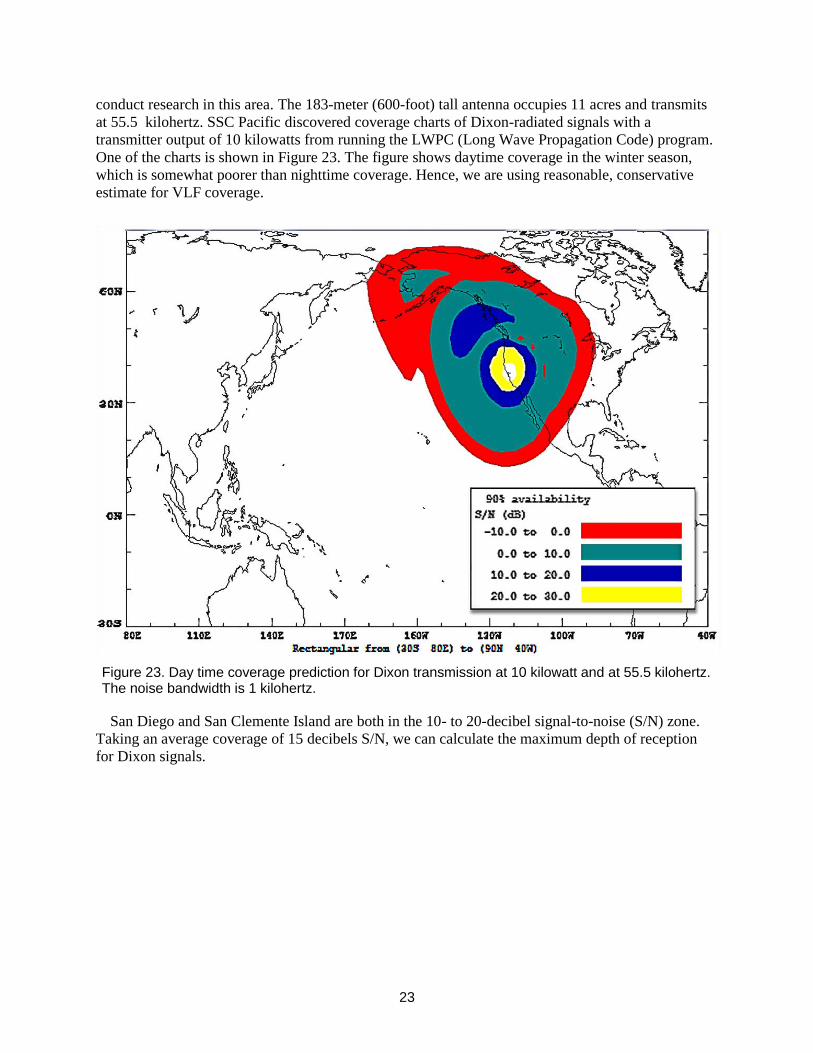
conduct research in this area. The 183-meter (600-foot) tall antenna occupies 11 acres and transmits
at 55.5 kilohertz. SSC Pacific discovered coverage charts of Dixon-radiated signals with a
transmitter output of 10 kilowatts from running the LWPC (Long Wave Propagation Code) program.
One of the charts is shown in Figure 23. The figure shows daytime coverage in the winter season,
which is somewhat poorer than nighttime coverage. Hence, we are using reasonable, conservative
estimate for VLF coverage.
Figure 23. Day time coverage prediction for Dixon transmission at 10 kilowatt and at 55.5 kilohertz. The noise bandwidth is 1 kilohertz.
San Diego and San Clemente Island are both in the 10- to 20-decibel signal-to-noise (S/N) zone.
Taking an average coverage of 15 decibels S/N, we can calculate the maximum depth of reception
for Dixon signals.

24
Consider Dixon signals being received on the surface at San Clemente Island: the S/N is 15
decibels. Now we consider lowering the antenna slowly into the water. Since the skin factor
attenuates both the signal and the noise, the S/N should stay the same as the antenna is lowered.
However, at a certain depth, the signal will be overcome by noise that originates from the
instrumentation. Our instrumentation noise is known up to around 40 kilohertz but uncertain at 55
kilohertz. However, we do know that instrumentation voltage noise below 40 kilohertz is around one
half of the surface noise (i.e., -3 decibels). We assume for now that instrumentation noise at 55.5
kilohertz is also around ½ of surface noise. Better information in the future can be used to improve
our calculations.
We use 10 log (𝑆
𝑁) = 15 𝑑𝐵 to obtain the S/N value. We get an S/N=31.62. Since S/N refers to power,
the voltage signal to noise ratio is the square root of the S/N ratio. That is, VN = 0.178 VS . Now take
½ this value as the instrument noise, or VNinstrument = 0.089 VS.
The skin depth for 55.5-kilohertz signal is found from using Equation (5) to be δ = 1.2 meters. Use
the formula e-x/δ = 0.089 results in x = 2.9 meter (~ 9.5 feet). Thus, we find that signals from Dixon
will be attenuated to instrument noise level at a depth of 2.9 meters. Note that the result is
bandwidth-dependent. For example, if the receiver bandwidth was 100 hertz instead of
1 kilohertz, then the S/N ratio would be 10 decibels more, that is, 25 decibels rather than 15 decibels.
Table 2 shows the calculated depth when signal is attenuated to instrument noise level for three
different bandwidths. The table indicates that wider bandwidths and higher data rates are possible,
but depth is reduced. If narrower bandwidths and lower data rates are tolerated, depths can be
increased. Hence, this table illustrates the motivation for research and development on a variable-
bandwidth receiver.
Table 2. Reception depth for 55.5-kilohertz signals for three bandwidths.
Bandwidth 100 Hz 1 kHz 10 kHz
Depth (m) 4.28 2.9 1.52
Depth (feet) 14.0 9.5 5.0

25
REFERENCES
Bowen, M. M., A. C. Fraser-Smith, and P. R. McGill. 1992. “Long-Term Averages of Globally-
Measured ELF/VLF Radio Noise.” Office of Naval Research Technical Report E450-2.
Johnson, R. C., and H. Jasik. 1961a. “Antenna Engineering Handbook.” page 4, section 5, McGraw-
Hill, New York, NY.
Johnson, R. C., and H. Jasik. 1961b. “Antenna Engineering Handbook.” page 5, section 2, McGraw-
Hill, New York, NY.
Physics Lab, 2017. Available at
http://dev.physicslab.org/Document.aspx?doctype=3&filename=Magnetism_BiotSavartLaw2.xm
l. Accessed 8/5/2017.
Research and Education Association (REA). “The Electromagnetic Problem Solver.” 1983. REA,
New York, NY. p A-4.
WFS Technologies, Ltd. 2017. “Seatooth Application User Manual.” Support available at www.wfs-
tech.com.

5f. WORK UNIT NUMBER
REPORT DOCUMENTATION PAGE Form Approved
OMB No. 0704-01-0188
The public reporting burden for this collection of information is estimated to average 1 hour per response, including the time for reviewing instructions, searching existing data sources, gathering and maintaining the data needed, and completing and reviewing the collection of information. Send comments regarding this burden estimate or any other aspect of this collection of information, including suggestions for reducing the burden to Department of Defense, Washington Headquarters Services Directorate for Information Operations and Reports (0704-0188), 1215 Jefferson Davis Highway, Suite 1204, Arlington VA 22202-4302. Respondents should be aware that notwithstanding any other provision of law, no person shall be subject to any penalty for failing to comply with a collection of information if it does not display a currently valid OMB control number.
PLEASE DO NOT RETURN YOUR FORM TO THE ABOVE ADDRESS. 1. REPORT DATE (DD-MM-YYYY) 2. REPORT TYPE 3. DATES COVERED (From - To)
4. TITLE AND SUBTITLE 5a. CONTRACT NUMBER
5b. GRANT NUMBER
5c. PROGRAM ELEMENT NUMBER
5d. PROJECT NUMBER
5e. TASK NUMBER
6. AUTHORS
7. PERFORMING ORGANIZATION NAME(S) AND ADDRESS(ES) 8. PERFORMING ORGANIZATION REPORT NUMBER
10. SPONSOR/MONITOR’S ACRONYM(S)
11. SPONSOR/MONITOR’S REPORTNUMBER(S)
9. SPONSORING/MONITORING AGENCY NAME(S) AND ADDRESS(ES)
12. DISTRIBUTION/AVAILABILITY STATEMENT
13. SUPPLEMENTARY NOTES
14. ABSTRACT
15. SUBJECT TERMS
16. SECURITY CLASSIFICATION OF:
a. REPORT b. ABSTRACT c. THIS PAGE17. LIMITATION OF
ABSTRACT
18. NUMBEROFPAGES
19a. NAME OF RESPONSIBLE PERSON
19B. TELEPHONE NUMBER (Include area code)
Standard Form 298 (Rev. 10/17)
Prescribed by ANSI Std. Z39.18
December 2017 Final
Land and Undersea Field Testing
of Very Low Frequency RF Antennas
and Loop Transceivers
Dr. Jack Dea
Dusan Radosevic
Nghia Tran
Jose Chavez
Dr. Burton Neuner III
SSC Pacific
53560 Hull Street
San Diego, CA 92152–5001
Office of Naval Research Forward Deployed Energy and Communications Outpost
Innovative Naval Prototype Program
875 N. Randolph Street
Arlington, VA 22203-1995
TR 3078
ONR FDECO INP
Approved for public release.
This is work of the United States Government and therefore is not copyrighted. This work may be copied and disseminated
without restriction.
The Office of Naval Research "Forward Deployed Energy and Communications Outpost (FDECO)" Program is an Innovative Naval Prototype
(INP). One of the critical wireless data link methods under the program is very low frequency (VLF) radio frequency (RF) communication in the
ocean environment. This report presents experiments and findings for VLF RF communications using both commercial off the shelf (COTS)
transceivers acquired from vendor Wireless For Subsea (WFS) and low-cost loop antennas that were designed and built at SSC Pacific. The
WFS system was tested for its capabilities, which include power consumption, error rate, signal strength, signal-to-noise ratio, and extrapolated
range. Similar capabilities of the SSC Pacific-built loop transceiver system were also determined. The report presents the mechanical and
logistical aspects of sea testing. The results verified that both transceiver systems performed as designed. The results also showed that the WFS
system has a subsea link range up to 30 meters using 10 watts of power, while the loop antenna system has a range of 30 meters using 6.4 watts.
Several follow-on experiments that build upon the successes described herein are proposed.
WFS Technologies, Ltd.; loop antenna; undersea testing; Manchester encoding; SSC Pacific; low noise amplifier; reception depth;
VLF; RF
Burton Neuner III
(619) 553-2885 U U U U 34

INITIAL DISTRIBUTION
84300 Library (1)
85300 Archive/Stock (1)
55320 J. Chavez (1)
55360 B. Neuner III (1)
56170 D. Radosevic (1)
56480 J. Dea (1)
71710 N. Tran (1)
Defense Technical Information Center
Fort Belvoir, VA 22060–6218 (1)

Approved for public release.
SSC Pacific San Diego, CA 92152-5001