lancaster commercial & industrial real estate market
TRANSCRIPT

Lancaster Commercial & Industrial Real Estate Market Presentation
Presented By: High Real Estate Group LLCFebruary 10, 2021

Welcome

8:15 – 9:15 AM Presentation
9:15 – 9:30 AM Questions and Answers
2
Agenda: High Real Estate Group C&I Council
Mark FitzgeraldPresident &
Chief Operating Officer
Michael LorelliSr. Vice President
Commercial Asset Management
Bill BobenSr. Vice President
Sales/Leasing
Powell ArmsSr. Vice President, Managing Director
Retail Division
Brad MowbraySr. Vice President, Managing Director
Residential Division
David AungstPresident
High Hotels
4
President & Chief Operating OfficerHigh Real Estate Group LLC
Mark Fitzgerald

Presentation: Three Areas Of Focus
5
Overall Economy Nationwide Real Estate
Lancaster Real Estate
COVID-19 update
GDP projections
Disposable income
and saving rate
Employment
Acquisition/
Development sentiment
Cap Rate trends
Underwriting criteria
Real Estate cycle for
each asset class
Office
Industrial

Cases, Hospitalizations, and Deaths All Declining from December
6
NationalPA
COVID-19 DeathsHospitalizations
COVID-19 Deaths% of Population Vaccinated Through January 25, 2021
Source: Becker's Hospital Review; CDC, US Bureau of Labor Statistics, The COVID Tracking Project
12.6%
6.9%
12.2%
5.8%
0%
5%
10%
15%
Distributed Administered
41.4M 1.5M
22.7M 75K
New Confirmed Cases 7-Day Moving Average COVID-19 Deaths 7 Day Moving Average
NationalPA National
PA
NationalPA

16
17
18
19
20
21
224Q
191Q
202Q
203Q
204Q
201Q
212Q
213Q
214Q
211Q
222Q
223Q
224Q
221Q
232Q
233Q
234Q
231Q
242Q
243Q
244Q
24
Peak 10 Yr CAGR Low Median High
Uncertain Timeline for Economic Recovery
7
GDP T$Recession Recovery
Recession Trough
FOMC December 2020 Annual GDP Growth Projections
Low Median High Survey2020 -3.3% -2.4% -1.0%2021 0.5% 4.2% 5.5% 2.90%2022 2.5% 3.2% 4.0%2023 2.0% 2.4% 3.5%2024 1.6% 1.8% 2.2%
Actual 2020: -3.5%
Speed of Recovery Depends on:
Effective delivery and acceptance of vaccines Potential impact of variant strains Transition to new administration Disruptive Brexit process (impact on EU) Global trade tensions
Source: Impact of Pandemic, effects-of-selected-federal-pandemic-response-programs-on-personal-income-2020q4; High Real Estate Group, C&I Council 2020 Survey
20% Survey
25% Survey
Return to prior level
ActualActual
10
11
12
13
14
15
16
17
18
2018 2019 2020
1.2 1.2 1.2
7.8%7.5%
16.4%
6%
8%
10%
12%
14%
16%
18%
0
1
2
3
4
2018 2019 2020
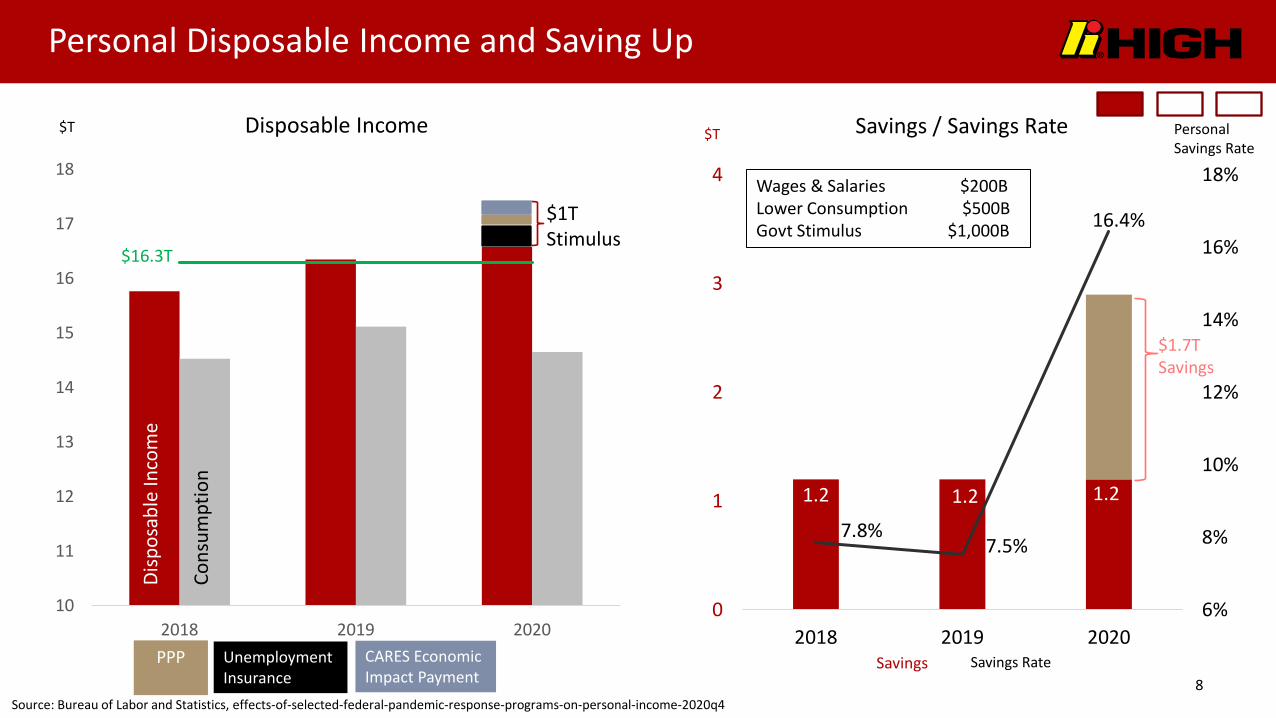
Personal Disposable Income and Saving Up
8
Savings / Savings Rate
Savings RateSavings
Disp
osab
le In
com
e
Unemployment Insurance
PPP CARES Economic Impact Payment
$1T Stimulus
$1.7T Savings
Wages & Salaries $200BLower Consumption $500BGovt Stimulus $1,000B
Source: Bureau of Labor and Statistics, effects-of-selected-federal-pandemic-response-programs-on-personal-income-2020q4
$T $T Personal Savings Rate
$16.3T
Cons
umpt
ion
Disposable Income

Nearly 9 Million Remain Unemployed/Left the Workforce
9Source: US Bureau of Labor Statistics
-4,000 -3,500 -3,000 -2,500 -2,000 -1,500 -1,000 -500 0
Mining and LoggingConstruction
ManufacturingWholesale Trade
Retail TradeTransportation and Warehousing
UtilitiesInformation
Financial ActivitiesProfessional and Business Services
Education and Health ServicesLeisure and Hospitality
Other ServicesGovernment
Seasonally Adjusted Job Loss by Industry January through December 2020
Thousands
-30
-25
-20
-15
-10
-5
0
5
People Out of Work During the Pandemic
Unemployment Effect Labor Force Effect
Millions

National Sentiment for Real Estate Acquisition / Development Is Fairly Steady
10Source: PWC, ULI; Emerging Trends in Real Estate 2020
Excellent Excellent
Good Good
Fair
Poor
Abysmal
Fair
Poor
Abysmal
Acquisitions Developments
0
1
2
3
4
5
2020 2021
0
1
2
3
4
5
2020 2021

National Real Estate Overview: Cap Rate Moving Higher
Ranges widened on all assets, except Suburban Office Market fundamentals for CBD Office, Retail and Hospitality
deteriorating in most markets Debt & Equity remain available, but more focused
11Source : PWC Real Estate Investor Survey 3rd/4th Q2020
Range 2020 Average
Change from 2019
BPS
Apartments 3.50 – 8.00% 5.25% 7 bps
Warehouse 3.40 – 7.00% 4.83% -2 bps
Suburban Office 4.00 – 7.75% 6.00% -36 bps
CBD Office 3.75 – 8.00% 5.65% 13 bps
Neighborhood/Strip Centers
5.00 – 10.00% 7.30% 55 bps
Limited-ServiceHotels
7.50 – 12.00% 9.50% 35 bps
C&I All Asset Class Survey Results
2%
21%
56%
16%
5%
0%
10%
20%
30%
40%
50%
60%
25 - 50 bps
+50 bps
25 - 50 bps
+50 bps

2021 Underwriting Criteria
12
Max LTV Vacancy Cap Rate Spread All in Rate
Residential 65-75% 5-10% 5.0-6.5% 1.75-2.50% 2.85-3.60%
Industrial 65-75% 5-10% 5.5-7.0% 1.75-2.50% 2.85-3.60%
Office Suburban 60-70% 10-15% 6.5-8.5% 2.10-3.10% 3.20-4.20%
Retail (“Anchored”) 65-75% 10-15% 6.0-8.0% 2.00-3.00% 3.10-4.10%
Hotel 50-60% 40-50% 10.0-15.0% 3.00-4.00% 4.10-5.10%
Source: M&T Realty Capital Corporation; Data as of January 2021
Debt capital available for acquisitions and refinancing of all asset classes, except hotels Debt capital for new development will become more challenging
Range for 10-year treasury projections = 1.1– 1.5%

Industrial Real Estate Cycle
Lancaster 2020: (0)
Source: University of Denver – Real Estate Market Cycles; Lancaster: High Real Estate Group LLC; PWC; Urban Land Institute 2020; CBRE Research, Real Estate Market Outlook 2020
National 2020: (+1)
Philadelphia 2020: (0)
E-commerce continues to drive demand Sales grew by 20% to $150B in 2020
“Just in Time” transitioning to “Just in Case” Supply chain concerns and unexpected increase
in demand increases inventory on hand from 15 days to 60 days
Last mile/(touch) and refrigerated warehouse are fast growing segments
Demand for warehouse space could grow by 400M SF over next few years
Factors driving location decisions: land availability, workforce, affordable housing, amenities (athletic space, breakrooms, food offerings) 13
1110
Phase II - Expansion
Phase IV - Recession
Phase III - Hypersupply
Phase I - Recovery
Third Quarter 2020Major Trends
Actual2020
Projected2021
Occupancy (0.8%) 0%
Rents 4.8% 4.1%
YOY National Change
12

Multi-Family Real Estate Cycle
Source: University of Denver – Real Estate Market Cycles; Lancaster: High Real Estate Group LLC; PWC; Urban Land Institute 2020; CoStar
Demographics support mid & long-term demand for “traditional” and “renter by choice” segments
Short-term employment uncertainty could impact cash flow stability and market valuations
Demand shifting from dense urban to suburban garden/low rise infill properties
Design trends include greater focus on access to high-speed internet, larger unit size, extra bedrooms/dens, fitness & health
Biggest challenge will be meeting the increased demand for quality work-force and affordable housing
Supply constraints State and local regulations Low availability of zoned land Increased construction cost
14
Phase II - Expansion
Phase IV - Recession
Phase III - Hypersupply
Phase I - Recovery
Third Quarter 2020
Lancaster 2020: (0)Philadelphia 2020: (0)
National 2020: (0)
Major Trends
1211
Actual2020
Projected2021
Occupancy 0.2% (0.4%)
Rents 2.0% 0.1%
YOY National Change

Phase II - Expansion
Phase IV - Recession
Phase III - Hypersupply
Phase I - Recovery
Office Real Estate Cycle
Source: University of Denver – Real Estate Market Cycles; Lancaster: High Real Estate Group LLC; PWC; Urban Land Institute 2020; Eurostat, C&W, JLL, REIS, PGIM Real Estate January 2020; CBRE Research, Real Estate Market Outlook 2020
Third Quarter 2020 Work from Home (WFH)
Potential Change Over Next Decade “Sometime” (1-3 days) from 10% to 25% “Usually” (4-5 days) from 5% to 10%
(Finland/Netherlands represent upper limit)
Suburban office will rebound quicker than CBD office
Rents/Occ. will bottom Q1/ Q2 2022, respectively
Office Trends: Moving toward decentralized location, less
dense space plans, more private offices with less shared work area and more technology
Medical office will be strongest segment
15
8National 2020: (-1)
Philadelphia 2020: (0)Lancaster 2020: (-1)
Major Trends
YOY National ChangeActual2020
Projected2021
Occupancy (1.0%) (1.8%)
Rents (1.0%) (1.5%)
7

Retail Real Estate Cycle
Source: University of Denver – Real Estate Market Cycles; Lancaster: High Real Estate Group LLC; PWC; Urban Land Institute 2020; Moody’s Analytics REIS, Nov 2020 and Univ of Denver report
Demand for bricks & mortar stores declining at accelerating rate due to:• Increase in e-commerce• Aging baby boomers (travel vs purchase)• Millennials have less discretionary income• Stagnant wage growth
Bars & restaurants are the only in store retailer to exceed GDP growth over the last 10yrs
Over half of retailers have less than 20 employees. Many may not survive the pandemic
B, C & D malls will be repositioned or demolished at an accelerating rate
16
Phase II - Expansion
Phase IV - Recession
Phase III - Hypersupply
Phase I - Recovery
Third Quarter 2020
Lancaster 2020: (0)12 National 2020: (+2)
Philadelphia 2020: (+2)
Major Trends
Actual2020
Projected2021
Occupancy (0.5%) (0.4%)
Rents (0.5%) 0
YOY National Change

Premium Select Service Hotel Real Estate Cycle
Source: University of Denver – Real Estate Market Cycles; Lancaster: High Real Estate Group LLC, PWC, Urban Land Institute 2020, STR and Tourism Economics, AHLA State of Hotel Industry 2021 - January 2021
Industry may face unprecedented number of foreclosures. Capital is only available for the strongest operators
Return to 2019 demand levels in 2023. ADR to return to 2019 levels in 2024
Limited projected demand in 2021 Leisure is primary demand generator Last-minute bookings are increasing Business travel anticipated in 2021
Q2/Q3
Extended stay properties in leisure markets have strongest performance
Pressure to balance cleanliness and guest experience expectations with cash flow pressures
17
Phase II - Expansion
Phase IV - Recession
Phase III - Hypersupply
Phase I - Recovery
Third Quarter 2020
National 2020: (-10)Philadelphia 2020: (-10)Lancaster 2020: -12)
Major Trends
Actual2020
Projected2021
Occupancy (36%) 27%
Rate (21%) 6%
RevPAR (50%) 35%
YOY National Change
1

18
Sr. Vice President Commercial Asset ManagementHigh Associates Ltd.
Michael Lorelli

Research – Primary Research
Secondary sources (CoStar, MLS)
Owner occupied properties are excluded (e.g. Nordstrom and Urban Outfitters)
Office – Institutional-grade, for lease (244 buildings, 5.6M SF)
Over 5,000 SF in size
Lancaster City, Manheim Township, East Hempfield, and East Lampeter Townships
Industrial – Institutional-grade, for lease (383 buildings, 24.1M SF)
Over 10,000 SF in size
Lancaster County
Methodology For Lancaster Market Research
19Source: The Lancaster market statistics are compiled by the High Real Estate Group

Two projects totaling 31,500 SF completed in 2020
Four new office projects in construction or proposed totaling 165,209 SF
Class A existing market rental rates remained flat in 2020:
Existing space $23-$26/SF Gross
New space $32-$35/SF Gross
20
Office: Lancaster – Flat
Source: The Lancaster market statistics are compiled by the High Real Estate Group LLC; CoStar for rent rate data

21
Lancaster Market Comparison: Single Digit Vacancy For All Products
2016 2017 2018 2019 2020 5-Year Average
Clas
s “A”
Offi
ce Absorption 87,988 75,273 83,039 116,300 (25,491) 67,422
Vacancy 10.9% 10.2% 5.9% 5.5% 7.6%
Amount Constructed 28,000 0 12,000 126,666 0 33,333
Available Supply 207,503 132,230 61,191 71,546 97,037
“B/C
” O
ffice
Absorption 59,167 36,732 136,537 70,723 (44,651) 51,702
Vacancy 13.2% 8.5% 5.3% 3.2% 4.3%
Amount Constructed 0 0 0 0 0 0
Available Supply 360,527 323,795 187,258 116,535 161,186
Busin
ess C
ente
r Absorption 14,873 32,739 (20,828) 105,507 (12,069) 18,944
Vacancy 11.2% 13.2% 15.8% 8.1% 13.4%
Amount Constructed 0 0 0 32,000 31,500 6,400
Available Supply 134,082 101,343 122,171 48,664 86,233

Two new projects completed totaling 342,800 SF 2220 Embassy Dr: 90,000 SF 601 Stony Battery Rd: 252,800 SF
Four buildings under construction or shovel-ready, totaling 628,394 SF
Three buildings totaling 964,000 SF actively marketed as available or soon to be
Existing market rate increased 2.0% for industrial: Existing space $5.95/SF NNN New space $6.05-$7.00/SF NNN
Market rate increased 3%-5% for flex, average $9.50/SF NNN
Gap between increased construction costs and market rates is closing
22
Industrial: Lancaster – Strong Market Driving Development Interest
Source: The Lancaster market statistics are compiled by the High Real Estate Group LLC; CoStar for rental rate data

2016 2017 2018 2019 2020 5-Year Average
Indu
stria
l Spa
ce
Absorption (232,207) 552,062 109,123 989,704 13,233 286,383
Vacancy 7.5% 3.2% 3.5% 5.2% 6.6%
Amount Constructed 199,800 0 120,718 1,487,671 342,800 430,198
Available Supply 1,311,020 758,958 770,553 1,268,570 1,598,137
Flex
Spa
ce
Absorption 23,125 21,899 (9,339) 58,654 11,101 21,088
Vacancy 10.2% 4.1% 4.5% 1.4% 0.7%
Amount Constructed 0 0 0 0 0 0
Available Supply 94,831 72,932 82,271 23,617 12,516
23
Lancaster Market Comparison: Industrial Enters Fourth Strong Year

How will the 2020 Commercial & Industrial leasing volume (S.F.) compare to 2019? (Lancaster Market)
How will the 2020 Commercial & Industrial sales volume ($) compare to 2019? (Lancaster Market)
C & I Survey Results, Questions 5 & 7
0 10 20 30 40
Significantly Lower
Lower
About the Same
Higher
Significantly Higher
0 10 20 30 40 50 60
Significantly Lower
Lower
About the Same
Higher
Significantly Higher
Results:• 2019 $521M volume• 2020 $302M volume (42%)
Results:• 2019 4.85M S.F.• 2020 2.25M S.F. (53.6%)
Source: Costar Realty Information, Ben Atwood; C&I Council 2020 Survey

25
Sr. Vice President, Managing Director Retail DivisionHigh Associates Ltd.
Powell Arms

Online sales are accelerating in both dollars and type of purchases (grocery/non-grocery), but pace of growth is unsustainable
C&I survey response • 69% felt food & entertainment was 1st or 2nd most impacted
• 73% felt grocery least impacted
• Online grocery sales in Lancaster increased 12.5% vs 40% nationally (on top of 25% growth in 2019)
There will be an unprecedented shakeout of retailers
Industry remains bullish on recovery of experiential retail, and reimagined grocery when it is safe to return to stores
26
Non-Grocery & Grocery Online Purchases Changed Since the Pandemic
Source: Coresight Research; High Real Estate Group; C&I Council 2020 Survey

27
PresidentHigh Hotels Ltd.
David Aungst

Timing of recovery varies by location and type (RevPar = 2019)
Suburban vs Urban
Select Service vs Full Service
Leisure vs Business/Group
Central PA RevPAR decline (2020 vs 2019) York (44%) Reading (46%) Lancaster (51%) Harrisburg (56%)
Factors impacting Lancaster recovery
Stabilized supply (finally)
Strong drive to leisure market
Limited national transactions in 2020
Large bid / ask spreads
Distress is to come
28
Hospitality: Lancaster – Road to Recovery
Source: Kailibri Labs – Hotel Dashboard Report as of February 1, 2021; Total U.S. In Review

Questions?

Annual C&I Council Meeting Pre-Presentation Survey
Thank you to the 100+ respondents who completed the survey to provide consumer insight and sentiment as we look ahead.

Q1: What will the national GDP growth rate be in 2021?
Answered: 110 Skipped: 2

Q2: When will the national GDP output return to pre-pandemic levels?
Answered: 110 Skipped: 2

Q3: What will interest rates be in 2021? (10-year Treasury)
Answered: 109 Skipped: 3

Q4: What will CAP rates be in 2021 vs 2020? (all asset classes)
Answered: 110 Skipped: 2

Q5: How will the 2020 Commercial & Industrial sales volume ($) compare to 2019? (Lancaster Market)
Answered: 101 Skipped: 11

Q6: How will the 2021 Commercial & Industrial sales volume ($) compare to 2020? (Lancaster Market)
Answered: 101 Skipped: 11
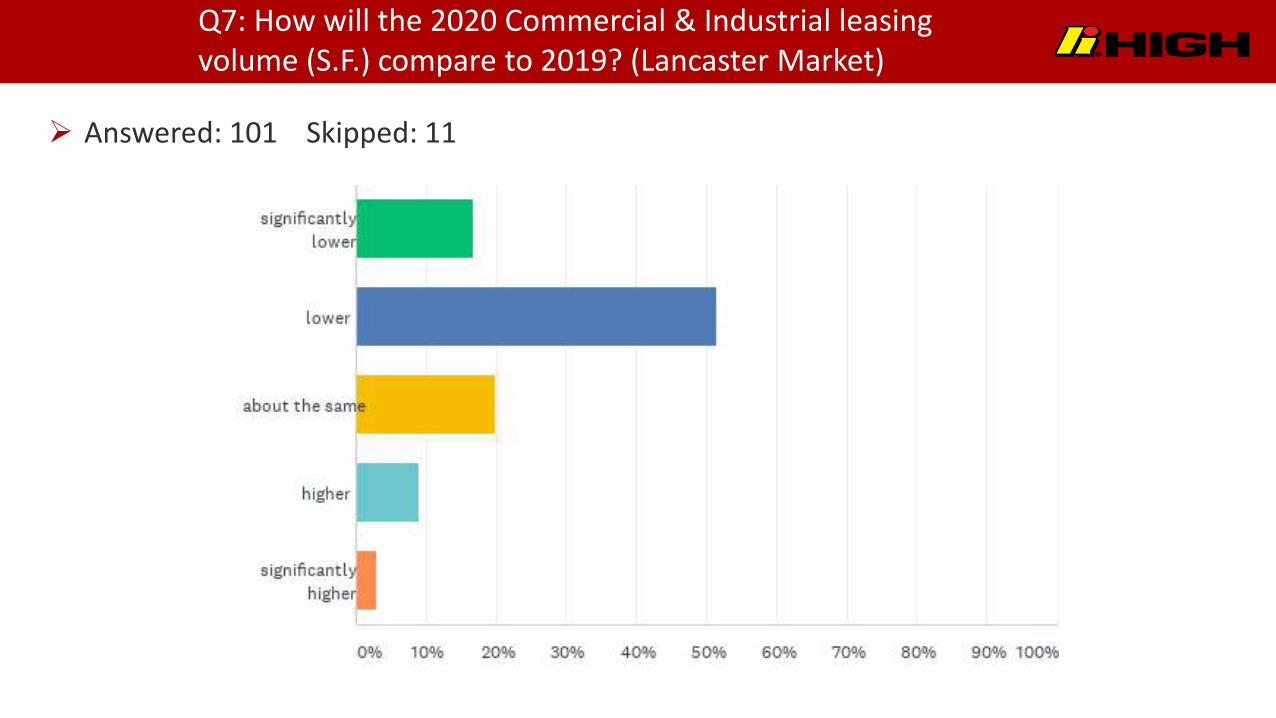
Q7: How will the 2020 Commercial & Industrial leasing volume (S.F.) compare to 2019? (Lancaster Market)
Answered: 101 Skipped: 11

Q8: How will the 2021 Commercial & Industrial leasing volume (S.F.) compare to 2020? (Lancaster Market)
Answered: 102 Skipped: 10

Q9: When do you anticipate returning to the workplace on a consistent basis? (Lancaster Market)
Answered: 100 Skipped: 12

Q10: After returning to workplace on a consistent basis, how frequently will you be working from the workplace compared to pre-pandemic levels? (Lancaster Market)
Answered: 94 Skipped: 18

Q11: What impact will the pandemic have on the square feet of office space occupied by your organization?
Answered: 99 Skipped: 13

Q12: How do you think the pandemic has impacted demand for multi-family residence in the Lancaster market?
Answered: 99 Skipped: 13
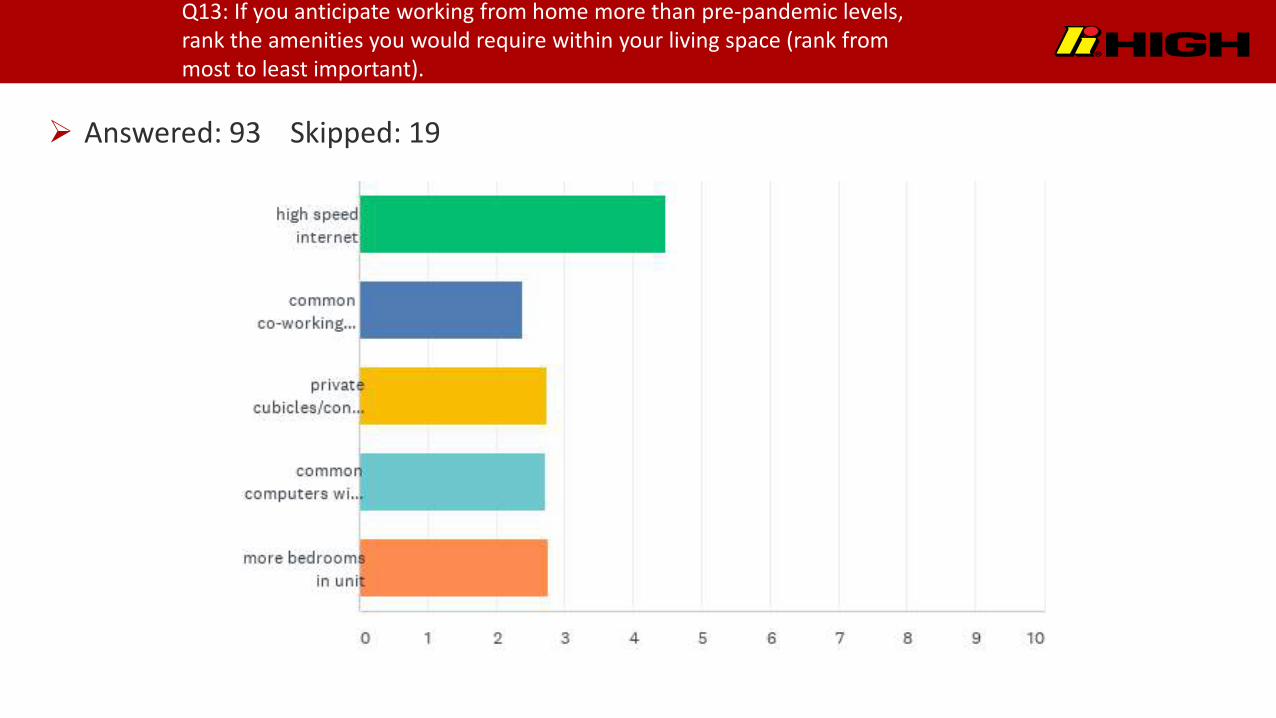
Q13: If you anticipate working from home more than pre-pandemic levels, rank the amenities you would require within your living space (rank from most to least important).
Answered: 93 Skipped: 19

Q14: How has your non-grocery online purchases changed since the pandemic?
Answered: 101 Skipped: 11
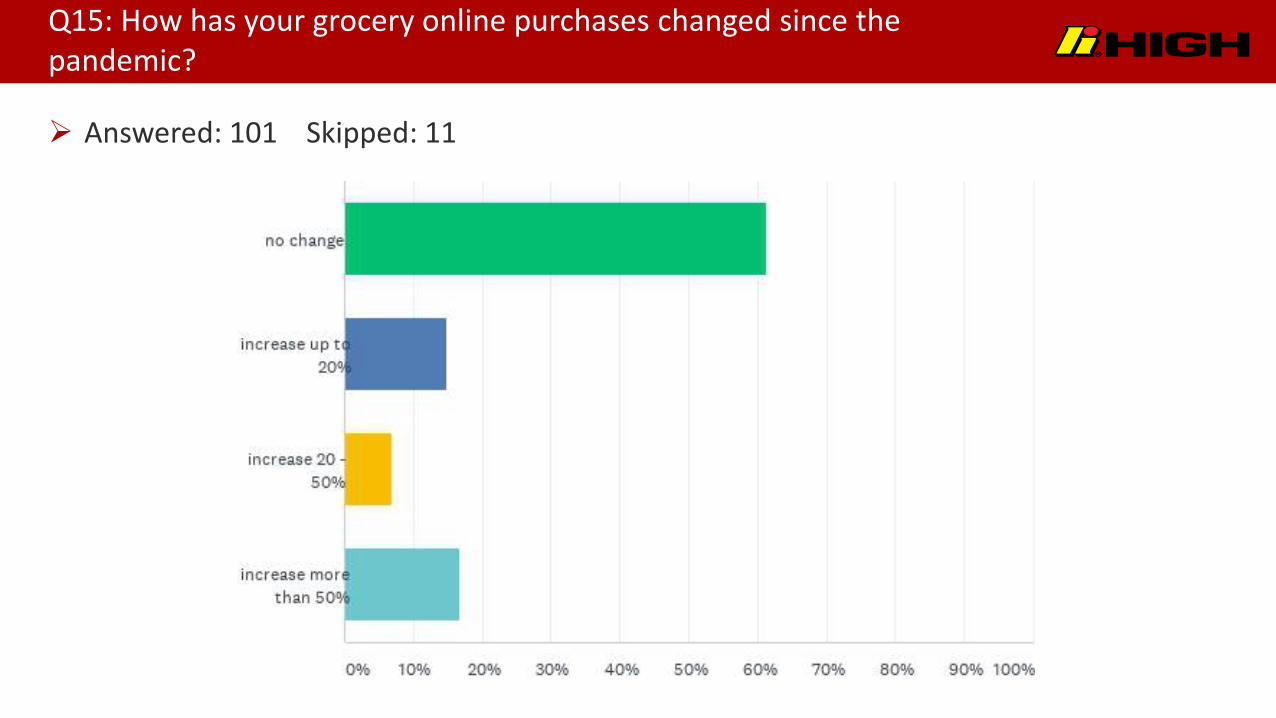
Q15: How has your grocery online purchases changed since the pandemic?
Answered: 101 Skipped: 11

Q16: When do you think in-person buying (both groceries and non-groceries) in the Lancaster market will return to pre-pandemic levels?
Answered: 101 Skipped: 11

Q17: Rank the retail asset types that will most negatively be impacted by the pandemic (rank most to least impacted).
Answered: 101 Skipped: 11

Q18: Rank the industrial uses that will experience the most growth (S.F) within the Lancaster Market over the next five years (rank most to least anticipated growth).
Answered: 96 Skipped: 16

Q19: Rank the issues impacting future industrial growth within the Lancaster Market over the next five years (rank most to least challenging).
Answered: 96 Skipped: 16

Q20: When will your business allow drive-able business travel to return to pre-pandemic levels?
Answered: 97 Skipped: 15

Q21: When will your business allow business-air travel to return to pre-pandemic levels?
Answered: 97 Skipped: 15

Q22: When will your leisure travel return to pre-pandemic levels?
Answered: 97 Skipped: 15