lambdagrids--earth and planetary sciences driving high performance networks and high resolution...
TRANSCRIPT
"LambdaGrids--Earth and Planetary Sciences Driving High Performance Networks and
High Resolution Visualizations"
Invited Talk to the
NASA Jet Propulsion Laboratory
Pasadena, CA
February 4, 2005
Dr. Larry Smarr
Director, California Institute for Telecommunications and Information Technology
Harry E. Gruber Professor,
Dept. of Computer Science and Engineering
Jacobs School of Engineering, UCSD
Chair, NASA Earth System Science and Applications Advisory Committee

AbstractWhile the Internet and the World Wide Web have become ubiquitous, their shared nature severely limits the bandwidth available to an individual user. However, during the last few years, a radical restructuring of optical networks supporting e-Science projects is beginning to occur around the world. Amazingly, scientists are now able to acquire the technological capability for private 1-10 Gbps light pipes (termed "lambdas"), which create deterministic network connections coming right into their laboratories.
Two of the largest research projects on LambdaGrids are the NSF- funded OptIPuter (www.optiputer.net) and its new companion LOOKING (http://lookingtosea.ucsd.edu/), which is prototyping an interactive ocean observatory. The OptIPuter has two regional cores, one in Southern California and one in Chicago, which has now been extended to Amsterdam. One aim of the OptIPuter project is to make interactive visualization of remote gigabyte data objects as easy as the Web makes manipulating megabyte-size data objects today
As earth and planetary sciences move toward an interactive global observation capability, a new generation of cyberinfrastructure is required, based on LambdaGrids. LOOKING and OptIPuter are prototyping realtime control of remote instruments, remote visualization or large data objects, metadata searching of federated data repositories, and collaborative analysis of complex simulations and observations. Calit2 is currently expanding its OptIPuter collaboration partners to include the NASA Science centers, JPL, Ames, and Goddard -- coupling ocean and climate supercomputer simulations with global earth satellite repositories and interactive viewing tens of megapixels of Mars Rover scenes.

Optical WAN Research Bandwidth Has Grown Much Faster than Supercomputer Speed!
1.E+00
1.E+01
1.E+02
1.E+03
1.E+04
1.E+05
1.E+06
1985 1990 1995 2000 2005
Ba
nd
wid
th (
Mb
ps
)
Megabit/s
Gigabit/s
Terabit/s
Source: Timothy Lance, President, NYSERNet
Full NLR
1 GFLOP Cray2
60 TFLOP Altix
Bandwidth of NYSERNet Research Network Backbones
T1
3210Gb
“Lambdas”
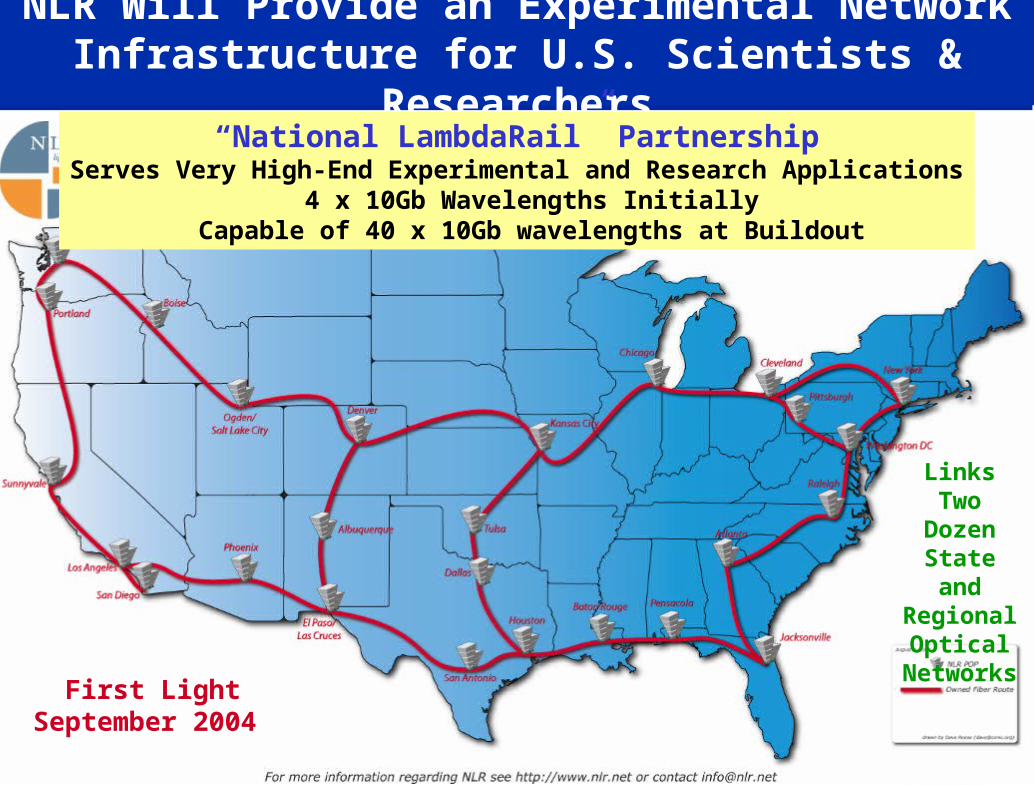
NLR Will Provide an Experimental Network Infrastructure for U.S. Scientists & Researchers
First LightSeptember 2004
“National LambdaRail” PartnershipServes Very High-End Experimental and Research Applications
4 x 10Gb Wavelengths Initially Capable of 40 x 10Gb wavelengths at Buildout
Links Two Dozen
State and Regional Optical
Networks

NASA Research and Engineering Network (NREN) Overview
• Next Steps
– 1 Gbps (JPL to ARC) Across CENIC (February 2005)
– 10 Gbps ARC, JPL & GSFC Across NLR (May 2005)
– StarLight Peering (May 2005)
– 10 Gbps LRC (Sep 2005)
• NREN Goal – Provide a Wide Area, High-speed Network for
Large Data Distribution and Real-time Interactive Applications
GSFCGSFCARCARC
StarLightStarLight
LRCLRC
GRCGRC
MSFCMSFCJPLJPL
NREN WAN
10 Gigabit EthernetOC-3 ATM (155 Mbps)
NREN Target: September 2005
– Provide Access to NASA Research & Engineering Communities - Primary Focus: Supporting Distributed Data Access to/from Project Columbia
• Sample Application: Estimating the Circulation and Climate of the Ocean (ECCO)
– ~78 Million Data Points
– 1/6 Degree Latitude-Longitude Grid
– Decadal Grids ~ 0.5 Terabytes / Day
– Sites: NASA JPL, MIT, NASA Ames
Source: Kevin Jones, Walter Brooks, ARC
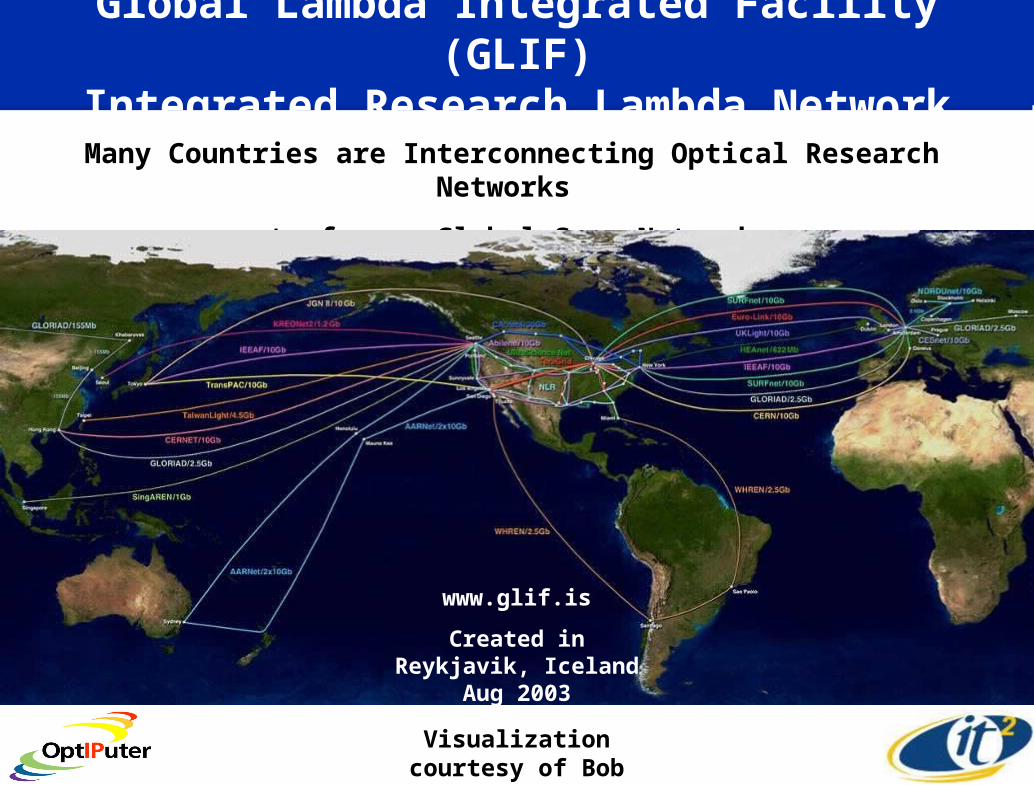
Global Lambda Integrated Facility (GLIF)Integrated Research Lambda Network
Many Countries are Interconnecting Optical Research Networks
to form a Global SuperNetwork
Visualization courtesy of Bob Patterson, NCSA
www.glif.is
Created in Reykjavik, Iceland Aug 2003
September 26-30, 2005University of California, San Diego
California Institute for Telecommunications and Information Technology
Announcing…
iGrid
2oo5T H E G L O B A L L A M B D A I N T E G R A T E D F A C I L I T Y
Call for Applications Using the GLIF SuperNetwork
Maxine Brown, Tom DeFanti, Co-Organizers
www.startap.net/igrid2005/
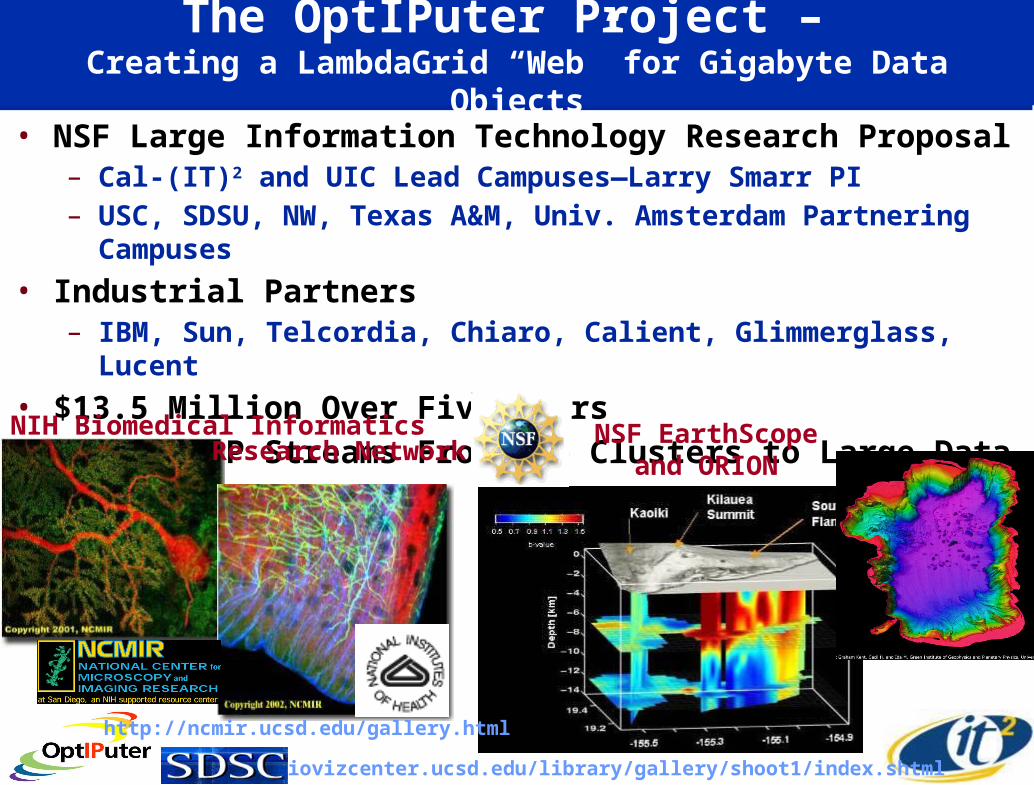
The OptIPuter Project – Creating a LambdaGrid “Web” for Gigabyte Data Objects
• NSF Large Information Technology Research Proposal– Cal-(IT)2 and UIC Lead Campuses—Larry Smarr PI– USC, SDSU, NW, Texas A&M, Univ. Amsterdam Partnering Campuses
• Industrial Partners– IBM, Sun, Telcordia, Chiaro, Calient, Glimmerglass, Lucent
• $13.5 Million Over Five Years• Optical IP Streams From Lab Clusters to Large Data Objects NIH Biomedical Informatics NSF EarthScope
and ORION
http://ncmir.ucsd.edu/gallery.html
siovizcenter.ucsd.edu/library/gallery/shoot1/index.shtml
Research Network
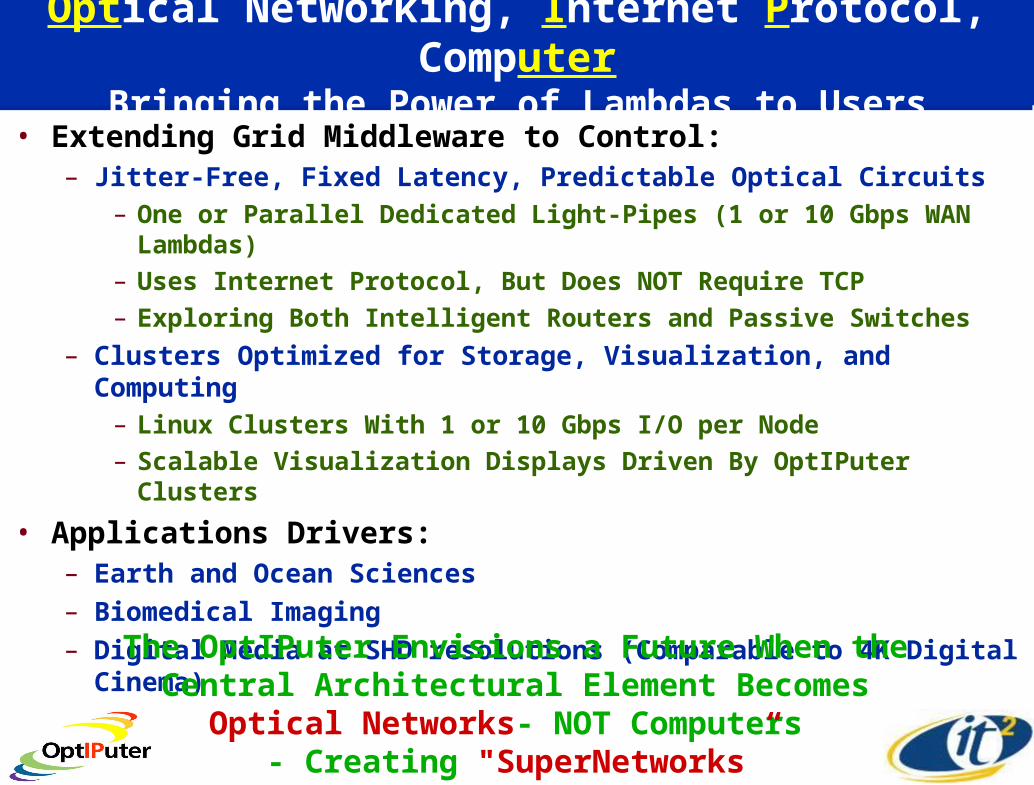
Optical Networking, Internet Protocol, ComputerBringing the Power of Lambdas to Users
• Extending Grid Middleware to Control:– Jitter-Free, Fixed Latency, Predictable Optical Circuits
– One or Parallel Dedicated Light-Pipes (1 or 10 Gbps WAN Lambdas)– Uses Internet Protocol, But Does NOT Require TCP – Exploring Both Intelligent Routers and Passive Switches
– Clusters Optimized for Storage, Visualization, and Computing– Linux Clusters With 1 or 10 Gbps I/O per Node– Scalable Visualization Displays Driven By OptIPuter Clusters
• Applications Drivers: – Earth and Ocean Sciences– Biomedical Imaging– Digital Media at SHD resolutions (Comparable to 4K Digital Cinema)
The OptIPuter Envisions a Future When the Central Architectural Element Becomes Optical Networks-
NOT Computers - Creating "SuperNetworks”

History of NASA and the OptIPuter
• Feb 2001 Starlight Lambda Open Exchange Point for USA--Initial Implementation
• Oct 2001 OptIPuter Planning Begins
• Sept 2002 iGRID 2002 in Amsterdam
• Oct 2002 NSF OptIPuter Project Begins
• May 2003 GSFC Visit-Diaz Asks Milt Halem to Define NASA OptIPuter Project
• Aug 2003 Global Lambda Integrated Facility Formed
• Nov 2003 SC03 Discussions
• Feb 2004 GSFC IRAD Funded to Create GSFC/SIO Lambda Collab
• Feb 2004 ESSAAC Meeting at SIO
• Mar 2004 Presentation to NAC on IT Survey
• May 2004 Presentation of IT Recommendations to NAC
• July 2004 Project Columbia Approved
• Aug 2004 ARC Visit
• Oct 2004 NLR and CAVEwave First Light
• Nov 2004 GSFC at SC04 Becomes Early User of NLR
• Jan 2005 NASA Commits to NREN Use of NLR for Multiple Sites
• Today JPL Visit

GSFC IRAD Proposal "Preparing Goddard for Large Scale Team Science in the 21st Century:
Enabling an All Optical Goddard Network Cyberinfrastructure”
• “…establish a 10 Gbps Lambda Network from GSFC’s Earth Science Greenbelt facility in MD to the Scripps Institute of Oceanography (SIO) over the National Lambda Rail (NLR)”
• “…make data residing on Goddard’s high speed computer disks available to SIO with access speeds as if the data were on their own desktop servers or PC’s.”
• “…enable scientists at both institutions to share and use compute intensive community models, complex data base mining and multi-dimensional streaming visualization over this highly distributed, virtual working environment.”
11Source: Milt Halem, GSFC
Objectives SummaryFunded February 2004
Current Goal- Add in ARC and JPL

UCSD
StarLight Chicago
UIC EVL
NU
CENIC San Diego GigaPOP
CalREN-XD
8
8
Expanding the OptIPuter LambdaGrid
NetherLight Amsterdam
U Amsterdam
NASA Ames
NASA GoddardNLRNLR
2
SDSU
CICESE
via CUDI
CENIC/Abilene Shared Network
1 GE Lambda
10 GE Lambda
PNWGP Seattle
CAVEwave/NLR
NASA JPL
ISI
UCI
CENIC Los Angeles
GigaPOP
22
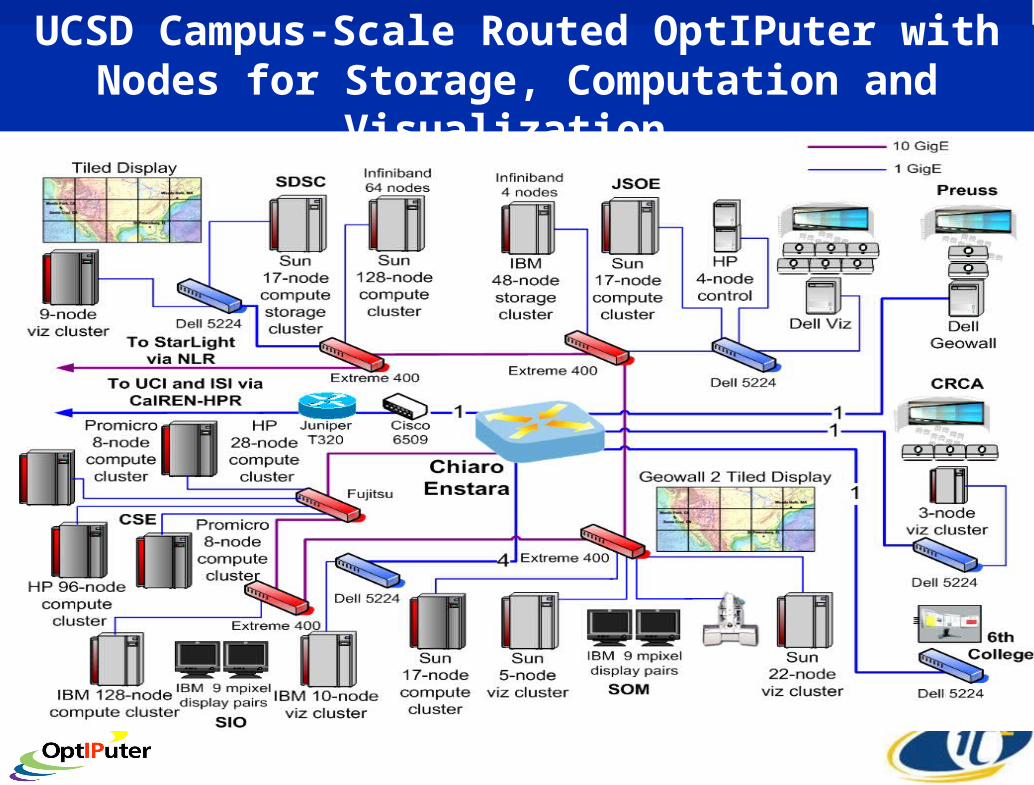
UCSD Campus-Scale Routed OptIPuter with Nodes for Storage, Computation and Visualization

OptIPuter Driver: On-Line Microscopes CreatingVery Large Biological Montage Images
• 2-Photon Laser Confocal Microscope– High Speed On-line
Capability
• Montage Image Sizes Exceed 16x Highest Resolution Monitors– ~150 Million Pixels!
• Use Graphics Cluster with Multiple GigEs to Drive Tiled Displays
Source: David Lee, NCMIR, UCSD
IBM 9M Pixels
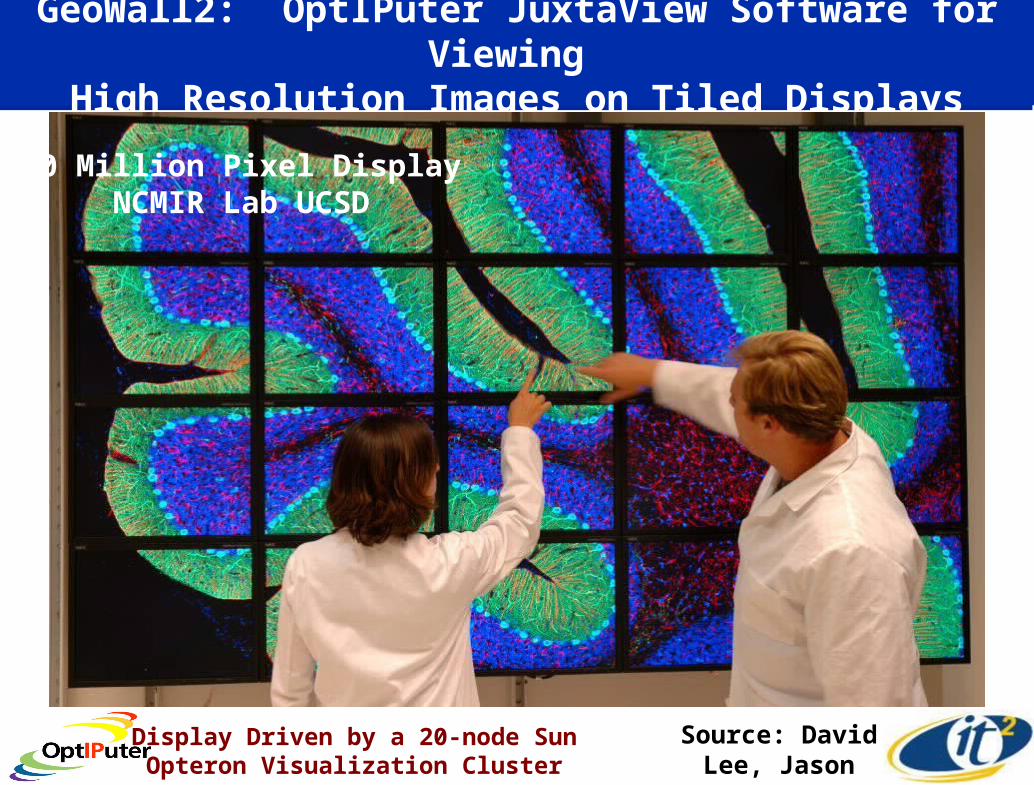
GeoWall2: OptIPuter JuxtaView Software for Viewing High Resolution Images on Tiled Displays
40 Million Pixel DisplayNCMIR Lab UCSD
Source: David Lee, Jason Leigh
Display Driven by a 20-node Sun Opteron Visualization Cluster

Earth and Planetary Sciences are an OptIPuter Large Data Object Visualization Driver
EVL Varrier Autostereo 3D Image USGS 30 MPixel Portable Tiled Display
SIO HIVE 3 MPixel Panoram
Schwehr. K., C. Nishimura, C.L. Johnson, D. Kilb, and A. Nayak, "Visualization Tools Facilitate Geological Investigations of Mars Exploration Rover Landing Sites",
IS&T/SPIE Electronic Imaging Proceedings, in press, 2005

• Calit2 & SIO are Building – a 4 x 6 Macintosh 30” LCD Tiled Display Driven by a Mac G5 Cluster– High Resolution Real Time Visualizations of USArray Waveform Data Represented
as 3D Glyphs and Combined with Near Real Time Camera Images– Provide Health Monitoring of Entire Network.
USArray on the GeoWall 2
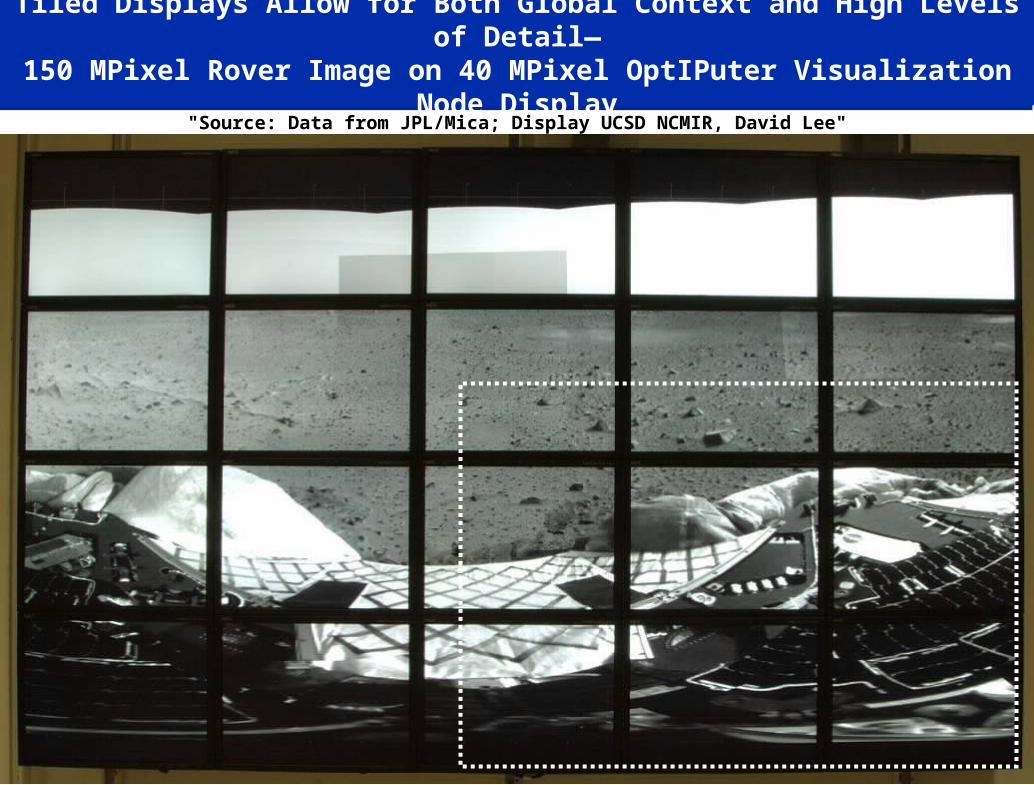
Tiled Displays Allow for Both Global Context and High Levels of Detail—150 MPixel Rover Image on 40 MPixel OptIPuter Visualization Node Display
"Source: Data from JPL/Mica; Display UCSD NCMIR, David Lee"
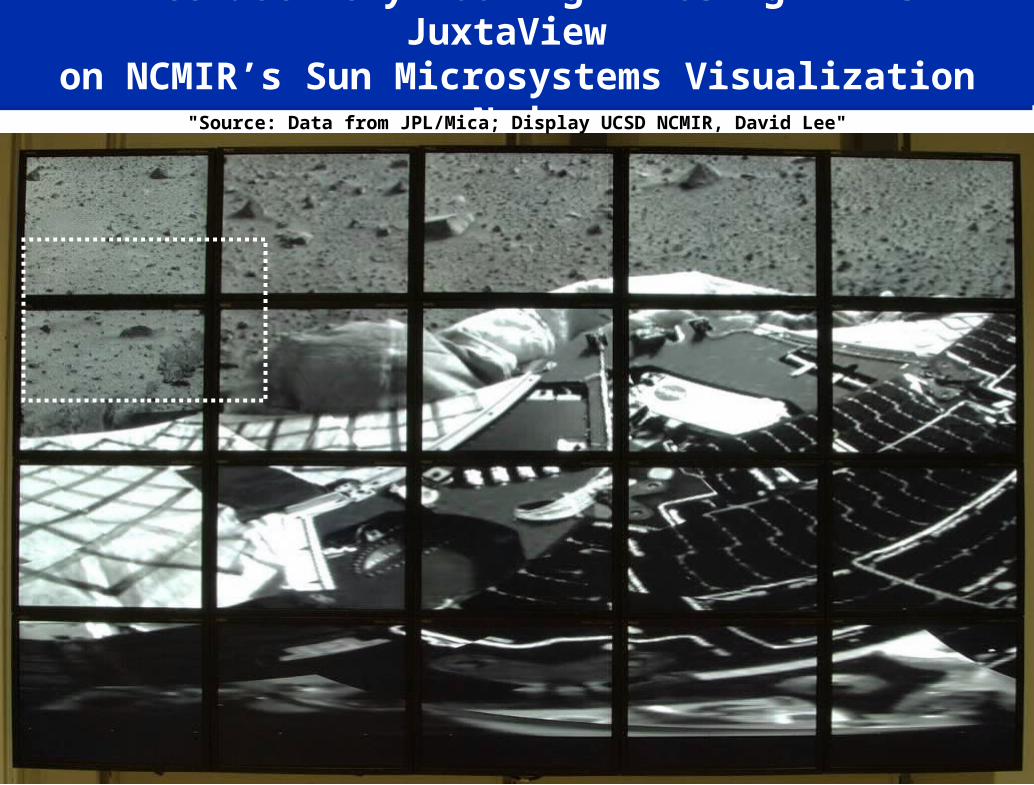
Interactively Zooming In Using EVL’s JuxtaView on NCMIR’s Sun Microsystems Visualization Node
"Source: Data from JPL/Mica; Display UCSD NCMIR, David Lee"
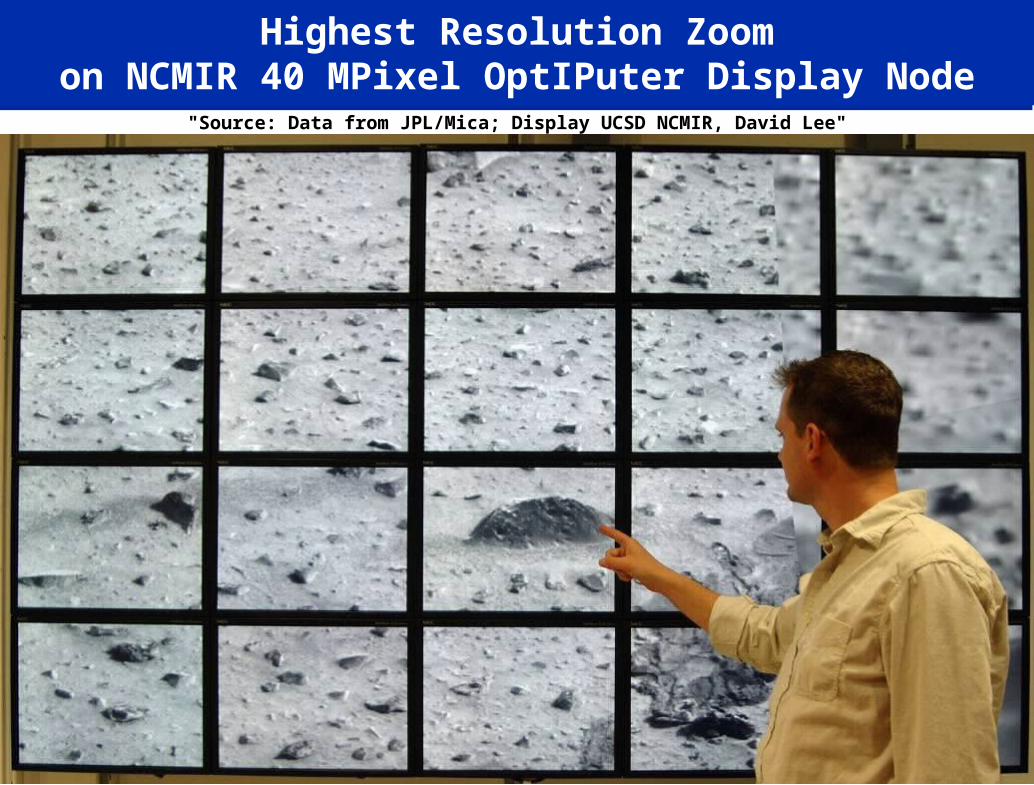
Highest Resolution Zoomon NCMIR 40 MPixel OptIPuter Display Node
"Source: Data from JPL/Mica; Display UCSD NCMIR, David Lee"

The UIC Electronic Visualization Lab is Prototyping the LambdaTable Version of the Tiled Display
"Source: Data from JPL/Mica; Display UIC EVL, Luc Renambot, Nicholas Schwarz"
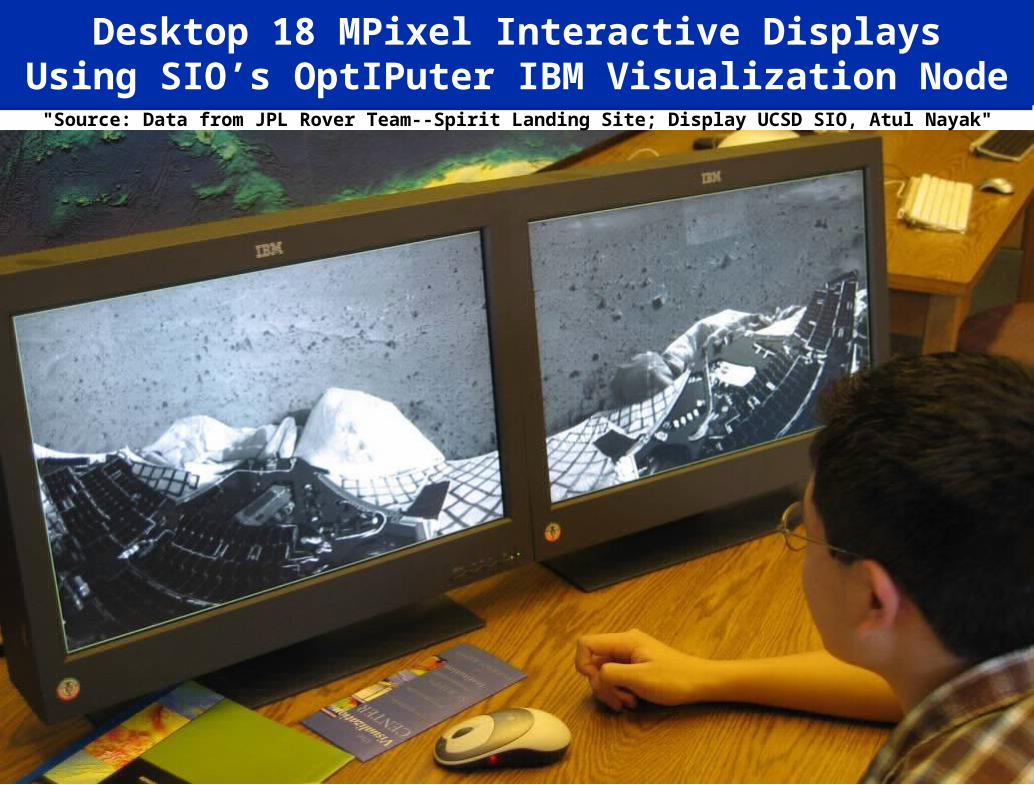
Desktop 18 MPixel Interactive DisplaysUsing SIO’s OptIPuter IBM Visualization Node"Source: Data from JPL Rover Team--Spirit Landing Site; Display UCSD SIO, Atul Nayak"

OptIPuter is PrototypingThe PC of 2010
• Terabits to the Desktop…
• 100 Megapixels Display
– 55-Panel
• 1/3 Terabit/sec I/O– 30 x 10GE
interfaces
– Linked to OptIPuter
• 1/4 TeraFLOP – Driven by 30 Node
Cluster of 64 bit Dual Opterons
• 1/8 TB RAM
• 60 TB DiskSource: Jason Leigh, Tom DeFanti, EVL@UIC
OptIPuter Co-PIs
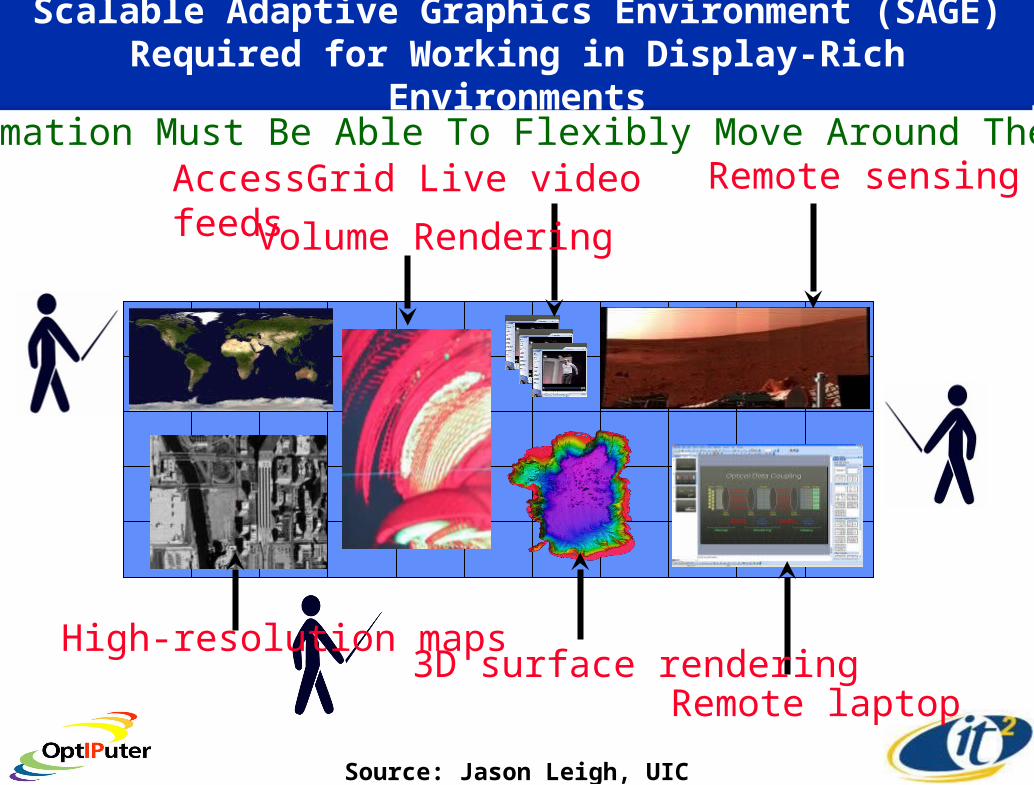
Scalable Adaptive Graphics Environment (SAGE)Required for Working in Display-Rich Environments
Remote laptop
High-resolution maps
AccessGrid Live video feeds
3D surface rendering
Volume Rendering
Remote sensingInformation Must Be Able To Flexibly Move Around The Wall
Source: Jason Leigh, UIC
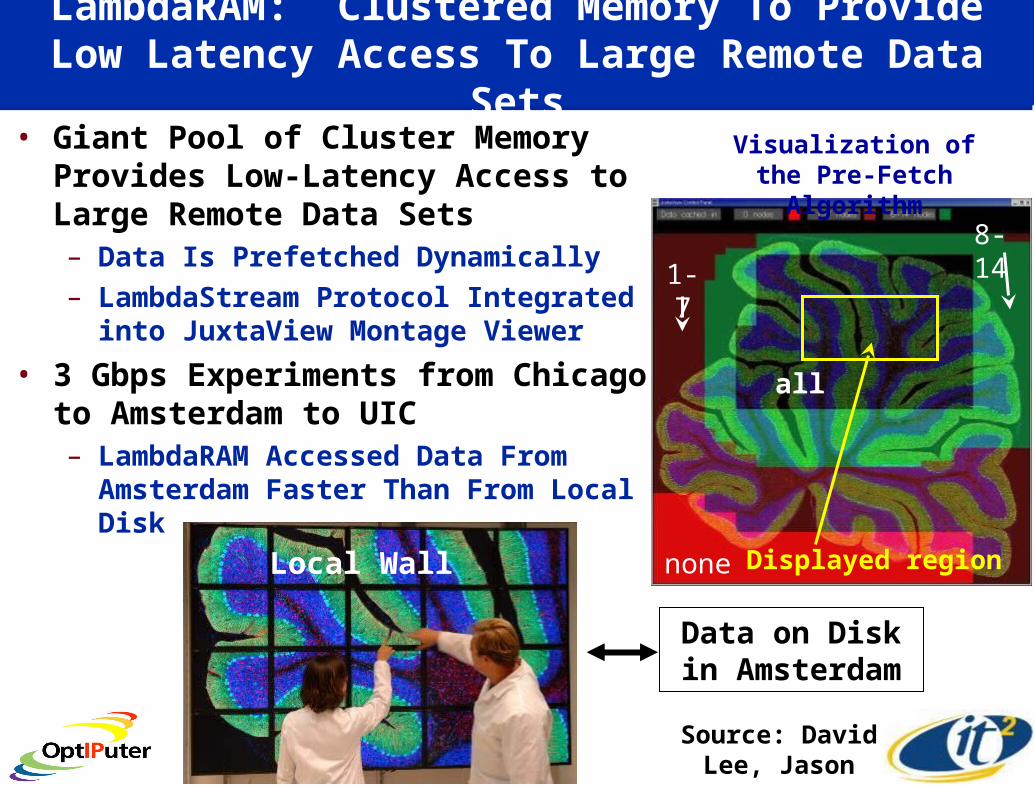
LambdaRAM: Clustered Memory To ProvideLow Latency Access To Large Remote Data Sets
• Giant Pool of Cluster Memory Provides Low-Latency Access to Large Remote Data Sets – Data Is Prefetched Dynamically– LambdaStream Protocol Integrated into
JuxtaView Montage Viewer
• 3 Gbps Experiments from Chicago to Amsterdam to UIC – LambdaRAM Accessed Data From
Amsterdam Faster Than From Local Disk
all
8-14
none
all
8-14
1-7
Displayed region
Visualization of the Pre-Fetch Algorithm
none
Data on Disk in Amsterdam
Local Wall
Source: David Lee, Jason Leigh
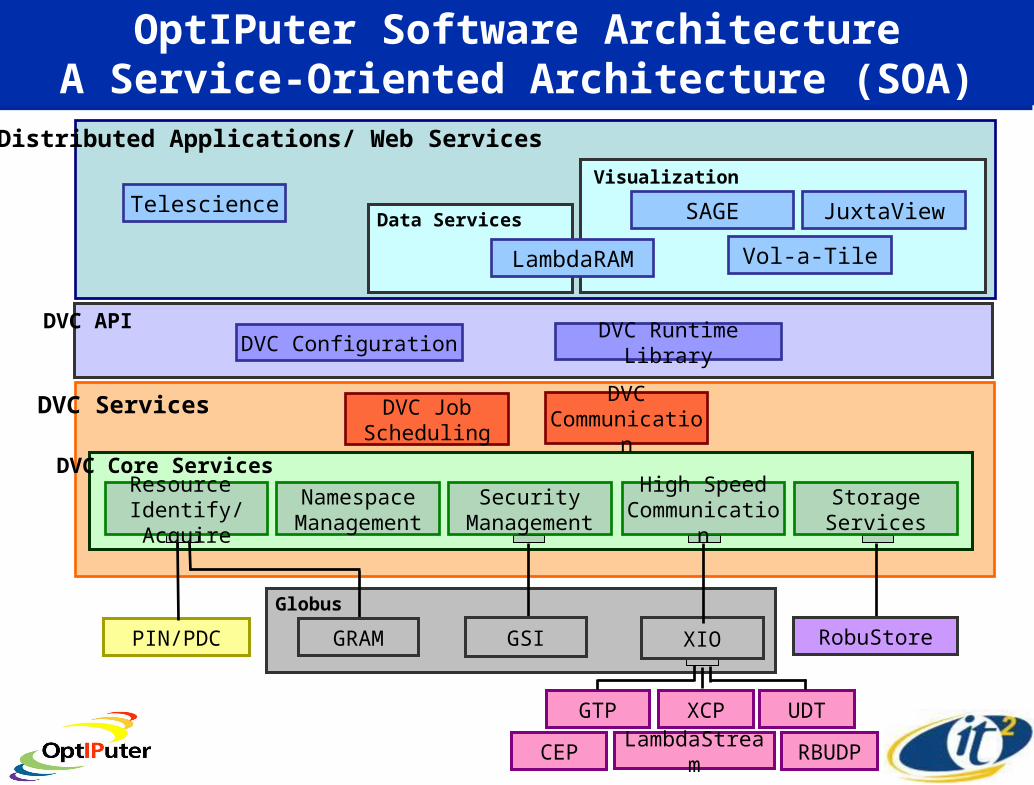
OptIPuter Software ArchitectureA Service-Oriented Architecture (SOA)
Distributed Applications/ Web Services
Telescience
GTP XCP UDT
LambdaStreamCEP RBUDP
Vol-a-Tile
SAGE JuxtaView
Visualization
DVC ConfigurationDVC API
DVC Runtime Library
Data Services
LambdaRAM
Globus
XIOPIN/PDC
DVC Services
DVC Core Services
DVC Job Scheduling
DVCCommunication
Resource Identify/Acquire
NamespaceManagement
Security Management
High SpeedCommunication
Storage Services
GRAM GSI RobuStore

Two New Calit2 Buildings Will Become Collaboration Laboratories
• Will Create New Laboratory Facilities• International Conferences and Testbeds• 800 Researchers in Two Buildings
Bioengineering
UC San Diego
UC Irvine
In 2005 Calit2 will Link Its Two Buildings via Dedicated Fiber over 75 Miles Using OptIPuter Architecture
to Create a Distributed Collaboration Laboratory
Calit2@UCSD Building Is Connected To Outside With 140 Optical Fibers
Extend to NASA Science Centers
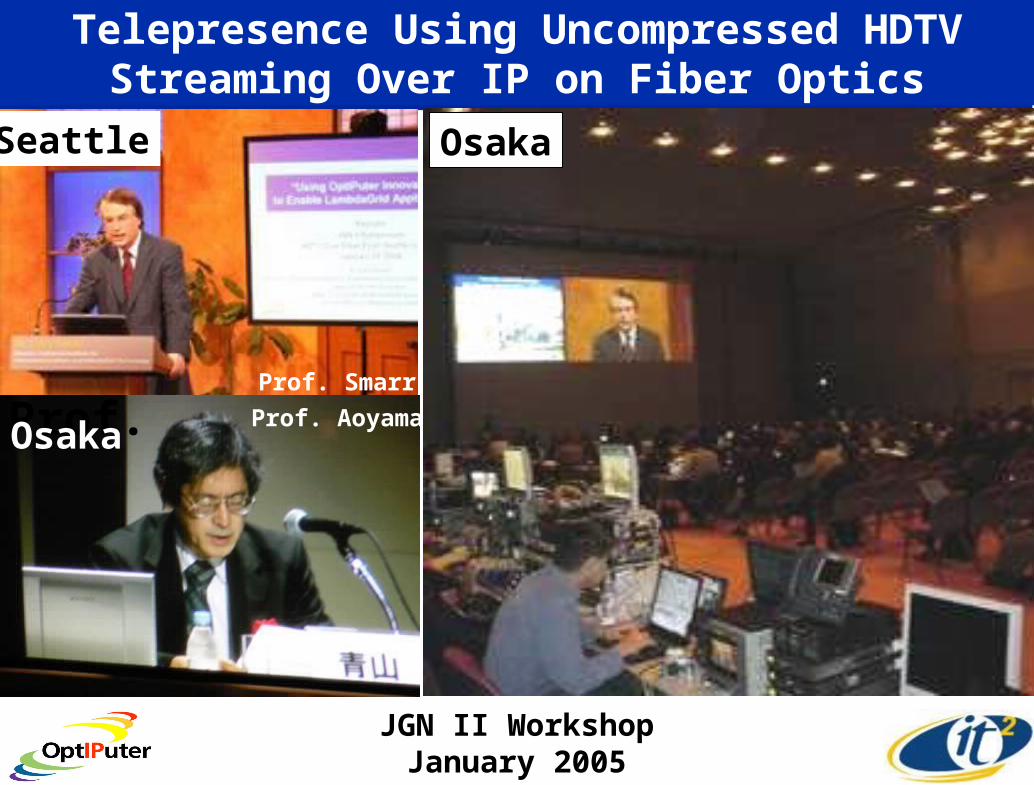
Telepresence Using Uncompressed HDTV Streaming Over IP on Fiber Optics
Seattle
JGN II WorkshopJanuary 2005
Osaka
Prof. OsakaProf. Aoyama
Prof. Smarr
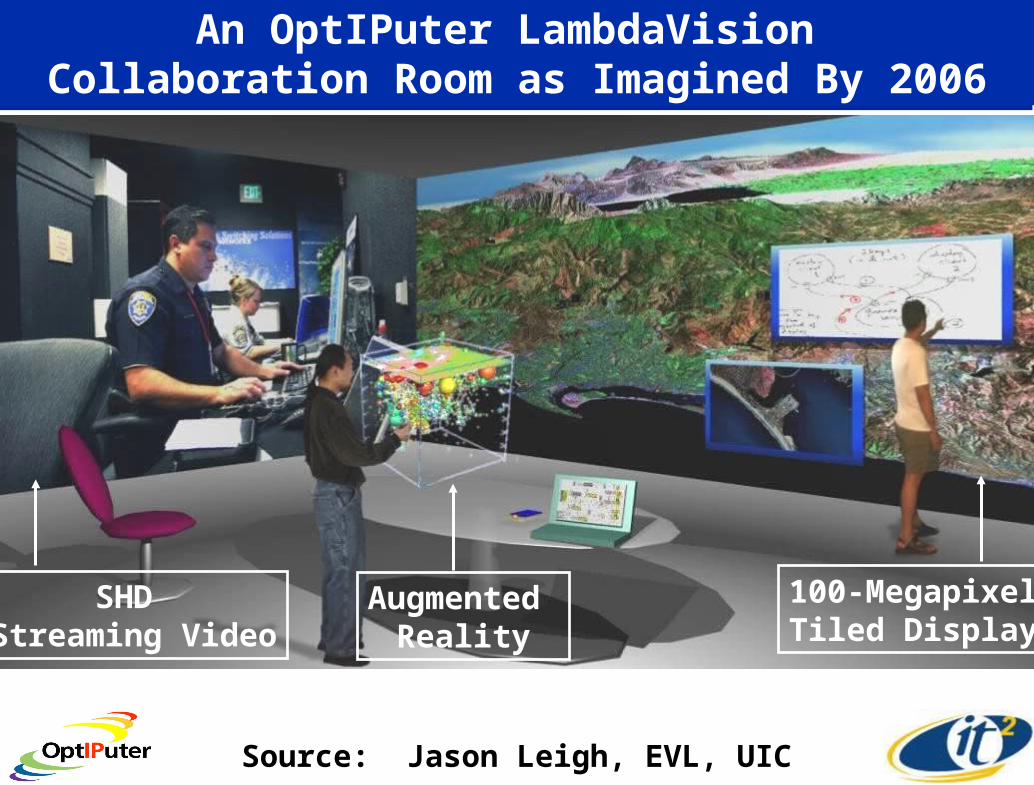
An OptIPuter LambdaVision Collaboration Room as Imagined By 2006
Source: Jason Leigh, EVL, UIC
Augmented Reality
SHD Streaming Video
100-MegapixelTiled Display
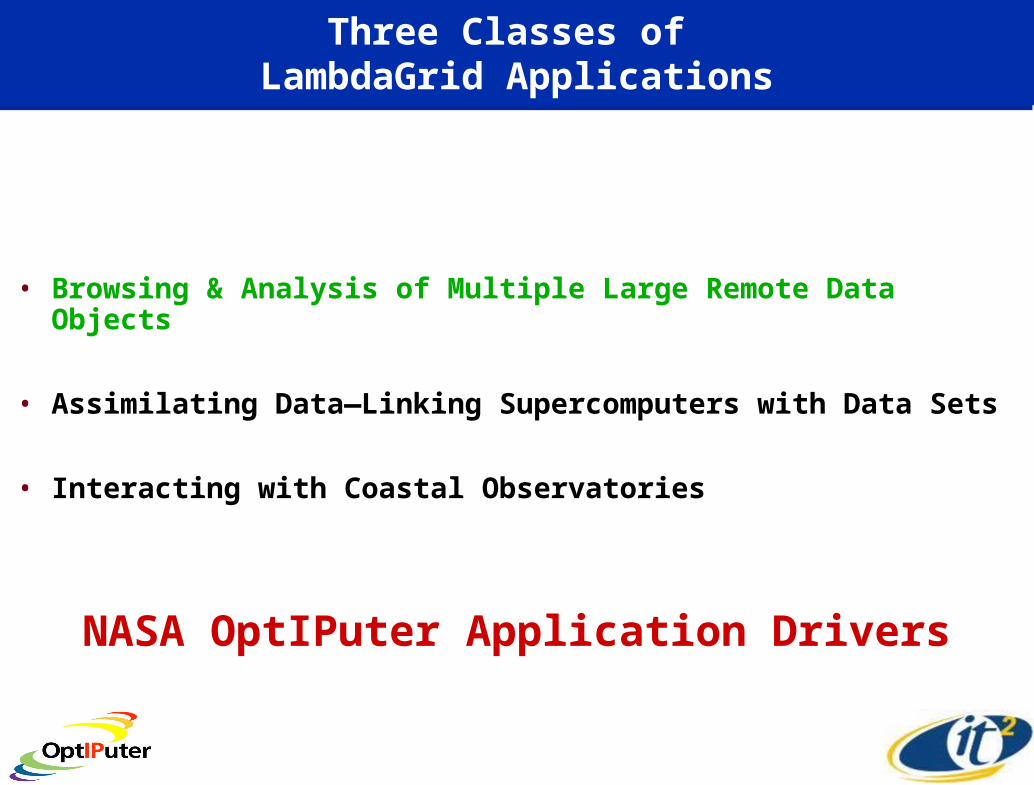
Three Classes of LambdaGrid Applications
• Browsing & Analysis of Multiple Large Remote Data Objects
• Assimilating Data—Linking Supercomputers with Data Sets
• Interacting with Coastal Observatories
NASA OptIPuter Application Drivers

Earth System Enterprise-Data Lives in Distributed Active Archive Centers (DAAC)
SEDAC (0.1 TB)Human Interactions in
Global Change
GES DAAC-GSFC (1334 TB)
Upper AtmosphereAtmospheric Dynamics, Ocean
Color, Global Biosphere, Hydrology, Radiance Data
ASDC-LaRC (340 TB)Radiation Budget,CloudsAerosols, Tropospheric
Chemistry
ORNL (1 TB)Biogeochemical
DynamicsEOS Land Validation
NSIDC (67 TB)Cryosphere
Polar Processes
LPDAAC-EDC (1143 TB)Land Processes
& Features
PODAAC-JPL (6 TB)Ocean Circulation
Air-Sea Interactions
ASF (256 TB)SAR Products
Sea IcePolar Processes
GHRC (4TB)Global
Hydrology
EOS Aura Satellite Has Been LaunchedChallenge is How to Evolve to New Technologies
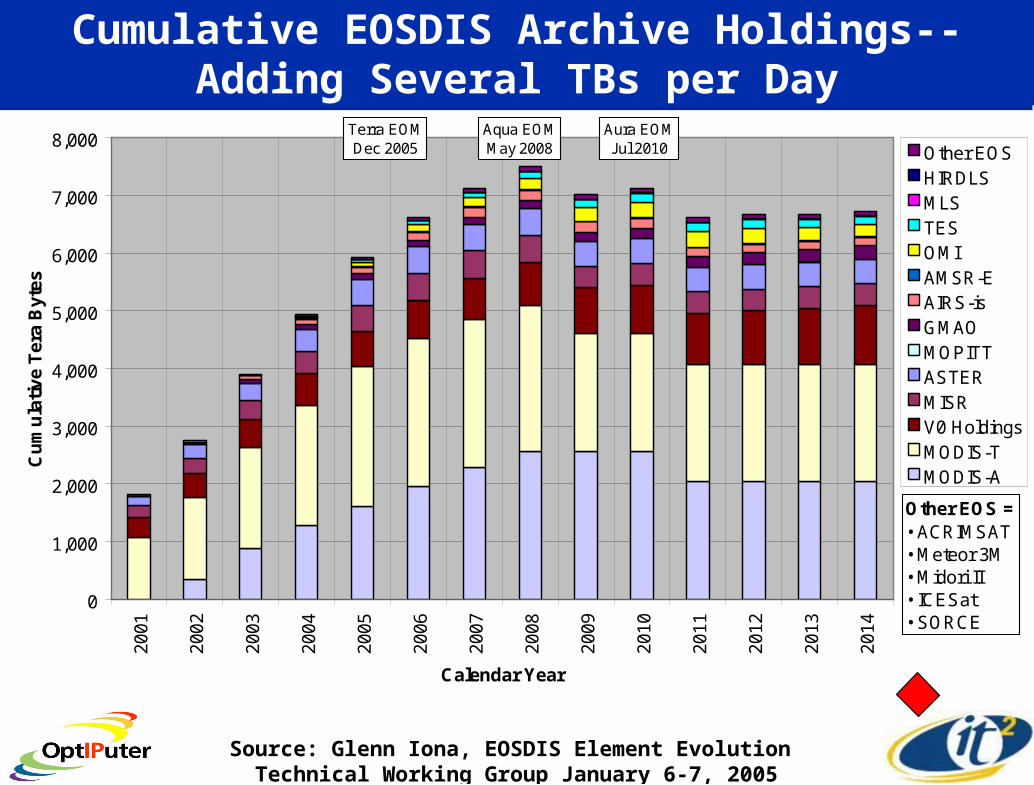
Cumulative EOSDIS Archive Holdings--Adding Several TBs per Day
0
1,000
2,000
3,000
4,000
5,000
6,000
7,000
8,00020
01
2002
2003
2004
2005
2006
2007
2008
2009
2010
2011
2012
2013
2014
Calendar Year
Cu
mu
lati
ve T
era
Byt
es
Other EOSHIRDLSMLSTESOMIAMSR-EAIRS-isGMAOMOPITTASTERMISRV0 HoldingsMODIS-TMODIS-A
Other EOS =• ACRIMSAT• Meteor 3M• Midori II• ICESat• SORCE
file name: archive holdings_122204.xlstab: all instr bar
Terra EOMDec 2005
Aqua EOMMay 2008
Aura EOMJul 2010
NOTE: Data remains in the archive pending transition to LTA
Source: Glenn Iona, EOSDIS Element Evolution Technical Working Group January 6-7, 2005
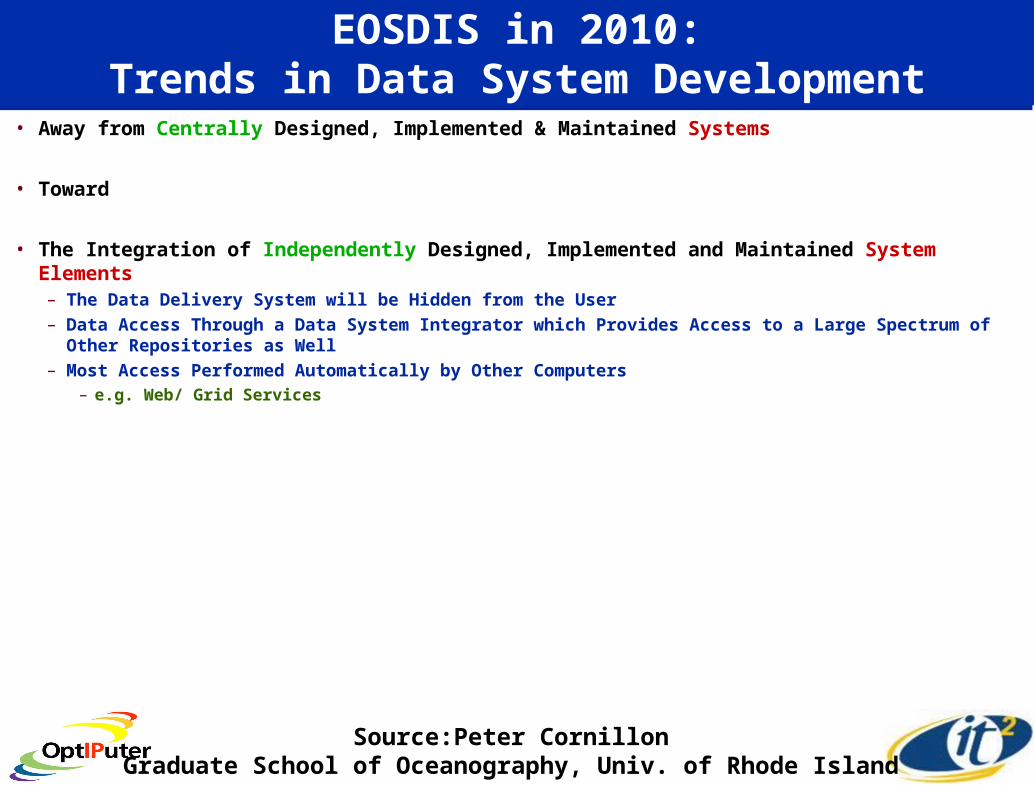
EOSDIS in 2010:Trends in Data System Development
• Away from Centrally Designed, Implemented & Maintained Systems
• Toward
• The Integration of Independently Designed, Implemented and Maintained System Elements– The Data Delivery System will be Hidden from the User– Data Access Through a Data System Integrator which Provides Access to a Large Spectrum of Other
Repositories as Well– Most Access Performed Automatically by Other Computers
– e.g. Web/ Grid Services
Source:Peter CornillonGraduate School of Oceanography, Univ. of Rhode Island
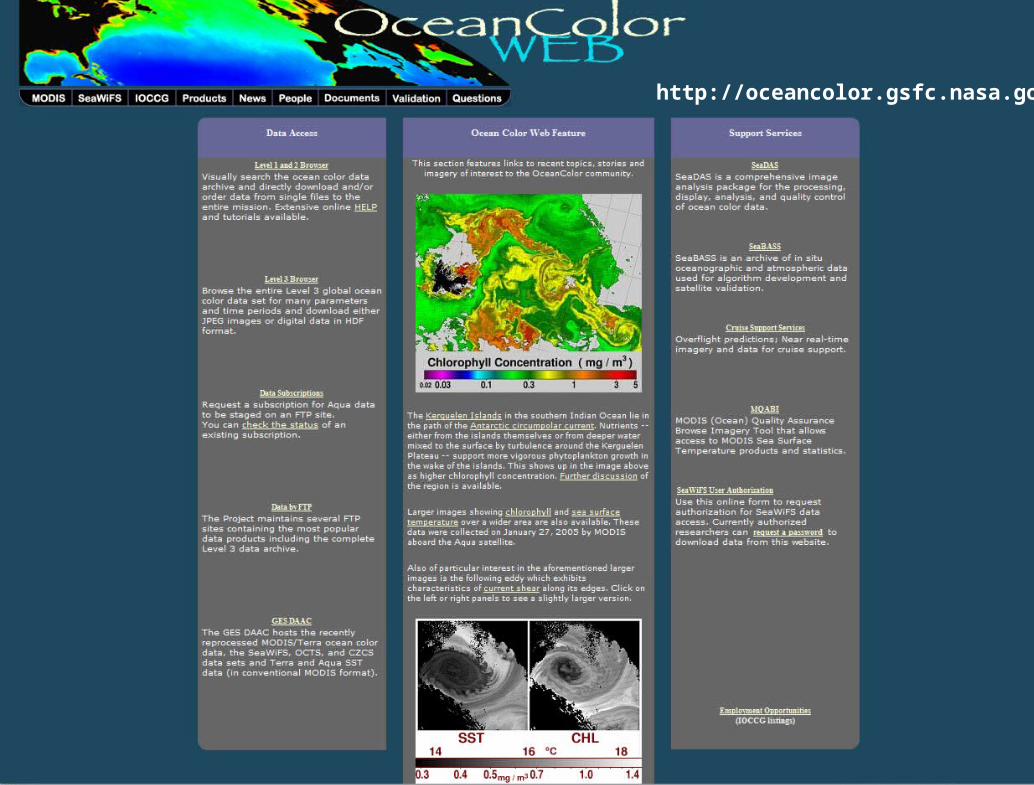
http://oceancolor.gsfc.nasa.gov/
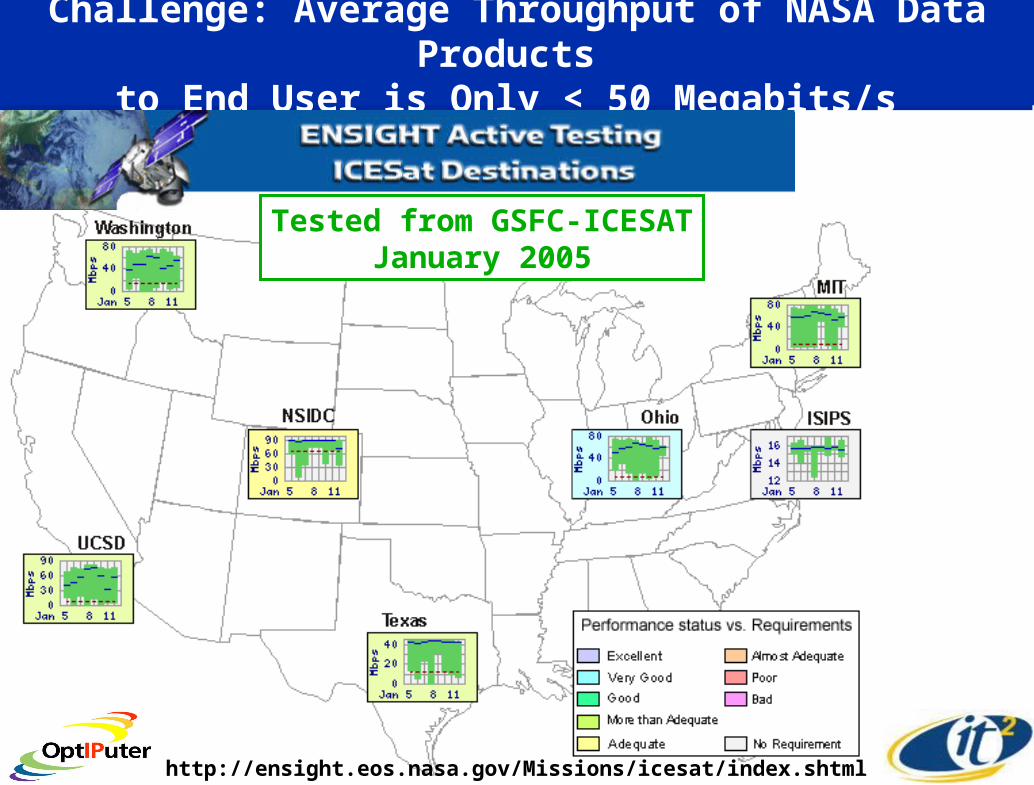
Challenge: Average Throughput of NASA Data Products to End User is Only < 50 Megabits/s
Tested from GSFC-ICESATJanuary 2005
http://ensight.eos.nasa.gov/Missions/icesat/index.shtml
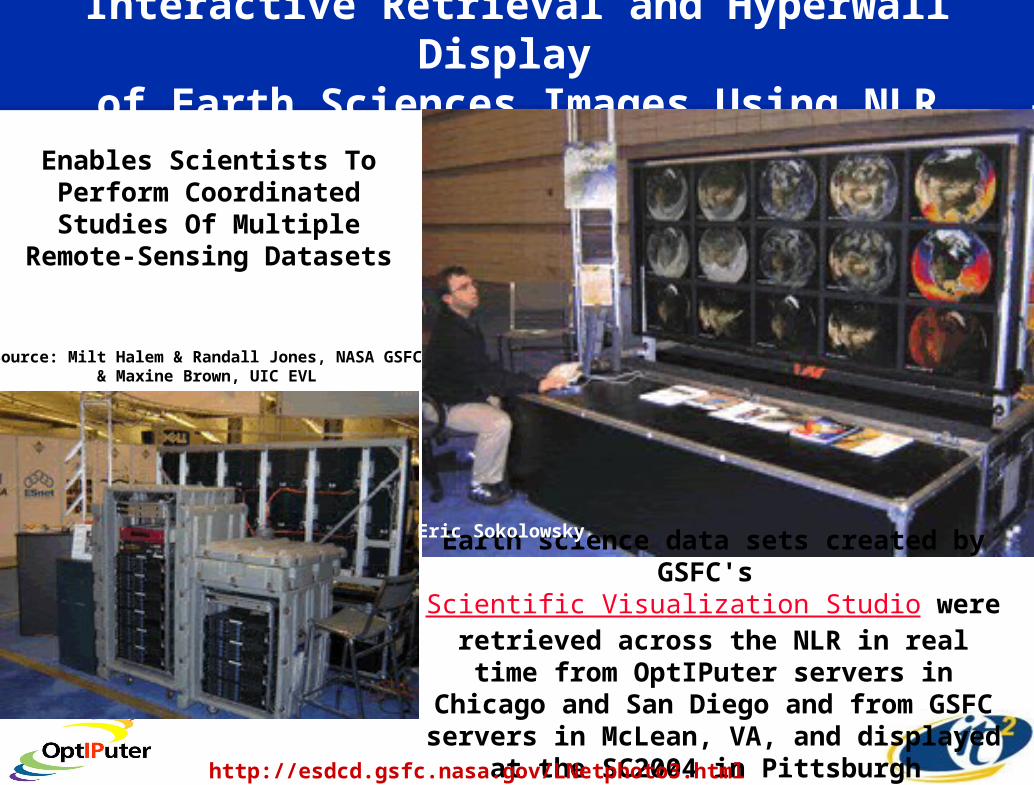
Interactive Retrieval and Hyperwall Display of Earth Sciences Images Using NLR
Earth science data sets created by GSFC's Scientific Visualization Studio were retrieved across the NLR in real time from OptIPuter servers in Chicago and San Diego and from GSFC servers in McLean, VA, and displayed
at the SC2004 in Pittsburgh
Enables Scientists To Perform Coordinated Studies Of
Multiple Remote-Sensing Datasets
http://esdcd.gsfc.nasa.gov/LNetphoto3.html
Source: Milt Halem & Randall Jones, NASA GSFC& Maxine Brown, UIC EVL
Eric Sokolowsky

NASA is Moving Towards a Service-Oriented Architecture for Earth Sciences Data
www.echo.eos.nasa.gov
• ECHO is an Open Source Interoperability Middleware Solution Providing a Marketplace of Resource Offerings– Metadata Clearinghouse & Order Broker with Open, XML-based APIs– Being Built by NASA's Earth Science Data and Information System
• New Paradigm for Access to EOS Data – Service-Oriented Enterprise– Net-Centric Computing
– Pushing Power to the Participants - Producers and Consumers
– GEOSS (Global Earth Observation System of Systems) Momentum
• Current Availability:– Over 40 Million Data Granules – Over 6 Million Browse Images
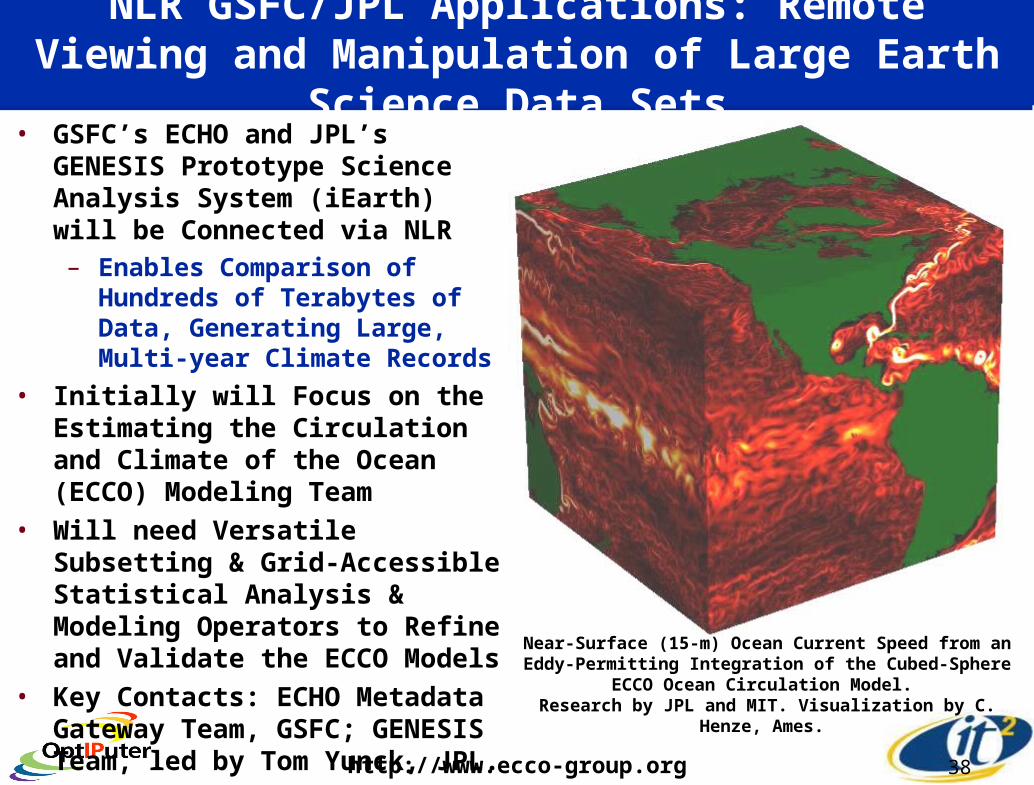
NLR GSFC/JPL Applications: Remote Viewing and Manipulation of Large Earth Science Data Sets
• GSFC’s ECHO and JPL’s GENESIS Prototype Science Analysis System (iEarth) will be Connected via NLR– Enables Comparison of Hundreds
of Terabytes of Data, Generating Large, Multi-year Climate Records
• Initially will Focus on the Estimating the Circulation and Climate of the Ocean (ECCO) Modeling Team
• Will need Versatile Subsetting & Grid-Accessible Statistical Analysis & Modeling Operators to Refine and Validate the ECCO Models
• Key Contacts: ECHO Metadata Gateway Team, GSFC; GENESIS Team, led by Tom Yunck, JPL.
38http://www.ecco-group.org
Near-Surface (15-m) Ocean Current Speed from an Eddy-Permitting Integration of the Cubed-Sphere ECCO Ocean
Circulation Model. Research by JPL and MIT. Visualization by C. Henze, Ames.
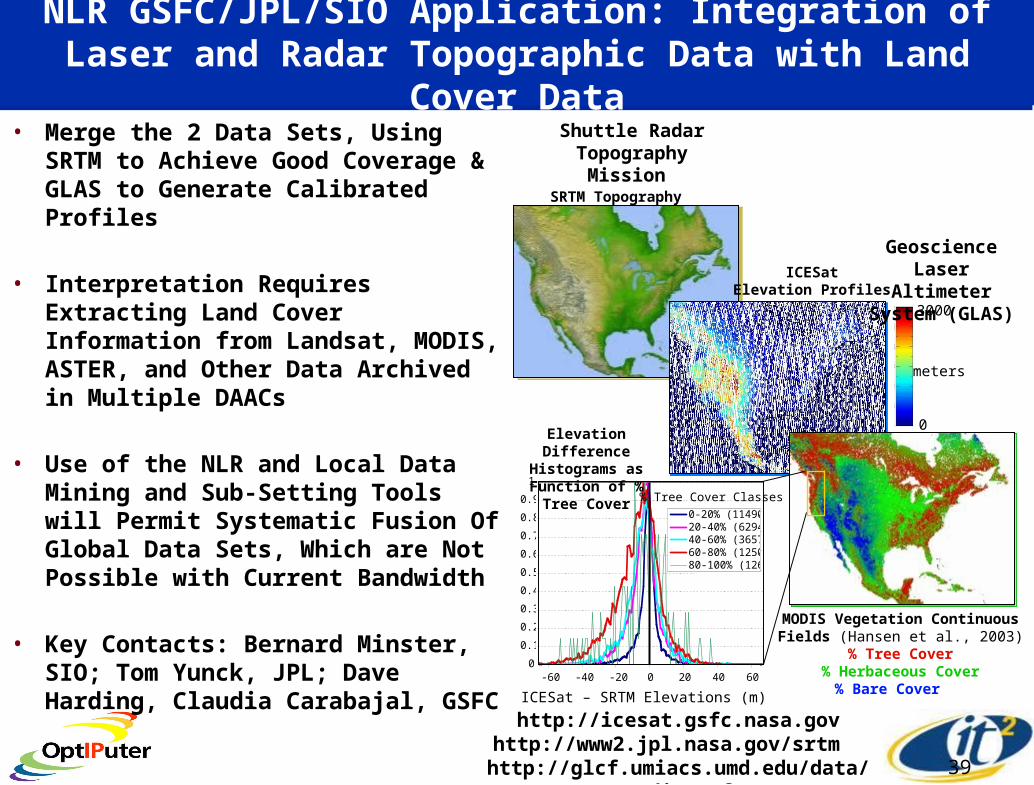
NLR GSFC/JPL/SIO Application: Integration of Laser and Radar Topographic Data with Land Cover Data
• Merge the 2 Data Sets, Using SRTM to Achieve Good Coverage & GLAS to Generate Calibrated Profiles
• Interpretation Requires Extracting Land Cover Information from Landsat, MODIS, ASTER, and Other Data Archived in Multiple DAACs
• Use of the NLR and Local Data Mining and Sub-Setting Tools will Permit Systematic Fusion Of Global Data Sets, Which are Not Possible with Current Bandwidth
• Key Contacts: Bernard Minster, SIO; Tom Yunck, JPL; Dave Harding, Claudia Carabajal, GSFC
39
SRTM Topography
ICESat – SRTM Elevations (m)
WUS L2B - MODIS (500m) VCF %Tree Cover vs. ICESat-SRTM Differences
0
0.1
0.2
0.3
0.4
0.5
0.6
0.7
0.8
0.9
1
-100 -80 -60 -40 -20 0 20 40 60 80 100
ICESat Centroid - 30m SRTM (m)
Nor
m. #
of
Occ
urre
nces 0-20% (11490)
20-40% (6294)40-60% (3657)60-80% (12503)80-100% (126)
0
0.1
0.2
0.3
0.4
0.5
0.6
0.7
0.8
0.9
1
-100 -80 -60 -40 -20 0 20 40 60 80 1000
0.1
0.2
0.3
0.4
0.5
0.6
0.7
0.8
0.9
1
0 10 20 30 40 50 60 70 80 90 100 110 120 130 140 150
0-20% (11490)20-40% (6294)40-60% (3657)60-80% (12503)80-100% (126)
% Tree Cover Classes
MODIS Vegetation Continuous Fields (Hansen et al., 2003)
% Tree Cover% Herbaceous Cover
% Bare Cover
ICESatElevation Profiles
0
3000
meters
Elevation DifferenceHistograms as Function
of % Tree Cover
http://icesat.gsfc.nasa.govhttp://www2.jpl.nasa.gov/srtm
http://glcf.umiacs.umd.edu/data/modis/vcf
Geoscience Laser Altimeter System
(GLAS)
Shuttle Radar Topography
Mission

Three Classes of LambdaGrid Applications
• Browsing & Analysis of Multiple Large Remote Data Objects
• Assimilating Data—Linking Supercomputers with Data Sets
• Interacting with Coastal Observatories
NASA OptIPuter Application Drivers

0
5
10
15
20
25
DO
E
NS
F
DO
E
DO
E
DO
E
DO
E
DO
E
DO
E
NS
F
NO
AA
DO
D
NS
F
DO
D
DO
E
NO
AA
NO
AA
NS
F
DO
E
DO
E
DO
E
DO
E
DO
E
DO
E
NA
SA
NS
F
NA
SA
NA
SA
DO
D
DO
D
NS
F
NS
F
DO
E
NO
AA
DO
E
NS
F
DO
D
DO
E
DO
E
DO
D
DO
E
DO
E
DO
D
DO
E
DO
E
DO
E
NS
F
NA
SA
DO
D
DO
E
NS
F
DO
E
DO
E
DO
D
DO
D
DO
D
NS
F
DO
E
NS
F
Pea
k S
peed
(GF)
Federal Agency Supercomputers Faster Than 1TeraFLOP Nov 2003
DOE
NSF
DOD
NOAANASA
Aggregate Peak Speed
Conclusion: NASA is Underpowered in High-End Computing
For Its Mission
Goddard
AmesJPL
Data From Top500 List (November 2003) Excluding No-name Agencies
From Smarr March 2004 NAC Talk
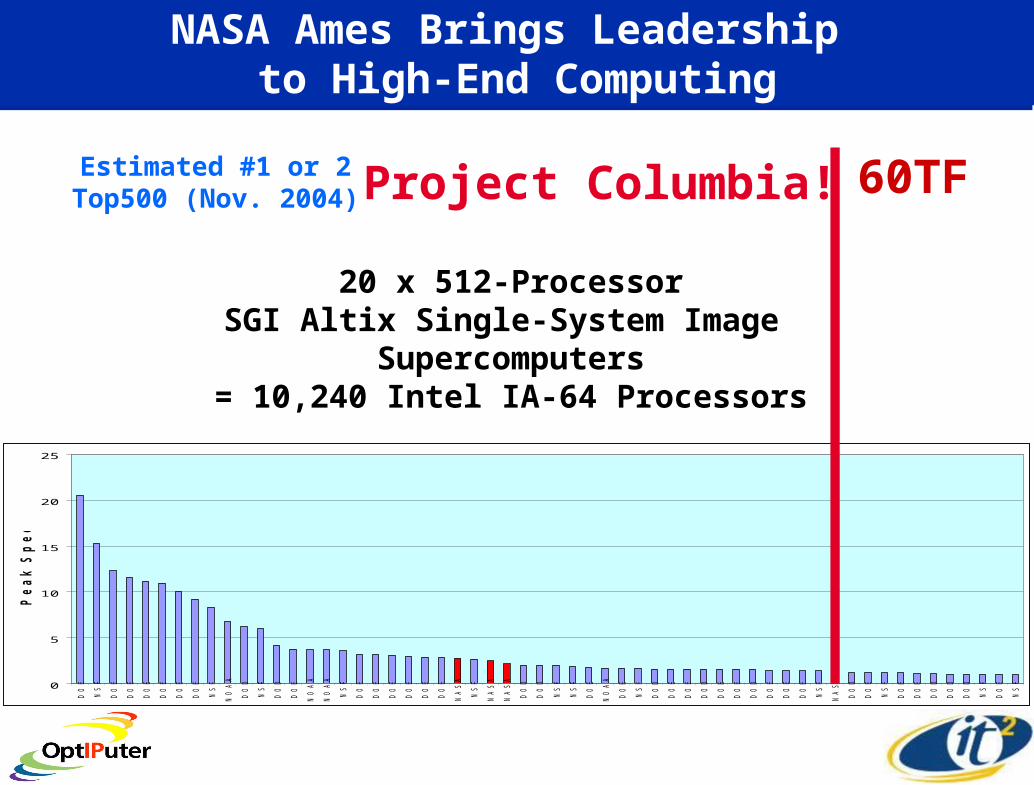
NASA Ames Brings Leadership to High-End Computing
0
5
10
15
20
25
DO
E
NS
F
DO
E
DO
E
DO
E
DO
E
DO
E
DO
E
NS
F
NO
AA
DO
D
NS
F
DO
D
DO
E
NO
AA
NO
AA
NS
F
DO
E
DO
E
DO
E
DO
E
DO
E
DO
E
NA
SA
NS
F
NA
SA
NA
SA
DO
D
DO
D
NS
F
NS
F
DO
E
NO
AA
DO
E
NS
F
DO
D
DO
E
DO
E
DO
D
DO
E
DO
E
DO
D
DO
E
DO
E
DO
E
NS
F
NA
SA
DO
D
DO
E
NS
F
DO
E
DO
E
DO
D
DO
D
DO
D
NS
F
DO
E
NS
F
Pe
ak
Sp
ee
d (
GF
)
Project Columbia! 60TF
20 x 512-ProcessorSGI Altix Single-System Image
Supercomputers= 10,240 Intel IA-64 Processors
Estimated #1 or 2Top500 (Nov. 2004)
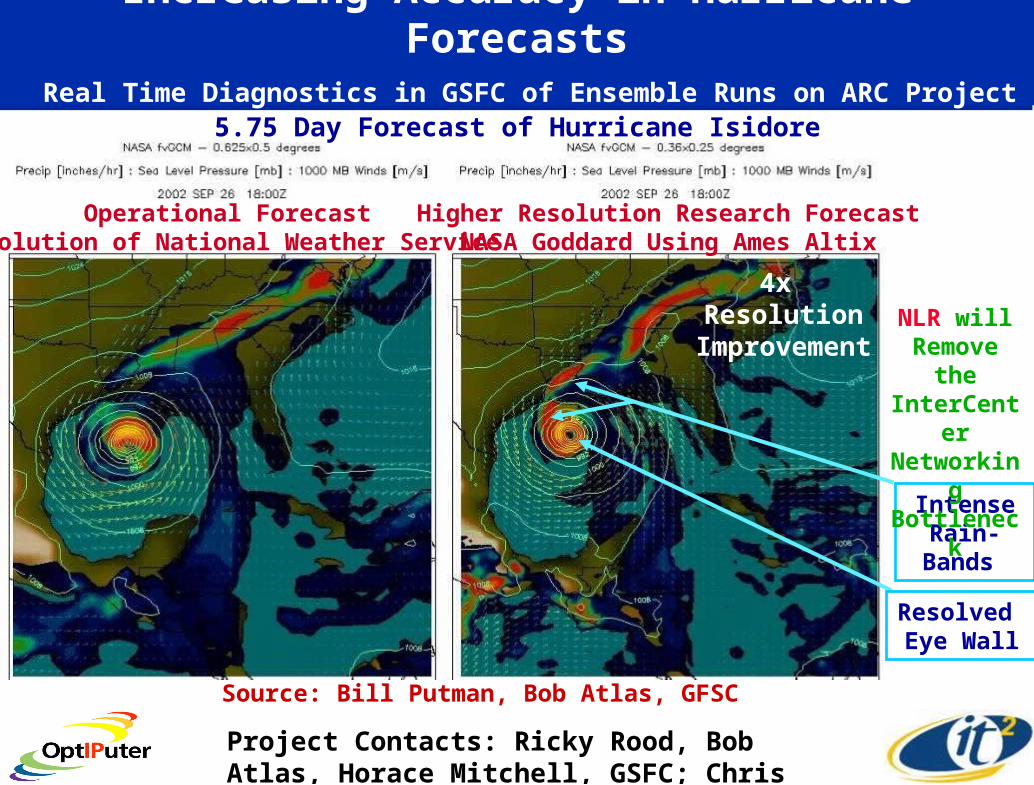
Increasing Accuracy in Hurricane Forecasts Real Time Diagnostics in GSFC of Ensemble Runs on ARC Project Columbia
Operational ForecastResolution of National Weather Service
Higher Resolution Research ForecastNASA Goddard Using Ames Altix
5.75 Day Forecast of Hurricane Isidore
Resolved Eye Wall
Intense Rain-
Bands
4x Resolution
Improvement
Source: Bill Putman, Bob Atlas, GFSC
NLR will Remove the InterCenter Networking Bottleneck
Project Contacts: Ricky Rood, Bob Atlas, Horace Mitchell, GSFC; Chris Henze, ARC
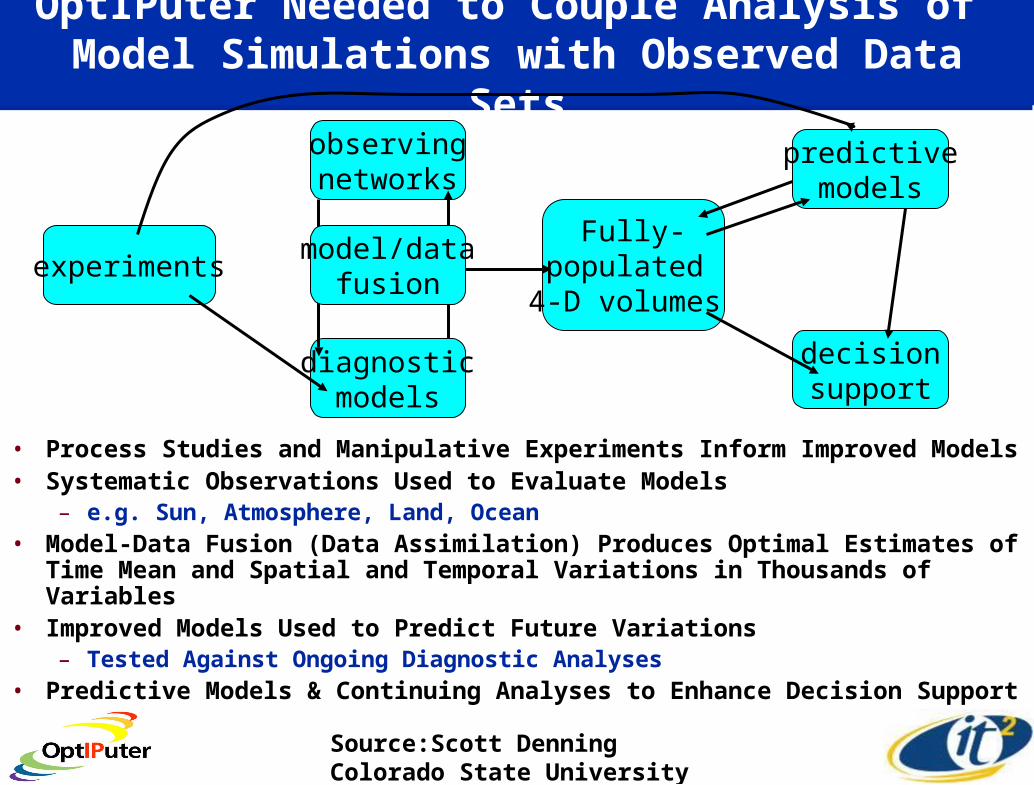
OptIPuter Needed to Couple Analysis of Model Simulations with Observed Data Sets
• Process Studies and Manipulative Experiments Inform Improved Models• Systematic Observations Used to Evaluate Models
– e.g. Sun, Atmosphere, Land, Ocean• Model-Data Fusion (Data Assimilation) Produces Optimal Estimates of Time
Mean and Spatial and Temporal Variations in Thousands of Variables• Improved Models Used to Predict Future Variations
– Tested Against Ongoing Diagnostic Analyses• Predictive Models & Continuing Analyses to Enhance Decision Support
experiments
diagnosticmodels
observingnetworks
predictivemodels
decisionsupport
Fully-populated
4-D volumes
model/datafusion
Source:Scott DenningColorado State University

U.S. Surface Evaporation Mexico Surface Temperature
Data Sets were Retrieved from OptIPuter Servers in Chicago, San Diego, & Amsterdam Remotely Viewing ~ 50 GB per Parameter
Randall Jones
NASA’s Land Information System at SC04 Over NLR Remote Analysis of Global 1 km x 1 km Assimilated Surface Observations
http://lis.gsfc.nasa.gov
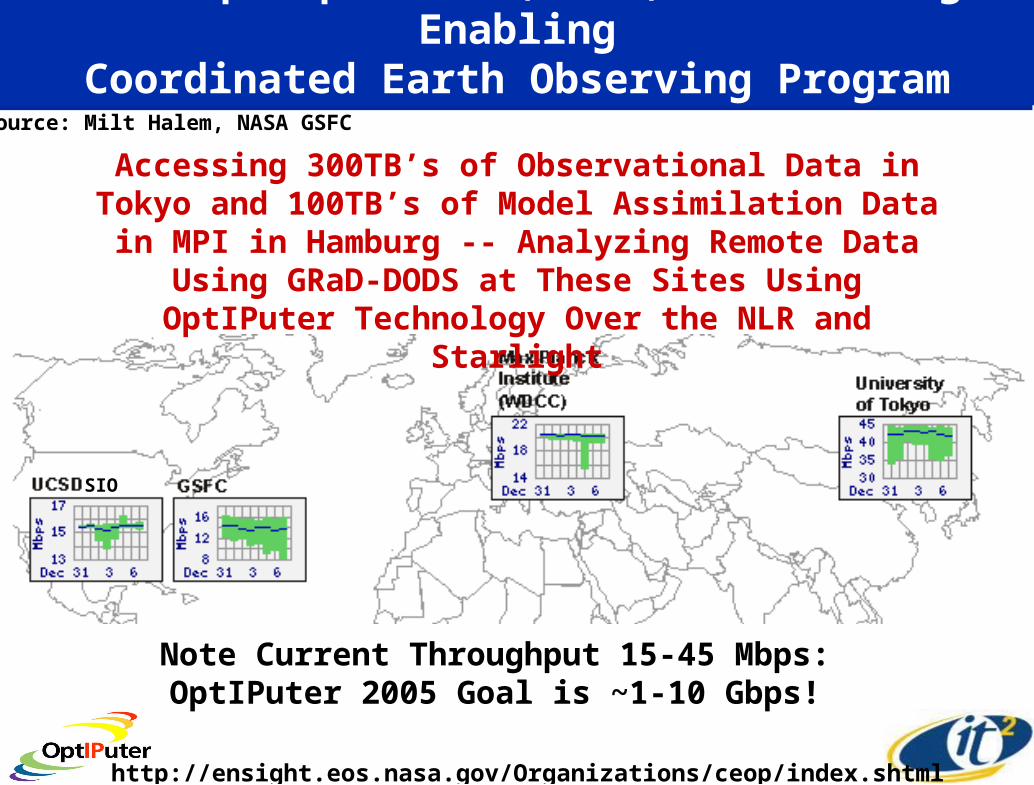
Next Step: OptIPuter, NLR, and Starlight EnablingCoordinated Earth Observing Program (CEOP)
Note Current Throughput 15-45 Mbps:OptIPuter 2005 Goal is ~1-10 Gbps!
http://ensight.eos.nasa.gov/Organizations/ceop/index.shtml
Accessing 300TB’s of Observational Data in Tokyo and 100TB’s of Model Assimilation Data in MPI in Hamburg -- Analyzing Remote Data Using GRaD-DODS at These Sites Using OptIPuter Technology Over the NLR and Starlight
Source: Milt Halem, NASA GSFC
SIO
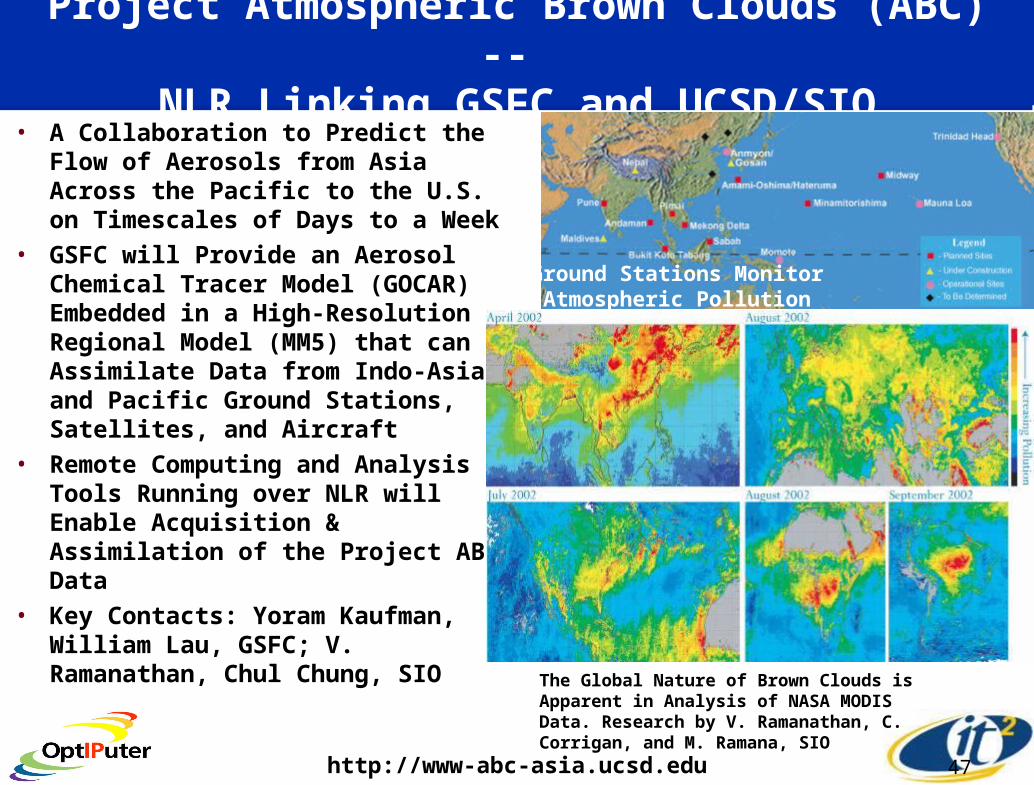
Project Atmospheric Brown Clouds (ABC) -- NLR Linking GSFC and UCSD/SIO
• A Collaboration to Predict the Flow of Aerosols from Asia Across the Pacific to the U.S. on Timescales of Days to a Week
• GSFC will Provide an Aerosol Chemical Tracer Model (GOCAR) Embedded in a High-Resolution Regional Model (MM5) that can Assimilate Data from Indo-Asian and Pacific Ground Stations, Satellites, and Aircraft
• Remote Computing and Analysis Tools Running over NLR will Enable Acquisition & Assimilation of the Project ABC Data
• Key Contacts: Yoram Kaufman, William Lau, GSFC; V. Ramanathan, Chul Chung, SIO
47http://www-abc-asia.ucsd.edu
The Global Nature of Brown Clouds is Apparent in Analysis of NASA MODIS Data. Research by V. Ramanathan, C. Corrigan, and M. Ramana, SIO
Ground Stations Monitor Atmospheric Pollution

Three Classes of LambdaGrid Applications
• Browsing & Analysis of Multiple Large Remote Data Objects
• Assimilating Data—Linking Supercomputers with Data Sets
• Interacting with Coastal Observatories
NASA OptIPuter Application Drivers
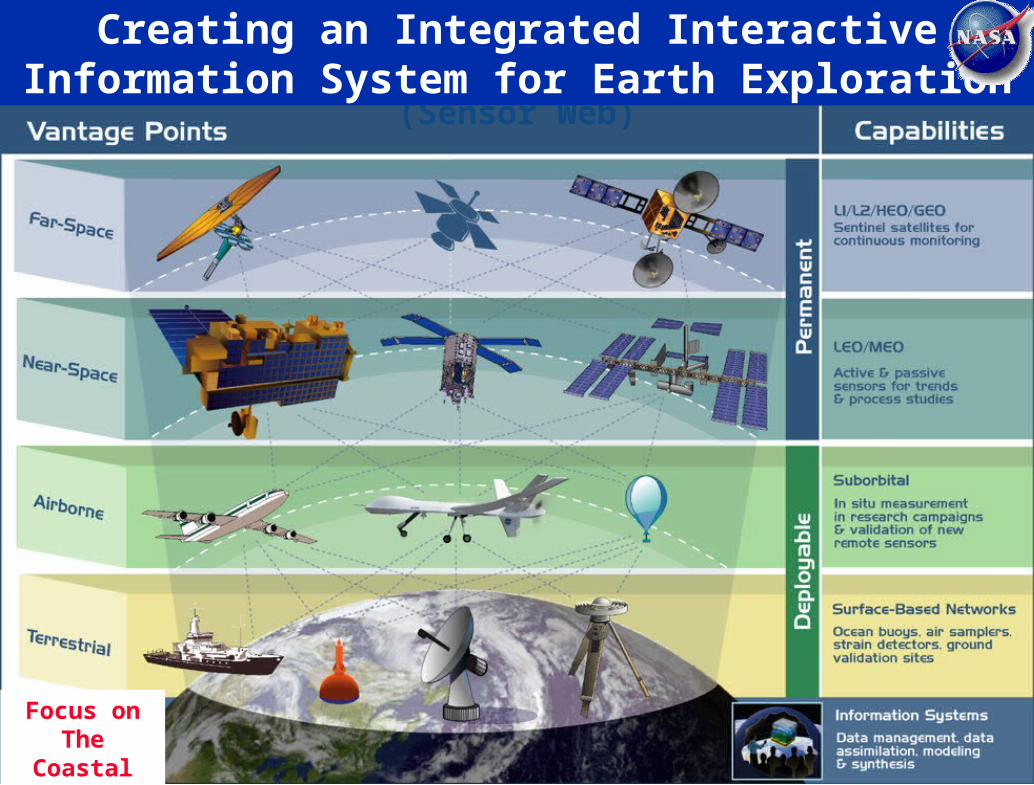
Components of a Future Global System for Earth Observation(Sensor Web)
Creating an Integrated InteractiveInformation System for Earth Exploration
Focus on The Coastal
Zone

Pilot Project ComponentsPilot Project Components
Grand Challenge: A Total Knowledge Integration System for the Coastal Zone
• Moorings• Ships• Autonomous Vehicles • Satellite Remote Sensing• Drifters• Long Range HF Radar • Near-Shore Waves/Currents (CDIP)• COAMPS Wind Model• Nested ROMS Models• Data Assimilation and Modeling• Data Systems
www.sccoos.org/
www.cocmp.org

ROADNet Architecture: SensorNets, Storage Research Broker, Web Services, Work Flow
KeplerWeb ServicesSRBAntelope
Frank Vernon, SIO; Tony Fountain, Ilkay Altintas, SDSC
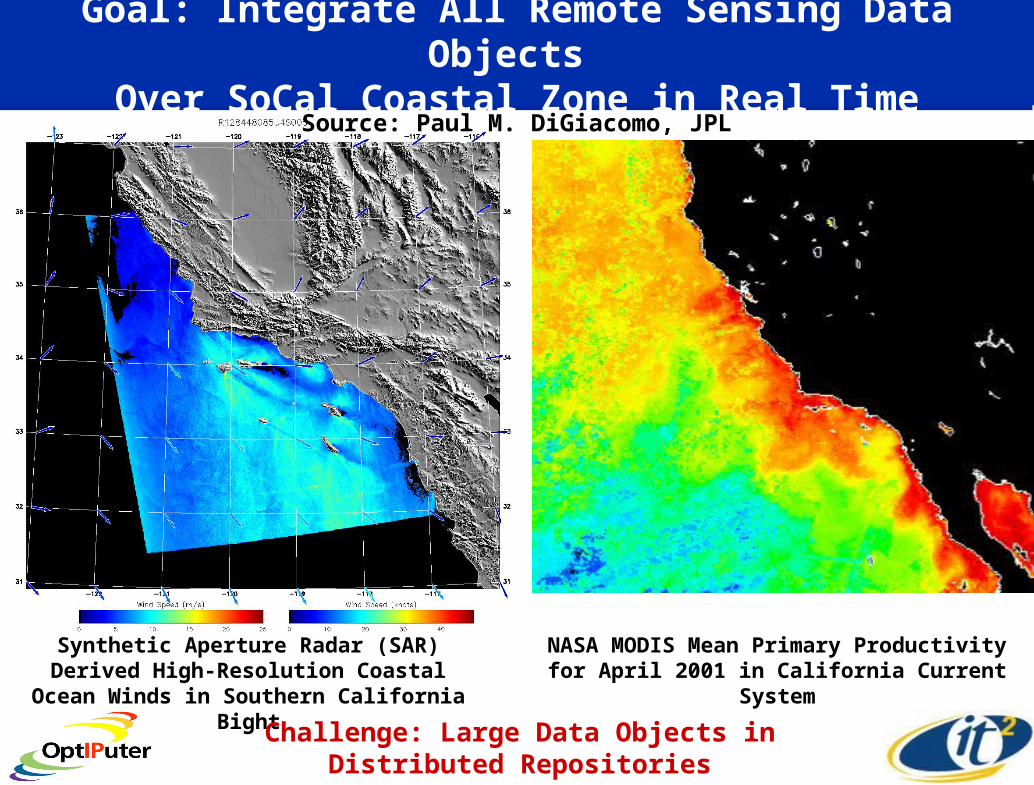
Goal: Integrate All Remote Sensing Data Objects Over SoCal Coastal Zone in Real Time
NASA MODIS Mean Primary Productivity for April 2001 in California Current System
Source: Paul M. DiGiacomo, JPL
Synthetic Aperture Radar (SAR) Derived High-Resolution Coastal Ocean Winds in
Southern California Bight
Challenge: Large Data Objects in Distributed Repositories

www.sccoos.org
Use SCCOOS As Prototype for Coastal Zone Data Assimilation Testbed
Goal:
Link SCCOOS Sites with
OptIPuter to Prototype
Future LambdaGridFor Ocean and Earth Sciences
Yellow—Proposed Initial OptIPuter Backbone
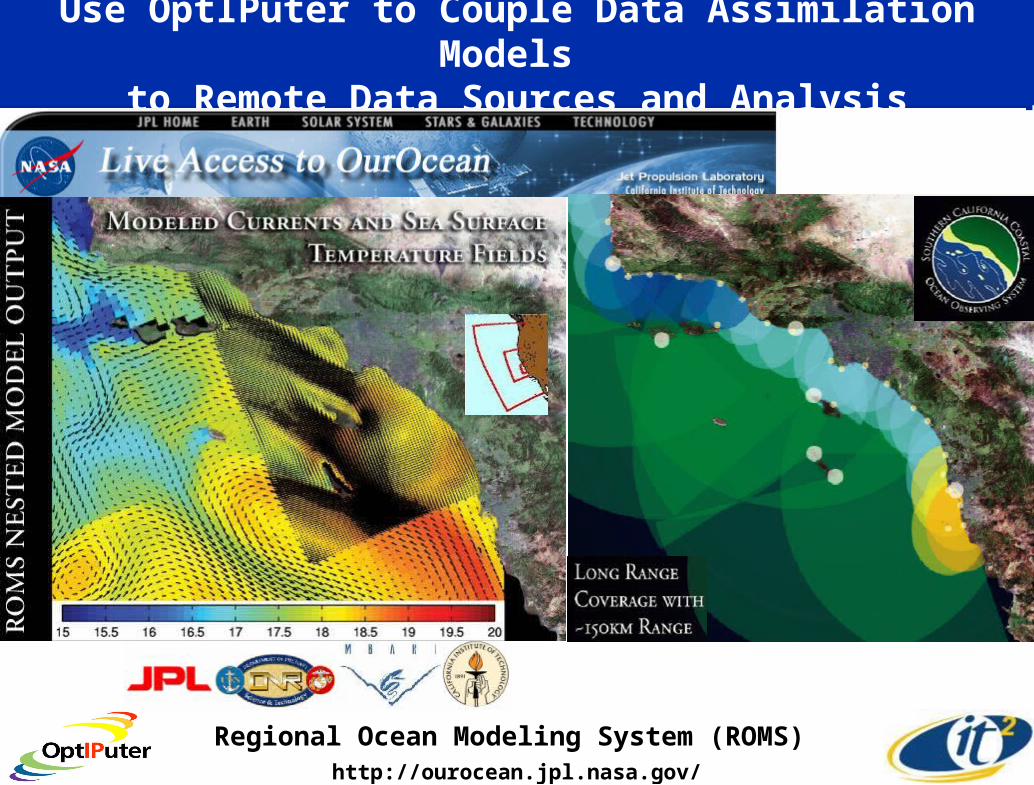
Use OptIPuter to Couple Data Assimilation Models to Remote Data Sources and Analysis
Regional Ocean Modeling System (ROMS) http://ourocean.jpl.nasa.gov/
LOOKING: (Laboratory for the Ocean Observatory
Knowledge Integration Grid)
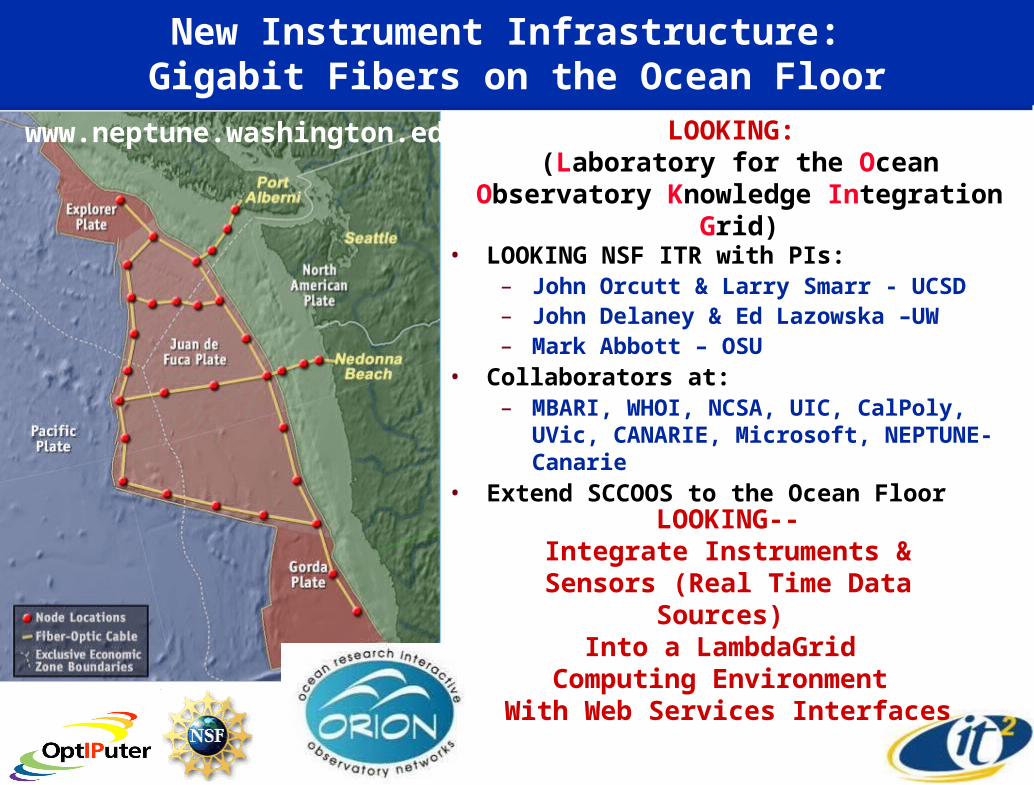
New Instrument Infrastructure: Gigabit Fibers on the Ocean Floor
• LOOKING NSF ITR with PIs:– John Orcutt & Larry Smarr - UCSD– John Delaney & Ed Lazowska –UW– Mark Abbott – OSU
• Collaborators at:– MBARI, WHOI, NCSA, UIC, CalPoly, UVic,
CANARIE, Microsoft, NEPTUNE-Canarie• Extend SCCOOS to the Ocean Floor
www.neptune.washington.edu
LOOKING--Integrate Instruments & Sensors
(Real Time Data Sources) Into a LambdaGrid
Computing Environment With Web Services Interfaces
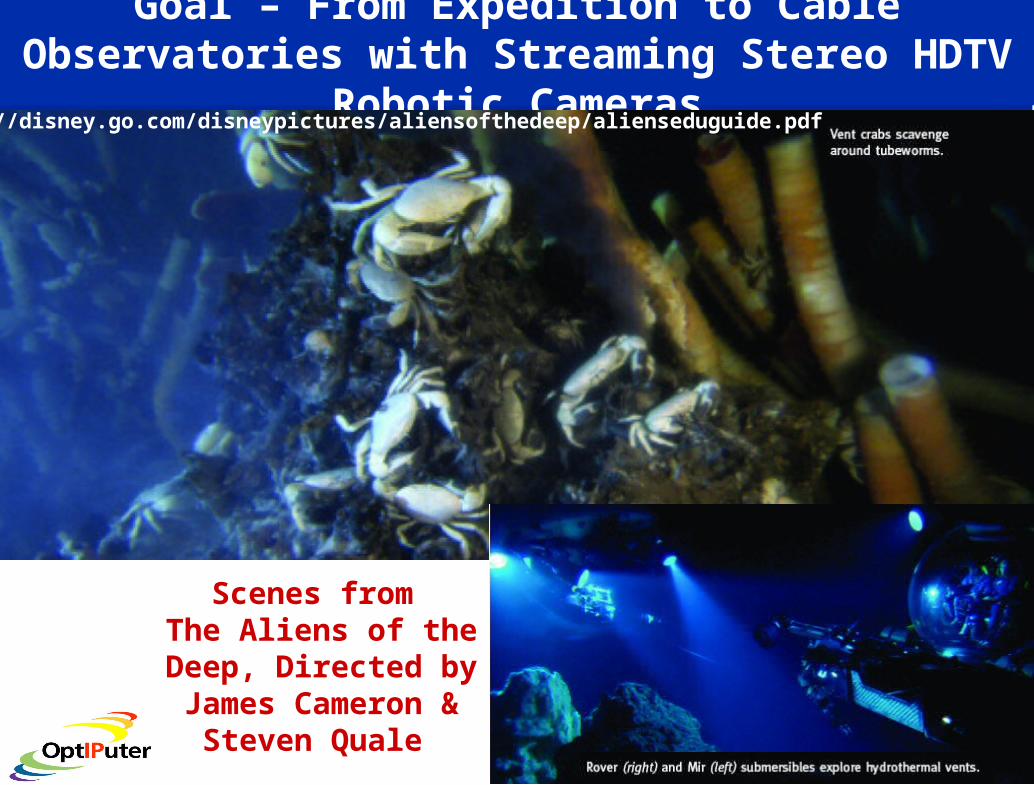
Goal – From Expedition to Cable Observatories with Streaming Stereo HDTV Robotic Cameras
Scenes from The Aliens of the Deep, Directed by James Cameron &
Steven Quale
http://disney.go.com/disneypictures/aliensofthedeep/alienseduguide.pdf

MARS Cable Observatory Testbed – LOOKING Living Laboratory
Tele-Operated Crawlers
Central Lander
MARS Installation Oct 2005 -Jan 2006
Source: Jim
Bellingham, MBARI
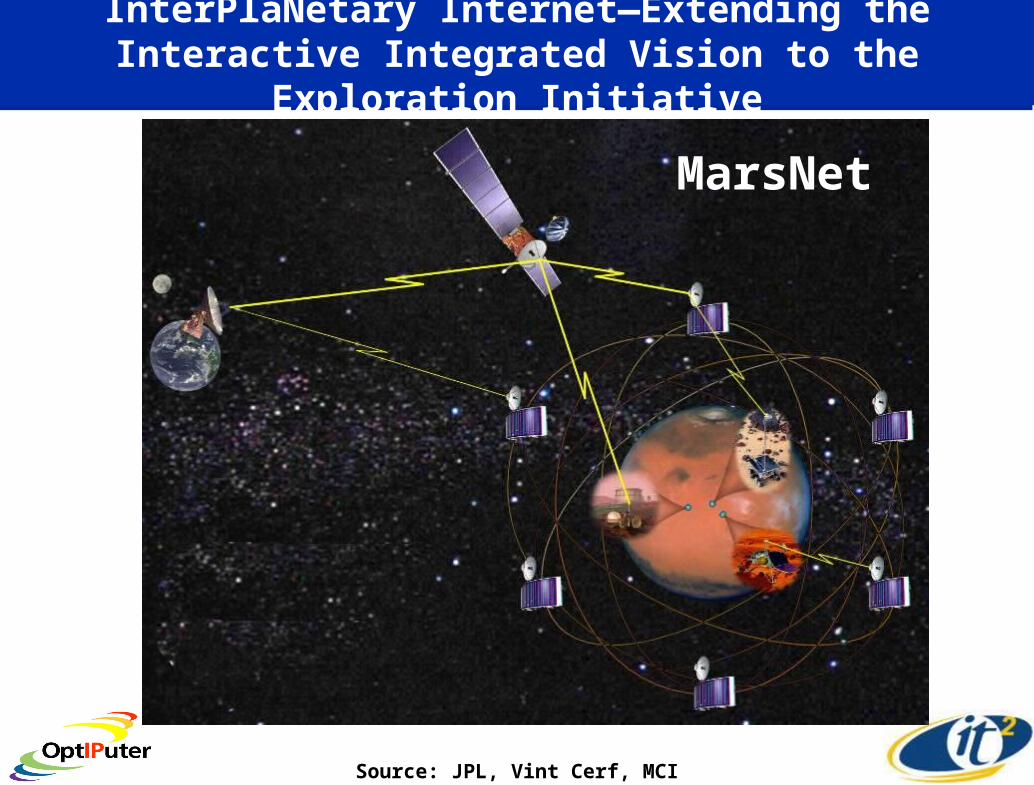
InterPlaNetary Internet—Extending the Interactive Integrated Vision to the Exploration Initiative
Source: JPL, Vint Cerf, MCI
MarsNet
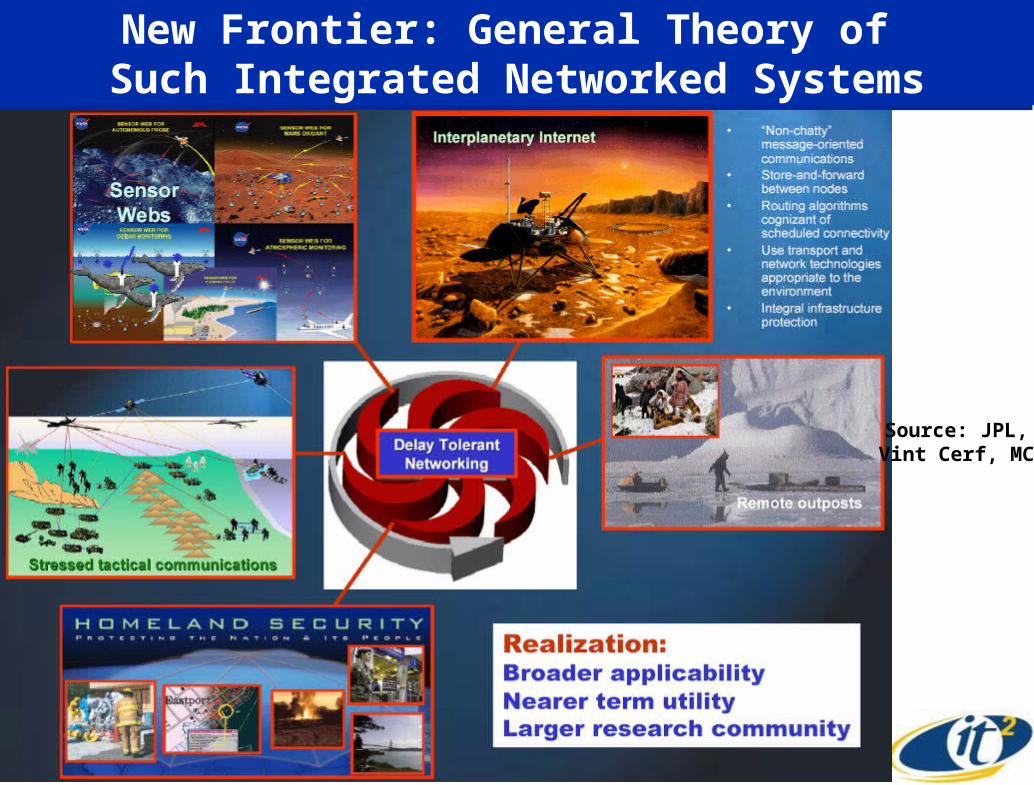
New Frontier: General Theory of Such Integrated Networked Systems
Source: JPL, Vint Cerf, MCI