lakeshore habitat restoration in the northern highlands ... · lakeshore habitat restoration in the...
TRANSCRIPT

Lakeshore Habitat Restoration in the Northern Highlands Ecological
LandscapeWAL Conference
April 6,2017
Mike Meyer, NOVA Ecological Services, Arbor Vitae, WI Dan Haskell, Chris Webster, Alex Bales, David FlaspoherMichigan Technological University, Houghton, MI. Patrick Goggin, Wisconsin Lakes Partnership, Stevens Point, WI. Carolyn Scholl & Quita Sheehan, Vilas Co. Land and Water, Eagle River, WI


Photo by: D. Haskell


LAKE HABITAT ZONESLAKESHORE HABITAT ZONE

Research Findings (1990s)
Current Wisconsin Shoreland Management
Rules (NR 115)do not protect critical
fish and wildlife habitat –
Shoreline developmentdensities
(52 homes/mile) are too high!

From: Elias, JE and Meyer, MW (2003) Wetlands 23: 800-816.

From: Woodford, JE and Meyer, MW (2002) Biological Conservation. 110(2):277-284.

From: Lindsay, AR et al. (2002) Biological Conservation 107: 1-11. Shoreland bird trends
Source: Wisconsin Dept. of Natural Resources

From: Relationship between Carnivore Distribution and LandscapeFeatures in the Northern Highlands Ecological Landscape of Wisconsin. Haskell et al. 2012. American Midland Naturalist.
Furbearer Abundance and Diversity Lower on Developed Lakes

Lakeshore Habitat Restoration uses native trees, shrubs, and groundcover, along with natural and biodegradable materials (biologs, delta-lock bags, sediment logs, soil lifts, woody material), to mitigate development impacts by reducing lakeshore erosion and improving aquatic and wildlife habitat quality from OHWM to >10 meters inland.

Lakeshore habitat restorations (>2000 meters of shoreland) occurred on 5 developed lakes in Vilas County at which long-term wildlife and habitat
monitoring was implemented.
•
Before After

Measures of SuccessLakeshore Habitat Restoration will be considered a
successful management practice if 10-year post-planting survey results demonstrate:– Increased native plant abundance and diversity– Improved wildlife habitat quality– Increased wildlife abundance and diversity– Reduced surface water and nutrient run-off
Best Management Practices - Survival and growth of restored native vegetation and erosion control effectiveness is also monitored to develop cost/effective management recommendations in the Northern Highlands


Five Lakeshores restored and matched with reference lakeshores
High‐Development:• Found• Moon• Lost• LSG• Crystal
Low‐Development:• Escanaba• Jag• White Sand• Star• Starrett
Lakes were paired by:•Surface size•Water Chemistry•Lake Type (drainage, seepage, spring)•Substrate

Targeted lakeshores for restoration within NHEL

Vegetation plot location using GISMoon Lake
Control & RestoredJag LakeReference
Restored
ControlReference
Maps created by B. Fevold

Establishing habitat plots
• Landowners contacted for permission
• 10 x 10 m plots set up adjacent to shoreline for long term monitoring
• Plots approx. 50 m apart• Data collected
concurrently on matched sites

Restoration Efforts • 26 private properties on Found, Moon, Lost, LSG Lakes & Crystal (public)
• ≈40,000 ground cover plants (100 spp.)
• ≈8,000 shrubs (30 spp.)• ≈800 trees (20 spp.)• ≈15,000 m of fence (deer exclosure)
• Plant density based on WI‐BioTech Note 1
Photos by D. Haskell

Methods:Habitat measurements made prior & post restoration
activities• Live saplings and shrub >
30 cm in height but having < 5 cm DBH
• Visional Obstruction Density (VOD) to estimate the percent cover at four different height categories (0‐0.3 m, 0.3‐1 m, 1‐2 m, 2‐3 m)
• Woody Habitat (logs & snags)
Photos: D. Haskell

Results: sapling and shrub stem density increased
Photos: D. Haskell

Results:VOD (0‐1m) increased significantly at
restored sites
Photos: D.Haskell

Results:Logs increased on restored sites
Photos: D. Haskell

Nonmetric Multi‐Dimensional Scaling Ordination shows restored plots becoming
more like reference plots over time• Reference lakes showed
little change in habitat features
• Restored lakeshores displayed longer vectors & movement towards reference conditions
• This increase in similarity was associated with increasing similarity in visual obstruction and shrub and sapling density among treatments and reference lakes
Summary
• These results suggest that changes in understory habitat conditions associated with restoration treatments may increase the similarity of habitat features for understory dwelling wildlife.
• Large structural changes (tree density, size, and diversity) will require more time, but improving understory conditions and diversity are a requisite first step.

Recommendations for habitat restoration
• Future restoration consider increasing sapling densities comparable to references sites
• Augmentation of woody habitat
• Long term monitoring of restoration should be part of the restoration plan and strategies to further this goal should be tested.

Adding Downed Woody Material (DWM) to Lakeshore Restorations
Haskell et al. 2012. Variation in soil temperature, moisture, and plant growth with addition of downed woody material
on lakeshore restoration sites. Restoration Ecology 20:113-121

Removal of DWM on Sandy Soils
Photo by: D. Kloepfer

Woody Material Test Plots0% DWM Coverage25% DWM Coverage
50% DWM Coverage
Photos by Dan Haskell

Soil Moisture Results• July: n = 25/treatment• 0% DWM plots had
higher % change in moisture.
• (P = <0.001)
• August: n = 34/treatment• 0% DWM plots had
higher % change in moisture.
• (P = <0.001)
0.00
0.05
0.10
0.15
0.20
0.25
0.30
0 25 50
0.00
0.05
0.10
0.15
0.20
0.25
0 25 50
Woody Material Coverage (%)
Cha
nge
in S
oil M
oist
ure
(%)

Difference Between High & Low Soil Temp
• June: 0% DWM plots had a greater difference in temp.(P = 0.005)
• July: 0% DWM plots had a greater difference in temp. (P = <0.001)
• August: 0% DWM plots had a greater difference in temp. (P = <0.001)
0.0001.0002.0003.0004.0005.0006.0007.0008.0009.000
10.000
0.0001.0002.0003.0004.0005.0006.0007.0008.0009.000
10.000
0.000
1.000
2.000
3.000
4.000
5.000
6.000
7.000
8.000
9.000
0 25 50
Tem
pera
ture
(C°)

Shrub Change in Canopy Volume (%)
• Snowberry (Symphoricarpos albus):
• negative growth in 0% DWM (P = 0.015)
• Sweet Fern (Comptonia peregrine):
• no significant difference (P = 0.264)
-0.300
-0.200
-0.100
0.000
0.100
0.200
0.300
0.000
1.000
2.000
3.000
4.000
5.000
6.000
0 25 50DWM Coverage (%)
Cha
nge
in C
anop
y Vo
lum
e (%
)

Discussion DWM• DWM lessened daily variation in soil temp and
moisture• DWM can improve growth of plants• The addition of DWM should be considered in
restoration project• May take decades for DWM to occur naturally on
human altered sites • WOOD IS GOOD

Tree and Shrub comparison study > bare root gravel culture plants versus 3-5 gallon containers
Bare root is grown in an experimental gravel culture medium that is well-watered
Paired with container stock of same species
Planted in same shoreland area
Marked/tagged for long-term monitoring
Pairs were followed 4-5 years for growth rates and survival
Will gravel culture materials be a more cost effective source for plantings with similar results as containerized plants?
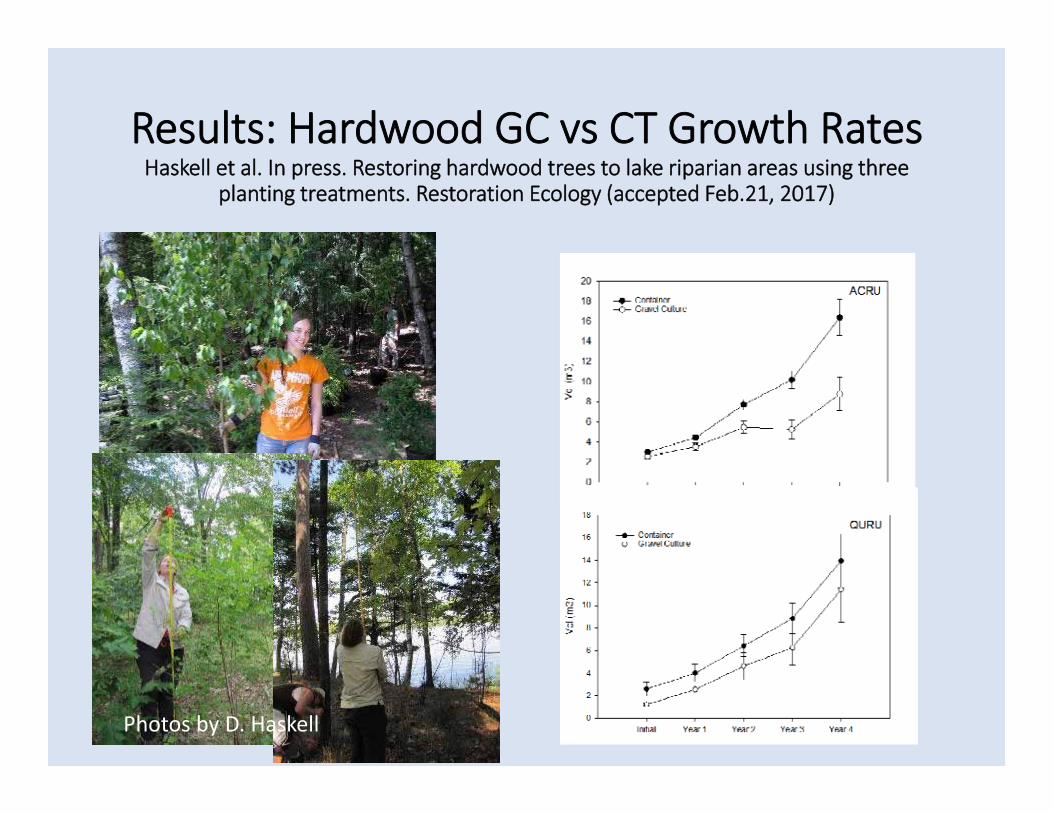
Results: Hardwood GC vs CT Growth RatesHaskell et al. In press. Restoring hardwood trees to lake riparian areas using three
planting treatments. Restoration Ecology (accepted Feb.21, 2017)
Photos by D. Haskell

Results: Hardwood GC vs CT Survival
Survival of GC Hardwoods after four years
Photo by D. Haskell

Evaluation of Active vs. Passive Lakeshore Habitat Restoration: Crystal Lake Campground
Lakeshore Restoration Project

“Passive Restoration” With Fence and Irrigation
Before
After
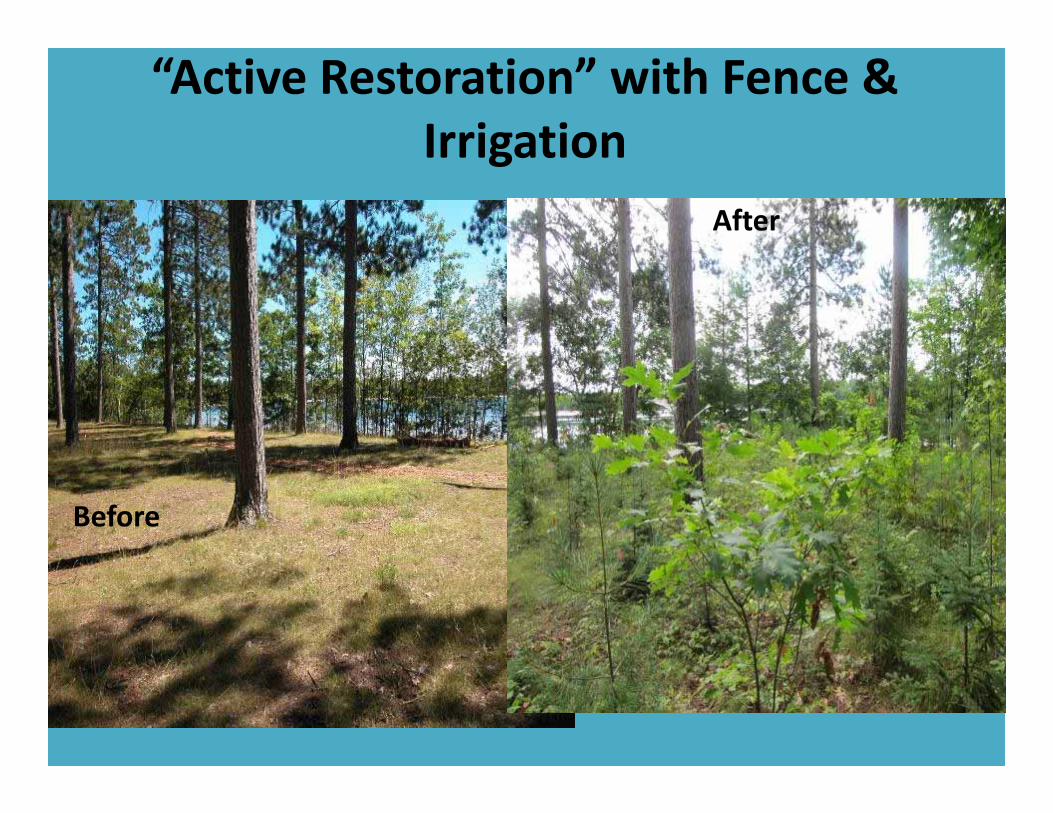
“Active Restoration” with Fence & Irrigation
Before
After

Crystal Lake Results• If Seed Bank present a “natural recovery” can be efficient
• If a shrub component is desired than “active restoration” may be needed
• Irrigation & Fence should be used
Sapl
ings
per
hec
tare
0
10000
20000
30000
40000
Control with F&I Control, No F&I Planting with F&I Planting, No F&I
Sapl
ings
per
hec
tare
0
1000
2000
3000
2010 2011 2012 2013 2014 2015
Shru
bs p
er h
ecta
re
0
2000
4000
6000
8000
A
C
B

Preliminary ordination analysis shows both passive and active restoration result in similar lakeshore
habitat improvement over time ‐ provided presence of a viable seed bank, deer fencing, and irrigation.
Photos by D. Haskell

Bioengineering TechniquesFor Erosion Control
• Biologs• EnviroLok Bags™• Coconut Erosion Mat• Sediment Logs• Tree Drops• Water Retention Ponds (Rain Gardens)

Installation of Bio-Logs
Photos by: D. Haskell

Bio-logs One Year Later
Photos by: D. Haskell

Erosion control method > biologs / Enviro-lok® bags

EnviroLok™ Bags
Photos A & B: before EnviroLok™ bags were installed. Photos C & D: after EnviroLok™ were installed on Moon Beach during the spring and summer of 2009.
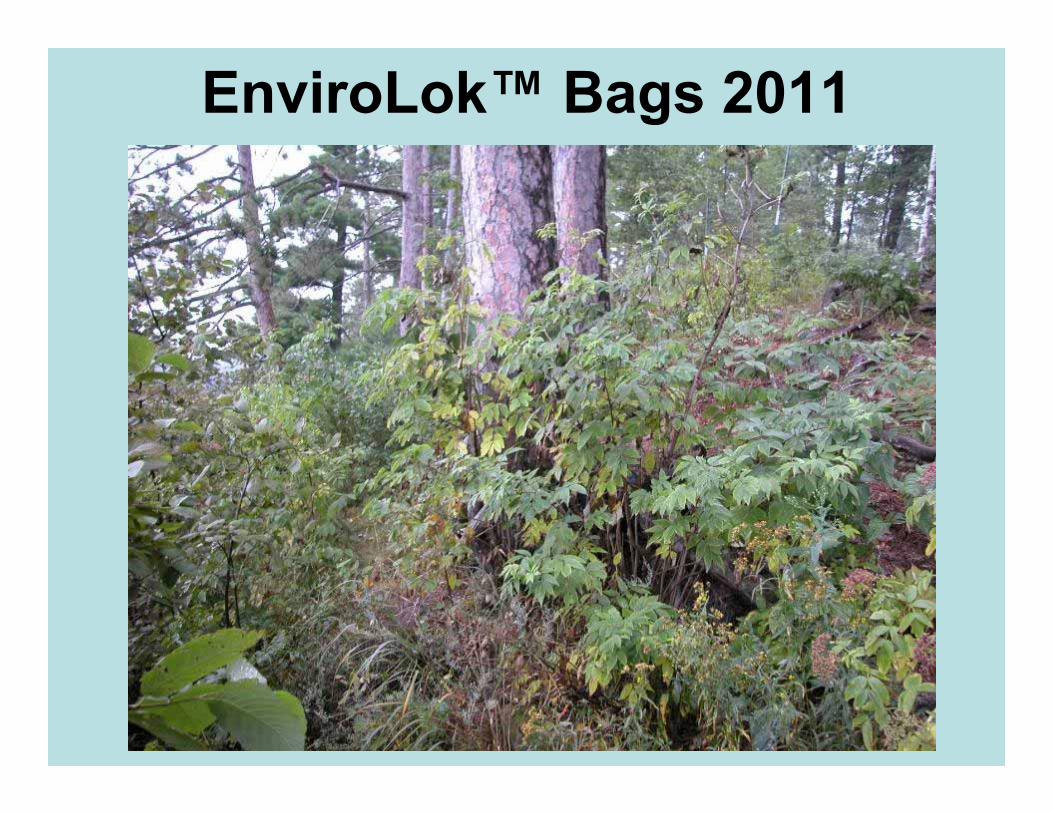
EnviroLok™ Bags 2011

Erosion Before
Photo by D. Haskell

Erosion After

Erosion control method > soil lifts


Wisconsin Lakeshore Restoration Project Conclusion
• Restoration increases habitat structure• The addition of DWM positively influence plants• Gravel Culture plants can be used in restoration projects
• Natural recovery can be a cost effective alternative• Bioengineering reduces erosion• Bridges gap between property owners and agency personnel
• Provides ecological and aesthetic value

Before / after photos > Found Lake

Before / after photos > North Lakeland Discovery Center 2009

2012 2014

Shorelandnumbers for Wisconsin
• 47,162,014 meters of shoreline on our inland lakes (data from WDNR Hydro IV database on 1:24,000 sources)
or over 29,304 miles
• Shoreland restoration needs to be an available option for any Wisconsin landowner willing to give it a try

Next Step – 2017 “Neighbor to Neighbor” Education and Outreach in Vilas County

Private sector partners are now ready to offer solutions to neighbors with lakeshore habitat restoration needs in the Northern Highlands.

Funding: WDNR, WDATCP, VCLWD, WSO, ESC, GSCMoon Beach CampersMTU Faculty, staff, and studentsMoon, Found, Lost, Little St. Germain property ownersNorth Lakeland Discover Center Bird ClubB. Hanson, P. Goggin, C. Scholl, M. Wagner, S. Dehne, T. Dalton, J. Wilson, G. Milanoski, M. SheehanField Tech: D. Drekich, C. Mehls, D. McGary, T. Armstrong, M, Pytleski, A. Komar, M. Ferge. J. Links, E. Delcamp, M. Boehmeer, E. Bowen, Quita, K. Merical, S. Simestad, A. Nachel, A. Bowen, C. Waas, K. Merical, N. Comar, K. Kelly, K. Genther, J. Hunter, J. Wheeler, C. Dexler, E.Collins, A Sharpe, A. Van Wagner, G. BrammerGIS: M. Woodford, B. FevoldUW-Trout & Kemp Research StationsTrout Lake WDNR Forestry Headquarters: S. Peterson, C. HardinMarshfield Clinic Research FoundationPrivate Businesses: Hanson Garden Village, MK Landscaping, Wildwood Landscaping, Integrity Landscaping, Waldmann Construction, Green Lawn irrigation
Acknowledgements

Questions?NOVA Ecological
Services
Michigan Tech

Lessons learned > landowners• Written agreements, photographs, and detailed property maps are a key tool for working with landowners undertaking restoration projects
• Landowner maintenance of projects are vital to restoration success over the long-term
• Finding willing landowners to participate in the lakeshore restoration process is a continuing issue

Lessons learned > plantings and watering Drought conditions through
most of first season and part of the 2nd year as well
Some difficulty with access to water—had to pump from lake which made it more costly and time intensive
The amount of time and resources needed to have adequate watering take place was underestimated
Difficult site conditions—harsh exposure, ‘sugar’ sand soil, steep slopes (up to 45◦)
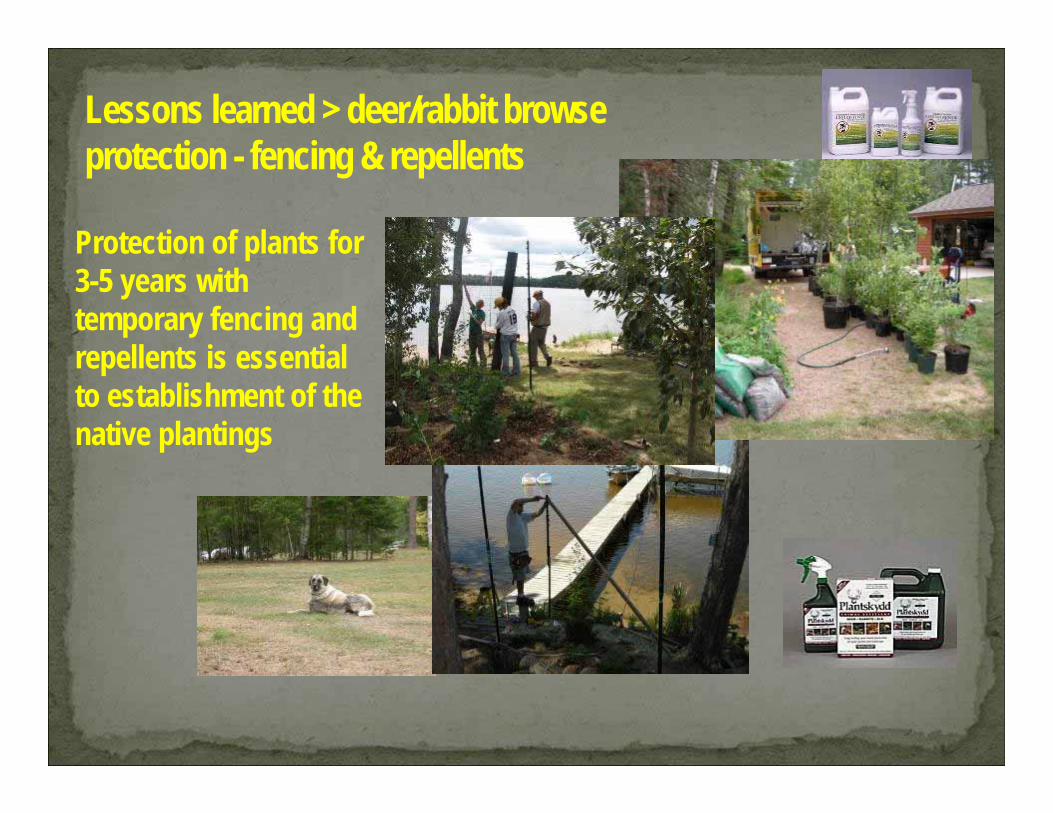
Lessons learned > deer/rabbit browse protection - fencing & repellents
Protection of plants for 3-5 years with temporary fencing and repellents is essential to establishment of the native plantings

Lessons learned > costs• Preliminary cost breakdowns are between ~$50 and $100 per linear foot of restored buffer back 35-feet
• Costs in part dependent on the amount of involvement from landowners, staff labor support, who does the design work, erosion control installation, plantings, fence building, and watering regime over time
• Fencing and erosion control techniques can be costly and logistically challenging
•County cost-share programs and WDNR Lake Grant Program (lake protection/Healthy Lakes) can assist

Lessons learned > working with nurseries & contractors
• Building local expertise with nurseries and contractors for effective shoreland buffer designs and installations will be a continued priority

Lessons learned > working with nurseries & contractors
•The importance of having enough native plant material available through local nurseries. Native, yet will tolerate tough conditions (hot, dry, sugar sand, shade, browsers)2) Somewhere in presentation: acknowledgment of the amount of engineering expertise needed to design the installation some of the methods ( bag walls, geogrid lifts, etc).
0780 photo is Hvam 2013.Photo 0725 – 0727 Krum 2013

Lessons learned in the art and science of intelligent tinkering on lakeshores:• Landowners are essential to any restoration strategy; without willing lakeshore property owners, opportunities for rehabilitating lakeshore habitat are minimal. Withinthe Northern Highlands, we found interest low among lake property owners. Finding local, on-lake champions of lakeshore rehabilitation work like lake association officersor master gardeners can make for effective peer-to-peer learning and project buy-in. Two lakes involved with this project had less success with securing landowners because no effective local lake champion could be found to make the case for recruiting suitable lakeshore property owners.
• Natural resource educators, contractors, planners, and other consultants to these landowners need to be hands-on with their assistance.They must openly communicate with landowners to understand their vision for their lakeshore properties on access points, view corridors, plant selection, storage needs, landscaping preferences, and other facets of the project. For example, we need to meet landowners where their landscape values are, whether they champion a “messy look” closer to a wild lakeshore or a “tidy” aesthetic that might accentuate drifts of plants, delineated edgings, and lower growing native vegetation.
• Incorporating ecological design principles of water infiltration, retention, reuse, and flow control into our strategies with landowners pays dividends. This includes low impact development (LID) approaches and practices that are targeted to reduce runoff of water and pollutants like rain gardens and barrels, permeable pavements, green roofs, living walls, infiltration planters, drain systems, water bars, brush bundles, gutters, and cisterns.
• Finding erosion control solutions for landowners to challenges from ice heave and wave action are critical to success. This fact often brings willing landowners to the table for doing shoreland rehabilitation so we need to make sure we address these concerns effectively. Innovative advances in erosion control materials that meet state standards and codes can be found by partnering with land and water conservation departments, consultants, and others.
• Shoreland zoning and other regulatory instruments alone are not enough to protect lakeshore habitat. Lakes with minimum frontage lake lots at 200 feet versus 100 feet (or less) withstand the stressors of human disturbance more positively.
• Holistic and inclusive lake community partnerships can support lakeshore restoration work of all kinds. Be open to possible project helpers like lake organizations, scouting groups, master gardeners, churches and other community organizations.
• Lakeshore rehabilitation projects are good for local economies and small business owners. Expenditures from these lake projects provide income to area contractors, nurseries, landscapers, erosion control specialists, and others employed in facets of the work.

• Select native plant species that are proven work horses, namely sedges, grasses, and rushes. These soil-holding plants are important to the goal of restoring ecologicalfunctions to lakeshore areas and they can persist throughout the transition zone from upland areas to near-shore locations with wet feet.
• Upland species can be a challenge to get established without proper maintenance. The soil condition, aspect, and slopes should be considered when generating a plantlist.
• Maintenance is a vital part of the process (i.e., monitoring for ample watering regimes; invasive species control needs; browse protection systems like spray deterrents,temporary fencing, or motion-sensory sprinkler plans; proper dock storage; etc.).
• Degradation of lakeshore habitat cover is the most important stressor of lakes.
• At present, voluntary restoration of lakeshore habitat will likely have only a modest influence on watershed health. Even mandatory mitigation requirements wrapped up in local shoreland rules may only marginally increase participation. But when politically possible, shoreland rules or zoning that require lakeshore habitat conservation and restoration can perhaps provide the greatest benefit in the long term. Understanding more deeply and clearly the barriers landowners confront in ultimately accepting the practice of lakeshore habitat restoration and devising marketing strategies that utilize this information may also pay dividends in the future.
• Few wildlife survey results illustrate clear relations to restoration activities two to five years post restoration. It could be that: (1) the scale of restoration is too small to affectchange; (2) it is too early to anticipate change given the lack of development of habitat on the restored sites; (3) our survey techniques to date are not sensitive to real changes that may have occurred for birds, frogs, and small mammals; and/or (4) new surveys need to be implemented to measure change that occurs at the scale of our lakeshore restorations.
• Additional surveys need to be implemented to measure change that more likely occurs at the scale of our lakeshore restorations(e.g., pollinators; soil microbes/arthropods;soil chemistry; fine woody material; root growth and depth; etc.).

Lessons learned / emerging conclusions / transferability• A holistic partnership involving a myriad of agencies, people and talents is crucial to our success;• A formalized and significant watering regime during the first growing season initially took a lot of time and effort (I.E., portable pumps; drought conditions; sugar-sand soils; water sources; etc.)—increased emphasis has been put on watering systems, planning, and long-term maintenance;• Preliminary cost breakdowns are ~$50 to $100 per linear foot of restored buffer back 35 feet depending on the involvement level of the landowners, staff support, planting labor, watering, etc.• Biocontrol and erosion control techniques can be costly and logistically challenging;• Landowners are vital to making this partnership work over the ten-year period of the study;• Creating a reliable funding mechanism for the ten-year duration of the study between multiple agencies is an ongoing hurdle to overcome;• Finding willing landowners to participate in the lakeshore restoration process is a continuing concern;• We know that 200 ft. [or greater] lot sizes typically provide landowners with enough room to live on the lake comfortably while still maintaining adequate wildlife habitat and suitable water quality;• Fencing native plantings is crucial to allowing the plants the opportunity to establish viable roots that can resist heavy browsing pressure from deer, rabbits, and other critters;• Building local expertise with contractors and nurseries for effective shoreland buffer designs and installations will be a priority into the future;• A higher diversity of mammals is being detected on low-development lakes when compared to high-development lakes--coyotes were the most numerous species detected with the majority encountered on low-development lakes--white-tailed deer and red fox were more abundant on high-development lakes--high-development lakes are having a negative effect on the mammal community in this area;• Baseline data for bird and small mammal community diversity and abundance and on vegetation structure is being collected over the long-term study; and• Peer-to-peer educational techniques and communication methods can be an effective strategy for fostering behavior change and achieving project buy-in by shorelandproperty owners engaged in the study.