lake whatcom monitoring project 2011/2012 report
TRANSCRIPT

Lake Whatcom Monitoring Project2011/2012 Report
Dr. Robin A. MatthewsMichael Hilles
Joan VandersypenInstitute for Watershed Studies,
Huxley College of the Environment
Dr. Robert J. MitchellGeology Department,
College of Sciences and Technology
Dr. Geoffrey B. MatthewsComputer Science Department,
College of Sciences and Technology
Western Washington UniversityBellingham, Washington 98225
March 7, 2013
Funding for this project was provided by the City of Bellingham, as part of their long-term
commitment to environmental education and their concern for maintaining the water quality of
Lake Whatcom. We thank Marilyn Desmul, James Bucher, CassieCastrejon, Sean Cooper, Miette
Dahlgren, Jonnel Deacon, Neddy Dondup, Olivia Edwards, Chad Elofson, Josh Jones, Laura
Junge, Andrew Majeske, Niki Thane, Paul Wanzek-Wild, Chantal Wikstrom, Shaun Weldon, and
Jordan Zanmiller for assistance with the project.

(This page blank)

Contents
1 Introduction 1
2 Lake Whatcom Monitoring 2
2.1 Site Descriptions . . . . . . . . . . . . . . . . . . . . . . . . . . 2
2.2 Field Sampling and Analytical Methods . . . . . . . . . . . . . . 2
2.3 Results and Discussion . . . . . . . . . . . . . . . . . . . . . . . 3
2.3.1 Water temperature . . . . . . . . . . . . . . . . . . . . . 4
2.3.2 Dissolved oxygen . . . . . . . . . . . . . . . . . . . . . . 5
2.3.3 Conductivity and pH . . . . . . . . . . . . . . . . . . . . 7
2.3.4 Alkalinity and turbidity . . . . . . . . . . . . . . . . . . . 7
2.3.5 Nitrogen and phosphorus . . . . . . . . . . . . . . . . . . 8
2.3.6 Chlorophyll, plankton, and Secchi depth . . . . . . . . . . 11
2.3.7 Coliform bacteria . . . . . . . . . . . . . . . . . . . . . . 13
2.3.8 Metals . . . . . . . . . . . . . . . . . . . . . . . . . . . . 14
2.3.9 Total organic carbon and disinfection by-products . .. . . 14
3 Tributary Monitoring 37
3.1 Site Descriptions . . . . . . . . . . . . . . . . . . . . . . . . . . 37
3.2 Field Sampling and Analytical Methods . . . . . . . . . . . . . . 37
3.3 Results and Discussion . . . . . . . . . . . . . . . . . . . . . . . 38
4 Lake Whatcom Hydrology 56
4.1 Hydrograph Data . . . . . . . . . . . . . . . . . . . . . . . . . . 56
4.2 Water Budget . . . . . . . . . . . . . . . . . . . . . . . . . . . . 56
i

5 Storm Water Monitoring 69
5.1 Site Descriptions . . . . . . . . . . . . . . . . . . . . . . . . . . 69
5.2 Field Sampling and Analytical Methods . . . . . . . . . . . . . . 69
5.3 Results and Discussion . . . . . . . . . . . . . . . . . . . . . . . 70
6 References and Related Reports 87
6.1 References . . . . . . . . . . . . . . . . . . . . . . . . . . . . . . 87
6.2 Related Reports . . . . . . . . . . . . . . . . . . . . . . . . . . . 89
A Site Descriptions 93
A.1 Lake Whatcom Monitoring Sites . . . . . . . . . . . . . . . . . . 93
A.2 Tributary Monitoring Sites . . . . . . . . . . . . . . . . . . . . . 94
A.3 Storm Water Monitoring Sites . . . . . . . . . . . . . . . . . . . 95
B Long-Term Water Quality Figures 101
B.1 Monthly Hydrolab Profiles . . . . . . . . . . . . . . . . . . . . . 102
B.2 Long-term Hydrolab Data (1988-present) . . . . . . . . . . . . .153
B.3 Long-term Water Quality Data (1988-present) . . . . . . . . .. . 174
B.4 Lake Whatcom Tributary Data (2004-present) . . . . . . . . . .. 235
C Quality Control 275
C.1 Performance Evaluation Report . . . . . . . . . . . . . . . . . . . 275
C.2 Laboratory Duplicates, Spikes, and Check Standards . . .. . . . 277
C.3 Field Duplicate Results . . . . . . . . . . . . . . . . . . . . . . . 308
D Lake Whatcom Online Data 329
ii

List of Figures
1 Boxplots showing 1988-2012 surface water temperatures . .. . . 25
2 Relationship between dissolved oxygen and time at Site 1, 12 m . 26
3 Relationship between dissolved oxygen and time at Site 1, 14 m . 27
4 Relationship between dissolved oxygen and time at Site 1, 16 m . 28
5 Relationship between dissolved oxygen and time at Site 1, 18 m . 29
6 Minimum summer, near-surface dissolved inorganic nitrogen con-centrations . . . . . . . . . . . . . . . . . . . . . . . . . . . . . . 30
7 Median summer, near-surface total phosphorus concentrations . . 31
8 Median summer near-surface chlorophyll concentrations .. . . . 32
9 Log10 plots of median summer, near-surface algae counts . . . . . 33
10 Log10 plots of median summer, near-surface Cyanobacteria counts34
11 Annual total organic carbon concentrations at Sites 1–4.. . . . . . 35
12 Total trihalomethanes and haloacetic acids concentrations in theBellingham water distribution system . . . . . . . . . . . . . . . 36
13 Austin Creek hydrograph, October 1, 2011–September 30, 2012. . 62
14 Smith Creek hydrograph, October 1, 2011–September 30, 2012. . 63
15 Comparison of Lake Whatcom daily lake volumes for WY2008–WY2012. . . . . . . . . . . . . . . . . . . . . . . . . . . . . . . 64
16 Summary of 7-day inputs, outputs, and changes in Lake Whatcomstorage, October 1, 2011–September 30, 2012. . . . . . . . . . . . 65
17 Lake Whatcom watershed direct hydrologic inputs, October 1,2011–September 30, 2012. . . . . . . . . . . . . . . . . . . . . . 66
18 Lake Whatcom watershed hydrologic withdrawals, October1,2011–September 30, 2012. . . . . . . . . . . . . . . . . . . . . . 67
iii
19 Summary of 7-day Whatcom Creek flows, water balance runoffestimates, and DHSVM runoff estimates, October 1, 2011–September 30, 2012. . . . . . . . . . . . . . . . . . . . . . . . . 68
20 Silver Beach Creek storm water monitoring results for Events 17–24: total suspended solids vs. stream flow. . . . . . . . . . . . . . 73
21 Silver Beach Creek storm water monitoring results for Events 17–24: turbidity vs. stream flow. . . . . . . . . . . . . . . . . . . . . 74
22 Silver Beach Creek storm water monitoring results for Events 17–24: total phosphorus vs. stream flow. . . . . . . . . . . . . . . . . 75
23 Silver Beach Creek storm water monitoring results for Events 17–24: soluble phosphate vs. stream flow. . . . . . . . . . . . . . . . 76
24 Silver Beach Creek storm water monitoring results for Events 17–24: total nitrogen vs. stream flow. . . . . . . . . . . . . . . . . . . 77
25 Silver Beach Creek storm water monitoring results for Events 17–24: nitrate/nitrite vs. stream flow. . . . . . . . . . . . . . . . . . . 78
26 Correlation between stream flow or stage height and total sus-pended solids in Silver Beach Creek. . . . . . . . . . . . . . . . . 79
27 Correlation between stream flow or stage height and turbidity inSilver Beach Creek. . . . . . . . . . . . . . . . . . . . . . . . . . 80
28 Correlation between stream flow or stage height and total phos-phorus in Silver Beach Creek. . . . . . . . . . . . . . . . . . . . 81
29 Correlation between stream flow or stage height and soluble phos-phate in Silver Beach Creek. . . . . . . . . . . . . . . . . . . . . 82
30 Correlation between stream flow or stage height and total nitrogenin Silver Beach Creek. . . . . . . . . . . . . . . . . . . . . . . . 83
31 Correlation between stream flow or stage height and nitrate in Sil-ver Beach Creek. . . . . . . . . . . . . . . . . . . . . . . . . . . 84
32 Correlation between total suspended solids, turbidity,and totalphosphorus in Silver Beach Creek. . . . . . . . . . . . . . . . . . 85
iv

33 Correlation between stream flow and total phosphorus by stormevent in Silver Beach Creek. . . . . . . . . . . . . . . . . . . . . 86
A1 Lake Whatcom lake sampling sites. . . . . . . . . . . . . . . . . 97
A2 Lake Whatcom tributary sampling sites. . . . . . . . . . . . . . . 98
A3 Silver Beach Creek storm water site. . . . . . . . . . . . . . . . . 99
B1 Lake Whatcom Hydrolab profiles for Site 1, October 4, 2011 .. . 103
B2 Lake Whatcom Hydrolab profiles for Site 2, October 4, 2011 .. . 104
B3 Lake Whatcom Hydrolab profiles for the Intake, October 4, 2011 . 105
B4 Lake Whatcom Hydrolab profiles for Site 3, October 5, 2011 .. . 106
B5 Lake Whatcom Hydrolab profiles for Site 4, October 5, 2011 .. . 107
B6 Lake Whatcom YSI profiles for Site 1, November 1, 2011. . . . .108
B7 Lake Whatcom YSI profiles for Site 2, November 1, 2011. . . . .109
B8 Lake Whatcom YSI profiles for the Intake, November 1, 2011.. . 110
B9 Lake Whatcom YSI profiles for Site 3, November 2, 2011. . . . .111
B10 Lake Whatcom YSI profiles for Site 4, November 2, 2011. . . .. 112
B11 Lake Whatcom YSI profiles for Site 1, December 7, 2011. . . .. 113
B12 Lake Whatcom YSI profiles for Site 2, December 7, 2011. . . .. 114
B13 Lake Whatcom YSI profiles for the Intake, December 7, 2011. . . 115
B14 Lake Whatcom YSI profiles for Site 3, December 6, 2011. Thelow oxygen value at 80 meters was most likely due to incompletewater column mixing following recent destratification. . . .. . . 116
B15 Lake Whatcom YSI profiles for Site 4, December 6, 2011. . . .. 117
B16 Lake Whatcom YSI profiles for Site 1, February 3, 2012. . . .. . 118
B17 Lake Whatcom YSI profiles for Site 2, February 3, 2012. . . .. . 119
B18 Lake Whatcom YSI profiles for the Intake, February 3, 2012. . . . 120
B19 Lake Whatcom YSI profiles for Site 3, February 1, 2012. . . .. . 121
v

B20 Lake Whatcom YSI profiles for Site 4, February 1, 2012. . . .. . 122
B21 Lake Whatcom YSI profiles for Site 1, April 14, 2012. . . . . .. 123
B22 Lake Whatcom YSI profiles for Site 2, April 14, 2012. . . . . .. 124
B23 Lake Whatcom YSI profiles for the Intake, April 14, 2012. .. . . 125
B24 Lake Whatcom YSI profiles for Site 3, April 10, 2012. . . . . .. 126
B25 Lake Whatcom YSI profiles for Site 4, April 10, 2012. . . . . .. 127
B26 Lake Whatcom YSI profiles for Site 1, May 10, 2012. . . . . . . .128
B27 Lake Whatcom YSI profiles for Site 2, May 10, 2012. . . . . . . .129
B28 Lake Whatcom YSI profiles for the Intake, May 10, 2012. . . .. . 130
B29 Lake Whatcom YSI profiles for Site 3, May 3, 2012. . . . . . . . 131
B30 Lake Whatcom YSI profiles for Site 4, May 3, 2012. . . . . . . . 132
B31 Lake Whatcom YSI profiles for Site 1, June 7, 2012. . . . . . . .133
B32 Lake Whatcom YSI profiles for Site 2, June 7, 2012. . . . . . . .134
B33 Lake Whatcom YSI profiles for the Intake, June 7, 2012. . . .. . 135
B34 Lake Whatcom YSI profiles for Site 3, June 9, 2012. . . . . . . .136
B35 Lake Whatcom YSI profiles for Site 4, June 9, 2012. . . . . . . .137
B36 Lake Whatcom YSI profiles for Site 1, July 7, 2012. . . . . . . .. 138
B37 Lake Whatcom YSI profiles for Site 2, July 7, 2012. . . . . . . .. 139
B38 Lake Whatcom YSI profiles for the Intake, July 7, 2012. . . .. . 140
B39 Lake Whatcom YSI profiles for Site 3, July 5, 2012. . . . . . . .. 141
B40 Lake Whatcom YSI profiles for Site 4, July 5, 2012. . . . . . . .. 142
B41 Lake Whatcom YSI profiles for Site 1, August 4, 2012. . . . . .. 143
B42 Lake Whatcom YSI profiles for Site 2, August 4, 2012. . . . . .. 144
B43 Lake Whatcom YSI profiles for the Intake, August 4, 2012. .. . . 145
B44 Lake Whatcom YSI profiles for Site 3, August 2, 2012. . . . . .. 146
vi
B45 Lake Whatcom YSI profiles for Site 4, August 2, 2012. . . . . .. 147
B46 Lake Whatcom YSI profiles for Site 1, September 8, 2012. . .. . 148
B47 Lake Whatcom YSI profiles for Site 2, September 8, 2012. . .. . 149
B48 Lake Whatcom YSI profiles for the Intake, September 8, 2012. . . 150
B49 Lake Whatcom YSI profiles for Site 3, September 6, 2012. . .. . 151
B50 Lake Whatcom YSI profiles for Site 4, September 6, 2012. . .. . 152
B51 Lake Whatcom historic temperature data for Site 1. . . . . .. . . 154
B52 Lake Whatcom historic temperature data for Site 2. . . . . .. . . 155
B53 Lake Whatcom historic temperature data for the Intake. .. . . . . 156
B54 Lake Whatcom historic temperature data for Site 3. . . . . .. . . 157
B55 Lake Whatcom historic temperature data for Site 4. . . . . .. . . 158
B56 Lake Whatcom historic dissolved oxygen data for Site 1. .. . . . 159
B57 Lake Whatcom historic dissolved oxygen data for Site 2. .. . . . 160
B58 Lake Whatcom historic dissolved oxygen data for the Intake. . . . 161
B59 Lake Whatcom historic dissolved oxygen data for Site 3. .. . . . 162
B60 Lake Whatcom historic dissolved oxygen data for Site 4. .. . . . 163
B61 Lake Whatcom historic pH data for Site 1. . . . . . . . . . . . . . 164
B62 Lake Whatcom historic pH data for Site 2. . . . . . . . . . . . . . 165
B63 Lake Whatcom historic pH data for the Intake. . . . . . . . . . .. 166
B64 Lake Whatcom historic pH data for Site 3. . . . . . . . . . . . . . 167
B65 Lake Whatcom historic pH data for Site 4. . . . . . . . . . . . . . 168
B66 Lake Whatcom historic conductivity data for Site 1. . . . .. . . . 169
B67 Lake Whatcom historic conductivity data for Site 2. . . . .. . . . 170
B68 Lake Whatcom historic conductivity data for the Intake.. . . . . . 171
B69 Lake Whatcom historic conductivity data for Site 3. . . . .. . . . 172
vii

B70 Lake Whatcom historic conductivity data for Site 4. . . . .. . . . 173
B71 Lake Whatcom alkalinity data for Site 1. . . . . . . . . . . . . . .175
B72 Lake Whatcom alkalinity data for Site 2. . . . . . . . . . . . . . .176
B73 Lake Whatcom alkalinity data for the Intake site. . . . . . .. . . 177
B74 Lake Whatcom alkalinity data for Site 3. . . . . . . . . . . . . . .178
B75 Lake Whatcom alkalinity data for Site 4. . . . . . . . . . . . . . .179
B76 Lake Whatcom turbidity data for Site 1. . . . . . . . . . . . . . . 180
B77 Lake Whatcom turbidity data for Site 2. . . . . . . . . . . . . . . 181
B78 Lake Whatcom turbidity data for the Intake site. . . . . . . .. . . 182
B79 Lake Whatcom turbidity data for Site 3. . . . . . . . . . . . . . . 183
B80 Lake Whatcom turbidity data for Site 4. . . . . . . . . . . . . . . 184
B81 Lake Whatcom ammonium data for Site 1. . . . . . . . . . . . . . 185
B82 Lake Whatcom ammonium data for Site 2. . . . . . . . . . . . . . 186
B83 Lake Whatcom ammonium data for the Intake site. . . . . . . . .187
B84 Lake Whatcom ammonium data for Site 3. . . . . . . . . . . . . . 188
B85 Lake Whatcom ammonium data for Site 4. . . . . . . . . . . . . . 189
B86 Lake Whatcom nitrate/nitrite data for Site 1. . . . . . . . . .. . . 190
B87 Lake Whatcom nitrate/nitrite data for Site 2. . . . . . . . . .. . . 191
B88 Lake Whatcom nitrate/nitrite data for the Intake site. .. . . . . . 192
B89 Lake Whatcom nitrate/nitrite data for Site 3. . . . . . . . . .. . . 193
B90 Lake Whatcom nitrate/nitrite data for Site 4. . . . . . . . . .. . . 194
B91 Lake Whatcom total nitrogen data for Site 1. . . . . . . . . . . .. 195
B92 Lake Whatcom total nitrogen data for Site 2. . . . . . . . . . . .. 196
B93 Lake Whatcom total nitrogen data for the Intake site. . . .. . . . 197
B94 Lake Whatcom total nitrogen data for Site 3. . . . . . . . . . . .. 198
viii

B95 Lake Whatcom total nitrogen data for Site 4. . . . . . . . . . . .. 199
B96 Lake Whatcom soluble phosphate data for Site 1. . . . . . . . .. 200
B97 Lake Whatcom soluble phosphate data for Site 2. . . . . . . . .. 201
B98 Lake Whatcom soluble phosphate data for the Intake site.. . . . . 202
B99 Lake Whatcom soluble phosphate data for Site 3. . . . . . . . .. 203
B100Lake Whatcom soluble phosphate data for Site 4. . . . . . . .. . 204
B101Lake Whatcom total phosphorus data for Site 1. . . . . . . . .. . 205
B102Lake Whatcom total phosphorus data for Site 2. . . . . . . . .. . 206
B103Lake Whatcom total phosphorus data for the Intake site.. . . . . . 207
B104Lake Whatcom total phosphorus data for Site 3. . . . . . . . .. . 208
B105Lake Whatcom total phosphorus data for Site 4. . . . . . . . .. . 209
B106Lake Whatcom chlorophyll data for Site 1. . . . . . . . . . . . .. 210
B107Lake Whatcom chlorophyll data for Site 2. . . . . . . . . . . . .. 211
B108Lake Whatcom chlorophyll data for the Intake site. . . . .. . . . 212
B109Lake Whatcom chlorophyll data for Site 3. . . . . . . . . . . . .. 213
B110Lake Whatcom chlorophyll data for Site 4. . . . . . . . . . . . .. 214
B111Lake Whatcom Secchi depths for Site 1. . . . . . . . . . . . . . . 215
B112Lake Whatcom Secchi depths for Site 2. . . . . . . . . . . . . . . 216
B113Lake Whatcom Secchi depths for the Intake site. . . . . . . .. . . 217
B114Lake Whatcom Secchi depths for Site 3. . . . . . . . . . . . . . . 218
B115Lake Whatcom Secchi depths for Site 4. . . . . . . . . . . . . . . 219
B116Lake Whatcom fecal coliform data for Site 1. . . . . . . . . . .. 220
B117Lake Whatcom fecal coliform data for Site 2. . . . . . . . . . .. 221
B118Lake Whatcom fecal coliform data for the Intake site. . .. . . . . 222
B119Lake Whatcom fecal coliform data for Site 3. . . . . . . . . . .. 223
ix

B120Lake Whatcom fecal coliform data for Site 4. . . . . . . . . . .. 224
B121Lake Whatcom plankton data for Site 1. . . . . . . . . . . . . . . 225
B122Lake Whatcom plankton data for Site 2. . . . . . . . . . . . . . . 226
B123Lake Whatcom plankton data for the Intake Site. . . . . . . .. . 227
B124Lake Whatcom plankton data for Site 3. . . . . . . . . . . . . . . 228
B125Lake Whatcom plankton data for Site 4. . . . . . . . . . . . . . . 229
B126Lake Whatcom plankton data for Site 1, with Chrysophytaomit-ted to show remaining plankton groups. . . . . . . . . . . . . . . 230
B127Lake Whatcom plankton data for Site 2, with Chrysophytaomit-ted to show remaining plankton groups. . . . . . . . . . . . . . . 231
B128Lake Whatcom plankton data for the Intake Site, with Chryso-phyta omitted to show remaining plankton groups. . . . . . . . . .232
B129Lake Whatcom plankton data for Site 3, with Chrysophytaomit-ted to show remaining plankton groups. . . . . . . . . . . . . . . 233
B130Lake Whatcom plankton data for Site 4, with Chrysophytaomit-ted to show remaining plankton groups. . . . . . . . . . . . . . . 234
B131Temperature data for Anderson, Austin, Smith, and WhatcomCreeks. . . . . . . . . . . . . . . . . . . . . . . . . . . . . . . . 236
B132Temperature data for Blue Canyon, Brannian, Carpenter, andOlsen Creek. . . . . . . . . . . . . . . . . . . . . . . . . . . . . 237
B133Temperature data for Euclid, Millwheel, and Silver Beach Creeksand the Park Place drain. . . . . . . . . . . . . . . . . . . . . . . 238
B134Dissolved oxygen data for Anderson, Austin, Smith, andWhat-com Creeks. . . . . . . . . . . . . . . . . . . . . . . . . . . . . . 239
B135Dissolved oxygen data for Blue Canyon, Brannian, Carpenter, andOlsen Creeks. . . . . . . . . . . . . . . . . . . . . . . . . . . . . 240
B136Dissolved oxygen data for Euclid, Millwheel, and Silver BeachCreeks and the Park Place drain. . . . . . . . . . . . . . . . . . . 241
x

B137Tributary pH data for Anderson, Austin, Smith, and WhatcomCreeks. . . . . . . . . . . . . . . . . . . . . . . . . . . . . . . . 242
B138Tributary pH data for Blue Canyon, Brannian, Carpenter, andOlsen Creeks. . . . . . . . . . . . . . . . . . . . . . . . . . . . . 243
B139Tributary pH data for Euclid, Millwheel, and Silver Beach Creeksand the Park Place drain. . . . . . . . . . . . . . . . . . . . . . . 244
B140Conductivity data for Anderson, Austin, Smith, and WhatcomCreeks. . . . . . . . . . . . . . . . . . . . . . . . . . . . . . . . 245
B141Conductivity data for Blue Canyon, Brannian, Carpenter, andOlsen Creeks. . . . . . . . . . . . . . . . . . . . . . . . . . . . . 246
B142Conductivity data for Euclid, Millwheel, and Silver Beach Creeksand the Park Place drain. . . . . . . . . . . . . . . . . . . . . . . 247
B143Alkalinity data for Anderson, Austin, Smith, and Whatcom Creeks. 248
B144Alkalinity data for Blue Canyon, Brannian, Carpenter,and OlsenCreeks. . . . . . . . . . . . . . . . . . . . . . . . . . . . . . . . 249
B145Alkalinity data for Euclid, Millwheel, and Silver Beach Creeksand the Park Place drain. . . . . . . . . . . . . . . . . . . . . . . 250
B146Total suspended solids data for Anderson, Austin, Smith, andWhatcom Creeks. . . . . . . . . . . . . . . . . . . . . . . . . . . 251
B147Total suspended solids data for Blue Canyon, Brannian,Carpen-ter, and Olsen Creeks. . . . . . . . . . . . . . . . . . . . . . . . . 252
B148Total suspended solids data for Euclid, Millwheel, andSilverBeach Creeks and the Park Place drain. . . . . . . . . . . . . . . 253
B149Turbidity data for Anderson, Austin, Smith, and Whatcom Creeks. 254
B150Turbidity data for Blue Canyon, Brannian, Carpenter, and OlsenCreeks. . . . . . . . . . . . . . . . . . . . . . . . . . . . . . . . 255
B151Turbidity data for Euclid, Millwheel, and Silver BeachCreeks andthe Park Place drain. . . . . . . . . . . . . . . . . . . . . . . . . 256
xi

B152Ammonium data for Anderson, Austin, Smith, and WhatcomCreeks. . . . . . . . . . . . . . . . . . . . . . . . . . . . . . . . 257
B153Ammonium data for Blue Canyon, Brannian, Carpenter, andOlsen Creeks. . . . . . . . . . . . . . . . . . . . . . . . . . . . . 258
B154Ammonium data for Euclid, Millwheel, and Silver Beach Creeksand the Park Place drain. . . . . . . . . . . . . . . . . . . . . . . 259
B155Nitrate/nitrite data for Anderson, Austin, Smith, andWhatcomCreeks. . . . . . . . . . . . . . . . . . . . . . . . . . . . . . . . 260
B156Nitrate/nitrite data for Blue Canyon, Brannian, Carpenter, andOlsen Creeks. . . . . . . . . . . . . . . . . . . . . . . . . . . . . 261
B157Nitrate/nitrite data for Euclid, Millwheel, and Silver Beach Creeksand the Park Place drain. . . . . . . . . . . . . . . . . . . . . . . 262
B158Total nitrogen data for Anderson, Austin, Smith, and WhatcomCreeks. . . . . . . . . . . . . . . . . . . . . . . . . . . . . . . . 263
B159Total nitrogen data for Blue Canyon, Brannian, Carpenter, andOlsen Creeks. . . . . . . . . . . . . . . . . . . . . . . . . . . . . 264
B160Total nitrogen data for Euclid, Millwheel, and Silver BeachCreeks and the Park Place drain. . . . . . . . . . . . . . . . . . . 265
B161Soluble phosphate data for Anderson, Austin, Smith, and What-com Creeks. . . . . . . . . . . . . . . . . . . . . . . . . . . . . . 266
B162Soluble phosphate data for Blue Canyon, Brannian, Carpenter,and Olsen Creeks. . . . . . . . . . . . . . . . . . . . . . . . . . . 267
B163Soluble phosphate data for Euclid, Millwheel, and Silver BeachCreeks and the Park Place drain. . . . . . . . . . . . . . . . . . . 268
B164Total phosphorus data for Anderson, Austin, Smith, andWhatcomCreeks. . . . . . . . . . . . . . . . . . . . . . . . . . . . . . . . 269
B165Total phosphorus data for Blue Canyon, Brannian, Carpenter, andOlsen Creeks. . . . . . . . . . . . . . . . . . . . . . . . . . . . . 270
B166Total phosphorus data for Euclid, Millwheel, and Silver BeachCreeks and the Park Place drain. . . . . . . . . . . . . . . . . . . 271
xii

B167Fecal coliform data for Anderson, Austin, Smith, and WhatcomCreeks (short scale). . . . . . . . . . . . . . . . . . . . . . . . . . 272
B168Fecal coliform data for Blue Canyon, Brannian, Carpenter, andOlsen Creeks (short scale). . . . . . . . . . . . . . . . . . . . . . 273
B169Fecal coliform data for Euclid, Millwheel, and Silver BeachCreeks and the Park Place drain (short scale). . . . . . . . . . . . 274
C1 Alkalinity laboratory duplicates for the Lake Whatcom monitor-ing program. . . . . . . . . . . . . . . . . . . . . . . . . . . . . . 278
C2 Alkalinity high-range check standards for the Lake Whatcommonitoring program. . . . . . . . . . . . . . . . . . . . . . . . . 279
C3 Alkalinity low-range check standards for the Lake Whatcom mon-itoring program. . . . . . . . . . . . . . . . . . . . . . . . . . . . 280
C4 Chlorophyll laboratory duplicates for the Lake Whatcom moni-toring program. . . . . . . . . . . . . . . . . . . . . . . . . . . . 281
C5 Conductivity laboratory duplicates for the Lake Whatcommoni-toring program. . . . . . . . . . . . . . . . . . . . . . . . . . . . 282
C6 Dissolved oxygen laboratory duplicates for the Lake Whatcommonitoring program. . . . . . . . . . . . . . . . . . . . . . . . . 283
C7 Ammonium laboratory duplicates for the Lake Whatcom moni-toring program. . . . . . . . . . . . . . . . . . . . . . . . . . . . 284
C8 Ammonium matrix spikes for the Lake Whatcom monitoring pro-gram. . . . . . . . . . . . . . . . . . . . . . . . . . . . . . . . . 285
C9 Ammonium high-range check standards for the Lake Whatcommonitoring program. . . . . . . . . . . . . . . . . . . . . . . . . 286
C10 Ammonium low-range check standards for the Lake Whatcommonitoring program. . . . . . . . . . . . . . . . . . . . . . . . . 287
C11 Nitrate/nitrite laboratory duplicates for the Lake Whatcom moni-toring program. . . . . . . . . . . . . . . . . . . . . . . . . . . . 288
C12 Nitrate/nitrite matrix spikes for the Lake Whatcom monitoringprogram. . . . . . . . . . . . . . . . . . . . . . . . . . . . . . . . 289
xiii

C13 Nitrate/nitrite high-range check standards for the Lake Whatcommonitoring program. . . . . . . . . . . . . . . . . . . . . . . . . 290
C14 Nitrate/nitrite low-range check standards for the LakeWhatcommonitoring program. . . . . . . . . . . . . . . . . . . . . . . . . 291
C15 Total nitrogen laboratory duplicates for the Lake Whatcom moni-toring program. . . . . . . . . . . . . . . . . . . . . . . . . . . . 292
C16 Total nitrogen matrix spikes for the Lake Whatcom monitoringprogram. . . . . . . . . . . . . . . . . . . . . . . . . . . . . . . . 293
C17 Total nitrogen high-range check standards for the Lake Whatcommonitoring program. . . . . . . . . . . . . . . . . . . . . . . . . 294
C18 Total nitrogen low-range check standards for the Lake Whatcommonitoring program. . . . . . . . . . . . . . . . . . . . . . . . . 295
C19 Laboratory pH duplicates for the Lake Whatcom monitoring pro-gram. . . . . . . . . . . . . . . . . . . . . . . . . . . . . . . . . 296
C20 Soluble reactive phosphate laboratory duplicates for the LakeWhatcom monitoring program. . . . . . . . . . . . . . . . . . . . 297
C21 Soluble reactive phosphate matrix spikes for the Lake Whatcommonitoring program. . . . . . . . . . . . . . . . . . . . . . . . . 298
C22 Soluble reactive phosphate high-range check standardsfor theLake Whatcom monitoring program. . . . . . . . . . . . . . . . . 299
C23 Soluble reactive phosphate low-range check standards for theLake Whatcom monitoring program. . . . . . . . . . . . . . . . . 300
C24 Total phosphorus laboratory duplicates for the Lake Whatcommonitoring program. . . . . . . . . . . . . . . . . . . . . . . . . 301
C25 Total phosphorus matrix spikes for the Lake Whatcom monitoringprogram. . . . . . . . . . . . . . . . . . . . . . . . . . . . . . . . 302
C26 Total phosphorus high-range check standards for the Lake What-com monitoring program. . . . . . . . . . . . . . . . . . . . . . . 303
C27 Total phosphorus low-range check standards for the LakeWhat-com monitoring program. . . . . . . . . . . . . . . . . . . . . . . 304
xiv

C28 Total suspended solids laboratory duplicates for the Lake What-com monitoring program. . . . . . . . . . . . . . . . . . . . . . . 305
C29 Total suspended solids check standards for the Lake Whatcommonitoring program. . . . . . . . . . . . . . . . . . . . . . . . . 306
C30 Turbidity laboratory duplicates for the Lake Whatcom monitoringprogram. . . . . . . . . . . . . . . . . . . . . . . . . . . . . . . . 307
C31 Alkalinity field duplicates for the 2011/2012 Lake WhatcomMonitoring Project (lake samples). . . . . . . . . . . . . . . . . . 309
C32 Alkalinity field duplicates for the 2011/2012 Lake WhatcomMonitoring Project (creek samples). . . . . . . . . . . . . . . . . 310
C33 Chlorophyll field duplicates for the 2011/2012 Lake WhatcomMonitoring Project (lake samples). . . . . . . . . . . . . . . . . . 311
C34 Conductivity field duplicates for the 2011/2012 Lake WhatcomMonitoring Project (lake samples). . . . . . . . . . . . . . . . . . 312
C35 Dissolved oxygen field duplicates for the 2011/2012 LakeWhat-com Monitoring Project (lake samples). . . . . . . . . . . . . . . 313
C36 Dissolved oxygen field duplicates for the 2011/2012 LakeWhat-com Monitoring Project (creek samples). . . . . . . . . . . . . . . 314
C37 Ammonium field duplicates for the 2011/2012 Lake WhatcomMonitoring Project (lake samples). . . . . . . . . . . . . . . . . . 315
C38 Ammonium field duplicates for the 2011/2012 Lake WhatcomMonitoring Project (creek samples). . . . . . . . . . . . . . . . . 316
C39 Nitrate/nitrite field duplicates for the 2011/2012 LakeWhatcomMonitoring Project (lake samples). . . . . . . . . . . . . . . . . . 317
C40 Nitrate/nitrite field duplicates for the 2011/2012 LakeWhatcomMonitoring Project (creek samples). . . . . . . . . . . . . . . . . 318
C41 Total nitrogen field duplicates for the 2011/2012 Lake WhatcomMonitoring Project (lake samples). . . . . . . . . . . . . . . . . . 319
C42 Total nitrogen field duplicates for the 2011/2012 Lake WhatcomMonitoring Project (creek samples). . . . . . . . . . . . . . . . . 320
xv

C43 Field duplicates for pH from the 2011/2012 Lake Whatcom Mon-itoring Project (lake samples). . . . . . . . . . . . . . . . . . . . 321
C44 Soluble phosphorus field duplicates for the 2011/2012 LakeWhatcom Monitoring Project (creek samples). . . . . . . . . . . . 322
C45 Total phosphorus field duplicates for the 2011/2012 LakeWhat-com Monitoring Project (lake samples). . . . . . . . . . . . . . . 323
C46 Total phosphorus field duplicates for the 2011/2012 LakeWhat-com Monitoring Project (creek samples). . . . . . . . . . . . . . . 324
C47 Total suspended solids field duplicates for the 2011/2012 LakeWhatcom Monitoring Project (creek samples). . . . . . . . . . . . 325
C48 Turbidity field duplicates for the 2011/2012 Lake Whatcom Mon-itoring Project (lake samples). . . . . . . . . . . . . . . . . . . . 326
C49 Turbidity field duplicates for the 2011/2012 Lake Whatcom Mon-itoring Project (creek samples). . . . . . . . . . . . . . . . . . . . 327
xvi

List of Tables
1 Summary of IWS, AmTest, Edge Analytical, and City of Belling-ham analytical methods and parameter abbreviations. . . . . .. . 16
2 Summary of Site 1 water quality data, Oct. 2011 – Sept. 2012.. . 17
3 Summary of Intake water quality data, Oct. 2011– Sept. 2012. . . 18
4 Summary of Site 2 water quality data, Oct. 2011 – Sept. 2012.. . 19
5 Summary of Site 3 water quality data, Oct. 2011 – Sept. 2012.. . 20
6 Summary of Site 4 water quality data, Oct. 2011 – Sept. 2012.. . 21
7 October hypolimnetic ammonium and hydrogen sulfide concen-trations at Sites 1 and 2 . . . . . . . . . . . . . . . . . . . . . . . 22
8 Lake Whatcom 2011/2012 total metals data . . . . . . . . . . . . 23
9 Lake Whatcom 2011/2012 total organic carbon data. . . . . . . .24
10 Comparison of water quality features in Lake Whatcom tributaries. 41
11 Summary of Anderson Creek water quality data, Oct. 2011–Sept. 2012. . . . . . . . . . . . . . . . . . . . . . . . . . . . . . 42
12 Summary of Austin Creek water quality data, Oct. 2011–Sept. 2012. 43
13 Summary of Blue Canyon Creek water quality data, Oct. 2011–Sept. 2012. . . . . . . . . . . . . . . . . . . . . . . . . . . . . . 44
14 Summary of Brannian Creek water quality data, Oct. 2011–Sept. 2012. . . . . . . . . . . . . . . . . . . . . . . . . . . . . . 45
15 Summary of Carpenter Creek water quality data, Oct. 2011–Sept. 2012. . . . . . . . . . . . . . . . . . . . . . . . . . . . . . 46
16 Summary of Euclid Creek water quality data, Oct. 2011–Sept. 2012. 47
17 Summary of Millwheel Creek water quality data, Oct. 2011–Sept. 2012. . . . . . . . . . . . . . . . . . . . . . . . . . . . . . 48
18 Summary of Olsen Creek water quality data, Oct. 2011–Sept. 2012. 49
xvii

19 Summary of Park Place drain water quality data, Oct. 2011–Sept. 2012. . . . . . . . . . . . . . . . . . . . . . . . . . . . . . 50
20 Summary of Silver Beach Creek water quality data, Oct. 2011–Sept. 2012. . . . . . . . . . . . . . . . . . . . . . . . . . . . . . 51
21 Summary of Smith Creek water quality data, Oct. 2011–Sept. 2012. 52
22 Summary of Whatcom Creek water quality data, Oct. 2011–Sept. 2012. . . . . . . . . . . . . . . . . . . . . . . . . . . . . . 53
23 Lake Whatcom tributary data: total metals. . . . . . . . . . . . .. 54
24 Lake Whatcom tributary data: total organic carbon. . . . . .. . . 55
25 Annual water balance quantities for the Lake Whatcom water-shed, WY2008–WY2012. . . . . . . . . . . . . . . . . . . . . . . 59
26 Monthly input water balance quantities for the Lake Whatcom wa-tershed, October 2011–September 2012. . . . . . . . . . . . . . . 60
27 Monthly output water balance quantities for the Lake Whatcomwatershed, October 2011–September 2012. . . . . . . . . . . . . 61
28 Summary of Silver Beach Creek storm events and precipitation atthe Bloedel/Donovan precipitation gauge. . . . . . . . . . . . . . 72
A1 Approximate GPS coordinates for Lake Whatcom sampling sites. 96
C1 Single-blind quality control results, WP–183 (06/06/2012). . . . . 276
xviii

Executive Summary
• This report describes the results from the 2011/2012 Lake Whatcom moni-toring program. The major objectives were to continue long-term baselinewater quality monitoring in Lake Whatcom and selected tributary streams;collect storm runoff water quality data from Silver Beach Creek; continuecollection of hydrologic data from Austin and Smith Creeks;and update thehydrologic model for Lake Whatcom.
• This report is part of an on-going series of annual reports and special projectreports that provide a complete documentation of the monitoring programover time. A summary of the IWS Lake Whatcom reports, including specialproject reports, is included in Section 6.2, beginning on page 89.
• During the summer the lake stratified into a warm surface layer (the epil-imnion) and a cool bottom layer (the hypolimnion). The watertempera-tures were near historic median values during most of the year except inJune 2012, which was slightly cooler than usual. Despite slightly coolertemperatures, all sites except the Intake were stratified byearly June.
• The levels of hypolimnetic oxygen have declined over time atSite 1, causingthe lake to be listed by the Department of Ecology on the 1998 303d list ofimpaired waterbodies in the State of Washington. Followingthe onset ofstratification, the hypolimnetic oxygen concentrations dropped rapidly. ByAugust 8, 2012, the oxygen concentration was<1 mg/L from 12 meters tothe bottom.
• Nitrate depletion was evident at all sites in the photosynthetic zone duringthe summer due to algal uptake of this essential nutrient. Low nitrate in thephotosynthetic zone favors the growth of Cyanobacteria. Nitrate depletionalso occurred in the hypolimnion at Sites 1 and 2 due to nitrate reduction bybacteria.
• Anaerobic conditions in the hypolimnion at Sites 1 and 2 resulted in ele-vated concentrations of ammonium by the end of the summer. The concen-trations were lower than usual in October 2011, following a cool summer,but were typical for the lake in October 2012.
xix
• The summer near-surface total phosphorus and chlorophyll concentrationshave increased significantly over time at most sites. The patterns continueto be somewhat variable, but it appears that the trends may have reached aplateau.
• The concentrations of trihalomethanes in Bellingham’s treated drinking wa-ter have been increasing over time, particularly during thelate summer/fall(third quarter). The total THMS and HAAS remained below the recom-mended maximum contaminant levels of 0.080 mg/L and 0.060 mg/L, re-spectively.
• All of the mid-basin fecal coliforms counts were less than 10cfu/100 mL.The coliform counts at the Bloedel-Donovan recreational area (collectedoffshore from the swimming area) were slightly higher than mid-basincounts, but passed the freshwaterExtraordinary Primary Contact Recre-ational bacteria standard for Washington State.
• Iron and zinc were often detectable, but were within normal ranges for thelake. Other metals were occasionally detected, but the concentrations werenear the limits of detection.
• Beginning in January 2010, 11 lake tributaries and Whatcom Creek weresampled monthly to collect baseline data. Most of the tributaries had rel-atively low concentrations of total and dissolved solids, low alkalinitiesand conductivities, and low levels of nitrate and ammonium.Residentialstreams had higher concentrations of total and dissolved solids, higher al-kalinities and conductivities, higher coliform counts, and higher nutrientconcentrations.
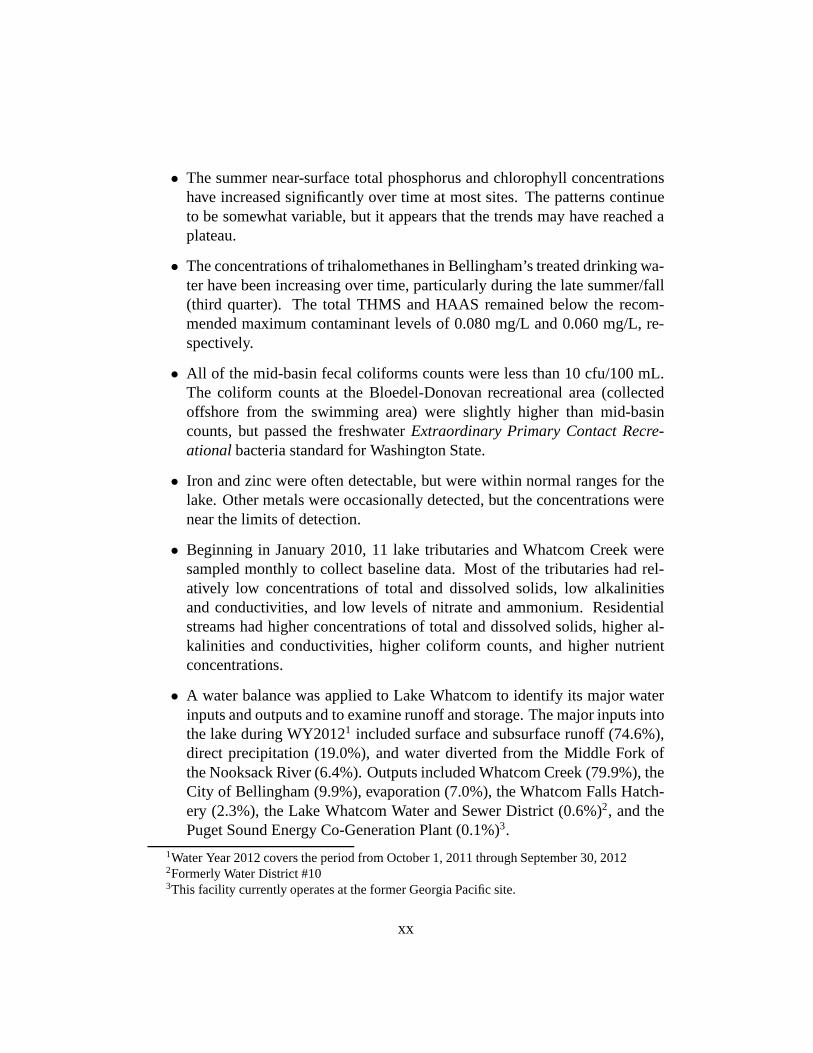
• A water balance was applied to Lake Whatcom to identify its major waterinputs and outputs and to examine runoff and storage. The major inputs intothe lake during WY20121 included surface and subsurface runoff (74.6%),direct precipitation (19.0%), and water diverted from the Middle Fork ofthe Nooksack River (6.4%). Outputs included Whatcom Creek (79.9%), theCity of Bellingham (9.9%), evaporation (7.0%), the WhatcomFalls Hatch-ery (2.3%), the Lake Whatcom Water and Sewer District (0.6%)2, and thePuget Sound Energy Co-Generation Plant (0.1%)3.
1Water Year 2012 covers the period from October 1, 2011 through September 30, 20122Formerly Water District #103This facility currently operates at the former Georgia Pacific site.
xx

• Eight storm events were monitored in Silver Beach Creek using an auto-mated sampler to collect flow-paced, discrete samples. The storm runoffcontained elevated levels of total suspended solids, turbidity, and phospho-rus that were significantly correlated with flow rates. In addition, total sus-pended solids, turbidity, and total phosphorus concentrations were highlycorrelated with each other.
xxi

(This page blank)
xxii

2011/2012 Lake Whatcom Report Page1
1 Introduction
This report is part of an on-going series of annual reports and special projectreports that document the Lake Whatcom monitoring program over time. Manyof the reports are available online at http://www.wwu.edu/iws. Older reports areavailable in the IWS library and through the City of Bellingham Public WorksDepartment. A summary of the Lake Whatcom reports, including special projectreports, is included in Section 6.2, beginning on page 89.
Lake Whatcom is the primary drinking water source for the City of Bellinghamand parts of Whatcom County, including Sudden Valley. Lake Whatcom alsoserves as a water source for the Puget Sound Energy Co-Generation Plant, whichis located at the former Georgia-Pacific Corporation site onBellingham Bay.4
The lake and parts of the watershed provide recreational opportunities, as wellas providing important habitats for fish and wildlife. The lake is used as a stor-age reservoir to buffer peak storm water flows in Whatcom Creek. Much of thewatershed is zoned for forestry and is managed by state or private timber compa-nies. Because of its aesthetic appeal, much of the watershedis highly valued forresidential development.
The City of Bellingham and Western Washington University have collaborated oninvestigations of the water quality in Lake Whatcom since the early 1960s. Begin-ning in 1981, a monitoring program was initiated by the City and WWU that wasdesigned to provide long-term data for Lake Whatcom for basic parameters suchas temperature, pH, dissolved oxygen, conductivity, turbidity, nutrients (nitrogenand phosphorus), and other representative water quality measurements. The majorgoal of the long-term monitoring effort is to provide a record of Lake Whatcom’swater quality over time.
The major objectives of the 2011/2012 Lake Whatcom monitoring program wereto continue long-term baseline water quality monitoring inLake Whatcom and se-lected tributary streams; collect storm runoff water quality data from Silver BeachCreek; continue collection of hydrologic data from Austin and Smith Creeks; andupdate the hydrologic model for Lake Whatcom.
4The Georgia-Pacific Corporation closed its Bellingham pulpmill operations in 2001, reducingits water requirements from 30–35 MGD to 7–12 MGD. By 2007 thewater requirements had beenreduced to 0.6–3.88 MGD; the mill closed its operations in December 2007.

2011/2012 Lake Whatcom Report Page2
Detailed site descriptions can be found in Appendix A. The historic lake dataare plotted in Appendix B. The current quality control results can be found inAppendix C. The monitoring data are available online at http://www.wwu.edu/iwsas described in Appendix D (page 329). Table 1 (page 16) listsabbreviations andunits used to describe water quality analyses in this document.
2 Lake Whatcom Monitoring
2.1 Site Descriptions
Water quality samples were collected at five long-term monitoring sites in LakeWhatcom (Figure A1, page 97 in Appendix A.1). Sites 1–2 are located at thedeepest points in their respective basins. The Intake site is located adjacent to theunderwater intake point where the City of Bellingham withdraws lake water frombasin 2. Site 3 is located at the deepest point in the northernsub-basin of basin3 (north of the Sunnyside sill), and Site 4 is located at the deepest point in thesouthern sub-basin of basin 3 (south of the Sunnyside sill).Water samples werealso collected at the City of Bellingham Water Treatment Plant gatehouse, whichis located onshore and west of the intake site.
2.2 Field Sampling and Analytical Methods
The lake was sampled on October 4 & 5, November 1 & 2 and December 6 & 7,2011; and February 7 & 9, April 10 & 12, May 8 & 10, June 12 & 14, July 10 &12, August 7 & 9, and September 4 & 6, 2012. Each sampling eventis a multi-daytask; all samples were collected during daylight hours, typically between 10:00 amand 3:00 pm.
A Hydrolab or a YSI field meter was used to measure temperature, pH, dissolvedoxygen, and conductivity.5 Raw water samples were collected using a VanDornsampler. All water samples (including bacteriological samples) collected in the
5The Hydrolab Surveyor 4 field meter was used for field samplingin October 2011, but wasreplaced to resolve on-going issues with the conductivity and pH probes. Beginning in November2011, field measurements were collected using a YSI 6600 V2 field meter. No major differenceshave been observed between the results from the Hydrolab vs.the YSI field meters.

2011/2012 Lake Whatcom Report Page3
field were stored on ice and in the dark until they reached the laboratory, and wereanalyzed as described in Table 1 (page 16). Total metals analyses (arsenic, cad-mium, chromium, copper, iron, mercury, nickel, lead, and zinc) and total organiccarbon analyses were done by AmTest.6 Plankton samples were placed in a coolerand returned to the laboratory unpreserved. The plankton sample volumes weremeasured in the laboratory and the samples were preserved with Lugol’s solution.The bacteria samples were analyzed by the City of Bellingham.
2.3 Results and Discussion
The lake monitoring data include monthly field measurements(conductivity, dis-solved oxygen, pH, Secchi depth, and water temperature); laboratory analyses forambient water quality parameters (ammonium7, nitrate/nitrite, total nitrogen, sol-uble phosphate, total phosphorus, alkalinity, turbidity,chlorophyll); plankton andbacteria counts; and biannual metals and total organic carbon measurements.
Tables 2–6 (pages 17–21) summarize the current field measurements, ambi-ent water quality, and coliform data. The raw data are available online athttp://www.wwu.edu/iws as described in Appendix D (page 329). The monthlyprofiles for temperature, dissolved oxygen, conductivity,and pH are plotted inFigures B1–B50 (pages 103–152).
The 2011/2012 lake data are plotted with historic lake data in Figures B51–B130(pages 154–234). These figures are scaled to plot the full range of Lake Whatcomwater quality data including minimum, maximum, and outliervalues, and do notprovide the best illustration of trends that occur in the lake. Separate tables andfigures are provided to show trends and illustrate specific patterns in the data.
6AmTest, 13600 Northeast 126th Place, Suite C, Kirkland, WA,98034–8720.7Ammonium (NH+4 ) is ionized ammonia (NH3). Nearly all ammonia is ionized in surface
water. Earlier IWS reports used the term ammonia and ammonium interchangeably to describeammonium concentrations because it is generally understood that ammonia is usually ionized. Toimprove clarity, IWS has switched to the term “ammonium” to indicate that we are reporting theconcentration of ionized ammonia. This does not represent any change in analytical methods.
2011/2012 Lake Whatcom Report Page4
2.3.1 Water temperature
The mid-winter temperature profiles (e.g., Figures B16–B20, pages 118–122) andthe multi-year temperature profiles (Figures B51–B55, pages 154–158) show thatthe water column mixes during the fall, winter, and early spring. During this time,water temperatures, dissolved oxygen concentrations, pH levels, and conductivi-ties are fairly uniform from the surface to the bottom of the lake, even at Site 4,which is over 300 ft (100 m) deep.
The summer temperature profiles (e.g., Figures B46–B50, pages 148–152) showhow the lake stratifies into a warm surface layer (epilimnion), and cool bottomlayer (hypolimnion). The transition zone between the epilimnion and hypolimnion(themetalimnion), is a region of rapidly changing water temperature. When strat-ified, the profiles show distinct differences between surface and bottom tempera-tures.
Stratification develops gradually, and once stable, persists until fall or winter, de-pending on location in the lake. Seasonal weather differences alter the timing oflake stratification; if the spring is cool, cloudy, and windy, the lake may stratifylater than when it has been hot and sunny.
In Lake Whatcom, all sites except the Intake are usually stratified by late springor early summer. (The Intake is too shallow to develop a stable stratification.)Stratification may begin as early as April, but is often not stable until May or June.The stability of stratification is determined in part by the temperature differencesin the water column, but also by water circulation and local weather patterns. Oncethe water column temperature differs by at least 5◦ C (∆T ≥5◦C), it is unlikelythat the lake will destratify.8
The lake cools as the weather becomes colder and days shorten. As the lake cools,the surface and bottom water temperatures become more similar, and eventuallythe lake will destratify and the water column will mix from the surface to thebottom. Although destratification is relatively abrupt, the process is not instan-taneous. In addition, when the lake begins to destratify, water temperatures maybe uniform from the surface to the bottom, but the rate of water circulation maynot be sufficient to replenish hypolimnetic oxygen concentrations (see Novem-ber 2006 temperature and oxygen profiles from Sites 1–2: Figures B6 and B7 inMatthews, et al., 2008). Basins 1 and 2 (Sites 1–2) usually destratify by the end
8The∆T is the difference between the epilimnion and hypolimnion temperatures.
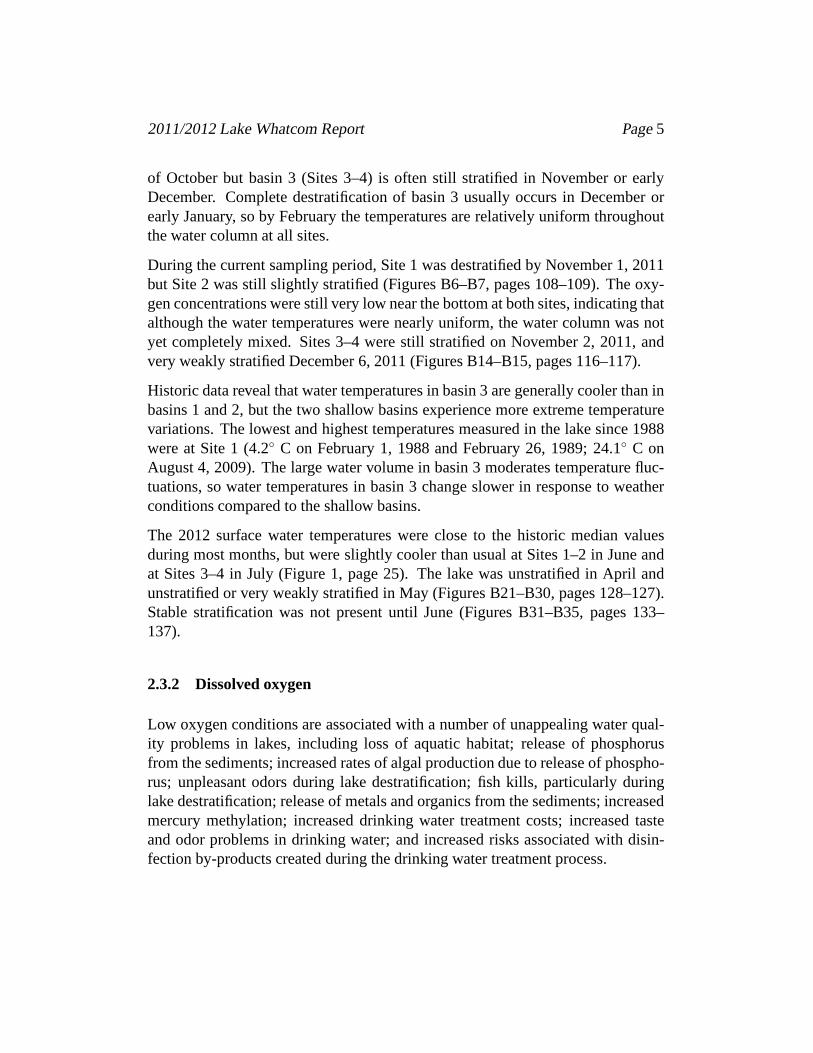
2011/2012 Lake Whatcom Report Page5
of October but basin 3 (Sites 3–4) is often still stratified inNovember or earlyDecember. Complete destratification of basin 3 usually occurs in December orearly January, so by February the temperatures are relatively uniform throughoutthe water column at all sites.
During the current sampling period, Site 1 was destratified by November 1, 2011but Site 2 was still slightly stratified (Figures B6–B7, pages 108–109). The oxy-gen concentrations were still very low near the bottom at both sites, indicating thatalthough the water temperatures were nearly uniform, the water column was notyet completely mixed. Sites 3–4 were still stratified on November 2, 2011, andvery weakly stratified December 6, 2011 (Figures B14–B15, pages 116–117).
Historic data reveal that water temperatures in basin 3 are generally cooler than inbasins 1 and 2, but the two shallow basins experience more extreme temperaturevariations. The lowest and highest temperatures measured in the lake since 1988were at Site 1 (4.2◦ C on February 1, 1988 and February 26, 1989; 24.1◦ C onAugust 4, 2009). The large water volume in basin 3 moderates temperature fluc-tuations, so water temperatures in basin 3 change slower in response to weatherconditions compared to the shallow basins.
The 2012 surface water temperatures were close to the historic median valuesduring most months, but were slightly cooler than usual at Sites 1–2 in June andat Sites 3–4 in July (Figure 1, page 25). The lake was unstratified in April andunstratified or very weakly stratified in May (Figures B21–B30, pages 128–127).Stable stratification was not present until June (Figures B31–B35, pages 133–137).
2.3.2 Dissolved oxygen
Low oxygen conditions are associated with a number of unappealing water qual-ity problems in lakes, including loss of aquatic habitat; release of phosphorusfrom the sediments; increased rates of algal production dueto release of phospho-rus; unpleasant odors during lake destratification; fish kills, particularly duringlake destratification; release of metals and organics from the sediments; increasedmercury methylation; increased drinking water treatment costs; increased tasteand odor problems in drinking water; and increased risks associated with disin-fection by-products created during the drinking water treatment process.

2011/2012 Lake Whatcom Report Page6
As in previous years, Sites 1 and 2 developed severe hypolimnetic oxygen deficitsby mid-summer (Figures B41–B42 and B56–B57, pages 143–144 and 159–160).Hypolimnetic oxygen depletion only becomes apparent afterstratification, whenthe lower waters of the basin are isolated from the lake’s surface and biologi-cal respiration consumes the oxygen dissolved in the water.Biological respirationusually increases when there is an abundant supply of organic matter (e.g., decom-posing algae). In basin 3, which has a very large, well-oxygenated hypolimnion,biological respiration has little influence on hypolimnetic oxygen concentrations(Figures B50 and B60, pages 152 and 163). In contrast, there is rapid depletionof the hypolimnetic oxygen concentrations at Sites 1–2 (Figures B46–B47, andB56–B57, pages 148–149 and 159–160). These two sites are in shallow basinsthat have small hypolimnions compared to their photic zones, so decompositionof algae and other organic matter causes a measurable drop inhypolimnetic oxy-gen over the summer.9
The levels of hypolimnetic oxygen have declined over time atSite 1, causing thelake to be listed by the Department of Ecology as an “impaired” waterbody (Pel-letier, 1998).10 The increasing rate of oxygen loss is most apparent during Julyand August, after the lake develops a stable thermal stratification but before oxy-gen levels drops near zero. To illustrate this trend we fittedthe July and Augustdata using an exponential function (see discussion by Matthews, et al., 2004). Asindicated in Figures 2–5 (pages 26–29), there were significant negative correla-tions between dissolved oxygen and time for all hypolimnetic samples collectedduring July and August.11 Despite slightly cooler temperatures in June, the rateof hypolimnetic oxygen depletion was very rapid. By August 8, 2012, the oxygenconcentration was<1 mg/L from 12 meters to the bottom.
A region of supersaturated oxygen was evident in the metalimnion at Site 1 in Julyand August (Figures B36 and B41, pages 138 and 144). This was caused by theaccumulation of phytoplankton along the density gradient between the epilimnionand hypolimnion where light and nutrients are sufficient to support very high lev-
9The photic zone is the portion of the lake with enough light tosupport algal photosynthesis.In Lake Whatcom, peak chlorophyll levels are usually at 5–10meters, so photic zone volumes willbe defined as the percent volume≤10 meters. Using this definition, the photic zones for basins1,2, and 3 occupy 75%, 70%, and 17%, respectively (Mitchell, etal., 2010).
10http://www.ecy.wa.gov/programs/wq/303d.11Correlation analyses examine the relationships between two variables. The test statistic ranges
from –1 to +1; the closer to±1, the stronger the correlation. The significance is measured usingthe p-value; significant correlations have p-values<0.05.

2011/2012 Lake Whatcom Report Page7
els of photosynthesis. Chlorophyll concentrations withinthe metalimnetic oxygenpeak may be 4–5 times higher than those measured near the surface of the lake(Matthews and DeLuna, 2008).
Site 3 developed an oxygen sag near the bottom during late summer and fall (Fig-ures B4–B14, pages 106–116). Sites 3 and 4 developed small oxygen sags nearthe thermocline (e.g., Figures B4 and B5, pages 106 and 107),which are causedby respiration of heterotrophic bacteria that accumulate along the density gradientbetween the epilimnion and hypolimnion (Matthews and DeLuna, 2008).
2.3.3 Conductivity and pH
The pH and conductivity data followed trends that were typical for Lake What-com (Figures B61–B70, pages 164–173). Surface pH values increased during thesummer due to photosynthetic activity. Hypolimnetic pH values decreased andconductivities increased due to decomposition and the release of dissolved com-pounds from the sediments.
There was a significant long-term trend in the conductivity data. This trend hasbeen attributed to using increasingly sensitive equipmentduring the past twodecades and does not indicate any actual change in the conductivity in the lake(Matthews, et al., 2004). As mentioned in the field sampling description (page 2),the conductivity probe on the Hydrolab Surveyor 4 field meterfailed repeatedly,so the conductivity samples collected in October 2011 were measured in the lab-oratory from water samples collected at 5 meter intervals (Figures B1–B5, pages103–107). Beginning in November, the new YSI field meter was used to measureconductivity profiles at each site (Figures B6–B50, pages 108–152).
2.3.4 Alkalinity and turbidity
Because Lake Whatcom is a soft water lake, the alkalinity values were fairly lowat most sites and depths (Figures B71–B75, pages 175–179). During the summerthe alkalinity values at the bottom of Sites 1–2, and occasionally Site 3, increaseddue to decomposition and the release of dissolved compoundsin the lower waters.
Turbidity values in the lake were usually low (1–3 NTU) except during late sum-mer in samples from the bottom of the lake. The high turbiditylevels during this

2011/2012 Lake Whatcom Report Page8
time are an indication of increasing turbulence in the lowerhypolimnion as thelake begins to destratify. The highest turbidity peaks weremeasured at Sites 1–2(Figures B76–B80, pages 180–184).
Suspended sediments from storm events can also cause elevated turbidity levelsin the lake. Major storm events usually occur during winter or early spring whenthe lake is destratified, so the turbidity levels will be highthroughout the watercolumn. Storm-related turbidity peaks are easier to see in samples from the Intakeand basin 3 because there are fewer distracting late summer hypolimnetic turbiditypeaks (see February 2009 storm-related turbidity peaks in Figures B78 and B79–B80).
Figures B81–B105 (pages 185–209) show the nitrogen and phosphorus data forLake Whatcom. Nitrogen and phosphorus are important nutrients that influencethe amount and type of microbiota (e.g., algae) that grow in the lake. We mea-sured inorganic forms of nitrogen and phosphorus (nitrite,nitrate, ammonium, andsoluble phosphate) as well as total nitrogen and total phosphorus, which includesinorganic and organic compounds.12
2.3.5 Nitrogen and phosphorus
Nitrogen: Most algae require inorganic nitrogen in the form of nitrateor am-monium for growth, but some types of algae can use organic nitrogen or evendissolved nitrogen gas.13 Nitrate depletion was evident at all sites in the photo-synthetic zone during the summer (Figures B86–B90, pages 190–194), particu-larly at Site 1, where the epilimnetic nitrate concentrations often drop below 20µg-N/L by the end of the summer. Epilimnetic nitrogen depletion is an indirectmeasure of phytoplankton productivity, and because algal densities have been in-creasing throughout the lake, epilimnetic dissolved inorganic nitrogen concentra-tions (DIN)14 have been declining over time (Figure 6, page 30). Low epilimneticDIN concentrations favor the growth of Cyanobacteria because many types ofCyanobacteria can use dissolved N2 gas as a nitrogen source.
12Organic nitrogen and phosphorus comes from living or decomposing plants and animals, andmay include bacteria, algae, leaf fragments, and other organic particles.
13Only Cyanobacteria and a few uncommon species of diatoms canuse nitrogen gas.14Dissolved inorganic nitrogen includes ammonium, nitrate,and nitrite. Under most conditions,
epilimnetic concentrations of ammonium and nitrite are very low, so epilimnetic DIN is nearlyequivalent to nitrate.

2011/2012 Lake Whatcom Report Page9
Hypolimnetic nitrate concentrations dropped below 20µg-N/L at Sites 1 and 2. Inanaerobic environments, bacteria reduce nitrate (NO−
3 ) to nitrite (NO−2 ) and nitro-
gen gas (N2). The historic data indicate that nitrate reduction has been common inthe hypolimnion at Site 1, but was not common at Site 2 until the summer of 1999.At Site 2 the hypolimnetic nitrate concentrations dropped below 20µg-N/L from1999–2006 and 2008–2012, but not in 2007. Matthews, et al. (2008) hypothesizedthat the higher levels in 2007 were the result of late stratification, which shortenedthe period of anoxia in the hypolimnion and resulted in less nitrate reduction. Theonset of stratification is only one factor involved in hypolimnetic nitrate deple-tion; the duration of stratification is also important. In 2007, not only did the lakestratify late, Site 2 was nearly destratified by early October and completely mixedby November. The entire period of anoxia was short compared to most years.
Ammonium, along with hydrogen sulfide, is often an indicatorof hypolimneticanoxia.15 Ammonium is readily taken up by plants as a growth nutrient. In oxy-genated environments, ammonium is rarely present in high concentrations becauseit is rapidly converted to nitrite and nitrate through biological and chemical pro-cesses. In low oxygen environments, ammonium accumulates until the lake de-stratifies. High levels of ammonium (and hydrogen sulfide - see below) are oftendetected in the hypolimnion at Sites 1 and 2 just before destratification (Table 7,page 22; Figures B81 & B82, pages 185 & 186). Elevated hypolimnetic ammo-nium concentrations have been common at both sites throughout the monitoringperiod, but beginning in 1999 the concentrations increasednoticeably at Site 2(Figure B82, page 186).
The hypolimnetic ammonium concentrations in October 2011 were relatively lowcompared to previous years, which might be related to the cooler water temper-atures during the summer of 2011 (Matthews, et al., 2012). Asdiscussed above,Site 2 was still weakly stratified when sampled in November 2011 (∆T = 2.6◦C),and had an ammonium concentration of 456µg-N/L at 20 meters. Site 1 wasnot stratified in November 2011 (∆T = 0.8◦C), and the ammonium concentrationswere low and nearly uniform throughout the water column (21–33µg-N/L). Thehypolimnetic ammonium concentrations in October 2012 weretypical for the lake(275 and 267µg-N/l at Sites 1 and 2, respectively; Table 7).
15Ammonium is produced during decomposition of organic matter; hydrogen sulfide is pro-duced by bacteria that use sulfate (SO−
4 ) instead of oxygen, creating sulfide (S2−) that reacts withhydrogen ions to form hydrogen sulfide (H2S).

2011/2012 Lake Whatcom Report Page10
Sites 3 and 4 often have slightly elevated ammonium concentrations at 20 m (met-alimnion) or near the bottom at 80–90 m (Figures B84–B85, pages 188–189).This is caused by bacterial decomposition of organic matter, but the concentra-tions never approach the levels found in the hypolimnion at Sites 1–2.
Site 2 hypolimnetic ammonium and hydrogen sulfide: The hypolimnion atSite 2 usually has higher concentrations of ammonium and hydrogen sulfide thanSite 1 (Table 7, page 22). Although the oxygen concentrations drop to near zeroat both sites, basin 2 is slightly shallower than basin 1 (Mitchell, et al., 2010),so a sample from 20 meters is slightly closer to the bottom at Site 2 than Site 1.As a result, the 20 m samples from Site 2 typically contain more of the solublecompounds leaching from the sediments (e.g., ammonium and hydrogen sulfide).
Hydrogen sulfide concentrations are measured in October, which is the latestmonth that isconsistently stratified at Sites 1–2. When the lake stratifies late or isunusually cool, the October ammonium and hydrogen sulfide levels will not be ashigh as in warmer years. The 2012 hydrogen sulfide concentrations were reportedas being below the analytical detection limit. This is unlikely, given historic H2concentrations and the strong “rotten egg” smell in both thesamples, which in-dicates hydrogen sulfide. The presence of a rotten egg smell,however, is not aclear indication that the H2S levels were above detection. Humans can detectionH2S at concentrations well below the Edge Analytical H2 detection limit of 0.100mg/L. We have contacted Edge Analytical to request confirmation of the results,and have entered the data as “na” in Table 7 while the issue is being resolved.
Phosphorus: Although the Lake Whatcom microbiota require nitrogen, phos-phorus is usually what limits microbial growth (Bittner, 1993; Liang, 1994;Matthews, et al., 2002a; McDonald, 1994). The total phosphorus concentrationin the water column is a complex mixture of soluble and insoluble phosphoruscompounds, only some of which can be used by algae to sustain growth. Solu-ble forms of phosphorus (e.g., orthophosphate) are easily taken up by algae andother microbiota, and, as a result, are rarely found in high concentrations in thewater column. Insoluble phosphorus can be present in the water column boundto the surface of tiny particles or as suspended organic matter (e.g., live or deadalgae). Because competition for phosphorus is so intense, microbiota have de-veloped many mechanisms for obtaining phosphorus from the surface of particlesor from decomposing organic matter. Liang (1994) and Groce (2011) found that

2011/2012 Lake Whatcom Report Page11
∼50% of the total persulfate phosphorus in soils in the Lake Whatcom watershedwas “bioavailable” and could be extracted by algae.
When hypolimnetic oxygen concentrations are low, sediment-bound phosphorusbecomes soluble and leaches into the overlying water. Priorto destratification,hypolimnetic phosphorus may be taken up by microbiota in thehypolimnion ormetalimnion (see Section 2.3.2 and Matthews and DeLuna, 2008). When thelake mixes in the fall, the hypolimnetic phosphorus will be mixed throughout thewater column. As oxygen concentrations increase during mixing, any solublephosphorus that has not been taken up by biota will usually beconverted backinto insoluble phosphorus. Because phosphorus moves back and forth betweensoluble and insoluble forms and between organic and inorganic compounds, itcan be difficult to interpret total phosphorus trends. For example, when algaldensities increase, their growth usually results in the reduction of soluble andbioavailable fractions of phosphorus in the epilimnion, similar to the epilimneticDIN reduction that was described for nitrogen. But, since this uptake simplymoves the phosphorus into the “live-algae” fraction of organic phosphorus, totalphosphorus concentrations may actually increase in the epilimnion.
In Lake Whatcom, total phosphorus and soluble phosphate concentrations wereusually low except in the hypolimnion at Sites 1 and 2 just prior to destrati-fication (Figures B96–B100, pages 200–204 and B101–B105, pages 205–209).Epilimnetic total phosphorus concentrations are usually lower than late-summerhypolimnetic peaks. Prior to 2000, the median epilimnetic phosphorus concentra-tions were<5µg-P/L at Sites 2–4 and approximately 5–8µg-P/L at Site 1 (Figure7, page 31). The epilimnetic phosphorus levels have increased significantly at allsites (Figure 7, page 31); however, the pattern is quite erratic, reflecting the com-plicated nature of phosphorus movement in the water column.It is important tonote that low water column phosphorus concentrations do notalways predict lowalgal densities, and may instead indicate rapid and efficient cycling of phosphorusamong the lake biota.
2.3.6 Chlorophyll, plankton, and Secchi depth
Site 1 continued to have the highest chlorophyll concentrations of all the sites (Fig-ures B106–B110, pages 210–214). Peak chlorophyll concentrations were usuallycollected at 0–15 m, while samples from 20 m had relatively low chlorophyll con-centrations because light levels are not optimal for algal growth at this depth.

2011/2012 Lake Whatcom Report Page12
The Lake Whatcom plankton counts were usually dominated by Chrysophyta,consisting primarilyDinobryon, Mallomonas, and diatoms (Figures B121–B130,pages 225–234). Substantial blooms of bluegreen bacteria (Cyanobacteria) andgreen algae (Chlorophyta) were also measured at all sites during summer and latefall. Previous analyses of algal biomass in Lake Whatcom indicated that althoughChrysophyta dominate the numerical plankton counts, Cyanobacteria and Chloro-phyta often dominate the plankton biomass, particularly inlate summer and earlyfall (Ashurst, 2003; Matthews, et al., 2002b). In addition,most of the Cyanobac-teria in these samples are counted by colony rather than as individual cells becauseof the tiny cell size. When the Cyanobacteria density is estimated using settledalgae counts (Matthews, et al. 2012), the plankton counts are dominated by tinyCyanobacteria.
Secchi depths (Figures B111–B115, pages 215–219) showed noclear seasonalpattern because transparency in Lake Whatcom is affected byparticulates fromstorm events and the Nooksack River diversion as well as algal blooms.
Indications of eutrophication: Eutrophication is the term used to describe alake that is becoming more biologically productive. It can apply to an unpro-ductive lake that is becoming slightly more eutrophic, or a productive lake thatis becoming extremely eutrophic (see Wetzel, 2001, for moreabout eutrophica-tion and Matthews, et al., 2005, for a description of the chemical and biologicalindicators of eutrophication in Lake Whatcom).
The median near-surface summer chlorophyll concentrations were slightly lowerin 2012 compared to 2011 (Figure 8, page 32). The chlorophyllconcentrationsat all sites have increased significantly since 1994, with Site 1 showing the leastamount of change and Sites 3–4 showing the greatest change. Although the annualchlorophyll concentrations are quite variable, they seem to have stabilized since2004, ranging from 3.8–6.7µg/L at Site 1 and 2.9–4.6µg/L at Sites 2–4.
Chlorophyll is a direct measure of algal biomass and is best used to evaluatetrophic changes in the lake (e.g., is the lake becoming more biologically pro-ductive?). We used algal counts rather than chlorophyll to look for trends withinthe same type of algae (e.g., are the numbers of Cyanobacteria increasing?). Theactual relationship between chlorophyll concentration and the algae cell count iscomplex. The amount of chlorophyll in an algal cell is influenced by the phys-iological age and condition of the cell, light intensity, nutrient availability, and

2011/2012 Lake Whatcom Report Page13
many other factors. In addition, while most types of algae are counted by indi-vidual cells, a few types must be counted by colonies becausethe cells are toodifficult to see. Even if the amount of chlorophyll was constant in each cell, itwould take many tiny cells to equal the chlorophyll biomass in one large colony.
Except for the dinoflagellates16 the algae counts have also increased significantlysince 1994 (Figure 9, page 33). Similarly, there has been a steady increase in thenumbers of Cyanobacteria at all sites (Figure 10, page 34). As with the chloro-phyll concentrations, the algae and Cyanobacteria counts appear to have stabilizedaround 2004. The algae count variability looks to be much smaller in Figures 9–10, but that is because the cell counts are plotted using a log10 scale.
2.3.7 Coliform bacteria
The current surface water standards are based on “designated use” categories,which for Lake Whatcom is “Extraordinary Primary Contact Recreation.” Thestandard for bacteria is described in Chapter 173–201A–200of the WashingtonAdministrative Code, Water Quality Standards for Surface Waters of the State ofWashington:
Fecal coliform organism levels must not exceed a geometric meanvalue of 50 colonies/100 mL, with not more than 10 percent of allsamples (or any single sample when less than ten sample points ex-ist) obtained for calculating the geometric mean value exceeding 100colonies/100 mL.
All of the mid-basin (Sites 1–4) and Intake values for fecal coliforms were lessthan 10 cfu17/100 mL (Figures B116–B120, pages 220–224) and passed the fresh-waterExtraordinary Primary Contact Recreation bacteria standard.
Coliform samples collected offshore from the Bloedel-Donovan swimming areahad slightly higher counts than at Site 1 (mid-basin). None of the Bloedel-Donovan counts exceeded 100 cfu/100 mL and the geometric mean was 5 cfu/100mL, so this site passed both parts of the freshwaterExtraordinary Primary Con-tact Recreation bacteria standard.
16Dinoflagellates are small single-cell algae that are commonin Lake Whatcom, but rarely havehigh densities in the plankton counts.
17Colony forming unit/100 mL; cfu/100 mL is sometimes labeled“colonies/100 mL.”

2011/2012 Lake Whatcom Report Page14
2.3.8 Metals
The metals data for Lake Whatcom are included in Table 8 (page23). This ta-ble includes only the metals listed in our monitoring contract (arsenic, cadmium,chromium, copper, iron, mercury, nickel, lead, and zinc); electronic data filesavailable from IWS contain concentrations for 24 additional metals that are in-cluded as part of the analytical procedure used by AmTest.
AmTest has upgraded their equipment, changed analytical procedures, and recal-culated detection limits several times since we began collecting metal data fromthe lake. Because many of the Lake Whatcom metals concentrations are extremelylow, changes in equipment or methods can cause the concentration to move fromdetectable to non-detectable, or vice versa. This type of change does not indicatean actual change in the metals concentration in the lake. Table 1 (page 16) showsthe historic and current AmTest detection limits for each metal.
The metals concentrations were within normal concentration ranges for the lake.Iron and zinc concentrations were usually in the detectablerange. The highest ironconcentration was measured in August at the bottom of Site 1.The elevated ironconcentration was the result of sediment-bound iron converting to soluble formsunder anaerobic conditions and leaching into the overlyingwater. Cadmium, cop-per, and mercury were detected in many of the samples, but at levels close todetection limits, which is typical for Lake Whatcom. Lead was often detected,but the current analytical method has a very low detection limit (0.00005 mg/L).All of the lead concentrations were lower than the historic detection level (<0.001mg/L, Table 1).
2.3.9 Total organic carbon and disinfection by-products
Total organic carbon concentrations, along with plankton and chlorophyll data,are used to help assess the likelihood of developing potentially harmful disinfec-tion by-products through the reaction of chlorine with organic compounds duringthe drinking water treatment process. Algae excrete dissolved organic carboninto water, which, along with other decaying organic material, can react withchlorine to form disinfection by-products, predominatelychloroform and othertrihalomethanes (THMs).

2011/2012 Lake Whatcom Report Page15
The 2011/2012 total organic carbon concentrations were lowat all sites (1.4–2.3mg/L; Table 9, page 24). The long-term data suggest that total organic carbon con-centrations have become more variable. The minimum concentrations measuredeach year have remained low, usually<1–2 mg/L, but the maximum concentra-tions have increased (Figure 11, page 35). The data are too variable to determinea specific cause for this pattern.
When algal densities or total organic carbon concentrations increase, we expectto see an increase in THMs. To minimize risk, the Environmental ProtectionAgency limits the levels of disinfection by-products allowed in treated drinkingwater through the Safe Drinking Water Act’s Disinfection Byproduct Rule. ThisRule was adopted in 1979 and has undergone two major revisions (Phase I in 1998;Phase II in 2005). The sampling requirement doubled under Phase II, and begin-ning with the fourth quarter of 2012 the data will be summarized differently.18.Figure 12 (page 36) includes data through the end of September 2012 (third quar-ter). The revised methods will be incorporated into the figures and discussion infuture monitoring reports.
The THMs have been increasing in Bellingham’s treated drinking water, particu-larly during the late summer/fall (third quarter; Figure 12, page 36). Haloaceticacids (another disinfection by-product) are not as closelylinked to algal concen-trations and chlorine dose (Sung, et al., 2000). The Jan-DecHAAs results weremarginally correlated with time (due to the large sample size), but the the thirdquarter data were not significantly correlated with time. The total THMS andHAAS remained below the recommended maximum contaminant levels of 0.080mg/L and 0.060 mg/L, respectively, described in Chapter 246–290–310 of Wash-ington Administrative Code, Water Quality Standards for Public Water Suppliesof the State of Washington.
18P. Wendling, pers. comm., City of Bellingham Public Works Dept., December 5, 2012

2011/2012 Lake Whatcom Report Page16
Historic 2011/2012 Sensitivity orAbbrev. Parameter Method DL† MDL† Confidence limitIWS field measurements:cond Conductivity Hydrolab (1997) or YSI (2010) – – ± 2 µS/cmdo Dissolved oxygen Hydrolab (1997) or YSI (2010) – – ± 0.1 mg/Lph pH Hydrolab (1997) or YSI (2010) – – ± 0.1 pH unittemp Temperature Hydrolab (1997) or YSI (2010) – – ± 0.1◦ C
disch Discharge Rantz et al. (1982); SOP-IWS-6 – – –secchi Secchi depth Lind (1985) – – ± 0.1 m
IWS laboratory analyses:alk Alkalinity APHA (2012) #2320; SOP-IWS-8 – – ± 0.4 mg/Lcond Conductivity APHA (2012) #2510; SOP-IWS-8 – – ± 1.4µS/cmdo Dissolved oxygen APHA (2012) #4500-O.C.; SOP-IWS-8 – – ± 0.1 mg/Lph pH-lab APHA (2012) #4500-H+; SOP-IWS-8 – – ± 0.03 pH unit
tss T. suspended solids APHA (2012) #2540 D; SOP-IWS-13 2 mg/L 0.9 mg/L ± 1.4 mg/Lturb Turbidity APHA (2012) #2130; SOP-IWS-8 – – ± 0.2 NTU
nh4 Ammonium (auto) APHA (2012) #4500-NH3 H; SOP-IWS-19 10µg-N/L 9.9µg-N/L ± 7.0µg-N/Lno3 Nitrite/nitrate (auto) APHA (2012) #4500-NO3 I; SOP-IWS-19 20µg-N/L 5.5µg-N/L ± 3.4µg-N/Ltn T. nitrogen (auto) APHA (2012) #4500-N03 I & PJ; SOP-IWS-19 100µg-N/L 21.8µg-N/L ± 34.3µg-N/Lsrp Sol. phosphate (auto) APHA (2012) #4500-P G; SOP-IWS-19 5 µg-P/L 1.1µg-P/L ± 1.7µg-P/Ltp T. phosphorus (auto) APHA (2012) #4500-P G & J; SOP-IWS-19 5 µg-P/L 4.8µg-P/L ± 3.8µg-P/L
IWS plankton analyses:chl Chlorophyll APHA (2012) #10200 H; SOP-LW-16 – – ± 0.1µg/Lchlo Chlorophyta Lind (1985), Schindler trap – – –cyan Cyanobacteria Lind (1985), Schindler trap – – –chry Chrysophyta Lind (1985), Schindler trap – – –pyrr Pyrrophyta Lind (1985), Schindler trap – – –
City coliform analyses:fc Fecal coliform APHA (2005) #9222 D 1 cfu/100 mL –
Edge Analytical analyses:H2S H2S APHA (2012) 4500-S2 — 0.100 mg/L –
AmTest analyses:‡
As T. arsenic EPA (1994) 200.7 0.01 mg/L 0.02 mg/L –Cd T. cadmium EPA (1994) 200.7 0.0005 mg/L 0.0015 mg/L –Cr T. chromium EPA (1994) 200.7 0.001 mg/L 0.0025 mg/L –Cu T. copper EPA (1994) 200.7 0.001 mg/L 0.005 mg/L –Fe T. iron EPA (1994) 200.7 0.05 mg/L 0.009 mg/L –Pb T. lead EPA (1994) 200.8 0.001 mg/L 0.00005 mg/L –Hg T. mercury EPA (1994) 245.1 0.0001 mg/L 0.00005 mg/L –Ni T. nickel EPA (1994) 200.7 0.005 mg/L 0.005 mg/L –Zn T. zinc EPA (1994) 200.7 0.001 mg/L 0.002 mg/L –TOC T. organic carbon APHA 531 0 B 1.0 mg/L 0.5 mg/L –† Historic detection limits (DL) are usually higher than current method detection limits (MDL).‡Changes reflect recalculation of detection limits or changein methods.
Table 1: Summary of IWS, AmTest, Edge Analytical, and City ofBellinghamanalytical methods and parameter abbreviations.

2011/2012 Lake Whatcom Report Page17
Variable Min. Med. Mean† Max.Alkalinity (mg/L CaCO3) 18.5 19.7 20.6 26.3Conductivity (µS/cm) 58.0 60.0 61.2 72.9Dissolved oxygen (mg/L) 0.0 9.8 8.5 12.7pH 6.0 7.3 7.1 8.4Temperature (◦C) 5.2 9.8 11.0 21.8Turbidity (NTU) 0.6 1.0 1.4 9.1
Nitrogen - ammonium (µg-N/L) <10 <10 22.3 180.9Nitrogen - nitrate/nitrite (µg-N/L) <20 219.0 194.0 343.0Nitrogen - total (µg-N/L) 216.3 393.4 364.9 504.1
Phosphorus - soluble (µg-P/L) <5 <5 <5 8.9Phosphorus - total (µg-P/L) <5 10.7 11.8 28.5
Chlorophyll (µg/L) 0.5 3.2 4.3 12.8Secchi depth (m) 2.8 5.0 4.7 6.4
Coliforms - fecal (cfu/100 mL)‡ <1 1 1 3†Uncensored arithmetic means except coliforms (geometric mean);‡Censored values replaced with closest integer (i.e.,<1⇒ 1).
Table 2: Summary of Site 1 water quality data, Oct. 2011 – Sept. 2012.

2011/2012 Lake Whatcom Report Page18
Variable Min. Med. Mean† Max.Alkalinity (mg/L CaCO3) 18.5 19.0 19.2 20.3Conductivity (µS/cm) 56.0 58.0 58.7 60.0Dissolved oxygen (mg/L) 8.9 10.7 10.7 12.5pH 7.1 7.6 7.6 8.1Temperature (◦C) 6.2 13.3 13.3 22.3Turbidity (NTU) 0.4 0.6 0.6 0.7
Nitrogen - ammonium (µg-N/L) <10 <10 <10 10.3Nitrogen - nitrate/nitrite (µg-N/L) 109.8 238.9 228.7 354.5Nitrogen - total (µg-N/L) 274.9 372.1 374.6 479.1
Phosphorus - soluble (µg-P/L) <5 <5 <5 <5Phosphorus - total (µg-P/L) <5 7.3 7.7 14.5
Chlorophyll (µg/L) 1.1 3.4 3.3 5.5Secchi depth (m) 4.0 5.5 5.7 8.0
Coliforms - fecal (cfu/100 mL)‡ <1 1 1 2†Uncensored arithmetic means except coliforms (geometric mean);‡Censored values replaced with closest integer (i.e.,<1⇒ 1).
Table 3: Summary of Intake water quality data, Oct. 2011– Sept. 2012.

2011/2012 Lake Whatcom Report Page19
Variable Min. Med. Mean† Max.Alkalinity (mg/L CaCO3) 18.4 18.9 19.4 27.5Conductivity (µS/cm) 58.0 58.0 59.4 83.0Dissolved oxygen (mg/L) 0.0 10.3 9.4 12.6pH 5.9 7.4 7.2 8.0Temperature (◦C) 5.9 10.8 11.7 20.9Turbidity (NTU) 0.3 0.6 0.9 5.7
Nitrogen - ammonium (µg-N/L) <10 <10 23.1 456.1Nitrogen - nitrate/nitrite (µg-N/L) <20 240.6 242.0 376.4Nitrogen - total (µg-N/L) 286.8 409.8 410.6 605.8
Phosphorus - soluble (µg-P/L) <5 <5 <5 <5Phosphorus - total (µg-P/L) <5 7.9 8.8 24.8
Chlorophyll (µg/L) 0.7 2.9 2.9 5.7Secchi depth (m) 3.9 5.5 6.0 9.5
Coliforms - fecal (cfu/100 mL)‡ <1 1 1 3†Uncensored arithmetic means except coliforms (geometric mean);‡Censored values replaced with closest integer (i.e.,<1⇒ 1).
Table 4: Summary of Site 2 water quality data, Oct. 2011 – Sept. 2012.

2011/2012 Lake Whatcom Report Page20
Variable Min. Med. Mean† Max.Alkalinity (mg/L CaCO3) 17.9 18.6 18.7 21.8Conductivity (µS/cm) 57.0 58.0 58.5 68.0Dissolved oxygen (mg/L) 0.6§ 10.3 10.3 12.8pH 6.5 7.1 7.2 8.0Temperature (◦C) 6.1 7.0 9.7 21.3Turbidity (NTU) 0.2 0.4 0.5 3.0
Nitrogen - ammonium (µg-N/L) <10 <10 <10 13.4Nitrogen - nitrate/nitrite (µg-N/L) 127.1 355.9 319.3 429.5Nitrogen - total (µg-N/L) 231.3 468.4 439.6 608.3
Phosphorus - soluble (µg-P/L) <5 <5 <5 7.0Phosphorus - total (µg-P/L) <5 5.5 6.4 25.5
Chlorophyll (µg/L) 0.8 2.9 2.8 5.4Secchi depth (m) 4.0 5.7 6.0 8.0
Coliforms - fecal (cfu/100 mL)‡ <1 1 1 2†Uncensored arithmetic means except coliforms (geometric mean);‡Censored values replaced with closest integer (i.e.,<1⇒ 1).§Atypical value - see discussion in text.
Table 5: Summary of Site 3 water quality data, Oct. 2011 – Sept. 2012.

2011/2012 Lake Whatcom Report Page21
Variable Min. Med. Mean† Max.Alkalinity (mg/L CaCO3) 17.6 18.5 18.6 20.1Conductivity (µS/cm) 57.0 58.0 58.4 60.5Dissolved oxygen (mg/L) 8.3 10.3 10.4 12.8pH 6.4 7.0 7.1 7.8Temperature (◦C) 6.1 6.7 9.4 20.3Turbidity (NTU) 0.2 0.4 0.4 0.7
Nitrogen - ammonium (µg-N/L) <10 <10 <10 18.8Nitrogen - nitrate/nitrite (µg-N/L) 138.5 374.4 338.4 415.3Nitrogen - total (µg-N/L) 294.8 474.8 452.7 535.1
Phosphorus - soluble (µg-P/L) <5 <5 <5 5.9Phosphorus - total (µg-P/L) <5 6.2 7.0 29.7
Chlorophyll (µg/L) 0.6 3.0 2.6 4.8Secchi depth (m) 4.2 6.7 6.5 8.3
Coliforms - fecal (cfu/100 mL)‡ <1 1 1 3†Uncensored arithmetic means except coliforms (geometric mean);‡Censored values replaced with closest integer (i.e.,<1⇒ 1).
Table 6: Summary of Site 4 water quality data, Oct. 2011 – Sept. 2012.

2011/2012 Lake Whatcom Report Page22
H2S (mg/L) NH3 (µg-N/L)Year Site 1 Site 2 Site 1 Site 21999† 0.03–0.04 0.40 268.3 424.4
2000† 0.27 0.53 208.8 339.5
2001† 0.42 0.76 168.7 331.9
2002† 0.09 0.32 203.9 383.8
2003† 0.05 0.05 333.8 340.0
2004† 0.25 0.25 300.3 378.3
2005‡ 0.13 0.25 257.5 450.40.12 0.42
2006 0.20 0.42 334.1 354.1
2007 0.40 0.20 324.5 79.3§
2008 0.28 0.38 294.5 404.9
2009 0.15 0.47 271.3 301.2
2010 0.38 0.40 331.3 511.3
2011 0.12 0.16 180.9 209.4
2012 na na 274.6 267.3†H2S samples analyzed by HACH test kit.‡HACH (first value) vs. Edge Analytical (second value)§Atypical result; see discussion by Matthews, et al. (2008)
Table 7: October hypolimnetic ammonium and hydrogen sulfideconcentrationsat Sites 1 and 2 (20 m). The H2S samples have been analyzed by Edge Analyticalsince 2005. Earlier samples were analyzed using a HACH field test kit.

2011/2012 Lake Whatcom Report Page23
Depth T. As T. Cd T. Cr T. Cu T. Fe T. Hg T. Ni T. Pb T. Zn(m) Date (mg/L) (mg/L) (mg/L) (mg/L) (mg/L) (mg/L) (mg/L) (mg/L) (mg/L)
Site 1 0 Feb 9, 2012 <0.01 0.0008 <0.001 <0.001 0.020 <0.0001 <0.005 <0.00005 0.0060Site 1 20 Feb 9, 2012 <0.01 0.0010 <0.001 0.002 0.019 <0.0001 <0.005 0.000250 0.0080Intake 0 Feb 9, 2012 <0.01 0.0011 <0.001 <0.001 0.011 <0.0001 <0.005 <0.00005 0.0060Intake 10 Feb 9, 2012 <0.01 0.0011 <0.001 <0.001 0.012 0.0001 <0.005 <0.00005 0.0080Site 2 0 Feb 9, 2012 <0.01 0.0009 <0.001 0.002 0.011 <0.0001 <0.005 <0.00005 0.0120Site 2 20 Feb 9, 2012 <0.01 0.0010 <0.001 <0.001 0.012 0.0002 <0.005 <0.00005 0.0070Site 3 0 Feb 7, 2012 <0.01 0.0008 <0.001 <0.001 0.012 <0.0001 <0.005 <0.00005 0.0060Site 3 80 Feb 7, 2012 <0.01 0.0007 <0.001 0.004 0.016 <0.0001 <0.005 <0.00005 0.0100Site 4 0 Feb 7, 2012 <0.01 0.0007 <0.001 0.001 0.013 <0.0001 <0.005 <0.00005 0.0070Site 4 90 Feb 7, 2012 <0.01 <0.0005 <0.001 0.001 0.014 0.0003 <0.005 <0.00005 0.0080
Site 1 0 Jul 12, 2012 <0.02 <0.0015 <0.0025 <0.005 0.016 0.00012 <0.005 0.000075 0.0037Site 1 20 Jul 12, 2012 <0.02 <0.0015 <0.0025 <0.005 0.085 <0.00005 <0.005 <0.00005 0.0028Intake 0 Jul 12, 2012 <0.02 <0.0015 <0.0025 <0.005 0.012 0.00020 <0.005 <0.00005 0.0043Intake 10 Jul 12, 2012 <0.02 <0.0015 <0.0025 <0.005 <0.009 <0.00005 <0.005 <0.00005 0.0033Site 2 0 Jul 12, 2012 <0.02 <0.0015 <0.0025 <0.005 <0.009 0.00030 <0.005 0.000156 0.0026Site 2 20 Jul 12, 2012 <0.02 <0.0015 <0.0025 <0.005 0.024 0.00060 <0.005 <0.00005 0.0058Site 3 0 Jul 10, 2012 <0.02 <0.0015 <0.0025 <0.005 <0.009 <0.00005 <0.005 0.000241 0.0056Site 3 80 Jul 10, 2012 <0.02 <0.0015 <0.0025 <0.005 0.015 <0.00005 <0.005 0.000094 0.0262Site 4 0 Jul 10, 2012 <0.02 <0.0015 <0.0025 <0.005 <0.009 <0.00005 <0.005 0.000092 0.0136Site 4 90 Jul 10, 2012 <0.02 <0.0015 <0.0025 <0.005 0.011 <0.00005 <0.005 <0.00005 0.0048
Table 8: Lake Whatcom 2011/2012 total metals data. Only the metals specified inthe monitoring plan are included in this table; the results for 24 additional metalsare available from IWS. AmTest recalculated analytical detection limits betweenFebruary and July 2012. The February data include original detection limits; Julydata include new detection limits (see Table 1 for summary ofAmTest methods).

2011/2012 Lake Whatcom Report Page24
TOC TOCSite Date Depth (mg/L) Date Depth (mg/L)Site 1 Feb 9, 2012 0 2.0 Jul 12, 2012 0 2.3
Feb 9, 2012 20 2.0 Jul 12, 2012 20 1.8
Intake Feb 9, 2012 0 1.9 Jul 12, 2012 0 2.2Feb 9, 2012 10 1.8 Jul 12, 2012 10 2.1
Site 2 Feb 9, 2012 0 1.6 Jul 12, 2012 0 2.2Feb 9, 2012 20 1.8 Jul 12, 2012 20 1.8
Site 3 Feb 7, 2012 0 1.9 Jul 10, 2012 0 2.0Feb 7, 2012 80 1.6 Jul 10, 2012 80 1.4
Site 4 Feb 7, 2012 0 1.8 Jul 10, 2012 0 2.2Feb 7, 2012 90 2.0 Jul 10, 2012 90 1.5
Table 9: Lake Whatcom 2011/2012 total organic carbon data.

2011/2012 Lake Whatcom Report Page25
F A M J J A S O N D
510
1520
25
Site 1
Tem
pera
ture
(C
)
F A M J J A S O N D5
1015
2025
Site 2
Tem
pera
ture
(C
)
F A M J J A S O N D
510
1520
25
Site 3
Tem
pera
ture
(C
)
F A M J J A S O N D
510
1520
25
Site 4
Tem
pera
ture
(C
)
Figure 1: Boxplots showing 1988–2011 surface water temperatures (depth<1m, all sites and years) with monthly 2012 data (•). Boxplots show medians andupper/lower quartiles; whiskers extend to maximum/minimum values.

2011/2012 Lake Whatcom Report Page26
02
46
8
Site 1 Dissolved Oxygen by Year at Depth 12
Dis
solv
ed O
xyge
n (m
g/L)
1988 1991 1994 1997 2000 2003 2006 2009 2012
July p−value <0.001August p−value <0.001
Figure 2: Relationship between dissolved oxygen and time atSite 1, 12 m.Kendall’s τ correlations were used because the data were not monotonic-linear;all correlations were significant.

2011/2012 Lake Whatcom Report Page27
02
46
8
Site 1 Dissolved Oxygen by Year at Depth 14
Dis
solv
ed O
xyge
n (m
g/L)
1988 1991 1994 1997 2000 2003 2006 2009 2012
July p−value <0.001August p−value <0.01
Figure 3: Relationship between dissolved oxygen and time atSite 1, 14 m.Kendall’s τ correlations were used because the data were not monotonic-linear;all correlations were significant.

2011/2012 Lake Whatcom Report Page28
02
46
8
Site 1 Dissolved Oxygen by Year at Depth 16
Dis
solv
ed O
xyge
n (m
g/L)
1988 1991 1994 1997 2000 2003 2006 2009 2012
July p−value <0.001August p−value <0.01
Figure 4: Relationship between dissolved oxygen and time atSite 1, 16 m.Kendall’s τ correlations were used because the data were not monotonic-linear;all correlations were significant.

2011/2012 Lake Whatcom Report Page29
02
46
8
Site 1 Dissolved Oxygen by Year at Depth 18
Dis
solv
ed O
xyge
n (m
g/L)
1988 1991 1994 1997 2000 2003 2006 2009 2012
July p−value <0.001August p−value <0.01
Figure 5: Relationship between dissolved oxygen and time atSite 1, 18 m.Kendall’s τ correlations were used because the data were not monotonic-linear;all correlations were significant.

2011/2012 Lake Whatcom Report Page30
1995 2000 2005 2010
020
4060
8010
0
Site 1
DIN
(µg
−N
L)
tau = −0.567p−value <0.001
1995 2000 2005 201010
015
020
025
0
Site 2
DIN
(µg
−N
L)
tau = −0.509p−value <0.01
1995 2000 2005 2010
100
150
200
250
Site 3
DIN
(µg
−N
L)
tau = −0.497p−value <0.01
1995 2000 2005 2010
100
150
200
250
Site 4
DIN
(µg
−N
L)
tau = −0.320p−value <0.05
Figure 6: Minimum summer, near-surface dissolved inorganic nitrogen concen-trations (1994–2012, June-Oct, depths≤5 m). Uncensored (raw) data were usedto illustrate that minimum values are dropping below analytical detection limits(dashed red line). Kendall’sτ correlations were used because the data were notmonotonic-linear; correlations were significant at Sites 1–3.

2011/2012 Lake Whatcom Report Page31
1995 2000 2005 2010
05
1015
Site 1
TP
(µg
−P
L)
tau = 0.465p−value <0.01
1995 2000 2005 20100
510
15
Site 2
TP
(µg
−P
L)
tau = 0.54p−value <0.01
1995 2000 2005 2010
05
1015
Site 3
TP
(µg
−P
L)
tau = 0.335p−value <0.05
1995 2000 2005 2010
05
1015
Site 4
TP
(µg
−P
L)
tau = 0.574p−value <0.001
Figure 7: Median summer, near-surface total phosphorus concentrations (1994–2012, June-Oct, depths≤5 m). Uncensored (raw) data were used to illustrate thatmedian values are increasingly above analytical detectionlimits (dashed red line).Kendall’s τ correlations were used because the data were not monotonic-linear;all correlations were significant.

2011/2012 Lake Whatcom Report Page32
1995 2000 2005 2010
12
34
56
7
Site 1
Chl
(µg
L)
tau = 0.598p−value <0.001
1995 2000 2005 20101
23
45
67
Site 2
Chl
(µg
L)
tau = 0.68p−value <0.0001
1995 2000 2005 2010
12
34
56
7
Site 3
Chl
(µg
L)
tau = 0.719p−value <0.0001
1995 2000 2005 2010
12
34
56
7
Site 4
Chl
(µg
L)
tau = 0.754p−value <0.0001
Figure 8: Median summer near-surface chlorophyll concentrations (1994–2012,June-October, depths≤5 m). Kendall’sτ correlations were used because the datawere not monotonic-linear; all correlations were significant.

2011/2012 Lake Whatcom Report Page33
1995 2000 2005 2010
4.0
4.5
5.0
5.5
6.0
Chrysophyta
Log1
0(#/
L)
tau = 0.52p−value <0.01
1995 2000 2005 20102
34
56
Cyanobacteria
Log1
0(#/
L)
tau = 0.544p−value <0.001
1995 2000 2005 2010
2.5
3.5
4.5
5.5
Chlorophyta
Log1
0(#/
L)
tau = 0.368p−value <0.05
1995 2000 2005 2010
1.5
2.5
3.5
4.5
Dinoflagellates
Log1
0(#/
L)
tau = 0.029ns
Figure 9: Log10 plots of median summer, near-surface algae counts (1994-2012,June-October, all sites and depths). Kendall’sτ correlations were used becausethe data were not monotonic-linear; all correlations except Dinoflagellates weresignificant.

2011/2012 Lake Whatcom Report Page34
1995 2000 2005 2010
23
45
6
Site 1
Cya
noba
cter
ia (
Log1
0 #/
L)
tau = 0.661p−value <0.0001
1995 2000 2005 20102
34
56
Site 2
Cya
noba
cter
ia (
Log1
0 #/
L)
tau = 0.52p−value <0.01
1995 2000 2005 2010
23
45
6
Site 3
Cya
noba
cter
ia (
Log1
0 #/
L)
tau = 0.633p−value <0.001
1995 2000 2005 2010
23
45
6
Site 4
Cya
noba
cter
ia (
Log1
0 #/
L)
tau = 0.602p−value <0.0001
Figure 10: Log10 plots of median summer, near-surface Cyanobacteria counts(1994–2012, June-October, depths≤5 m). Kendall’sτ correlations were usedbecause the data were not monotonic-linear; all correlations were significant.

2011/2012 Lake Whatcom Report Page35
1996 2000 2004 2008 2012
02
46
810
TOC
(m
g/L)
Site 1
1996 2000 2004 2008 20120
24
68
10 Site 2
1996 2000 2004 2008 2012
02
46
810
TOC
(m
g/L)
one point off−scale Site 3
1996 2000 2004 2008 2012
02
46
810 Site 4
Figure 11: Boxplots of annual total organic carbon concentrations at Sites 1–4. Boxplots show medians and upper/lower quartiles; whiskers show the maxi-mum/minimum values.

2011/2012 Lake Whatcom Report Page36
0.01
0.02
0.03
0.04
0.05
0.06
TTHMS (Jan−Dec)
TT
HM
s (m
g/L)
11/91 05/97 11/02 05/08 10/13
r = 0.548p−value <0.0001
0.01
0.02
0.03
0.04
0.05
0.06
TTHMS (Qtr 3, July−Sept)
TT
HM
s (m
g/L)
11/91 05/97 11/02 05/08 10/13
r = 0.548p−value <0.0001r = 0.743p−value <0.001
0.01
00.
015
0.02
00.
025
HAAS (Jan−Dec)
HA
As
(mg/
L)
11/91 05/97 11/02 05/08 10/13
r = 0.467p−value <0.01
0.01
00.
015
0.02
00.
025
HAAS (Qtr 3, July−Sept)
HA
As
(mg/
L)
11/91 05/97 11/02 05/08 10/13
r = 0.23ns
Figure 12: Total trihalomethanes (TTHMs) and haloacetic acids (HAAs) con-centrations in the Bellingham water distribution system, 1992–2012. Data wereprovided by the City of Bellingham Public Works Department.Kendall’sτ cor-relations were used because the data were not monotonic-linear; correlations forTHMS (Jan-Dec and Qtr 3) and Jan-Dec HAAs were significant.

2011/2012 Lake Whatcom Report Page37
3 Tributary Monitoring
The major objective for the tributary monitoring was to provide baseline data forthe major tributaries that flow into Lake Whatcom. Whatcom Creek was alsosampled to provide baseline data for the lake’s outlet. Monthly samples werecollected from 2004–2006. The level of effort was reduced from 2007–2009, withsamples collected twice each year. Monthly sampling was re-initiated in January2010 and will continue through December 2012.
3.1 Site Descriptions
Samples were collected from Anderson, Austin, Blue Canyon,Brannian, Carpen-ter, Euclid, Mill Wheel, Olsen, Silver Beach, Smith, and Whatcom Creeks and thePark Place drain. The sampling locations for these sites aredescribed in AppendixA.2 and shown on Figure A2, page 98.
3.2 Field Sampling and Analytical Methods
The tributaries were sampled on October 12, November 9, and December 14,2011; and on January 10, February 14, March 6, April 5, May 1, June 5, July 17,August 8, and September 12, 2012.
The analytical procedures for sampling the tributaries aresummarized in Table1 (page 16). All water samples (including bacteriological samples) collected inthe field were stored on ice and in the dark until they reached the laboratory.Once in the laboratory the handling procedures that were relevant for each analysiswere followed (see Table 1). The bacteria samples were analyzed by the City ofBellingham. Total metals analyses (arsenic, cadmium, chromium, copper, iron,mercury, nickel, lead, and zinc) and total organic carbon analyses were done byAmTest.19 All other analyses were done by WWU.
19AmTest, 13600 Northeast 126th Place, Suite C, Kirkland, WA,98034–8720.

2011/2012 Lake Whatcom Report Page38
3.3 Results and Discussion
The monthly tributary data are summarized in Table 10 (page 41), with descriptivestatistics for each site listed in Tables 11–22 (pages 42–53). The biannual metalsand total organic carbon data are listed in Tables 23–24 (pages 54–55). Historicdata from 2004 through the current monitoring period are plotted in AppendixB.4 (Figures B131–B169, pages 236–274). These figures include a dashed (blue)horizontal line that shows the median value for Smith Creek and a solid (red)horizontal line that shows the median value for each creek. Smith Creek waschosen as a reference because it is a major tributary to the lake and has a historyof being relatively unpolluted.
Water temperatures and dissolved oxygen concentrations followed predictableseasonal cycles, with most sites having colder temperatures and higher oxygenconcentrations during the winter, and warmer temperaturesand lower oxygen con-centrations during the summer (Figures B131–B136). Whatcom Creek had highertemperatures and lower oxygen concentrations than most other sites, reflecting theinfluence of Lake Whatcom (Figures B131 and B134). The residential tributaries(Euclid, Millwheel, and Silver Beach Creeks and the Park Place drain) often hadslightly elevated temperatures and lower dissolved oxygenconcentrations, whichis typical for streams in developed watersheds (Figures B133 and B136).
Most of the creeks in the Lake Whatcom watershed had relatively low concen-trations of dissolved solids, indicated by conductivities≤100µS and alkalinities≤20 mg/L (Table 10; Figures B137–B145). Sites that did not match this de-scription included the residential tributaries (Euclid, Millwheel, and Silver BeachCreeks and the Park Place drain) and Blue Canyon Creek, whichdrains an arearich in soluble minerals. Most sites also had low total suspended solids concen-trations (≤5 mg/L) and low turbidities (≤5 NTU) except during periods of highprecipitation and runoff (Figures B146–B151).
Ammonium concentrations were generally low (≤10 µg-N/L) except in the res-idential streams (Table 10; Figures B152–B154). Ammonium does not persistlong in oxygenated surface waters. When present in streams,it usually indicatesa near-by source such as an upstream wetland with anaerobic soils or a pollutionsource.
Most of the creeks had lower total nitrogen and nitrate/nitrate concentrations thanSmith Creek (Figures B155– B160). The relatively high nitrate and total nitrogen

2011/2012 Lake Whatcom Report Page39
concentrations in Smith Creek are probably due to the presence of nitrogen-fixingalders (Alnus rubra) in the riparian zone upstream from the sampling site. Highnitrate and total nitrogen concentrations are not necessarily an indication of waterpollution, and low nitrate concentrations actually favor the growth of nuisanceCyanobacteria. The exceptionally low concentrations in Whatcom Creek reflectalgal uptake of nitrogen in the lake.
Soluble inorganic phosphate is quickly removed from surface water by biota, sohigh concentrations of soluble phosphate usually indicatea near-by source suchas an anaerobic wetland or a pollution source. In 2011/2012,the median solublephosphate concentrations were≤10µg-P/L at all sites except Olsen, Euclid, MillWheel, and Silver Beach Creeks and the Park Place drain (Table 10). The historicdata indicate that although soluble phosphate concentrations were generally low,nearly all sites have had a few high peaks, and high concentrations were commonin residential streams.
Total phosphorus concentrations were higher than soluble phosphate concentra-tions (Figures B161–B166). The median 2011/2012 concentrations were≤20µg-P/L at all sites except Carpenter, Euclid, Mill Wheel, andSilver Beach Creeksand the Park Place drain (Table 10). As with soluble phosphate, nearly all siteshave had occasional high total phosphorus peaks, and high concentrations werecommon in samples from residential sites.
High coliform counts are an indicator of residential pollution (Table 10; FiguresB167–B169). Although most of the sites had low coliform counts in 2011/2012,five sites exceeded a geometric mean of 50 cfu/100 mL (Carpenter, Euclid, Mill-wheel, and Silver Beach Creeks and the Park Place drain) and seven sites hadmore than 10% of the samples with counts>100 cfu/100 mL (Brannian, Smith,Carpenter, Euclid, Millwheel, and Silver Beach Creeks and the Park Place drain).
The total organic carbon and metals concentrations are included in Tables 23–24. AmTest has upgraded their equipment, changed analytical procedures, andrecalculated detection limits several times since we begancollecting metal datafrom the tributaries to Lake Whatcom. Because many of the metals concentrationsare extremely low, changes in equipment or methods can causethe concentrationto move from detectable to non-detectable, or vice versa. This type of changedoes not indicate an actual change in the metals concentration in the tributaries.Table 1 (page 16) shows the historic and current AmTest detection limits for eachmetal.

2011/2012 Lake Whatcom Report Page40
The metals concentrations were within normal concentration ranges for tributariesto Lake Whatcom. Iron and zinc concentrations were usually in the detectablerange. Low concentrations of cadmium, chromium, copper, and mercury weredetected in many of the March 2012 samples, but at levels close to detection limits.These elements were all at or below detection in the July samples. Lead was oftendetected, but the current analytical method has a very low detection limit (0.00005mg/L). All of the lead concentrations were lower than the historic detection level(<0.001 mg/L, Table 1).

2011/2012 Lake Whatcom Report Page41
Typical range Anderson Austin Brannian Olsen Smith WhatcomAlkalinity med.≤20 mg/L yes yes yes no yes yesConductivity med.≤100µS yes yes yes yes yes yespH 6.5–8.0 yes yes no yes yes yes
T. susp. solids med.≤5 mg/L yes yes yes yes yes yesTurbidity med.≤5 NTU yes yes yes yes yes yes
Ammonium med.≤10µg-N/L yes yes yes yes yes yes
Sol. phosphate med.≤10µg-P/L yes yes yes no yes yesT. phosphorus med.≤20µg-P/L yes yes yes yes yes yes
F. coliforms GM≤50 cfu yes yes yes yes yes yesFewer than 10% yes no yes no yes yesexceed 100 cfu
Blue Mill Park SilverTypical range Canyon Carpenter Euclid Wheel Place Beach
Alkalinity med.≤20 mg/L no no no no no noConductivity med.≤100µS no yes no no no nopH 6.5–8.0 no yes yes yes yes no
T. susp. solids med.≤5 mg/L yes yes yes no yes yesTurbidity med.≤5 NTU yes yes yes no yes yes
Ammonium med.≤10µg-N/L yes yes yes no no yes
Sol. phosphate med.≤10µg-P/L yes yes no no no noT. phosphorus med.≤20µg-P/L yes no no no no no
F. coliforms GM≤50 cfu yes no no no no noFewer than 10% yes no no no no noexceed 100 cfu
Table 10: Comparison of water quality features in Lake Whatcom tributaries.

2011/2012 Lake Whatcom Report Page42
Variable Min. Med. Mean† Max.Alkalinity (mg/L CaCO3) 12.9 18.2 18.8 26.8Conductivity (µS/cm) 43.4 58.8 57.6 70.6Dissolved oxygen (mg/L) 9.2 11.5 11.1 12.6pH 6.5 7.1 7.0 7.2Temperature (◦C) 4.5 7.7 8.2 13.7Total suspended solids (mg/L) <2 2.5 4.8 27.2Turbidity (NTU) 0.8 2.7 4.5 24.9
Nitrogen - ammonium (µg-N/L) <10 <10 <10 30Nitrogen - nitrate/nitrite (µg-N/L) 64.6 443.7 424.9 681.4Nitrogen - total (µg-N/L) 155.0 653.8 565.3 805.1
Phosphorus - soluble (µg-P/L) <5 6.9 6.4 11.6Phosphorus - total (µg-P/L) 8.6 17.4 21.4 51.8
Coliforms - fecal (cfu/100 mL)‡ <1 10 8 64(Percent of samples>100 cfu/100 mL = 0)
†Uncensored arithmetic means except coliforms (geometric mean);‡Censored values replaced with closest integer (i.e.,<1⇒ 1).
Table 11: Summary of Anderson Creek water quality data, Oct.2011–Sept. 2012.

2011/2012 Lake Whatcom Report Page43
Variable Min. Med. Mean† Max.Alkalinity (mg/L CaCO3) 10.4 19.9 20.1 35.8Conductivity (µS/cm) 46.6 72.2 74.6 128.5Dissolved oxygen (mg/L) 9.8 11.7 11.7 13.5pH 6.9 7.5 7.4 7.9Temperature (◦C) 2.7 7.7 8.3 15.2Total suspended solids (mg/L) <2 <2 2.8 16.5Turbidity (NTU) 0.6 1.2 2.1 8.2
Nitrogen - ammonium (µg-N/L) <10 <10 <10 <10Nitrogen - nitrate/nitrite (µg-N/L) 288.9 661.4 626.7 1038.3Nitrogen - total (µg-N/L) 362.2 769.8 742.2 1285
Phosphorus - soluble (µg-P/L) 5.6 8.9 9.1 14Phosphorus - total (µg-P/L) 7.2 17.3 16.3 27.7
Coliforms - fecal (cfu/100 mL)‡ 3 26 25 360(Percent of samples>100 cfu/100 mL = 25)
†Uncensored arithmetic means except coliforms (geometric mean);‡Censored values replaced with closest integer (i.e.,<1⇒ 1).
Table 12: Summary of Austin Creek water quality data, Oct. 2011–Sept. 2012.

2011/2012 Lake Whatcom Report Page44
Variable Min. Med. Mean† Max.Alkalinity (mg/L CaCO3) 58.1 133.7 125.7 160.2Conductivity (µS/cm) 153.8 287.1 268.3 319Dissolved oxygen (mg/L) 10.2 11.4 11.6 13.1pH 7.7 8.3 8.2 8.4Temperature (◦C) 4.0 8.6 8.7 13.8Total suspended solids (mg/L) <2 3.2 3.2 6.5Turbidity (NTU) 0.5 2.2 2.1 4.4
Nitrogen - ammonium (µg-N/L) <10 <10 <10 <10Nitrogen - nitrate/nitrite (µg-N/L) 143.2 419 434 898.4Nitrogen - total (µg-N/L) 195.0 509.0 527.5 1006.1
Phosphorus - soluble (µg-P/L) <5 8.6 8.5 14.6Phosphorus - total (µg-P/L) 5.9 13.9 12.5 17.9
Coliforms - fecal (cfu/100 mL)‡ <1 2 3 76(Percent of samples>100 cfu/100 mL = 0)
†Uncensored arithmetic means except coliforms (geometric mean);‡Censored values replaced with closest integer (i.e.,<1⇒ 1).
Table 13: Summary of Blue Canyon Creek water quality data, Oct. 2011–Sept. 2012.

2011/2012 Lake Whatcom Report Page45
Variable Min. Med. Mean† Max.Alkalinity (mg/L CaCO3) 6.1 11 11.9 21.8Conductivity (µS/cm) 30.8 44.5 44.7 62.7Dissolved oxygen (mg/L) 7.1 11.1 10.7 12.4pH 6.4 7 6.9 7.1Temperature (◦C) 4.0 8.0 8.6 14.4Total suspended solids (mg/L) <2 <2 2.3 13.7Turbidity (NTU) 0.4 1.2 1.8 6.1
Nitrogen - ammonium (µg-N/L) <10 <10 <10 11.5Nitrogen - nitrate/nitrite (µg-N/L) 136.7 587.6 704.8 1652.5Nitrogen - total (µg-N/L) 215.4 728.5 818.2 1747.9
Phosphorus - soluble (µg-P/L) <5 <5 <5 7.1Phosphorus - total (µg-P/L) <5 12.3 12.8 23.3
Coliforms - fecal (cfu/100 mL)‡ <1 8 9 58(Percent of samples>100 cfu/100 mL = 0)
†Uncensored arithmetic means except coliforms (geometric mean);‡Censored values replaced with closest integer (i.e.,<1⇒ 1).
Table 14: Summary of Brannian Creek water quality data, Oct.2011–Sept. 2012.

2011/2012 Lake Whatcom Report Page46
Variable Min. Med. Mean† Max.Alkalinity (mg/L CaCO3) 12.1 26.2 28.9 48Conductivity (µS/cm) 53.4 77.1 82.7 116.7Dissolved oxygen (mg/L) 9.4 11.5 11.5 13.3pH 6.8 7.5 7.5 7.9Temperature (◦C) 2.7 7.8 8.6 16.6Total suspended solids (mg/L) <2 2.2 4.0 16.8Turbidity (NTU) 0.4 2.3 2.6 6.5
Nitrogen - ammonium (µg-N/L) <10 <10 <10 67.2Nitrogen - nitrate/nitrite (µg-N/L) 165.2 511.5 676.5 1436.3Nitrogen - total (µg-N/L) 345.7 722.8 889.9 1661.0
Phosphorus - soluble (µg-P/L) 5.3 9.9 12.2 35.1Phosphorus - total (µg-P/L) 9.8 20.3 23.0 58.3
Coliforms - fecal (cfu/100 mL)‡ 18 140 117 390(Percent of samples>100 cfu/100 mL = 58)
†Uncensored arithmetic means except coliforms (geometric mean);‡Censored values replaced with closest integer (i.e.,<1⇒ 1).
Table 15: Summary of Carpenter Creek water quality data, Oct. 2011–Sept. 2012.

2011/2012 Lake Whatcom Report Page47
Variable Min. Med. Mean† Max.Alkalinity (mg/L CaCO3) 17.3 45.9 39.9 67.9Conductivity (µS/cm) 22.3 108.6 100.4 152.1Dissolved oxygen (mg/L) 8.9 11.4 10.9 12.5pH 7.0 7.4 7.4 7.6Temperature (◦C) 3.5 8.7 9.0 15.7Total suspended solids (mg/L) <2 2.4 2.9 5.5Turbidity (NTU) 0.5 2.1 2.3 4.7
Nitrogen - ammonium (µg-N/L) <10 <10 <10 23.2Nitrogen - nitrate/nitrite (µg-N/L) 179.8 344.2 454.1 898.9Nitrogen - total (µg-N/L) 358.5 520.2 612.2 1042.0
Phosphorus - soluble (µg-P/L) 8.3 11.1 11.3 16Phosphorus - total (µg-P/L) 8.3 20.6 21.2 30.6
Coliforms - fecal (cfu/100 mL)‡ 8 72 69 3200(Percent of samples>100 cfu/100 mL = 36)
†Uncensored arithmetic means except coliforms (geometric mean);‡Censored values replaced with closest integer (i.e.,<1⇒ 1).
Table 16: Summary of Euclid Creek water quality data, Oct. 2011–Sept. 2012.Euclid Creek had negligible flow on September 12, 2012; no water quality sam-ples were collected under these conditions.

2011/2012 Lake Whatcom Report Page48
Variable Min. Med. Mean† Max.Alkalinity (mg/L CaCO3) 17.8 50.5 46.6 82.9Conductivity (µS/cm) 66.3 117.7 121.0 184.6Dissolved oxygen (mg/L) 0.6 10.7 9.0 12.4pH 6.8 7.3 7.3 7.9Temperature (◦C) 3.4 9.3 11.3 23.6Total suspended solids (mg/L) <2 7.8 17.0 93.5Turbidity (NTU) 2.5 7.5 14.5 55.8
Nitrogen - ammonium (µg-N/L) <10 28.1 92.9 837.7Nitrogen - nitrate/nitrite (µg-N/L) 5.6 290.3 517.3 1724.4Nitrogen - total (µg-N/L) 425.2 1129.2 1426.2 3245.5
Phosphorus - soluble (µg-P/L) 6.5 10.2 13.5 27.2Phosphorus - total (µg-P/L) 18.1 49.0 128.4 521.8
Coliforms - fecal (cfu/100 mL)‡ 5 345 207 2100(Percent of samples>100 cfu/100 mL = 58)
†Uncensored arithmetic means except coliforms (geometric mean);‡Censored values replaced with closest integer (i.e.,<1 ⇒ 1).
Table 17: Summary of Millwheel Creek water quality data, Oct. 2011–Sept. 2012.

2011/2012 Lake Whatcom Report Page49
Variable Min. Med. Mean† Max.Alkalinity (mg/L CaCO3) 9.6 22.1 22.4 46.7Conductivity (µS/cm) 43.0 67.4 69.3 118.1Dissolved oxygen (mg/L) 9.7 11.8 11.7 13.4pH 6.8 7.5 7.4 7.8Temperature (◦C) 2.7 6.9 8.0 16.1Total suspended solids (mg/L) <2 4.9 7.8 30.6Turbidity (NTU) 0.4 3.8 5.6 17.3
Nitrogen - ammonium (µg-N/L) <10 <10 <10 21.4Nitrogen - nitrate/nitrite (µg-N/L) 418.1 950.2 916.1 1536.7Nitrogen - total (µg-N/L) 481.8 1093.8 1038.5 1760.1
Phosphorus - soluble (µg-P/L) 5.9 10.1 10.3 18.5Phosphorus - total (µg-P/L) 11.3 18.0 20.9 31.8
Coliforms - fecal (cfu/100 mL)‡ <1 20 14 240(Percent of samples>100 cfu/100 mL = 25)
†Uncensored arithmetic means except coliforms (geometric mean);‡Censored values replaced with closest integer (i.e.,<1 ⇒ 1).
Table 18: Summary of Olsen Creek water quality data, Oct. 2011–Sept. 2012.

2011/2012 Lake Whatcom Report Page50
Variable Min. Med. Mean† Max.Alkalinity (mg/L CaCO3) 54.6 82.5 86.6 123.5Conductivity (µS/cm) 18.4 244 226.6 309.0Dissolved oxygen (mg/L) 6.2 10.9 10.1 12.4pH 7.2 7.5 7.5 7.9Temperature (◦C) 5.2 10.1 11.5 22.6Total suspended solids (mg/L) <2 <2 <2 4.5Turbidity (NTU) 0.8 2.5 2.8 5.8
Nitrogen - ammonium (µg-N/L) <10 23.2 35.3 150.6Nitrogen - nitrate/nitrite (µg-N/L) 101.7 341.1 493.4 1120.5Nitrogen - total (µg-N/L) 420.8 573.5 743.8 1353
Phosphorus - soluble (µg-P/L) 14.7 17.5 21.5 38.3Phosphorus - total (µg-P/L) 21.3 33.7 52.0 153.5
Coliforms - fecal (cfu/100 mL)‡ 7 73 81 490(Percent of samples>100 cfu/100 mL = 33)
†Uncensored arithmetic means except coliforms (geometric mean);‡Censored values replaced with closest integer (i.e.,<1⇒ 1).
Table 19: Summary of Park Place drain water quality data, Oct. 2011–Sept. 2012.

2011/2012 Lake Whatcom Report Page51
Variable Min. Med. Mean† Max.Alkalinity (mg/L CaCO3) 35.3 89.7 82.2 144Conductivity (µS/cm) 109.9 210.9 202.3 311.0Dissolved oxygen (mg/L) 9.1 11.2 11.2 12.9pH 7.3 8.0 7.9 8.2Temperature (◦C) 3.3 8.8 9.3 18.5Total suspended solids (mg/L) <2 2.9 4.4 14.4Turbidity (NTU) 2.2 4.3 4.5 8.5
Nitrogen - ammonium (µg-N/L) <10 <10 <10 22.1Nitrogen - nitrate/nitrite (µg-N/L) 287.5 469.3 580.2 1175.5Nitrogen - total (µg-N/L) 530.2 733.6 848.9 1499.8
Phosphorus - soluble (µg-P/L) 10.5 15.6 16.6 27.6Phosphorus - total (µg-P/L) 16.4 35.8 33.9 46.3
Coliforms - fecal (cfu/100 mL)‡ 28 190 172 700(Percent of samples>100 cfu/100 mL = 75)
†Uncensored arithmetic means except coliforms (geometric mean);‡Censored values replaced with closest integer (i.e.,<1⇒ 1).
Table 20: Summary of Silver Beach Creek water quality data, Oct. 2011–Sept. 2012.

2011/2012 Lake Whatcom Report Page52
Variable Min. Med. Mean† Max.Alkalinity (mg/L CaCO3) 10.0 17.2 18.2 31.6Conductivity (µS/cm) 43.3 60.2 60.2 86.5Dissolved oxygen (mg/L) 9.9 12.1 11.9 13.6pH 7.0 7.4 7.4 7.8Temperature (◦C) 2.8 6.9 8.1 15.6Total suspended solids (mg/L) <2 <2 3.1 11.2Turbidity (NTU) 0.4 1.0 1.9 7.6
Nitrogen - ammonium (µg-N/L) <10 <10 <10 <10Nitrogen - nitrate/nitrite (µg-N/L) 476.3 1043.9 1074.1 1908.4Nitrogen - total (µg-N/L) 550.8 1167.2 1196 2072.9
Phosphorus - soluble (µg-P/L) <5 7.3 7.8 14Phosphorus - total (µg-P/L) 9.2 14.3 14.7 21.3
Coliforms - fecal (cfu/100 mL)‡ <1 4 6 150(Percent of samples>100 cfu/100 mL = 8)
†Uncensored arithmetic means except coliforms (geometric mean);‡Censored values replaced with closest integer (i.e.,<1 ⇒ 1).
Table 21: Summary of Smith Creek water quality data, Oct. 2011–Sept. 2012.

2011/2012 Lake Whatcom Report Page53
Variable Min. Med. Mean† Max.Alkalinity (mg/L CaCO3) 19.4 20.8 20.5 21.5Conductivity (µS/cm) 58.8 60.7 61.0 64.4Dissolved oxygen (mg/L) 8.6 10.8 10.8 12.6pH 7.1 7.5 7.5 7.6Temperature (◦C) 5.9 11.5 12.2 22.3Total suspended solids (mg/L) <2 <2 <2 3.4Turbidity (NTU) 0.7 0.9 1.1 2.1
Nitrogen - ammonium (µg-N/L) <10 <10 <10 31.8Nitrogen - nitrate/nitrite (µg-N/L) 10.3 159.9 170.0 331.8Nitrogen - total (µg-N/L) 198.1 317.6 337.9 456.1
Phosphorus - soluble (µg-P/L) <5 <5 <5 11.8Phosphorus - total (µg-P/L) <5 13.3 13.2 28.1
Coliforms - fecal (cfu/100 mL)‡ <1 8 8 54(Percent of samples>100 cfu/100 mL = 0)
†Uncensored arithmetic means except coliforms (geometric mean);‡Censored values replaced with closest integer (i.e.,<1⇒ 1).
Table 22: Summary of Whatcom Creek water quality data, Oct. 2011–Sept. 2012.

2011/2012 Lake Whatcom Report Page54
T. As T. Cd T. Cr T. Cu T. Fe T. Hg T. Ni T. Pb T. ZnDate (mg/L) (mg/L) (mg/L) (mg/L) (mg/L) (mg/L) (mg/L) (mg/L) (mg/L)
Anderson Mar 6, 2012 <0.01 0.0013 <0.001 <0.001 0.234 <0.0001 <0.005 0.000160 0.006Austin (lower) Mar 6, 2012 <0.01 0.0011 0.001 <0.001 0.528 <0.0001 <0.005 0.000170 0.005Blue Canyon Mar 6, 2012 <0.01 0.0017 <0.001 0.001 0.164 <0.0001 <0.005 0.000060 0.006Brannian Mar 6, 2012 <0.01 0.0009 <0.001 <0.001 0.104 <0.0001 <0.005 0.000090 0.004Carpenter Mar 6, 2012 <0.01 0.0014 <0.001 0.002 0.315 <0.0001 <0.005 0.000150 0.006Euclid Mar 6, 2012 <0.01 0.0015 <0.001 <0.001 0.218 <0.0001 <0.005 0.000200 0.007Millwheel Mar 6, 2012 <0.01 0.0014 0.002 0.003 1.090 <0.0001 <0.005 0.000710 0.017Olsen Mar 6, 2012 <0.01 0.0012 0.001 <0.001 0.364 <0.0001 <0.005 0.000160 0.007Park Place Mar 6, 2012 <0.01 0.0021 <0.001 0.003 0.353 0.0003 <0.005 0.000300 0.015Silver Beach Mar 6, 2012 <0.01 0.0017 <0.001 0.003 0.476 <0.0001 <0.005 0.000250 0.008Smith Mar 6, 2012 <0.01 0.0010 <0.001 <0.001 0.295 <0.0001 <0.005 0.000100 0.006Whatcom Mar 6, 2012 <0.01 0.0013 <0.001 0.002 0.039 0.0001 <0.005 0.000070 0.005
Anderson Jul 12, 2012 <0.02 <0.0015 <0.0025 <0.005 0.610 <0.00005 <0.005 0.000168 <0.002Austin (lower) Jul 12, 2012 <0.02 <0.0015 <0.0025 <0.005 0.741 <0.00005 <0.005 <0.00005 0.002Blue Canyon Jul 12, 2012 <0.02 <0.0015 <0.0025 <0.005 0.056 <0.00005 <0.005 <0.00005 <0.002Brannian Jul 12, 2012 <0.02 <0.0015 <0.0025 <0.005 0.243 <0.00005 <0.005 0.000064 <0.002Carpenter Jul 12, 2012 <0.02 <0.0015 <0.0025 <0.005 0.124 <0.00005 <0.005 <0.00005 0.004Euclid Jul 12, 2012 <0.02 <0.0015 <0.0025 <0.005 0.216 <0.00005 <0.005 0.000075 <0.002Millwheel Jul 12, 2012 <0.02 <0.0015 <0.0025 <0.005 0.790 <0.00005 <0.005 0.000259 0.002Olsen Jul 12, 2012 <0.02 <0.0015 <0.0025 <0.005 0.099 <0.00005 <0.005 <0.00005 <0.002Park Place Jul 12, 2012 <0.02 0.0015 <0.0025 <0.005 0.325 <0.00005 <0.005 <0.00005 0.006Silver Beach Jul 12, 2012 <0.02 <0.0015 <0.0025 <0.005 0.796 <0.00005 <0.005 0.000089 <0.002Smith Jul 12, 2012 <0.02 <0.0015 <0.0025 <0.005 0.023 <0.00005 <0.005 0.000055 <0.002Whatcom Jul 12, 2012 <0.02 <0.0015 <0.0025 <0.005 0.071 <0.00005 <0.005 0.000107 <0.002
Table 23: Lake Whatcom tributary data: total metals. Only the metals specified inthe monitoring plan are included in this table; the results for 24 additional metalsare available from IWS. This parameter is sampled twice eachyear. AmTest re-calculated analytical detection limits between March and July 2012. The Marchdata include the original detection limits; July data include new detection limits(see Table 1 for summary of AmTest methods).

2011/2012 Lake Whatcom Report Page55
TOC TOCSite Date (mg/L) Date (mg/L)Anderson Mar 6, 2012 2.4 Jul 12, 2012 1.9
Austin (lower) Mar 6, 2012 2.2 Jul 12, 2012 2.4
Blue Canyon Mar 6, 2012 3.1 Jul 12, 2012 1.8
Brannian Mar 6, 2012 2.2 Jul 12, 2012 2.4
Carpenter Mar 6, 2012 5.2 Jul 12, 2012 3.9
Euclid Mar 6, 2012 3.9 Jul 12, 2012 3.5
Millwheel Mar 6, 2012 4.8 Jul 12, 2012 6.9
Olsen Mar 6, 2012 3.2 Jul 12, 2012 2.8
Park Place Mar 6, 2012 5.2 Jul 12, 2012 4.5
Silver Beach Mar 6, 2012 6.1 Jul 12, 2012 5.6
Smith Mar 6, 2012 3.0 Jul 12, 2012 2.2
Whatcom Mar 6, 2012 2.1 Jul 12, 2012 2.6
Table 24: Lake Whatcom tributary data: total organic carbon. This parameter issampled twice each year.

2011/2012 Lake Whatcom Report Page56
4 Lake Whatcom Hydrology
4.1 Hydrograph Data
Recording hydrographs are installed in Austin Creek and Smith Creek; the dataare plotted in Figures 13–14 (pages 62–63). The location of each hydrographis described in Appendix A.2. All hydrograph data, including data from previ-ous years, are online at http://www.wwu.edu/iws. Detailedfield notes and ratingcurves for each water year are available from the Institute for Watershed Studies.All results are reported as Pacific Standard Time, without Daylight Saving Timeadjustment.
4.2 Water Budget
A water balance was applied to Lake Whatcom to identify majorwater inputs andoutputs and to examine runoff and storage. The traditional method of estimatinga water balance was employed, where inputs - outputs = changein storage (Table25, page 59). Inputs into the lake include direct precipitation, runoff (surfacerunoff + groundwater), and water diverted from the Middle Fork of the NooksackRiver. Outputs include evaporation, Whatcom Creek, the Whatcom Falls FishHatchery, City of Bellingham, Puget Sound Energy Co-Generation Plant20, andthe Lake Whatcom Water and Sewer District.21 The change in storage is estimatedfrom daily lake-level changes. All of these are measured quantities provided bythe City of Bellingham except for evaporation, diverted water, and runoff.
Daily direct-precipitation magnitudes on the lake surfacewere estimated usingthe precipitation data recorded at the Bloedel Donovan, Geneva gatehouse, NorthShore, and Brannian Creek gauges. Due to an equipment malfunction at the NorthShore gauge, rainfall data from June 22 to September 30 were replaced with rain-fall data from the Geneva gatehouse gauge. Note, however, that only about 9%of the annual rainfall occurred during this time interval. The minimum yearlyrainfall (40.0 inches) was recorded at the Bloedel Donovan gauge, the maximum(61.8 inches) was recorded at the Brannian creek gauge. A daily weighted aver-age rainfall average was calculated using a Python script that employed a spatial
20Located at the Georgia Pacific site21Formerly Water District #10

2011/2012 Lake Whatcom Report Page57
interpolation technique (inverse distance weighted) in ArcGIS to distribute rain-fall from the four gauges over a 10 meter raster of the lake. The average direct-precipitation depth (inches) for a given day was converted to volume in millions ofgallons (MG) via a rating curve generated from the lake level-area data (Mitchellet al., 2010). The rating curve accounts for changes in surface area of the lake dueto lake level changes. The average annual direct rainfall tothe lake for the wa-ter year 2011/2012 was 50.3 inches (6778 MG); 69% of which occurred betweenOctober 1 and April 1.
Daily diversion volumes were estimated using a hydrograph separation techniquebased on daily discharge data from the Anderson Creek USGS stream gauge(USGS 12201950), modeled streamflow using the DHSVM, and theoutfall valvelog-sheet provided by the City of Bellingham. The Distributed Hydrology-Soils-Vegetation Model (DHSVM) is a spatially distributed, physically based numericalmodel that was calibrated to the Anderson Creek basin (Matthews et al., 2007).The log-sheet documents the dates and times that the diversion was operating andthe valve opening percent. These dates and times were located on the hydrograph.The natural streamflow was estimated by the DHSVM and manually removedfrom the USGS hydrograph. The remaining volume was used to estimate a dailyvolume discharging to the lake from the diversion. The outfall gate was never openmore than 30%, which on average accounted for about 18–20 MG per day dur-ing dry periods. As such, if the hydrograph separation technique yielded a valuegreater than 20 MG during a storm event, it was set to 20 MG. Approximately2279 MG were diverted into the lake in 2011/2012.
Daily lake evaporation was estimated using a model based on the Penman method(Dingman, 1994). The Penman method is theoretically based model that estimatesfree-water evaporation using both energy-balance and masstransfer concepts. Themethod requires daily average incident solar radiation, air temperature, dew pointtemperature, and wind speed. Hourly data from the North Shore weather station inthe watershed were used to estimate daily averages. The daily evaporation depths(inches) predicted by the model were converted to volumes (MG) via a ratingcurve generated from the lake level-area data developed by Mitchell et al. (2010).The estimated yearly evaporation from the lake is 18.2 inches (2460 MG), 80% ofwhich occurred between April and September.
Daily change in storage was determined by subtracting each day’s lake level by thesubsequent day’s level. This resulted in negative values when the lake level wasdecreasing and positive values when the lake level was increasing. The minimum

2011/2012 Lake Whatcom Report Page58
lake level (311.43 ft) was recorded on December 22, 2011; andthe maximum lakelevel (314.65 ft) occurred on July 4, 2012. The change in storage magnitudes aresensitive to the accuracy of the lake level measurements; small lake level changescorrespond to large lake volumes. The daily net change in lake level (inches)was converted to a volume (MG) via a rating curve generated from the lake level-volume data developed by Mitchell et al. (2010). The rating curve accounts forchanges in volume of the lake due to lake level changes. The median total lakevolume in 2011/2012 was 252,758 MG. Figure 15 (page 64) showsdaily lake-volume values for the past five years. There was a spike in lakevolume when thelake rose from a level of 312.0 feet on January 4, to 315.0 feeton January 9, 2009due to a 6.3 inch storm event.
Surface runoff and groundwater were combined into a single runoff componentthat was determined by adding the outputs to the change in storage and subtractingprecipitation and diversion volumes. Negative values of runoff estimated from thewater budget are likely due to noise in the change in storage estimates or mayrepresent a loss of lake water to deep aquifer systems. The DHSVM was alsoused to simulate runoff into the lake. Runoff represents 74.6% of the annual inputto the lake. About 54% of the total input to the lake occurs as runoff betweenJanuary 1 and April 30. Predictably, about 50% of the total output of the lakedischarges out Whatcom Creek during the same four month interval.
The daily water balance quantities were summed into 7-day totals, which wereused to generate Figures 16–19 (pages 65–68). Figure 16 shows 7-day summedtotals for inputs, outputs, and change in storage. All the inputs except runoffare shown in Figure 17; all outputs except Whatcom Creek are shown in Figure18. Due to their much higher magnitude, observed runoff, modeled runoff, andWhatcom Creek data are included on Figure 19.
Yearly water balance totals are listed in Table 25 (page 59) along with data fromfour previous water years. The total volume of outputs were 13.8% of the mediantotal volume of the lake. Under the assumption that the lake is completely mixedand flow is steady state (inputs = outputs), this would correspond to a 7.2 yearresidence time.22 Tables 26 and 27 (pages 60–61) show the 2011/2012 total inputand output volumes along with the corresponding monthly percentage of eachtotal.
22Although the lake is not completely mixed and the flow is not steady state, these assumptionsare commonly used to provide a simple estimate of residence time for water in lakes.

2011/2012 Lake Whatcom Report Page59
WY2012 WY2011 WY2010 WY2009 WY2008(9/30/11–10/1/12) (9/30/10–10/1/11) (9/30/09–10/1/10) (9/30/08–10/1/09) (9/30/07–10/1/08)
Inputs (MG) †
Direct Precipitation 6,778 (19.0%) 6,900 (18.0%) 7,350 (23.7%) 5,712 (17.7%) 6,006 (16.7%)Diversion 2,279 (6.4%) 2,629 (6.9%) 860 (2.8%) 0 (0.0%) 4,902 (13.7%)Runoff 26,586 (74.6%) 28,709 (75.1%) 22,762 (73.5%) 26,491 (82.3%) 24,989 (69.6%)Total 35,643 (100%) 38,238 (100%) 30,973 (100%) 32,203 (100%) 35,896 (100%)
Outputs (MG%)Whatcom Creek 27,899 (79.9%) 32,351 (81.2%) 22,311 (75.4%) 26,598 (77.5%) 25,793 (76.1%)Hatchery 807 (2.3%) 851 (2.1%) 875 (3.0%) 856 (2.5%) 931 (2.7%)Puget Sound Co-Gen 45 (0.1%) 57 (0.1%) 51 (0.2%) 4 (0.01%) 240 (0.7%)City of Bellingham 3,467 (9.9%) 3,593 (9.0%) 3,522 (11.9%) 3,886 (11.3%) 3,874 (11.4%)LW Water/Sewer Distr. 225 (0.6%) 226 (0.6%) 239 (0.8%) 250 (0.7%) 237 (0.7%)Evaporation 2,460 (7.0%) 2,770 (7.0%) 2,592 (8.8%) 2,723 (7.9%) 2,807 (8.3%)Total 34,903 (%100) 39,847 (100%) 29,589 (100%) 34,317 (100%) 33,883 (100%)
Net change in storage 740 -1,609 1,384 -2,115 2,033
Median lake volume (MG) 252,758 252,637 252,074 252,433 253,003Outflow percent of volume 13.8% 15.8% 11.7% 13.6 13.4%
Residence time (years)‡ 7.2 6.3 8.5 7.4 7.5†Runoff = surface runoff + groundwater; no diversion inputs in WY2009.
‡Based on the assumption that water in the lake is completely mixed and flow is steady state (i. e., inputs = outputs)
Table 25: Annual water balance quantities for the Lake Whatcom watershed,WY2008–WY2012.

2011/2012 Lake Whatcom Report Page60
Input Percents†
Month Diversion Precipitation Runoff TotalOct 0.00 8.16 -1.36 0.54Nov 11.31 13.55 4.99 7.02Dec 3.64 5.52 4.22 4.43Jan 1.93 12.71 16.84 15.10Feb 4.43 13.31 18.70 16.76Mar 7.72 15.12 20.79 18.87Apr 5.92 11.79 15.95 14.52May 16.06 5.57 9.55 9.21Jun 24.54 7.95 6.91 8.23Jul 23.83 5.94 5.56 6.80Aug 0.63 0.02 -0.03 0.02Sep 0.00 0.37 -2.11 -1.51
Input Volume (MG)Total 2,279 6,778 26,586 35,643†Runoff = surface runoff + groundwater;
Table 26: Monthly input water balance quantities for the Lake Whatcom water-shed, October 2011–September 2012.

2011/2012 Lake Whatcom Report Page61
Output Percents†
Month WC Hatch PSE COB WSD Evap TotalOct 0.61 5.73 0.19 8.01 8.12 4.63 1.79Nov 6.51 6.35 1.51 7.32 7.98 2.32 6.29Dec 4.33 8.10 16.46 7.21 8.53 1.18 4.53Jan 15.94 8.04 16.35 7.29 9.19 2.41 13.90Feb 17.69 7.61 11.10 6.70 8.03 2.56 15.23Mar 16.92 8.89 14.77 7.25 7.33 6.64 14.98Apr 11.56 9.57 8.16 7.21 7.32 8.23 10.82May 8.93 8.09 5.35 8.74 8.14 16.33 9.40Jun 7.77 9.48 2.32 8.20 7.66 13.82 8.27Jul 6.26 9.83 14.77 9.65 8.78 17.47 7.50
Aug 2.40 9.63 0.00 12.07 9.73 15.52 4.50Sep 1.09 8.68 9.03 10.36 9.18 8.89 2.80
Output Volume (MG)Total 27,899 807 45 3,467 225 2,46034,903†WC = Whatcom Creek; Hatch = Whatcom Falls Hatchery;PSE = Puget Sound Energy Co-Generation Plant;COB = City of Bellingham; WSD = Lake Whatcom WaterSewer District; Evap = Evaporation
Table 27: Monthly output water balance quantities for the Lake Whatcom water-shed, October 2011–September 2012.

2011/2012 Lake Whatcom Report Page62
050
100
150
200
250
300
Austin Creek
Dis
char
ge (
cfs)
11/11 03/12 06/12 09/12
Figure 13: Austin Creek hydrograph, October 1, 2011–September 30, 2012. Datawere recorded at 15 minute intervals.

2011/2012 Lake Whatcom Report Page63
050
100
150
Smith Creek
Dis
char
ge (
cfs)
11/11 03/12 06/12 09/12
Figure 14: Smith Creek hydrograph, October 1, 2011–September 30, 2012. Datawere recorded at 15 minute intervals.

2011/2012 Lake Whatcom Report Page64
2500
0025
1000
2520
0025
3000
2540
0025
5000
2560
00
Lake
Vol
ume
(MG
)
05/08 09/09 01/11 06/12
Figure 15: Comparison of Lake Whatcom daily lake volumes forWY2008–WY2012. Horizontal line represents median lake volume for the period plotted.

2011/2012 Lake Whatcom Report Page65
−10
000
1000
2000
3000
4000
Vol
ume
(MG
per
7−
day
inte
rval
)
11/11 03/12 06/12 09/12
StorageInputsOutputs
Figure 16: Summary of 7-day inputs, outputs, and changes in Lake Whatcomstorage, October 1, 2011–September 30, 2012.

2011/2012 Lake Whatcom Report Page66
010
020
030
040
050
060
0
Vol
ume
(MG
per
7−
day
inte
rval
)
11/11 03/12 06/12 09/12
PrecipDiversion
Figure 17: Lake Whatcom watershed direct hydrologic inputs, October 1, 2011–September 30, 2012. Runoff is included on Figure 19 (see Section 4.2 discussion).

2011/2012 Lake Whatcom Report Page67
050
100
150
200
Vol
ume
(MG
per
7−
day
inte
rval
)
11/11 03/12 06/12 09/12
HatcheryPSECOBWSDEvaporation
Figure 18: Lake Whatcom watershed hydrologic withdrawals,October 1, 2011–September 30, 2012. Whatcom Creek output is included on Figure 19 ( see Sec-tion 4.2 discussion).

2011/2012 Lake Whatcom Report Page68
050
010
0015
0020
0025
0030
0035
00
Vol
ume
(MG
per
7−
day
inte
rval
)
11/11 03/12 06/12 09/12
Whatcom CreekWater Balance RunoffDHSVM Runoff
Figure 19: Summary of 7-day Whatcom Creek flows, water balance runoff esti-mates, and DHSVM runoff estimates, October 1, 2011–September 30, 2012.

2011/2012 Lake Whatcom Report Page69
5 Storm Water Monitoring
5.1 Site Descriptions
The storm water monitoring program was revised in 2009 to focus on collect-ing baseline data at the Silver Beach Creek outlet and the City of Bellingham’sNorth Shore Drive overlay project. Both sites were monitored in 2009/2010 (seeMatthews, et al., 2011). Beginning in 2010, the emphasis focused on collectingadditional storm water samples from Silver Beach Creek. Forinformation aboutother storm water sites that have been monitored by IWS, refer to the annual re-ports listed in Section 6.2 (page 89).
5.2 Field Sampling and Analytical Methods
Flow-paced discrete samples were collected at the USGS gauging site near themouth of Silver Beach Creek (Figure A3, page 99) using an ISCOsampler pro-vided by the City of Bellingham. A total of eight storm eventswere sampledbetween November 2011 and April 2012 (Table 28, page 72). Each storm eventwas given a unique number (Events 17–24).23. Six of these storms met the precip-itation goal (≥1 cm in 24-hr) and included samples from the rising and falling legof the hydrograph. Two storms (19 and 21) did not meet the precipitation goal,but have been included in this report for general information.
The sampler was calibrated to collect flow proportional samples during each stormevent. The samples were analyzed to measure total suspendedsolids, turbidity,total phosphorus, soluble phosphate, total nitrogen, and nitrate/nitrite followingthe methods summarized in Table 1 (page 16). Stream elevation (stage height)was recorded at 15 minute intervals during each storm event and when a watersample was collected.24 Stream flow was estimated from stage height (ft) usingthe following rating curves.
Oct - Dec 2010: Flow (cfs) = (2.6402× stage height – 9.1803)2
Feb 2011 - Apr 2012: Flow (cfs) = (2.7103× stage height – 9.3703)2
23Events 1–16 were discussed by Matthews, et al. (2011; 2012)24The flow-paced water samples were collected at irregular intervals based on stream flow, so
the sampling time rarely coincided with the automatic 15-min stage height measurements.

2011/2012 Lake Whatcom Report Page70
Sample stage height data (and estimated flow rates) were not collected for a fewsamples due to instrumentation error. For these samples, the stage height at thetime of sampling was estimated using a unweighted average ofadjacent 15-mininterval stage height data.
5.3 Results and Discussion
The amount and intensity of precipitation varied between storm events (Table 28;Figures 20–25, pages 73–78). Four events (17, 18, 20, and 22)had 24-hr max-imum precipitation totals of 1.0–2.0 cm during the monitoring event, two eventshad>2.5 cm (23 and 24), and two events had<1.0 cm (19 and 21). Of the twolow-flow events, Event 19 displayed a typical hydrograph andtypical water qual-ity patterns in response to the hydrograph. Event 21 was collected during a periodof high flow in January 2012. There was no obvious hydrograph peak, and thewater quality data collected during this event were atypical for most parameters.
Total suspended solids, turbidity, and total phosphorus increased with stream flowfor all events except Event 21 (Figures 20–22). Soluble phosphate and total nitro-gen increased with flow during some of the storm events (e.g.,Events 18 and 23),but often showed little relationship to the hydrograph (Figures 23–24). Nitrateconcentrations were usually diluted by precipitation (Figure 25). Event 21, whichoccurred during consistently high flow (no hydrograph peak), had nearly constantlevels for all of the water quality parameters.
Correlation analysis was used to test the relationship between stream flow, streamelevation (stage height), and water quality (Figures 26–31, pages 79–84). Bothstage height and stream flow were included because stream flowis estimated froma rating curve, so it contains uncertainty. Stage height is adirect measurementof the height of the stream when the sample is collected, and produced slightlybetter correlations with the water quality data. Events 19 and 21 were excludedbecause they did not meet the precipitation goals and Event 21 did not have atypical hydrograph profile or water quality responses.
All of the water quality parameters were significantly correlated with stream flowand stage height (Figures 26– 31); however, the significant positive correlationfor nitrate with stream flow and stage height was mostly an artifact of the largesample size. All other parameters (total suspended solids,turbidity, total phospho-rus, soluble phosphate, and total nitrogen) had much higherKendall’sτ statistics

2011/2012 Lake Whatcom Report Page71
compared to nitrate. Total suspended solids, turbidity, and total phosphorus werehighly correlated with each other (Figure 32). Total phosphorus is often adsorbedto the surface of sediment particles and is transported withsediments in stormrunoff.
Part of the scattered “noise” in Figures 26–31 comes from within-storm variation,which can be seen by plotting the storm events separately. For example, Figure 33shows the correlations between total phosphorus and flow by event. The resultsvaried considerably, with correlation statistics rangingfrom insignificant (Events19 and 21) to very highly significant (Event 20τ = 0.95).25 In theory, the “best”statistical approach would be to evaluate all data separately by storm event. Butthis is not always feasible, or even desirable, especially if the goal is to develop asimple model of pollutant transport as a function of stream flow.
25The maximum value for a correlation statistic is±1.0.

2011/2012 Lake Whatcom Report Page72
Event Max. 24-hrEvent Sampling Period Duration (hr) Precip
17 06:00 Nov 11 to 12:00 Nov 12, 2011 30 0.72 in(1.8 cm)
18 12:00 Nov 16 to 12:00 Nov 18, 2011 48 0.42 in(1.1 cm)
19 14:00 Dec 16 to 09:30 Dec 20, 2011 91 0.20 in(0.51 cm)
20 14:00 Dec 27 to 14:00 Dec 28, 2011 24 0.51 in(1.3 cm)
21 10:00 Jan 25 to 09:45 Jan 26, 2012 23 0.29 in0.74 cm)
22 20:00 Jan 28 to 08:30 Jan 31, 2012 60 0.64 in(1.6 cm)
23 20:00 Feb 20 to 12:00 Feb 23, 2012 64 1.37 in(3.5 cm)
24 18:00 Apr 19 to 14:00 Apr 20, 2012 20 1.03 in(2.6 cm)
Table 28: Summary of Silver Beach Creek storm events and maximum 24-hrprecipitation total at the Bloedel/Donovan precipitationgauge. Precipitation datawere provided by the City of Bellingham.

2011/2012 Lake Whatcom Report Page73
3.6
4.0
4.4
010203040506070
TS
S (
mg/
L)
Event #17 (Nov 11 − 12, 2011)
Flo
w (
cfs)
Event #18 (Nov 16 − 18, 2011)
3.6
4.0
4.4
050
100150200250
3.5
3.7
3.9
0
5
10
15
20precipitation <1 cm in 24−hr
TS
S (
mg/
L)
Event #19 (Dec 16 − 20, 2011)
Flo
w (
cfs)
Event #20 (Dec 27 − 28, 2011)
3.6
4.0
4.4
020406080
1003.
64.
04.
4
02468
10precipitation <1 cm in 24−hr
TS
S (
mg/
L)
Event #21 (Jan 25 − 26, 2012)
Flo
w (
cfs)
Event #22 (Jan 28 − 31, 2012)
3.6
4.0
4.4
01020304050
3.5
4.5
5.5
050
100150200250300350
TS
S (
mg/
L)
Event #23 (Feb 20 − 23, 2012)
Flo
w (
cfs)
Event #24 (Apr 19 − 20, 2012)
3.5
4.0
4.5
5.0
0
50
100
150
200
Figure 20: Silver Beach Creek storm water monitoring results for Events 17–24:total suspended solids (•) vs. stream flow (—). Note scale for each event. Resultsfor Events 1–16 were presented in earlier reports (Matthewset al. 2011; 2012).
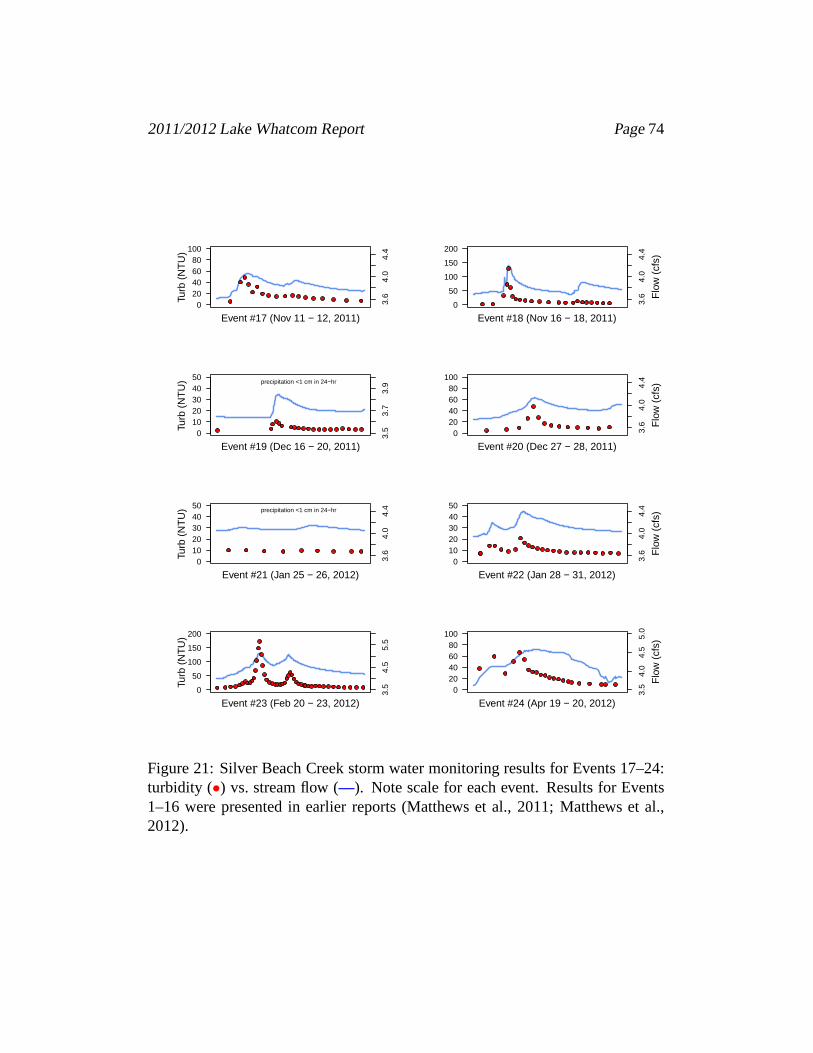
2011/2012 Lake Whatcom Report Page74
3.6
4.0
4.4
020406080
100
Turb
(N
TU
)
Event #17 (Nov 11 − 12, 2011)
Flo
w (
cfs)
Event #18 (Nov 16 − 18, 2011)
3.6
4.0
4.4
0
50
100
150
200
3.5
3.7
3.9
01020304050
precipitation <1 cm in 24−hr
Turb
(N
TU
)
Event #19 (Dec 16 − 20, 2011)
Flo
w (
cfs)
Event #20 (Dec 27 − 28, 2011)
3.6
4.0
4.4
020406080
1003.
64.
04.
4
01020304050
precipitation <1 cm in 24−hr
Turb
(N
TU
)
Event #21 (Jan 25 − 26, 2012)
Flo
w (
cfs)
Event #22 (Jan 28 − 31, 2012)
3.6
4.0
4.4
01020304050
3.5
4.5
5.5
0
50
100
150
200
Turb
(N
TU
)
Event #23 (Feb 20 − 23, 2012)
Flo
w (
cfs)
Event #24 (Apr 19 − 20, 2012)
3.5
4.0
4.5
5.0
020406080
100
Figure 21: Silver Beach Creek storm water monitoring results for Events 17–24:turbidity (•) vs. stream flow (—). Note scale for each event. Results for Events1–16 were presented in earlier reports (Matthews et al., 2011; Matthews et al.,2012).

2011/2012 Lake Whatcom Report Page75
3.6
4.0
4.4
0
50
100
150
200
TP
(µg
−P
L)
Event # 17 (Nov 11 − 12, 2011)
Flo
w (
cfs)
Event #18 (Nov 16 − 18, 2011)
3.6
4.0
4.4
0
100
200
300
400
3.5
3.7
3.9
0
20
40
60precipitation <1 cm in 24−hr
TP
(µg
−P
L)
Event #19 (Dec 16 − 20, 2011)
Flo
w (
cfs)
Event #20 (Dec 27 − 28, 2011)
3.6
4.0
4.4
0
50
100
150
2003.
64.
04.
4
0
20
40
60precipitation <1 cm in 24−hr
TP
(µg
−P
L)
Event #21 (Jan 25 − 26, 2012)
Flo
w (
cfs)
Event #22 (Jan 28 − 31, 2012)
3.6
4.0
4.4
020406080
100
3.5
4.5
5.5
0100200300400500
TP
(µg
−P
L)
Event #23 (Feb 20 − 23, 2012)
Flo
w (
cfs)
Event #24 (Apr 19 − 20, 2012)
3.5
4.0
4.5
5.0
050
100150200250300
Figure 22: Silver Beach Creek storm water monitoring results for Events 17–24: total phosphorus (•) vs. stream flow (—). Note scale for each event. Re-sults for Events 1–16 were presented in the earlier reports (Matthews et al., 2011;Matthews et al., 2012).

2011/2012 Lake Whatcom Report Page76
3.6
4.0
4.4
01020304050
SR
P (µ
g−
PL)
Event #17 (Nov 11 − 12, 2011)
Flo
w (
cfs)
Event #18 (Nov 16 − 18, 2011)
3.6
4.0
4.4
01020304050
3.5
3.7
3.9
01020304050
precipitation <1 cm in 24−hr
SR
P (µ
g−
PL)
Event #19 (Dec 16 − 20, 2011)
Flo
w (
cfs)
Event #20 (Dec 27 − 28, 2011)
3.6
4.0
4.4
01020304050
3.6
4.0
4.4
01020304050
SR
P (µ
g−
PL)
Event #21 (Jan 25 − 26, 2012)
precipitation <1 cm in 24−hr
Flo
w (
cfs)
Event #22 (Jan 28 − 31, 2012)
3.6
4.0
4.4
01020304050
3.5
4.5
5.5
01020304050
SR
P (µ
g−
PL)
Event #23 (Feb 20 − 23, 2012)
Flo
w (
cfs)
Event #24 (Apr 19 − 20, 2012)
3.5
4.0
4.5
5.0
01020304050
Figure 23: Silver Beach Creek storm water monitoring results for Events 17–24:soluble phosphate (•) vs. stream flow (—). Note scale for each event. Results forEvents 1–16 were presented in earlier reports (Matthews et al., 2011; Matthews etal., 2012).

2011/2012 Lake Whatcom Report Page77
3.6
4.0
4.4
0
500
1000
1500
2000
TN
(µg
−N
L)
Event #17 (Nov 11 − 12, 2011)
Flo
w (
cfs)
Event #18 (Nov 16 − 18, 2011)
3.6
4.0
4.4
0500
10001500200025003000
3.5
3.7
3.9
0
500
1000
1500
2000precipitation <1 cm in 24−hr
TN
(µg
−N
L)
Event #19 (Dec 16 − 20, 2011)
Flo
w (
cfs)
Event #20 (Dec 27 − 28, 2011)
3.6
4.0
4.4
0
500
1000
1500
20003.
64.
04.
4
0500
10001500200025003000
precipitation <1 cm in 24−hr
TN
(µg
−N
L)
Event #21 (Jan 25 − 26, 2012)
Flo
w (
cfs)
Event #22 (Jan 28 − 31, 2012)
3.6
4.0
4.4
0500
1000150020002500
3.5
4.5
5.5
0500
10001500200025003000
TN
(µg
−N
L)
Event #23 (Feb 20 − 23, 2012)
Flo
w (
cfs)
Event #24 (Apr 19 − 20, 2012)
3.5
4.0
4.5
5.0
0
500
1000
1500
2000
Figure 24: Silver Beach Creek storm water monitoring results for Events 17–24:total nitrogen (•) vs. stream flow (—). Note scale for each event. Results forEvents 1–16 were presented in earlier reports (Matthews et al., 2011; Matthews etal., 2012).

2011/2012 Lake Whatcom Report Page78
3.6
4.0
4.4
0100200300400500
NO
3 (µ
g−
NL)
Event #17 (Nov 11 − 12, 2011)
Flo
w (
cfs)
Event #18 (Nov 16 − 18, 2011)
3.6
4.0
4.4
0200400600800
1000
3.5
3.7
3.9
0200400600800
1000precipitation <1 cm in 24−hr
NO
3 (µ
g−
NL)
Event #19 (Dec 16 − 20, 2011)
Flo
w (
cfs)
Event #20 (Dec 27 − 28, 2011)
3.6
4.0
4.4
0200400600800
10003.
64.
04.
4
0
500
1000
1500
2000precipitation <1 cm in 24−hr
NO
3 (µ
g−
NL)
Event #21 (Jan 25 − 26, 2012)
Flo
w (
cfs)
Event #22 (Jan 28 − 31, 2012)
3.6
4.0
4.4
0
500
1000
1500
2000
3.5
4.5
5.5
0500
1000150020002500
NO
3 (µ
g−
NL)
Event #23 (Feb 20 − 23, 2012)
Flo
w (
cfs)
Event #24 (Apr 19 − 20, 2012)
3.5
4.0
4.5
5.0
0200400600800
1000
Figure 25: Silver Beach Creek storm water monitoring results for Events 17–24:nitrate/nitrite (•) vs. stream flow (—). Note scale for each event. Results forEvents 1–16 were presented in earlier reports (Matthews et al., 2011; Matthews etal., 2012)

2011/2012 Lake Whatcom Report Page79
4.0 4.5 5.0
0.0
1.0
2.0
Flow (cfs)
Log1
0 T
SS
(m
g/L)
Kendall’s tau = 0.493p−value <0.0001
3.8 4.0 4.2 4.4 4.6 4.8 5.0
0.0
1.0
2.0
Stage (ft)
Log1
0 T
SS
(m
g/L)
Kendall’s tau = 0.536p−value <0.0001
Figure 26: Correlation between stream flow or stage height and total suspendedsolids in Silver Beach Creek (Events 17–18, 20, and 22–24). Events 19 and 21were excluded because they did not meet precipitation goals. Results for Events1–16 were presented in earlier reports (Matthews et al., 2011; Matthews et al.,2012). Kendall’sτ correlations were used because the data were not monotonic-linear; all correlations were significant.
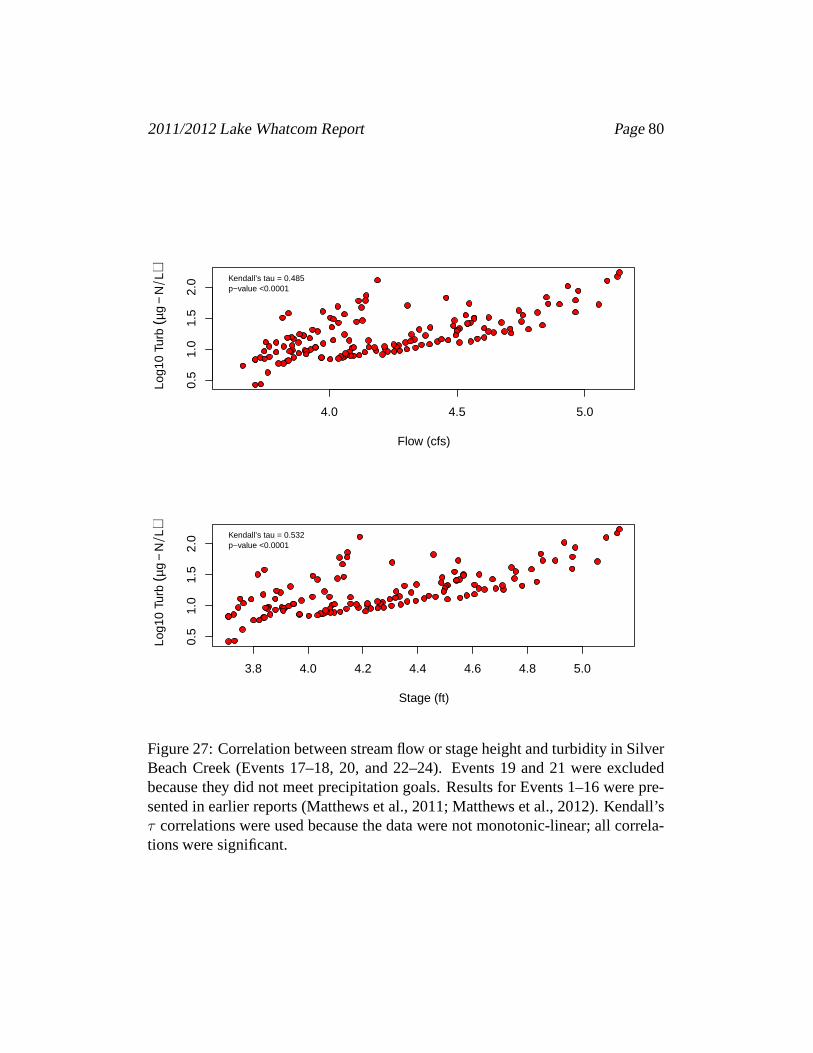
2011/2012 Lake Whatcom Report Page80
4.0 4.5 5.0
0.5
1.0
1.5
2.0
Flow (cfs)
Log1
0 Tu
rb (µ
g−
NL) Kendall’s tau = 0.485
p−value <0.0001
3.8 4.0 4.2 4.4 4.6 4.8 5.0
0.5
1.0
1.5
2.0
Stage (ft)
Log1
0 Tu
rb (µ
g−
NL) Kendall’s tau = 0.532
p−value <0.0001
Figure 27: Correlation between stream flow or stage height and turbidity in SilverBeach Creek (Events 17–18, 20, and 22–24). Events 19 and 21 were excludedbecause they did not meet precipitation goals. Results for Events 1–16 were pre-sented in earlier reports (Matthews et al., 2011; Matthews et al., 2012). Kendall’sτ correlations were used because the data were not monotonic-linear; all correla-tions were significant.

2011/2012 Lake Whatcom Report Page81
4.0 4.5 5.0
1.4
1.8
2.2
2.6
Flow (cfs)
Log1
0 T
P (µ
g−
PL) Kendall’s tau = 0.48
p−value <0.0001
3.8 4.0 4.2 4.4 4.6 4.8 5.0
1.4
1.8
2.2
2.6
Stage (ft)
Log1
0 T
P (µ
g−
PL) Kendall’s tau = 0.551
p−value <0.0001
Figure 28: Correlation between stream flow or stage height and total phosphorusin Silver Beach Creek (Events 17–18, 20, and 22–24). Events 19 and 21 wereexcluded because they did not meet precipitation goals. Results for Events 1–16were presented in earlier reports (Matthews et al., 2011; Matthews et al., 2012).Kendall’s τ correlations were used because the data were not monotonic-linear;all correlations except Event 19 & 21 were significant.

2011/2012 Lake Whatcom Report Page82
4.0 4.5 5.0
0.8
1.2
1.6
2.0
Flow (cfs)
Log1
0 S
RP
(µg
−P
L) Kendall’s tau = 0.483p−value <0.05
3.8 4.0 4.2 4.4 4.6 4.8 5.0
0.8
1.2
1.6
2.0
Stage (ft)
Log1
0 S
RP
(µg
−P
L) Kendall’s tau = 0.559p−value <0.0001
Figure 29: Correlation between stream flow or stage height and soluble phosphatein Silver Beach Creek (Events 17–18, 20, and 22–24). Events 19 and 21 wereexcluded because they did not meet precipitation goals. Results for Events 1–16were presented in earlier reports (Matthews et al., 2011; Matthews et al., 2012).Kendall’s τ correlations were used because the data were not monotonic-linear;all correlations were significant.

2011/2012 Lake Whatcom Report Page83
4.0 4.5 5.0
2.9
3.1
3.3
Flow (cfs)
Log1
0 T
N (µ
g−
NL) Kendall’s tau = 0.532
p−value <0.0001
3.8 4.0 4.2 4.4 4.6 4.8 5.0
2.9
3.1
3.3
Stage (ft)
Log1
0 T
N (µ
g−
NL) Kendall’s tau = 0.489
p−value <0.0001
Figure 30: Correlation between stream flow or stage height and total nitrogenin Silver Beach Creek (Events 17–18, 20, and 22–24). Events 19 and 21 wereexcluded because they did not meet precipitation goals. Results for Events 1–16were presented in earlier reports (Matthews et al., 2011; Matthews et al., 2012).Kendall’s τ correlations were used because the data were not monotonic-linear;all correlations were significant.

2011/2012 Lake Whatcom Report Page84
4.0 4.5 5.0
2.4
2.8
3.2
Flow (cfs)
Log1
0 N
O3
(µg
−N
L) Kendall’s tau = 0.214p−value <0.001
3.8 4.0 4.2 4.4 4.6 4.8 5.0
2.4
2.8
3.2
Stage (ft)
Log1
0 N
O3
(µg
−N
L) Kendall’s tau = 0.19p−value <0.01
Figure 31: Correlation between stream flow or stage height and nitrate in SilverBeach Creek (Events 17–18, 20, and 22–24). Events 19 and 21 were excludedbecause they did not meet precipitation goals. Results for Events 1–16 were pre-sented in earlier reports (Matthews et al., 2011; Matthews et al., 2012). Kendall’sτ correlations were used because the data were not monotonic-linear; all correla-tions were significant.

2011/2012 Lake Whatcom Report Page85
0 50 100 150 200 250 300
100
200
300
400
500
TSS (mg/L)
TP
(µg
−P
L)
Kendall’s tau = 0.868p−value <0.0001
0 50 100 150 200 250 300
050
100
150
TSS (mg/L)
Turb
(N
TU
)
Kendall’s tau = 0.866p−value <0.0001
0 50 100 150
100
200
300
400
500
Turb (NTU)
TP
(µg
−P
L)
Kendall’s tau = 0.868p−value <0.0001
Figure 32: Correlation between total suspended solids, turbidity, and total phos-phorus in Silver Beach Creek (Events 17–18, 20, and 22–24). Events 19 and 21were excluded because they did not meet precipitation goals. Results for Events1–16 were presented in earlier reports (Matthews et al., 2011; Matthews et al.,2012). Kendall’sτ correlations were used because the data were not monotonic-linear; all correlations were significant.

2011/2012 Lake Whatcom Report Page86
3.7 3.8 3.9 4.0
050
150
Flow (cfs)
TP
(µg
−P
L)
Kendall’s tau = 0.748p−value <0.0001 Event #17
3.7 3.8 3.9 4.0 4.1 4.2
020
040
0
Flow (cfs)
TP
(µg
−P
L)
Kendall’s tau = 0.711p−value <0.0001 Event #18
3.65 3.70 3.75 3.80 3.85
040
80
Flow (cfs)
TP
(µg
−P
L)
Kendall’s tau = 0.148(ns) Event #19
3.8 3.9 4.0 4.1
050
150
Flow (cfs)
TP
(µg
−P
L)
Kendall’s tau = 0.95p−value <0.0001 Event #20
4.04 4.06 4.08 4.10 4.12 4.14
040
80
Flow (cfs)
TP
(µg
−P
L)
Kendall’s tau = 0.366(ns) Event #21
4.0 4.1 4.2 4.3 4.4
040
80
Flow (cfs)
TP
(µg
−P
L)
Kendall’s tau = 0.766p−value <0.0001 Event #22
4.0 4.2 4.4 4.6 4.8 5.0
020
040
060
0
Flow (cfs)
TP
(µg
−P
L)
Kendall’s tau = 0.718p−value <0.0001 Event #23
3.6 3.8 4.0 4.2 4.4 4.6
020
040
0
Flow (cfs)
TP
(µg
−P
L)
Kendall’s tau = 0.338p−value <0.05 Event #24
Figure 33: Correlation between stream flow and total phosphorus by storm eventin Silver Beach Creek (Events 17–24). Results for Events 1–16 were presented inearlier reports (Matthews, et al., 2011; Matthews, et al., 2012). Kendall’sτ cor-relations were used because the data were not monotonic-linear; all correlationswere significant.

2011/2012 Lake Whatcom Report Page87
6 References and Related Reports
6.1 References
APHA. 2012. Standard Methods for the Examination of Water and Wastewater,22nd Edition. American Public Health Association, American Water WorksAssociation, and Water Environment Federation, Washington, DC.
Ashurst, S. 2003. Microcosm study of the accumulation of benzo(a)pyrene byLake Whatcom phytoplankton. M. S. thesis, Huxley College ofEnviron-mental Studies, Western Washington University, Bellingham, WA.
Bittner, C. W. 1993. The response of Lake Whatcom bacterioplankton to nu-trient enrichment. M. S. thesis, Huxley College of Environmental Studies,Western Washington University, Bellingham, WA.
Dingman, S. L. 1994. Physical Hydrology. Macmillan CollegePublishing Co.,New York, NY.
EPA. 1994. Method 200.7: Determination of Metals and Trace Elements inWater and Wastes by Inductively Coupled Plasma-Atomic Emission Spec-trometry, Revision 4.4, U. S. Environmental Protection Agency, WashingtonDC.
EPA. 1994. Method 200.8: Determination of Metals and Trace Elements in waterand Wastes by Inductively Coupled Plasma-Mass Spectrometry, Revision5.4, U. S. Environmental Protection Agency, Washington DC.
Groce, S. 2011. Soils as a Source of Bioavailable Phosphorusin the Lake What-com Watershed. M. S. thesis, Huxley College of the Environment, WesternWashington University, Bellingham, WA.
Hydrolab. 1997. Data Sonde 4 Water Quality Multiprobes UserManual, Revi-sion D., August 1997. Hydrolab Corporation, Austin, TX.
Lind, O. T. 1985. Handbook of Common Methods in Limnology, 2nd Edition.Kendall/Hunt Publishing Co., Dubuque, IA.
Matthews, R. A. and E. DeLuna, 2008. Metalimnetic oxygen andammoniummaxima in Lake Whatcom, Washington (USA). Northwest Science 82:18–29.

2011/2012 Lake Whatcom Report Page88
Matthews, R. A., M. Hilles, J. Vandersypen, R. Mitchell, andG. B. Matthews.2012. Lake Whatcom Monitoring Project, 2010/2011 Final Report, Febru-ary 24, 2012. Report to the City of Bellingham, WA.
Matthews, R. A., M. Hilles, J. Vandersypen, R. Mitchell, andG. B. Matthews.2011. Lake Whatcom Monitoring Project, 2009/2010 Final Report, March1, 2011. Report to the City of Bellingham, WA.
Matthews, R. A., M. Hilles, J. Vandersypen, R. J. Mitchell, and G. B. Matthews.2008. Lake Whatcom Monitoring Project 2006–2007 Final Report. Fi-nal Report prepared for the City of Bellingham Public Works Department,April, 2008, Bellingham, WA.
Matthews, R. A., M. Hilles, J. Vandersypen, R. J. Mitchell, and G. B. Matthews.2007. Lake Whatcom Monitoring Project 2005–2006 Final Report. Fi-nal Report prepared for the City of Bellingham Public Works Department,April, 2007, Bellingham, WA.
Matthews, R. A., M. Hilles, J. Vandersypen, R. J. Mitchell, and G. B. Matthews.2005. Lake Whatcom Monitoring Project 2003–2004 Final Report. Fi-nal Report prepared for the City of Bellingham Public Works Department,March, 2005, Bellingham, WA.
Matthews, R. A., M. Hilles, J. Vandersypen, R. J. Mitchell, and G. B. Matthews.2004. Lake Whatcom Monitoring Project 2002–2003 Final Report. Fi-nal Report prepared for the City of Bellingham Public Works Department,March, 2004, Bellingham, WA.
Matthews, R., M. Hilles, and G. Pelletier. 2002a. Determining trophic state inLake Whatcom, Washington (USA), a soft water lake exhibiting seasonalnitrogen limitation. Hydrobiologia 468:107–121.
Matthews, R. A., M. Hilles, J. Vandersypen, R. J. Mitchell, and G. B. Matthews.2002b. Lake Whatcom Monitoring Project 2000–2001 Final Report. Fi-nal Report prepared for the City of Bellingham Public Works Department,March, 2002, Bellingham, WA.
McDonald, K. R. 1994. Nutrient limitation of phytoplanktonin Lake Whatcom.M. S. thesis, Huxley College of Environmental Studies, Western Washing-ton University, Bellingham, WA.

2011/2012 Lake Whatcom Report Page89
Mitchell, R., G. Gabrisch, and R. Matthews. 2010. Lake Whatcom Bathymetryand Morphology. Report prepared for the City of Bellingham Public WorksDepartment, December 2, 2010, Bellingham, WA.
Pelletier, G. 1998. Dissolved oxygen in Lake Whatcom. Trendin the depletion ofhypolimnetic oxygen in basin I, 1983–1997. Washington State Departmentof Ecology Report #98–313, Olympia, WA.
Rantz, S.E., et al. (1982). Measurement and Computation of Streamflow: Vol-ume 1. Measurement of Stage and Discharge. Geological Survey Water-Supply Paper #2175, U. S. Government Printing Office, Washington, D. C.
Sung, W., B. Reilly-Matthews, D. K. O’Day, and K. Horrigan. 2000. ModelingDBP Formation. J. Amer. Water Works Assoc. 92:5–53.
Wetzel, R. G. 2001. Limnology, Third Edition. Academic Press, San Diego, CA.
YSI. 2010. YSI 6-Series Multiparameter Water Quality Sondes User Manual,Revision G, November 2012. YSI Incorporated, Yellow Springs,OH.
6.2 Related Reports
The following is a list of annual reports and special projectreports produced bythe Institute for Watershed Studies since 1987 as part of theLake Whatcom mon-itoring program sponsored by the City of Bellingham and Western WashingtonUniversity. Many of the reports are available online at http://www.wwu.edu/iws(follow links to the Lake Whatcom project under Lake Studies); older reports areavailable in the IWS library and through the city of Bellingham Public WorksDepartment. This list does not include research reports, student projects, or pub-lications that were not prepared specifically for the City ofBellingham. ContactIWS for information about additional Lake Whatcom publications.
Annual monitoring reports:
Matthews, R. A., M. Hilles, J. Vandersypen, R. Mitchell, andG. B. Matthews.2012. Lake Whatcom Monitoring Project, 2010/2011 Final Report, Febru-ary 24, 2012. Report to the City of Bellingham, WA.
2011/2012 Lake Whatcom Report Page90
Matthews, R. A., M. Hilles, J. Vandersypen, R. Mitchell, andG. B. Matthews.Lake Whatcom Monitoring Project, 2009/2010 Final Report, March 1,2011. Report to the City of Bellingham, WA.
Matthews, R. A., M. Hilles, J. Vandersypen, R. Mitchell, andG. B. Matthews.Lake Whatcom Monitoring Project, 2008/2009 Final Report, March 10,2010. Report to the City of Bellingham, WA.
Matthews, R. A., M. Hilles, J. Vandersypen, R. Mitchell, andG. B. Matthews.Lake Whatcom Monitoring Project, 2007/2008 Final Report, March 19,2009. Report to the City of Bellingham, WA.
Matthews, R. A., M. Hilles, J. Vandersypen, R. Mitchell, andG. B. Matthews.Lake Whatcom Monitoring Project, 2006/2007 Final Report, April 2, 2008.Report to the City of Bellingham, WA.
Matthews, R. A., M. Hilles, J. Vandersypen, R. Mitchell, andG. B. Matthews.Lake Whatcom Monitoring Project, 2005/2006 Final Report, April 11,2007. Report to the City of Bellingham, WA.
Matthews, R. A., M. Hilles, J. Vandersypen, R. Mitchell, andG. B. Matthews.Lake Whatcom Monitoring Project, 2004/2005 Final Report, March 30,2006. Report to the City of Bellingham, WA.
Matthews, R. A., M. Hilles, J. Vandersypen, R. Mitchell, andG. B. Matthews.Lake Whatcom Monitoring Project, 2003/2004 Final Report, March 15,2005. Report to the City of Bellingham, WA.
Matthews, R. A., M. Hilles, J. Vandersypen, R. Mitchell, andG. B. Matthews.Lake Whatcom Monitoring Project, 2002/2003 Final Report, April 5, 2004.Report to the City of Bellingham, WA.
Matthews, R. A., M. Hilles, J. Vandersypen, R. Mitchell, andG. B. Matthews.Lake Whatcom Monitoring Project, 2001/2002 Final Report, April 21,2003. Report to the City of Bellingham, WA.
Matthews, R. A., M. Hilles, J. Vandersypen, R. Mitchell, andG. B. Matthews.Lake Whatcom Monitoring Project, 2000/2001 Final Report, March 15,2002. Report to the City of Bellingham, WA.

2011/2012 Lake Whatcom Report Page91
Matthews, R. A., M. Hilles, J. Vandersypen, R. Mitchell, andG. B. Matthews.Lake Whatcom Monitoring Project, 1999/2000 Final Report, March 23,2001. Report to the City of Bellingham, WA.
Matthews, R. A., M. Hilles, J. Vandersypen, R. Mitchell, andG. B. Matthews.Lake Whatcom Monitoring Project, 1998/99 Final Report, March 15, 2000.Report to the City of Bellingham, WA.
Matthews, R. A., M. Hilles and G. B. Matthews. Lake Whatcom MonitoringProject, 1997/98 Final Report, April 12, 1999. Report to theCity of Belling-ham, WA.
Matthews, R. A., M. Hilles and G. B. Matthews. Lake Whatcom MonitoringProject, 1996/97 Final Report, February 10, 1998. Report tothe City ofBellingham, WA.
Matthews, R. A., M. Hilles and G. B. Matthews. Lake Whatcom MonitoringProject, 1995/96 Final Report, March 24, 1997. Report to theCity ofBellingham, WA.
Matthews, R. A., M. Hilles and G. B. Matthews. Lake Whatcom MonitoringProject, 1994/95 Final Report, February 9, 1996. Report to the City ofBellingham, WA.
Matthews, R. A. and G. B. Matthews. Lake Whatcom Monitoring Project, 1993–1994 Final Report, March 2, 1995. Report to the City of Bellingham, WA.
Matthews, R. and G. Matthews. Lake Whatcom Monitoring Project, 1992–1993Final Report, January 31, 1994. Report to the City of Bellingham, WA.
Matthews, R. and G. Matthews. Lake Whatcom Monitoring Project, 1991–1992Final Report, March 19, 1993. Report to the City of Bellingham, WA.
Rector, J. M. and R. A. Matthews. Lake Whatcom Monitoring Program, Au-gust 1987 Final Report. Institute for Watershed Studies Report, WesternWashington University, Bellingham, WA.

2011/2012 Lake Whatcom Report Page92
Other Lake Whatcom reports:
Matthews, R. A., M. Hilles and J. Vandersypen. Austin Creek and Beaver CreekSampling Project, October 11, 2005. Report to the City of Bellingham, WA.
Matthews, R. A. Relationship between Drinking Water Treatment Chemical Us-age and Lake Whatcom water Quality and Algal Data, October 4,2004.Report to the City of Bellingham, WA.
Matthews, R. A. Strawberry Sill Water Quality Analysis, March 19, 2004. Re-port to the City of Bellingham, WA.
Matthews, R. A., M. Saunders, M A. Hilles, and J. Vandersypen. Park Place WetPond Monitoring Project, 1994–2000 Summary Report, February 2, 2001.Report to the City of Bellingham, WA.
Carpenter, M. R., C. A. Suczek, and R. A. Matthews. Mirror Lake SedimentationStudy Summary Report, February, 1992. Report to the City of Bellingham,WA.
Walker, S., R. Matthews, and G. Matthews. Lake Whatcom StormRunoffProject, Final Report, January 13, 1992. Report to the City of Bellingham,WA.
Creahan, K., T. Loranger, B. Gall, D. Brakke, and R. Matthews. Lake WhatcomWatershed Management Plan, December, 1986, revised July, 1987. Institutefor Watershed Studies Report, Western Washington University, Bellingham,WA.

2011/2012 Lake Whatcom Report Page93
A Site Descriptions
Figures A1–A3 (pages 97–99) show the locations of the current monitoring sitesand Table A1 (page 96) lists the approximate GPS coordinatesfor the lake andcreek sites. All site descriptions, including text descriptions and GPS coordinates,are approximate because of variability in satellite coverage, GPS unit sensitivity,boat movement, stream bank or channel alterations, stream flow rates, weatherconditions, and other factors that affect sampling location. Text descriptions con-tain references to local landmarks that may change over time. For detailed infor-mation about exact sampling locations, contact IWS.
A.1 Lake Whatcom Monitoring Sites
Site 1is located at 20 m in the north central portion of basin 1 alonga straight linefrom the Bloedel Donovan boat launch to the house located at 171 E. North ShoreRd. The depth at Site 1 should be at least 25 meters.
Site 2is located at 18–20 m in the south central portion of basin 2 just west of theintersection of a line joining the boat house at 73 Strawberry Point and the pointof Geneva sill.
TheIntake Site location is omitted from this report at the City’s request.
Site 3 is located in the northern portion of basin 3, mid-basin justnorth of a linebetween the old railroad bridge and Lakewood. The depth at Site 3 should be atleast 80 m.
Site 4 is located in the southern portion of basin 3, mid-basin, andjust north ofSouth Bay. The depth at Site 4 should be at least 90 m.
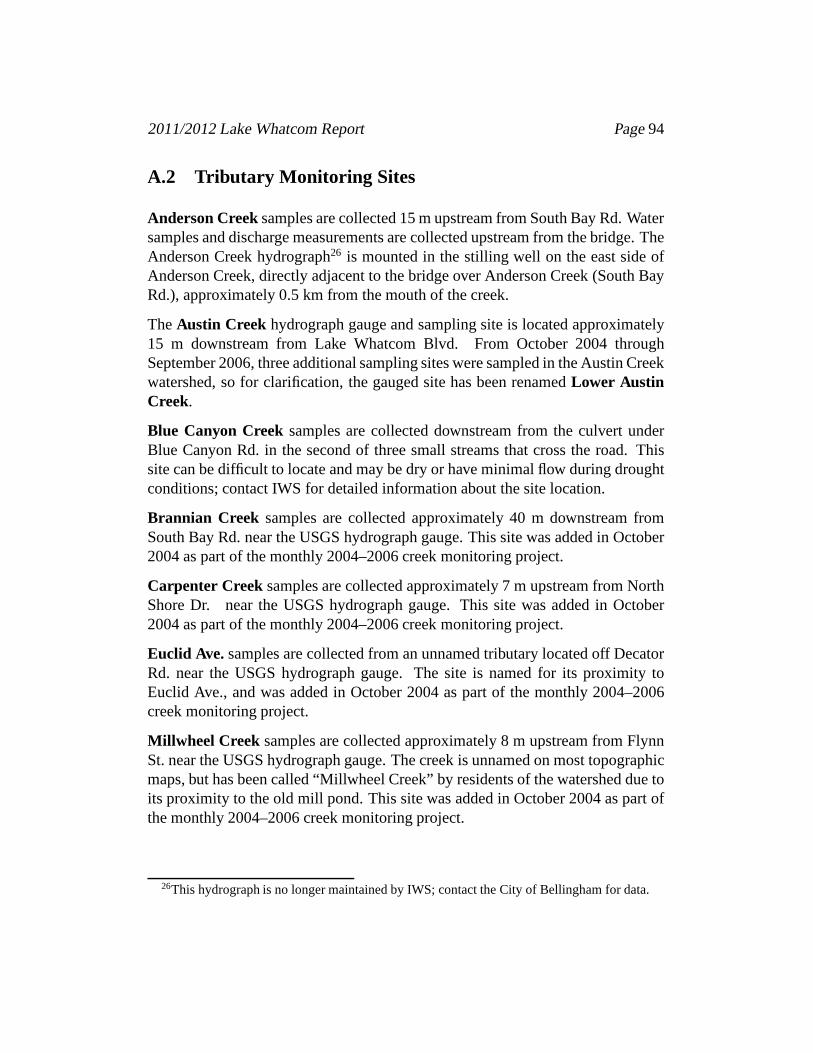
2011/2012 Lake Whatcom Report Page94
A.2 Tributary Monitoring Sites
Anderson Creeksamples are collected 15 m upstream from South Bay Rd. Watersamples and discharge measurements are collected upstreamfrom the bridge. TheAnderson Creek hydrograph26 is mounted in the stilling well on the east side ofAnderson Creek, directly adjacent to the bridge over Anderson Creek (South BayRd.), approximately 0.5 km from the mouth of the creek.
TheAustin Creek hydrograph gauge and sampling site is located approximately15 m downstream from Lake Whatcom Blvd. From October 2004 throughSeptember 2006, three additional sampling sites were sampled in the Austin Creekwatershed, so for clarification, the gauged site has been renamedLower AustinCreek.
Blue Canyon Creeksamples are collected downstream from the culvert underBlue Canyon Rd. in the second of three small streams that cross the road. Thissite can be difficult to locate and may be dry or have minimal flow during droughtconditions; contact IWS for detailed information about thesite location.
Brannian Creek samples are collected approximately 40 m downstream fromSouth Bay Rd. near the USGS hydrograph gauge. This site was added in October2004 as part of the monthly 2004–2006 creek monitoring project.
Carpenter Creek samples are collected approximately 7 m upstream from NorthShore Dr. near the USGS hydrograph gauge. This site was addedin October2004 as part of the monthly 2004–2006 creek monitoring project.
Euclid Ave. samples are collected from an unnamed tributary located offDecatorRd. near the USGS hydrograph gauge. The site is named for its proximity toEuclid Ave., and was added in October 2004 as part of the monthly 2004–2006creek monitoring project.
Millwheel Creek samples are collected approximately 8 m upstream from FlynnSt. near the USGS hydrograph gauge. The creek is unnamed on most topographicmaps, but has been called “Millwheel Creek” by residents of the watershed due toits proximity to the old mill pond. This site was added in October 2004 as part ofthe monthly 2004–2006 creek monitoring project.
26This hydrograph is no longer maintained by IWS; contact the City of Bellingham for data.

2011/2012 Lake Whatcom Report Page95
Olsen Creeksamples are collected just downstream from North Shore Dr. nearthe USGS hydrograph gauge. This site was added in October 2004 as part of themonthly 2004–2006 creek monitoring project.
Park Place samples are collected from the storm drain that empties intoLakeWhatcom at Park Place Ln. Samples from this site include outlet flow from thePark Place storm water treatment facility.
Silver Beach Creeksamples are collected approximately 15 m upstream from theculvert under North Shore Rd.
TheSmith Creek hydrograph is mounted on the south wall of a sandstone bluffdirectly underneath the bridge over Smith Creek (North Shore Rd.) approximately1 km upstream from the mouth of the creek. Water samples are collected at thegaging station approximately 15 m downstream from North Shore Dr.
Whatcom Creek samples are collected approximately 2 m downstream from thefoot bridge below the Lake Whatcom outlet spillway. This site was added inOctober 2004 as part of the monthly 2004–2006 creek monitoring project.
A.3 Storm Water Monitoring Sites
The storm water monitoring program was revised in 2009/2010to focus oncollecting baseline data at the Silver Beach Creek outlet and the North ShoreDrive overlay. Both sites were monitored in 2009/2010 (see Matthews, et al.,2011). During the 2010/2011 and 2011/2012 monitoring periods the emphasiswas on collecting additional storm water samples from Silver Beach Creek. The2010/2011 Silver Beach Creek runoff data are described by Matthew, et al. (2012).For information about other storm water sites that have beenmonitored by IWS,refer to the annual reports listed in Section 6.2 (page 89).
Silver Beachstorm runoff samples were collected at the USGS gauging sitebe-hind the house at 3007 Maynard Place and approximately 150 m upstream fromthe culvert at North Shore Dr.

2011/2012 Lake Whatcom Report Page96
Lake Sites Latitude (◦N) Longitude (◦W)Site 1 48.4536 122.2438Intake (GPS omitted)Site 2 48.4436 122.2254Site 3 48.4416 122.2009Site 4 48.4141 122.1815
Creek Sites Latitude (◦N) Longitude (◦W)Anderson 48.67335 122.26751Austin (lower) 48.71312 122.33076Blue Canyon 48.68532 122.28295Brannian 48.66910 122.27949Carpenter 48.75432 122.35449Euclid 48.74844 122.41005Millwheel 48.75507 122.41635Olsen 48.75129 122.35353Park Place 48.76894 122.40915Silver Beach 48.76859 122.40700Smith 48.73191 122.30864Whatcom 48.75715 122.42229
Table A1: Approximate GPS coordinates for Lake Whatcom sampling sites.

2011/2012 Lake Whatcom Report Page97
1 mi
1 km
This figure was created using source files provided by Gerald Gabrischusing data obtained from Western Washington University, Skagit County,the Nooksack Tribe, and the City of Bellingham.
Site 2(basin 2)
Site 3(basin 3)
Site 4(basin 3)
Site 1(basin 1)
N
Intake
Figure A1: Lake Whatcom lake sampling sites.
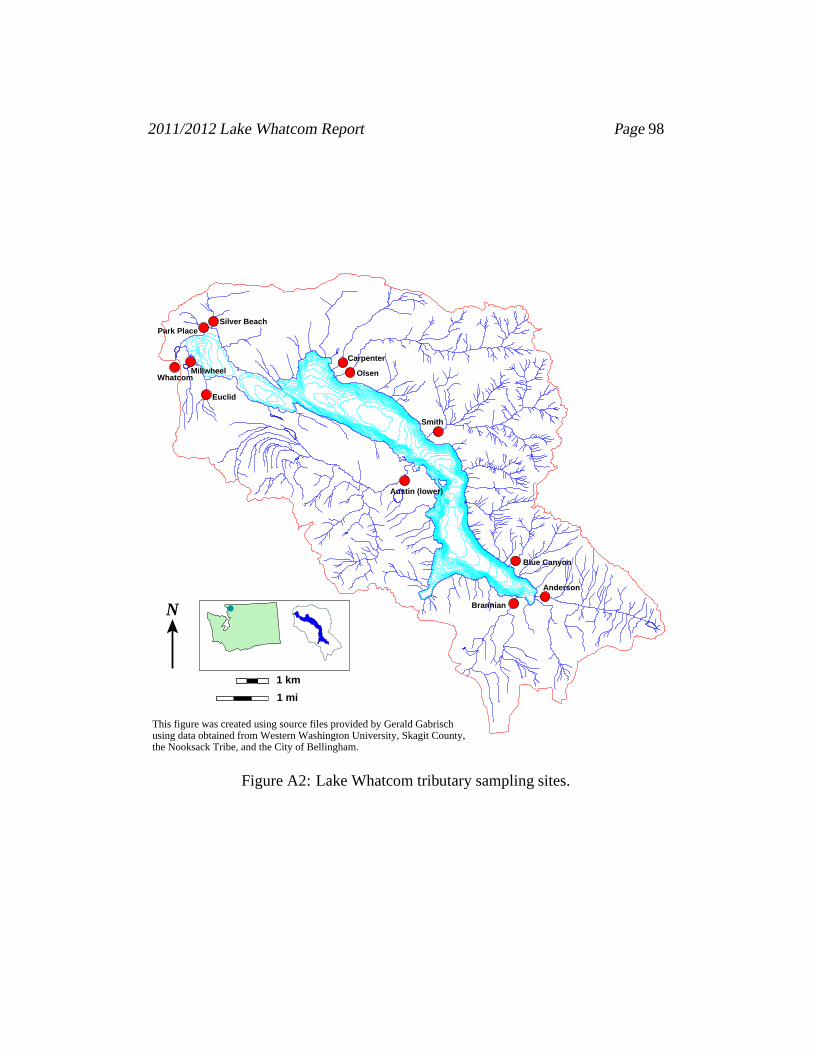
2011/2012 Lake Whatcom Report Page98
This figure was created using source files provided by Gerald Gabrischusing data obtained from Western Washington University, Skagit County,the Nooksack Tribe, and the City of Bellingham.
1 mi
1 km
N
Euclid
WhatcomMillwheel
Park PlaceSilver Beach
Carpenter
Olsen
Smith
Blue Canyon
Anderson
Brannian
Austin (lower)
Figure A2: Lake Whatcom tributary sampling sites.

2011/2012 Lake Whatcom Report Page99
This figure was created using source files provided by Gerald Gabrischusing data obtained from Western Washington University, Skagit County,the Nooksack Tribe, and the City of Bellingham.
Silver Beach Creek
Figure A3: Silver Beach Creek storm water site.

2011/2012 Lake Whatcom Report Page100
(This page blank)

2011/2012 Lake Whatcom Report Page101
B Long-Term Water Quality Figures
The current and historic Lake Whatcom water quality data areplotted on the fol-lowing pages. Detection limits and abbreviations for each parameter are listed inTable 1 (page 16).
The historic detection limits for each parameter were estimated based on recom-mended lower detection ranges (APHA, 1998; Hydrolab, 1997;Lind, 1985), in-strument limitations, and analyst judgment on the lowest repeatable concentrationfor each test. Over time, some analytical techniques have improved so that currentdetection limits are lower than defined below (see current detection limits in Table1, page 16). Because the Lake Whatcom data set includes long-term monitoringdata that have been collected using a variety of analytical techniques, this reportsets conservative historic detection limits to allow comparisons between all years.
In the Lake Whatcom report, unless indicated, no data substitutions are used forbelow detection values (“bdl” data). Instead, we identify summary statistics thatinclude bdl values, and, if appropriate, discuss the implications of including thesevalues in the analysis.
Because of the length of the data record, many of the figures reflect trends relatedto improvements in analytical techniques over time, and introduction of increas-ingly sensitive field equipment (see, for example, Figures B66–B70, pages 169–173, which show the effect of using increasingly sensitive conductivity probes).These changes generally result in a reduction in analyticalvariability, and some-times result in lower detection limits.

2011/2012 Lake Whatcom Report Page102
B.1 Monthly Hydrolab Profiles

2011/2012 Lake Whatcom Report Page103
5 10 15 20
−25
−20
−15
−10
−5
0
Temperature (C)
Dep
th (
m)
5 6 7 8 9−
25−
20−
15−
10−
50
pH
Dep
th (
m)
40 60 80 100 120
−25
−20
−15
−10
−5
0
Conductivity (uS/cm)
Dep
th (
m)
0 2 4 6 8 10 12 14
−25
−20
−15
−10
−5
0
Dissolved Oxygen (mg/L)
Dep
th (
m)
Figure B1: Lake Whatcom Hydrolab profiles for Site 1, October4, 2011. Con-ductivity profile is not available due to equipment malfunction; discrete resultswere generated from water samples measured in the laboratory.

2011/2012 Lake Whatcom Report Page104
5 10 15 20
−25
−20
−15
−10
−5
0
Temperature (C)
Dep
th (
m)
5 6 7 8 9−
25−
20−
15−
10−
50
pH
Dep
th (
m)
40 60 80 100 120
−25
−20
−15
−10
−5
0
Conductivity (uS/cm)
Dep
th (
m)
0 2 4 6 8 10 12 14
−25
−20
−15
−10
−5
0
Dissolved Oxygen (mg/L)
Dep
th (
m)
Figure B2: Lake Whatcom Hydrolab profiles for Site 2, October4, 2011. Con-ductivity profile is not available due to equipment malfunction; discrete resultswere generated from water samples measured in the laboratory.

2011/2012 Lake Whatcom Report Page105
5 10 15 20
−25
−20
−15
−10
−5
0
Temperature (C)
Dep
th (
m)
5 6 7 8 9−
25−
20−
15−
10−
50
pH
Dep
th (
m)
40 60 80 100 120
−25
−20
−15
−10
−5
0
Conductivity (uS/cm)
Dep
th (
m)
0 2 4 6 8 10 12 14
−25
−20
−15
−10
−5
0
Dissolved Oxygen (mg/L)
Dep
th (
m)
Figure B3: Lake Whatcom Hydrolab profiles for the Intake, October 4, 2011.Conductivity profile is not available due to equipment malfunction; discrete re-sults were generated from water samples measured in the laboratory.

2011/2012 Lake Whatcom Report Page106
5 10 15 20
−10
0−
80−
60−
40−
200
Temperature (C)
Dep
th (
m)
5 6 7 8 9−
100
−80
−60
−40
−20
0
pH
Dep
th (
m)
40 60 80 100 120
−10
0−
80−
60−
40−
200
Conductivity (uS/cm)
Dep
th (
m)
0 2 4 6 8 10 12 14
−10
0−
80−
60−
40−
200
Dissolved Oxygen (mg/L)
Dep
th (
m)
Figure B4: Lake Whatcom Hydrolab profiles for Site 3, October5, 2011. Con-ductivity profile is not available due to equipment malfunction; discrete resultswere generated from water samples measured in the laboratory.

2011/2012 Lake Whatcom Report Page107
5 10 15 20
−10
0−
80−
60−
40−
200
Temperature (C)
Dep
th (
m)
5 6 7 8 9−
100
−80
−60
−40
−20
0
pH
Dep
th (
m)
40 60 80 100 120
−10
0−
80−
60−
40−
200
Conductivity (uS/cm)
Dep
th (
m)
0 2 4 6 8 10 12 14
−10
0−
80−
60−
40−
200
Dissolved Oxygen (mg/L)
Dep
th (
m)
Figure B5: Lake Whatcom Hydrolab profiles for Site 4, October5, 2011. Con-ductivity profile is not available due to equipment malfunction; discrete resultswere generated from water samples measured in the laboratory.

2011/2012 Lake Whatcom Report Page108
5 10 15 20
−25
−20
−15
−10
−5
0
Temperature (C)
Dep
th (
m)
5 6 7 8 9
−25
−20
−15
−10
−5
0
pH
Dep
th (
m)
40 60 80 100 120
−25
−20
−15
−10
−5
0
Conductivity (uS/cm)
Dep
th (
m)
0 2 4 6 8 10 12 14
−25
−20
−15
−10
−5
0
Dissolved Oxygen (mg/L)
Dep
th (
m)
Figure B6: Lake Whatcom YSI profiles for Site 1, November 1, 2011.

2011/2012 Lake Whatcom Report Page109
5 10 15 20
−25
−20
−15
−10
−5
0
Temperature (C)
Dep
th (
m)
5 6 7 8 9
−25
−20
−15
−10
−5
0
pH
Dep
th (
m)
40 60 80 100 120
−25
−20
−15
−10
−5
0
Conductivity (uS/cm)
Dep
th (
m)
0 2 4 6 8 10 12 14
−25
−20
−15
−10
−5
0
Dissolved Oxygen (mg/L)
Dep
th (
m)
Figure B7: Lake Whatcom YSI profiles for Site 2, November 1, 2011.

2011/2012 Lake Whatcom Report Page110
5 10 15 20
−25
−20
−15
−10
−5
0
Temperature (C)
Dep
th (
m)
5 6 7 8 9
−25
−20
−15
−10
−5
0
pH
Dep
th (
m)
40 60 80 100 120
−25
−20
−15
−10
−5
0
Conductivity (uS/cm)
Dep
th (
m)
0 2 4 6 8 10 12 14
−25
−20
−15
−10
−5
0
Dissolved Oxygen (mg/L)
Dep
th (
m)
Figure B8: Lake Whatcom YSI profiles for the Intake, November1, 2011.

2011/2012 Lake Whatcom Report Page111
5 10 15 20
−10
0−
80−
60−
40−
200
Temperature (C)
Dep
th (
m)
5 6 7 8 9
−10
0−
80−
60−
40−
200
pH
Dep
th (
m)
40 60 80 100 120
−10
0−
80−
60−
40−
200
Conductivity (uS/cm)
Dep
th (
m)
0 2 4 6 8 10 12 14
−10
0−
80−
60−
40−
200
Dissolved Oxygen (mg/L)
Dep
th (
m)
Figure B9: Lake Whatcom YSI profiles for Site 3, November 2, 2011.

2011/2012 Lake Whatcom Report Page112
5 10 15 20
−10
0−
80−
60−
40−
200
Temperature (C)
Dep
th (
m)
5 6 7 8 9
−10
0−
80−
60−
40−
200
pH
Dep
th (
m)
40 60 80 100 120
−10
0−
80−
60−
40−
200
Conductivity (uS/cm)
Dep
th (
m)
0 2 4 6 8 10 12 14
−10
0−
80−
60−
40−
200
Dissolved Oxygen (mg/L)
Dep
th (
m)
Figure B10: Lake Whatcom YSI profiles for Site 4, November 2, 2011.

2011/2012 Lake Whatcom Report Page113
5 10 15 20
−25
−20
−15
−10
−5
0
Temperature (C)
Dep
th (
m)
5 6 7 8 9
−25
−20
−15
−10
−5
0
pH
Dep
th (
m)
40 60 80 100 120
−25
−20
−15
−10
−5
0
Conductivity (uS/cm)
Dep
th (
m)
0 2 4 6 8 10 12 14
−25
−20
−15
−10
−5
0
Dissolved Oxygen (mg/L)
Dep
th (
m)
Figure B11: Lake Whatcom YSI profiles for Site 1, December 7, 2011.

2011/2012 Lake Whatcom Report Page114
5 10 15 20
−25
−20
−15
−10
−5
0
Temperature (C)
Dep
th (
m)
5 6 7 8 9
−25
−20
−15
−10
−5
0
pH
Dep
th (
m)
40 60 80 100 120
−25
−20
−15
−10
−5
0
Conductivity (uS/cm)
Dep
th (
m)
0 2 4 6 8 10 12 14
−25
−20
−15
−10
−5
0
Dissolved Oxygen (mg/L)
Dep
th (
m)
Figure B12: Lake Whatcom YSI profiles for Site 2, December 7, 2011.

2011/2012 Lake Whatcom Report Page115
5 10 15 20
−25
−20
−15
−10
−5
0
Temperature (C)
Dep
th (
m)
5 6 7 8 9
−25
−20
−15
−10
−5
0
pH
Dep
th (
m)
40 60 80 100 120
−25
−20
−15
−10
−5
0
Conductivity (uS/cm)
Dep
th (
m)
0 2 4 6 8 10 12 14
−25
−20
−15
−10
−5
0
Dissolved Oxygen (mg/L)
Dep
th (
m)
Figure B13: Lake Whatcom YSI profiles for the Intake, December 7, 2011.

2011/2012 Lake Whatcom Report Page116
5 10 15 20
−10
0−
80−
60−
40−
200
Temperature (C)
Dep
th (
m)
5 6 7 8 9−
100
−80
−60
−40
−20
0
pH
Dep
th (
m)
40 60 80 100 120
−10
0−
80−
60−
40−
200
Conductivity (uS/cm)
Dep
th (
m)
0 2 4 6 8 10 12 14
−10
0−
80−
60−
40−
200
Dissolved Oxygen (mg/L)
Dep
th (
m)
Figure B14: Lake Whatcom YSI profiles for Site 3, December 6, 2011. The lowoxygen value at 80 meters was most likely due to incomplete water column mixingfollowing recent destratification.

2011/2012 Lake Whatcom Report Page117
5 10 15 20
−10
0−
80−
60−
40−
200
Temperature (C)
Dep
th (
m)
5 6 7 8 9
−10
0−
80−
60−
40−
200
pH
Dep
th (
m)
40 60 80 100 120
−10
0−
80−
60−
40−
200
Conductivity (uS/cm)
Dep
th (
m)
0 2 4 6 8 10 12 14
−10
0−
80−
60−
40−
200
Dissolved Oxygen (mg/L)
Dep
th (
m)
Figure B15: Lake Whatcom YSI profiles for Site 4, December 6, 2011.

2011/2012 Lake Whatcom Report Page118
5 10 15 20
−25
−20
−15
−10
−5
0
Temperature (C)
Dep
th (
m)
5 6 7 8 9
−25
−20
−15
−10
−5
0
pH
Dep
th (
m)
40 60 80 100 120
−25
−20
−15
−10
−5
0
Conductivity (uS/cm)
Dep
th (
m)
0 2 4 6 8 10 12 14
−25
−20
−15
−10
−5
0
Dissolved Oxygen (mg/L)
Dep
th (
m)
Figure B16: Lake Whatcom YSI profiles for Site 1, February 3, 2012.

2011/2012 Lake Whatcom Report Page119
5 10 15 20
−25
−20
−15
−10
−5
0
Temperature (C)
Dep
th (
m)
5 6 7 8 9
−25
−20
−15
−10
−5
0
pH
Dep
th (
m)
40 60 80 100 120
−25
−20
−15
−10
−5
0
Conductivity (uS/cm)
Dep
th (
m)
0 2 4 6 8 10 12 14
−25
−20
−15
−10
−5
0
Dissolved Oxygen (mg/L)
Dep
th (
m)
Figure B17: Lake Whatcom YSI profiles for Site 2, February 3, 2012.

2011/2012 Lake Whatcom Report Page120
5 10 15 20
−25
−20
−15
−10
−5
0
Temperature (C)
Dep
th (
m)
5 6 7 8 9
−25
−20
−15
−10
−5
0
pH
Dep
th (
m)
40 60 80 100 120
−25
−20
−15
−10
−5
0
Conductivity (uS/cm)
Dep
th (
m)
0 2 4 6 8 10 12 14
−25
−20
−15
−10
−5
0
Dissolved Oxygen (mg/L)
Dep
th (
m)
Figure B18: Lake Whatcom YSI profiles for the Intake, February 3, 2012.
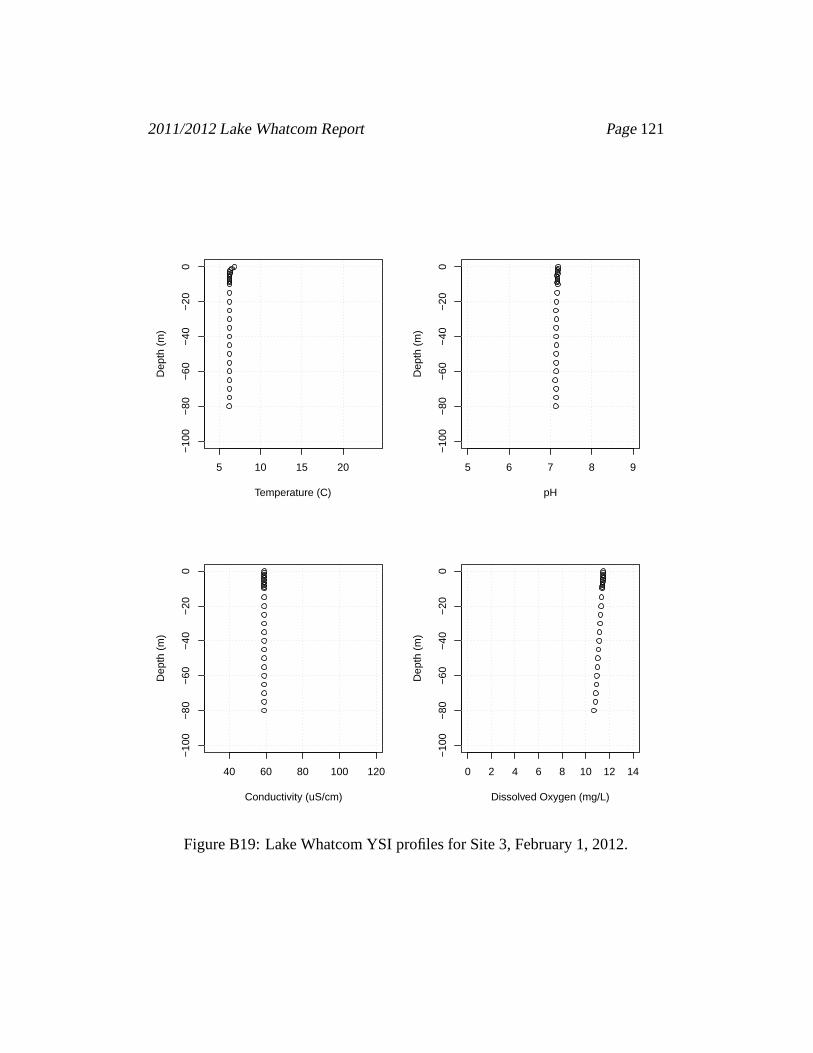
2011/2012 Lake Whatcom Report Page121
5 10 15 20
−10
0−
80−
60−
40−
200
Temperature (C)
Dep
th (
m)
5 6 7 8 9
−10
0−
80−
60−
40−
200
pH
Dep
th (
m)
40 60 80 100 120
−10
0−
80−
60−
40−
200
Conductivity (uS/cm)
Dep
th (
m)
0 2 4 6 8 10 12 14
−10
0−
80−
60−
40−
200
Dissolved Oxygen (mg/L)
Dep
th (
m)
Figure B19: Lake Whatcom YSI profiles for Site 3, February 1, 2012.

2011/2012 Lake Whatcom Report Page122
5 10 15 20
−10
0−
80−
60−
40−
200
Temperature (C)
Dep
th (
m)
5 6 7 8 9
−10
0−
80−
60−
40−
200
pH
Dep
th (
m)
40 60 80 100 120
−10
0−
80−
60−
40−
200
Conductivity (uS/cm)
Dep
th (
m)
0 2 4 6 8 10 12 14
−10
0−
80−
60−
40−
200
Dissolved Oxygen (mg/L)
Dep
th (
m)
Figure B20: Lake Whatcom YSI profiles for Site 4, February 1, 2012.

2011/2012 Lake Whatcom Report Page123
5 10 15 20
−25
−20
−15
−10
−5
0
Temperature (C)
Dep
th (
m)
5 6 7 8 9
−25
−20
−15
−10
−5
0
pH
Dep
th (
m)
40 60 80 100 120
−25
−20
−15
−10
−5
0
Conductivity (uS/cm)
Dep
th (
m)
0 2 4 6 8 10 12 14
−25
−20
−15
−10
−5
0
Dissolved Oxygen (mg/L)
Dep
th (
m)
Figure B21: Lake Whatcom YSI profiles for Site 1, April 14, 2012.
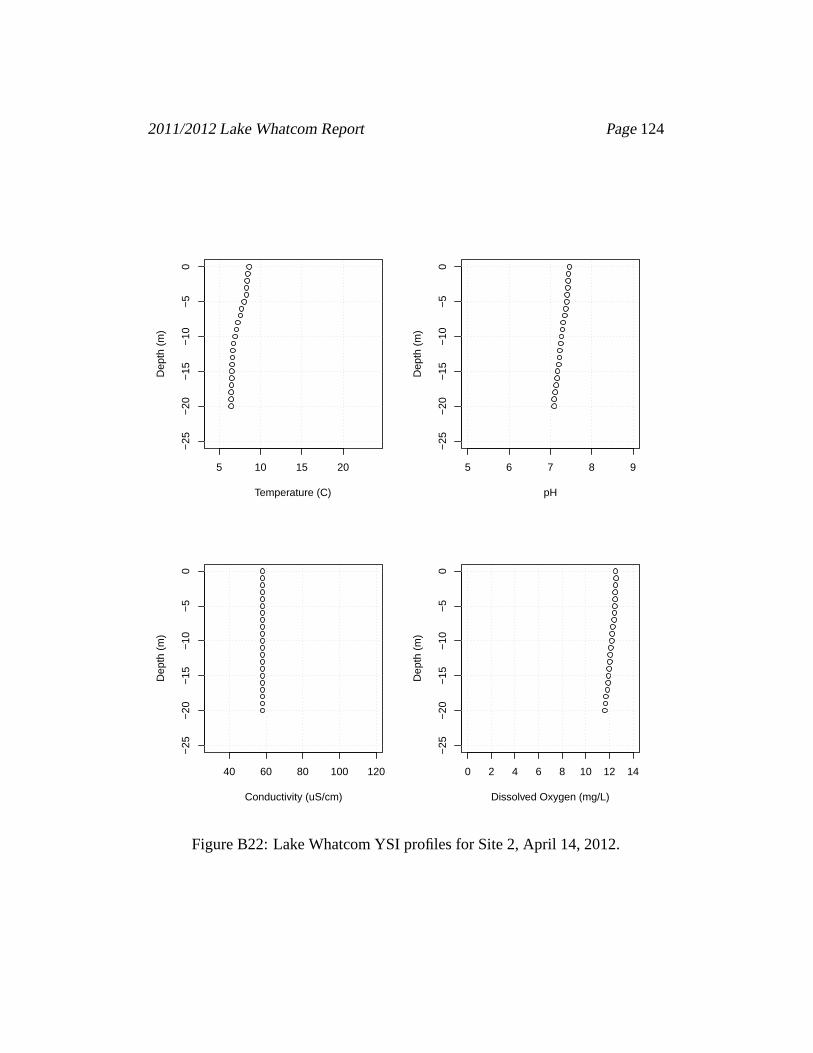
2011/2012 Lake Whatcom Report Page124
5 10 15 20
−25
−20
−15
−10
−5
0
Temperature (C)
Dep
th (
m)
5 6 7 8 9
−25
−20
−15
−10
−5
0
pH
Dep
th (
m)
40 60 80 100 120
−25
−20
−15
−10
−5
0
Conductivity (uS/cm)
Dep
th (
m)
0 2 4 6 8 10 12 14
−25
−20
−15
−10
−5
0
Dissolved Oxygen (mg/L)
Dep
th (
m)
Figure B22: Lake Whatcom YSI profiles for Site 2, April 14, 2012.
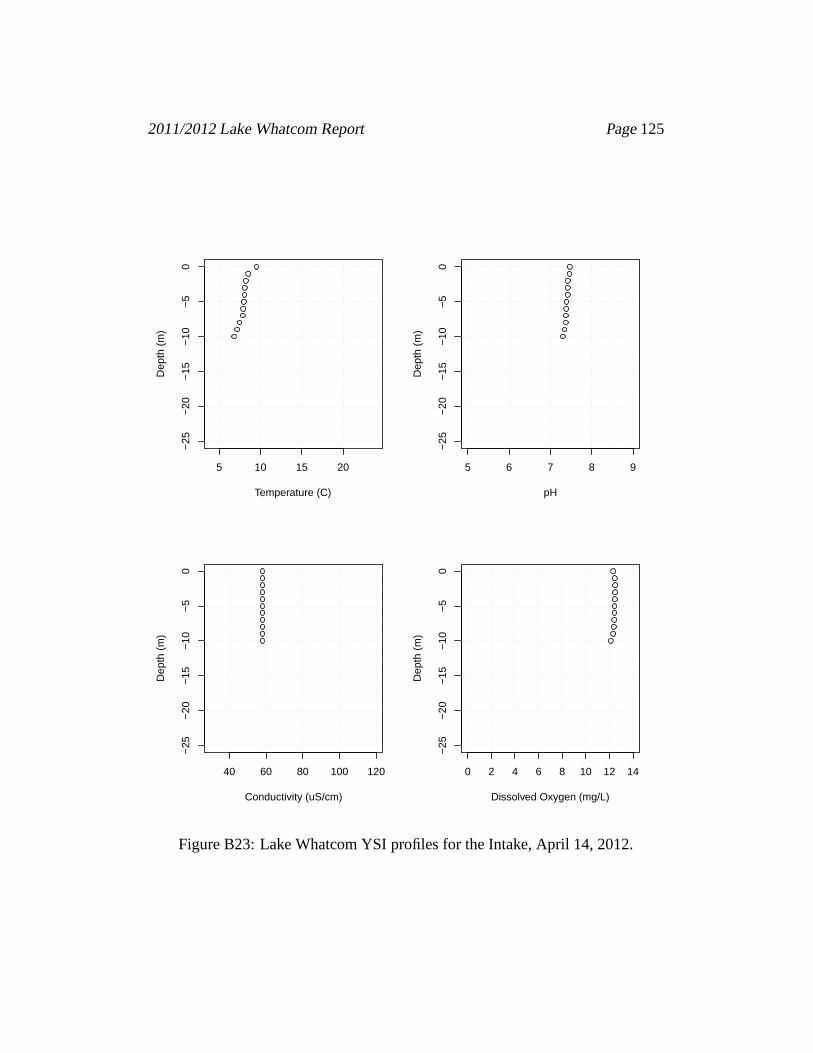
2011/2012 Lake Whatcom Report Page125
5 10 15 20
−25
−20
−15
−10
−5
0
Temperature (C)
Dep
th (
m)
5 6 7 8 9
−25
−20
−15
−10
−5
0
pH
Dep
th (
m)
40 60 80 100 120
−25
−20
−15
−10
−5
0
Conductivity (uS/cm)
Dep
th (
m)
0 2 4 6 8 10 12 14
−25
−20
−15
−10
−5
0
Dissolved Oxygen (mg/L)
Dep
th (
m)
Figure B23: Lake Whatcom YSI profiles for the Intake, April 14, 2012.

2011/2012 Lake Whatcom Report Page126
5 10 15 20
−10
0−
80−
60−
40−
200
Temperature (C)
Dep
th (
m)
5 6 7 8 9
−10
0−
80−
60−
40−
200
pH
Dep
th (
m)
40 60 80 100 120
−10
0−
80−
60−
40−
200
Conductivity (uS/cm)
Dep
th (
m)
0 2 4 6 8 10 12 14
−10
0−
80−
60−
40−
200
Dissolved Oxygen (mg/L)
Dep
th (
m)
Figure B24: Lake Whatcom YSI profiles for Site 3, April 10, 2012.

2011/2012 Lake Whatcom Report Page127
5 10 15 20
−10
0−
80−
60−
40−
200
Temperature (C)
Dep
th (
m)
5 6 7 8 9
−10
0−
80−
60−
40−
200
pH
Dep
th (
m)
40 60 80 100 120
−10
0−
80−
60−
40−
200
Conductivity (uS/cm)
Dep
th (
m)
0 2 4 6 8 10 12 14
−10
0−
80−
60−
40−
200
Dissolved Oxygen (mg/L)
Dep
th (
m)
Figure B25: Lake Whatcom YSI profiles for Site 4, April 10, 2012.

2011/2012 Lake Whatcom Report Page128
5 10 15 20
−25
−20
−15
−10
−5
0
Temperature (C)
Dep
th (
m)
5 6 7 8 9
−25
−20
−15
−10
−5
0
pH
Dep
th (
m)
40 60 80 100 120
−25
−20
−15
−10
−5
0
Conductivity (uS/cm)
Dep
th (
m)
0 2 4 6 8 10 12 14
−25
−20
−15
−10
−5
0
Dissolved Oxygen (mg/L)
Dep
th (
m)
Figure B26: Lake Whatcom YSI profiles for Site 1, May 10, 2012.
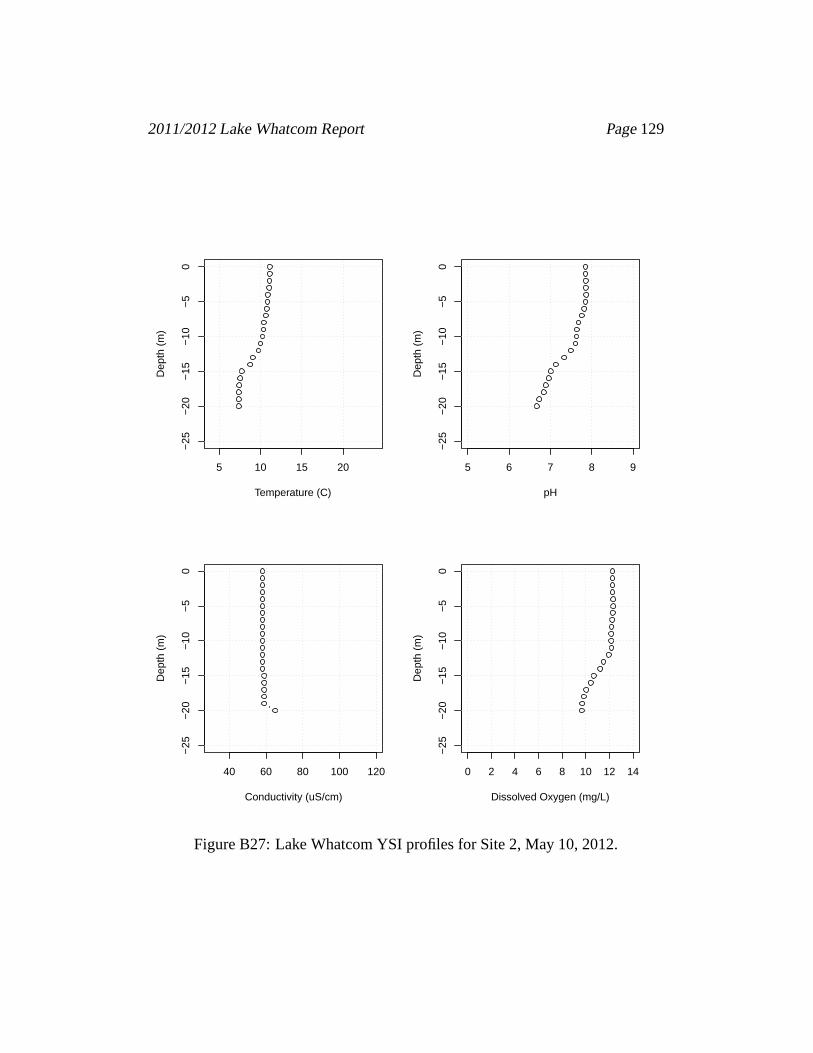
2011/2012 Lake Whatcom Report Page129
5 10 15 20
−25
−20
−15
−10
−5
0
Temperature (C)
Dep
th (
m)
5 6 7 8 9
−25
−20
−15
−10
−5
0
pH
Dep
th (
m)
40 60 80 100 120
−25
−20
−15
−10
−5
0
Conductivity (uS/cm)
Dep
th (
m)
0 2 4 6 8 10 12 14
−25
−20
−15
−10
−5
0
Dissolved Oxygen (mg/L)
Dep
th (
m)
Figure B27: Lake Whatcom YSI profiles for Site 2, May 10, 2012.

2011/2012 Lake Whatcom Report Page130
5 10 15 20
−25
−20
−15
−10
−5
0
Temperature (C)
Dep
th (
m)
5 6 7 8 9
−25
−20
−15
−10
−5
0
pH
Dep
th (
m)
40 60 80 100 120
−25
−20
−15
−10
−5
0
Conductivity (uS/cm)
Dep
th (
m)
0 2 4 6 8 10 12 14
−25
−20
−15
−10
−5
0
Dissolved Oxygen (mg/L)
Dep
th (
m)
Figure B28: Lake Whatcom YSI profiles for the Intake, May 10, 2012.

2011/2012 Lake Whatcom Report Page131
5 10 15 20
−10
0−
80−
60−
40−
200
Temperature (C)
Dep
th (
m)
5 6 7 8 9
−10
0−
80−
60−
40−
200
pH
Dep
th (
m)
40 60 80 100 120
−10
0−
80−
60−
40−
200
Conductivity (uS/cm)
Dep
th (
m)
0 2 4 6 8 10 12 14
−10
0−
80−
60−
40−
200
Dissolved Oxygen (mg/L)
Dep
th (
m)
Figure B29: Lake Whatcom YSI profiles for Site 3, May 3, 2012.

2011/2012 Lake Whatcom Report Page132
5 10 15 20
−10
0−
80−
60−
40−
200
Temperature (C)
Dep
th (
m)
5 6 7 8 9
−10
0−
80−
60−
40−
200
pH
Dep
th (
m)
40 60 80 100 120
−10
0−
80−
60−
40−
200
Conductivity (uS/cm)
Dep
th (
m)
0 2 4 6 8 10 12 14
−10
0−
80−
60−
40−
200
Dissolved Oxygen (mg/L)
Dep
th (
m)
Figure B30: Lake Whatcom YSI profiles for Site 4, May 3, 2012.

2011/2012 Lake Whatcom Report Page133
5 10 15 20
−25
−20
−15
−10
−5
0
Temperature (C)
Dep
th (
m)
5 6 7 8 9
−25
−20
−15
−10
−5
0
pH
Dep
th (
m)
40 60 80 100 120
−25
−20
−15
−10
−5
0
Conductivity (uS/cm)
Dep
th (
m)
0 2 4 6 8 10 12 14
−25
−20
−15
−10
−5
0
Dissolved Oxygen (mg/L)
Dep
th (
m)
Figure B31: Lake Whatcom YSI profiles for Site 1, June 7, 2012.

2011/2012 Lake Whatcom Report Page134
5 10 15 20
−25
−20
−15
−10
−5
0
Temperature (C)
Dep
th (
m)
5 6 7 8 9
−25
−20
−15
−10
−5
0
pH
Dep
th (
m)
40 60 80 100 120
−25
−20
−15
−10
−5
0
Conductivity (uS/cm)
Dep
th (
m)
0 2 4 6 8 10 12 14
−25
−20
−15
−10
−5
0
Dissolved Oxygen (mg/L)
Dep
th (
m)
Figure B32: Lake Whatcom YSI profiles for Site 2, June 7, 2012.

2011/2012 Lake Whatcom Report Page135
5 10 15 20
−25
−20
−15
−10
−5
0
Temperature (C)
Dep
th (
m)
5 6 7 8 9
−25
−20
−15
−10
−5
0
pH
Dep
th (
m)
40 60 80 100 120
−25
−20
−15
−10
−5
0
Conductivity (uS/cm)
Dep
th (
m)
0 2 4 6 8 10 12 14
−25
−20
−15
−10
−5
0
Dissolved Oxygen (mg/L)
Dep
th (
m)
Figure B33: Lake Whatcom YSI profiles for the Intake, June 7, 2012.

2011/2012 Lake Whatcom Report Page136
5 10 15 20
−10
0−
80−
60−
40−
200
Temperature (C)
Dep
th (
m)
5 6 7 8 9
−10
0−
80−
60−
40−
200
pH
Dep
th (
m)
40 60 80 100 120
−10
0−
80−
60−
40−
200
Conductivity (uS/cm)
Dep
th (
m)
0 2 4 6 8 10 12 14
−10
0−
80−
60−
40−
200
Dissolved Oxygen (mg/L)
Dep
th (
m)
Figure B34: Lake Whatcom YSI profiles for Site 3, June 9, 2012.

2011/2012 Lake Whatcom Report Page137
5 10 15 20
−10
0−
80−
60−
40−
200
Temperature (C)
Dep
th (
m)
5 6 7 8 9
−10
0−
80−
60−
40−
200
pH
Dep
th (
m)
40 60 80 100 120
−10
0−
80−
60−
40−
200
Conductivity (uS/cm)
Dep
th (
m)
0 2 4 6 8 10 12 14
−10
0−
80−
60−
40−
200
Dissolved Oxygen (mg/L)
Dep
th (
m)
Figure B35: Lake Whatcom YSI profiles for Site 4, June 9, 2012.

2011/2012 Lake Whatcom Report Page138
5 10 15 20
−25
−20
−15
−10
−5
0
Temperature (C)
Dep
th (
m)
5 6 7 8 9
−25
−20
−15
−10
−5
0
pH
Dep
th (
m)
40 60 80 100 120
−25
−20
−15
−10
−5
0
Conductivity (uS/cm)
Dep
th (
m)
0 2 4 6 8 10 12 14
−25
−20
−15
−10
−5
0
Dissolved Oxygen (mg/L)
Dep
th (
m)
Figure B36: Lake Whatcom YSI profiles for Site 1, July 7, 2012.

2011/2012 Lake Whatcom Report Page139
5 10 15 20
−25
−20
−15
−10
−5
0
Temperature (C)
Dep
th (
m)
5 6 7 8 9
−25
−20
−15
−10
−5
0
pH
Dep
th (
m)
40 60 80 100 120
−25
−20
−15
−10
−5
0
Conductivity (uS/cm)
Dep
th (
m)
0 2 4 6 8 10 12 14
−25
−20
−15
−10
−5
0
Dissolved Oxygen (mg/L)
Dep
th (
m)
Figure B37: Lake Whatcom YSI profiles for Site 2, July 7, 2012.

2011/2012 Lake Whatcom Report Page140
5 10 15 20
−25
−20
−15
−10
−5
0
Temperature (C)
Dep
th (
m)
5 6 7 8 9
−25
−20
−15
−10
−5
0
pH
Dep
th (
m)
40 60 80 100 120
−25
−20
−15
−10
−5
0
Conductivity (uS/cm)
Dep
th (
m)
0 2 4 6 8 10 12 14
−25
−20
−15
−10
−5
0
Dissolved Oxygen (mg/L)
Dep
th (
m)
Figure B38: Lake Whatcom YSI profiles for the Intake, July 7, 2012.

2011/2012 Lake Whatcom Report Page141
5 10 15 20
−10
0−
80−
60−
40−
200
Temperature (C)
Dep
th (
m)
5 6 7 8 9
−10
0−
80−
60−
40−
200
pH
Dep
th (
m)
40 60 80 100 120
−10
0−
80−
60−
40−
200
Conductivity (uS/cm)
Dep
th (
m)
0 2 4 6 8 10 12 14
−10
0−
80−
60−
40−
200
Dissolved Oxygen (mg/L)
Dep
th (
m)
Figure B39: Lake Whatcom YSI profiles for Site 3, July 5, 2012.

2011/2012 Lake Whatcom Report Page142
5 10 15 20
−10
0−
80−
60−
40−
200
Temperature (C)
Dep
th (
m)
5 6 7 8 9
−10
0−
80−
60−
40−
200
pH
Dep
th (
m)
40 60 80 100 120
−10
0−
80−
60−
40−
200
Conductivity (uS/cm)
Dep
th (
m)
0 2 4 6 8 10 12 14
−10
0−
80−
60−
40−
200
Dissolved Oxygen (mg/L)
Dep
th (
m)
Figure B40: Lake Whatcom YSI profiles for Site 4, July 5, 2012.

2011/2012 Lake Whatcom Report Page143
5 10 15 20
−25
−20
−15
−10
−5
0
Temperature (C)
Dep
th (
m)
5 6 7 8 9
−25
−20
−15
−10
−5
0
pH
Dep
th (
m)
40 60 80 100 120
−25
−20
−15
−10
−5
0
Conductivity (uS/cm)
Dep
th (
m)
0 2 4 6 8 10 12 14
−25
−20
−15
−10
−5
0
Dissolved Oxygen (mg/L)
Dep
th (
m)
Figure B41: Lake Whatcom YSI profiles for Site 1, August 4, 2012.

2011/2012 Lake Whatcom Report Page144
5 10 15 20
−25
−20
−15
−10
−5
0
Temperature (C)
Dep
th (
m)
5 6 7 8 9
−25
−20
−15
−10
−5
0
pH
Dep
th (
m)
40 60 80 100 120
−25
−20
−15
−10
−5
0
Conductivity (uS/cm)
Dep
th (
m)
0 2 4 6 8 10 12 14
−25
−20
−15
−10
−5
0
Dissolved Oxygen (mg/L)
Dep
th (
m)
Figure B42: Lake Whatcom YSI profiles for Site 2, August 4, 2012.

2011/2012 Lake Whatcom Report Page145
5 10 15 20
−25
−20
−15
−10
−5
0
Temperature (C)
Dep
th (
m)
5 6 7 8 9
−25
−20
−15
−10
−5
0
pH
Dep
th (
m)
40 60 80 100 120
−25
−20
−15
−10
−5
0
Conductivity (uS/cm)
Dep
th (
m)
0 2 4 6 8 10 12 14
−25
−20
−15
−10
−5
0
Dissolved Oxygen (mg/L)
Dep
th (
m)
Figure B43: Lake Whatcom YSI profiles for the Intake, August 4, 2012.

2011/2012 Lake Whatcom Report Page146
5 10 15 20
−10
0−
80−
60−
40−
200
Temperature (C)
Dep
th (
m)
5 6 7 8 9
−10
0−
80−
60−
40−
200
pH
Dep
th (
m)
40 60 80 100 120
−10
0−
80−
60−
40−
200
Conductivity (uS/cm)
Dep
th (
m)
0 2 4 6 8 10 12 14
−10
0−
80−
60−
40−
200
Dissolved Oxygen (mg/L)
Dep
th (
m)
Figure B44: Lake Whatcom YSI profiles for Site 3, August 2, 2012.

2011/2012 Lake Whatcom Report Page147
5 10 15 20
−10
0−
80−
60−
40−
200
Temperature (C)
Dep
th (
m)
5 6 7 8 9
−10
0−
80−
60−
40−
200
pH
Dep
th (
m)
40 60 80 100 120
−10
0−
80−
60−
40−
200
Conductivity (uS/cm)
Dep
th (
m)
0 2 4 6 8 10 12 14
−10
0−
80−
60−
40−
200
Dissolved Oxygen (mg/L)
Dep
th (
m)
Figure B45: Lake Whatcom YSI profiles for Site 4, August 2, 2012.

2011/2012 Lake Whatcom Report Page148
5 10 15 20
−25
−20
−15
−10
−5
0
Temperature (C)
Dep
th (
m)
5 6 7 8 9
−25
−20
−15
−10
−5
0
pH
Dep
th (
m)
40 60 80 100 120
−25
−20
−15
−10
−5
0
Conductivity (uS/cm)
Dep
th (
m)
0 2 4 6 8 10 12 14
−25
−20
−15
−10
−5
0
Dissolved Oxygen (mg/L)
Dep
th (
m)
Figure B46: Lake Whatcom YSI profiles for Site 1, September 8,2012.

2011/2012 Lake Whatcom Report Page149
5 10 15 20
−25
−20
−15
−10
−5
0
Temperature (C)
Dep
th (
m)
5 6 7 8 9
−25
−20
−15
−10
−5
0
pH
Dep
th (
m)
40 60 80 100 120
−25
−20
−15
−10
−5
0
Conductivity (uS/cm)
Dep
th (
m)
0 2 4 6 8 10 12 14
−25
−20
−15
−10
−5
0
Dissolved Oxygen (mg/L)
Dep
th (
m)
Figure B47: Lake Whatcom YSI profiles for Site 2, September 8,2012.

2011/2012 Lake Whatcom Report Page150
5 10 15 20
−25
−20
−15
−10
−5
0
Temperature (C)
Dep
th (
m)
5 6 7 8 9
−25
−20
−15
−10
−5
0
pH
Dep
th (
m)
40 60 80 100 120
−25
−20
−15
−10
−5
0
Conductivity (uS/cm)
Dep
th (
m)
0 2 4 6 8 10 12 14
−25
−20
−15
−10
−5
0
Dissolved Oxygen (mg/L)
Dep
th (
m)
Figure B48: Lake Whatcom YSI profiles for the Intake, September 8, 2012.

2011/2012 Lake Whatcom Report Page151
5 10 15 20
−10
0−
80−
60−
40−
200
Temperature (C)
Dep
th (
m)
5 6 7 8 9
−10
0−
80−
60−
40−
200
pH
Dep
th (
m)
40 60 80 100 120
−10
0−
80−
60−
40−
200
Conductivity (uS/cm)
Dep
th (
m)
0 2 4 6 8 10 12 14
−10
0−
80−
60−
40−
200
Dissolved Oxygen (mg/L)
Dep
th (
m)
Figure B49: Lake Whatcom YSI profiles for Site 3, September 6,2012.

2011/2012 Lake Whatcom Report Page152
5 10 15 20
−10
0−
80−
60−
40−
200
Temperature (C)
Dep
th (
m)
5 6 7 8 9
−10
0−
80−
60−
40−
200
pH
Dep
th (
m)
40 60 80 100 120
−10
0−
80−
60−
40−
200
Conductivity (uS/cm)
Dep
th (
m)
0 2 4 6 8 10 12 14
−10
0−
80−
60−
40−
200
Dissolved Oxygen (mg/L)
Dep
th (
m)
Figure B50: Lake Whatcom YSI profiles for Site 4, September 6,2012.

2011/2012 Lake Whatcom Report Page153
B.2 Long-term Hydrolab Data (1988-present)

2011/2012Lake
Whatcom
Report
Page1
54
510
1520
25
Lake Whatcom temperature data for Site 1, February 1988 through December 2012.Te
mpe
ratu
re (
C)
11/91 05/97 11/02 05/08 10/13
Fig
ure
B5
1:
LakeW
hatco
mh
istoric
temp
erature
data
for
Site
1.
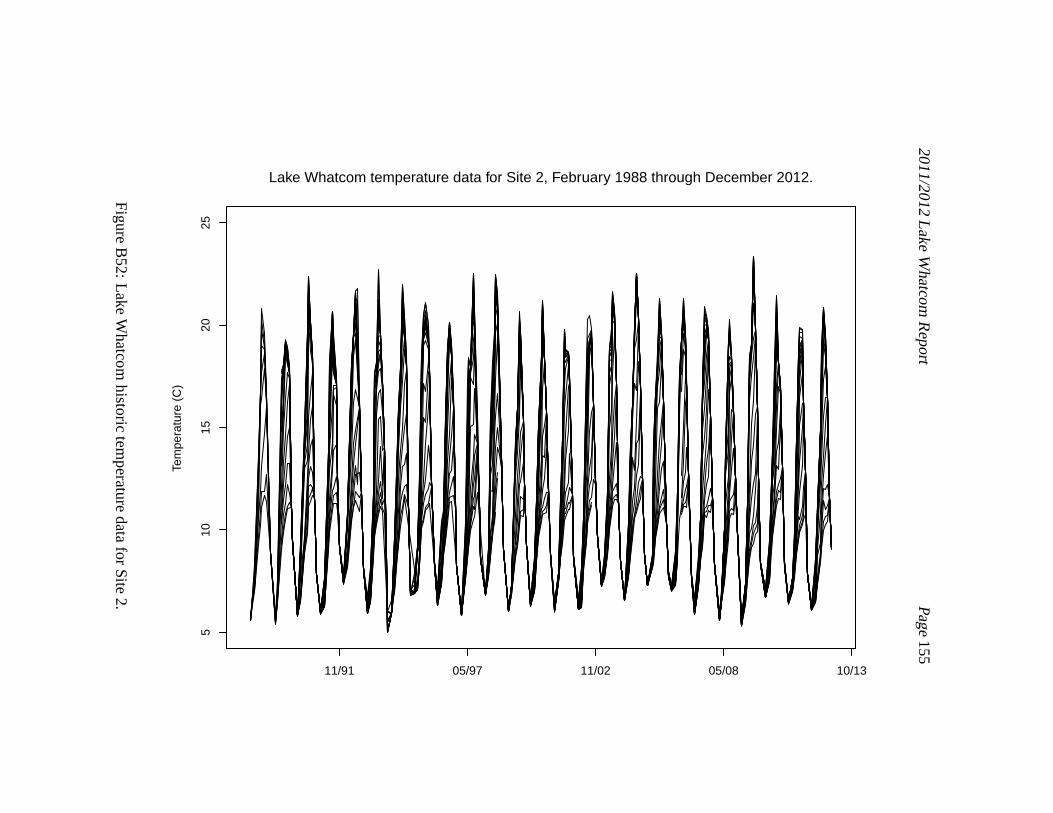
2011/2012Lake
Whatcom
Report
Page1
55
510
1520
25
Lake Whatcom temperature data for Site 2, February 1988 through December 2012.Te
mpe
ratu
re (
C)
11/91 05/97 11/02 05/08 10/13
Fig
ure
B5
2:
LakeW
hatco
mh
istoric
temp
erature
data
for
Site
2.

2011/2012Lake
Whatcom
Report
Page1
56
510
1520
25
Lake Whatcom temperature data for Intake, February 1988 through December 2012.Te
mpe
ratu
re (
C)
11/91 05/97 11/02 05/08 10/13
Fig
ure
B5
3:
LakeW
hatco
mh
istoric
temp
erature
data
for
the
In
take.

2011/2012Lake
Whatcom
Report
Page1
57
510
1520
25
Lake Whatcom temperature data for Site 3, February 1988 through December 2012.Te
mpe
ratu
re (
C)
11/91 05/97 11/02 05/08 10/13
Fig
ure
B5
4:
LakeW
hatco
mh
istoric
temp
erature
data
for
Site
3.

2011/2012Lake
Whatcom
Report
Page1
58
510
1520
25
Lake Whatcom temperature data for Site 4, February 1988 through December 2012.Te
mpe
ratu
re (
C)
11/91 05/97 11/02 05/08 10/13
Fig
ure
B5
5:
LakeW
hatco
mh
istoric
temp
erature
data
for
Site
4.

2011/2012Lake
Whatcom
Report
Page1
59
02
46
810
1214
Lake Whatcom dissolved oxygen data for Site 1, February 1988 through December 2012.D
isso
lved
Oxy
gen
(mg/
L)
11/91 05/97 11/02 05/08 10/13
Fig
ure
B5
6:
LakeW
hatco
mh
istoric
disso
lvedo
xygen
data
for
Site
1.

2011/2012Lake
Whatcom
Report
Page1
60
02
46
810
1214
Lake Whatcom dissolved oxygen data for Site 2, February 1988 through December 2012.D
isso
lved
Oxy
gen
(mg/
L)
11/91 05/97 11/02 05/08 10/13
Fig
ure
B5
7:
LakeW
hatco
mh
istoric
disso
lvedo
xygen
data
for
Site
2.

2011/2012Lake
Whatcom
Report
Page1
61
02
46
810
1214
Lake Whatcom dissolved oxygen data for Intake, February 1988 through December 2012.D
isso
lved
Oxy
gen
(mg/
L)
11/91 05/97 11/02 05/08 10/13
Fig
ure
B5
8:
LakeW
hatco
mh
istoric
disso
lvedo
xygen
data
for
the
Intake.

2011/2012Lake
Whatcom
Report
Page1
62
02
46
810
1214
Lake Whatcom dissolved oxygen data for Site 3, February 1988 through December 2012.D
isso
lved
Oxy
gen
(mg/
L)
11/91 05/97 11/02 05/08 10/13
Fig
ure
B5
9:
LakeW
hatco
mh
istoric
disso
lvedo
xygen
data
for
Site
3.

2011/2012Lake
Whatcom
Report
Page1
63
02
46
810
1214
Lake Whatcom dissolved oxygen data for Site 4, February 1988 through December 2012.D
isso
lved
Oxy
gen
(mg/
L)
11/91 05/97 11/02 05/08 10/13
Fig
ure
B6
0:
LakeW
hatco
mh
istoric
disso
lvedo
xygen
data
for
Site
4.

2011/2012Lake
Whatcom
Report
Page1
64
56
78
9
Lake Whatcom pH data for Site 1, February 1988 through December 2012.pH
11/91 05/97 11/02 05/08 10/13
Fig
ure
B6
1:
LakeW
hatco
mh
istoric
pH
data
for
Site
1.
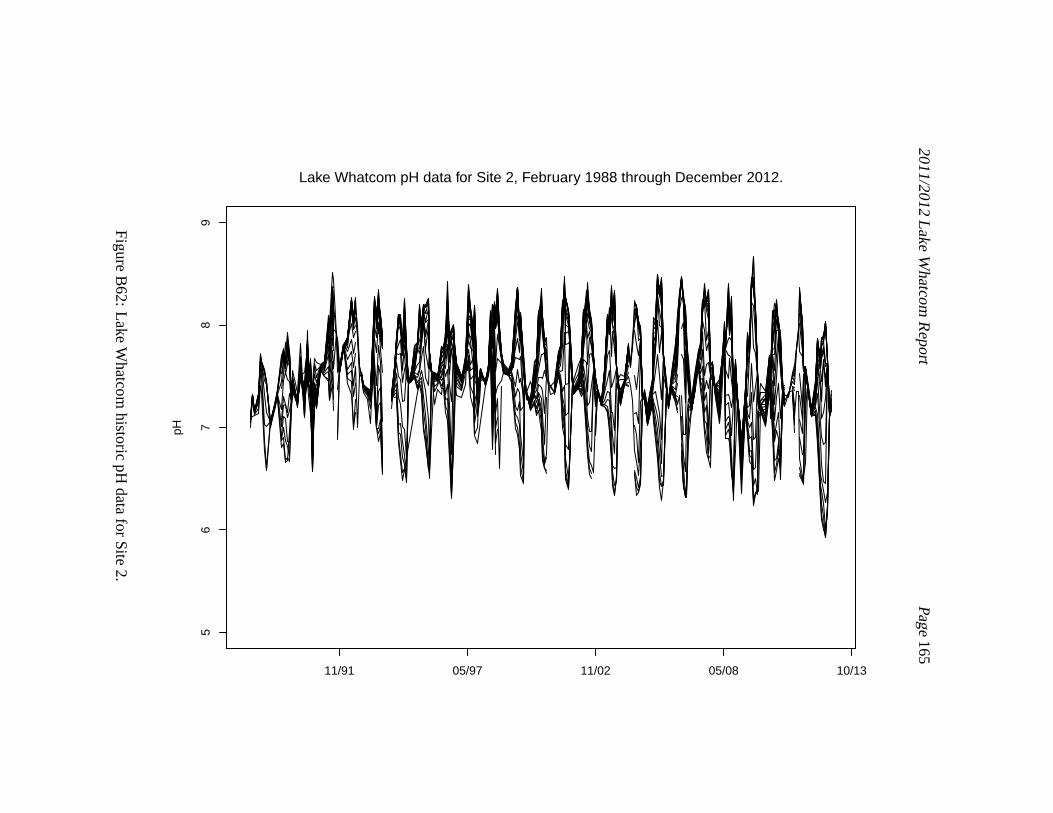
2011/2012Lake
Whatcom
Report
Page1
65
56
78
9
Lake Whatcom pH data for Site 2, February 1988 through December 2012.pH
11/91 05/97 11/02 05/08 10/13
Fig
ure
B6
2:
LakeW
hatco
mh
istoric
pH
data
for
Site
2.

2011/2012Lake
Whatcom
Report
Page1
66
56
78
9
Lake Whatcom pH data for Intake, February 1988 through December 2012.pH
11/91 05/97 11/02 05/08 10/13
Fig
ure
B6
3:
LakeW
hatco
mh
istoric
pH
data
for
the
Intake.
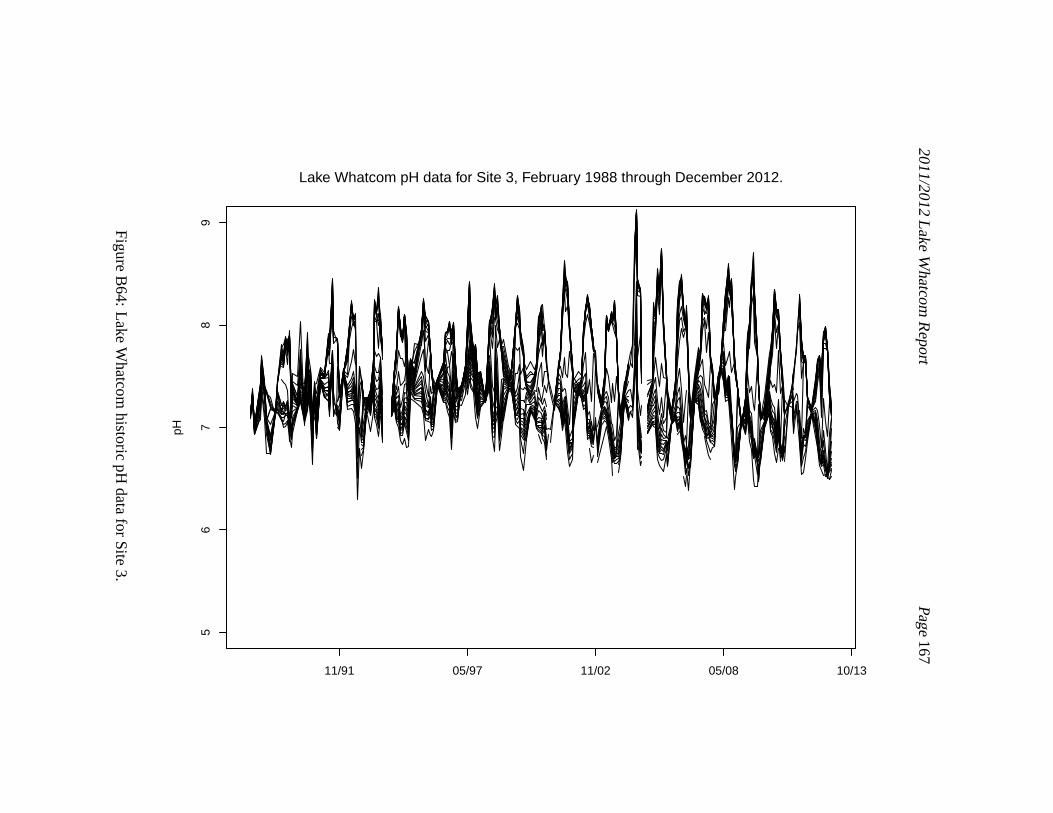
2011/2012Lake
Whatcom
Report
Page1
67
56
78
9
Lake Whatcom pH data for Site 3, February 1988 through December 2012.pH
11/91 05/97 11/02 05/08 10/13
Fig
ure
B6
4:
LakeW
hatco
mh
istoric
pH
data
for
Site
3.

2011/2012Lake
Whatcom
Report
Page1
68
56
78
9
Lake Whatcom pH data for Site 4, February 1988 through December 2012.pH
11/91 05/97 11/02 05/08 10/13
Fig
ure
B6
5:
LakeW
hatco
mh
istoric
pH
data
for
Site
4.

2011/2012 Lake Whatcom Report Page169
406080100120
Lake
Wha
tcom
con
duct
ivity
dat
a fo
r S
ite 1
, Feb
ruar
y 19
88 th
roug
h D
ecem
ber
2012
.Conductivity (uS)
11/9
105
/97
11/0
205
/08
10/1
3
Figure B66: Lake Whatcom historic conductivity data for Site 1. The decreasingconductivity trend is the result of changing to more sensitive equipment.

2011/2012 Lake Whatcom Report Page170
406080100120
Lake
Wha
tcom
con
duct
ivity
dat
a fo
r S
ite 2
, Feb
ruar
y 19
88 th
roug
h D
ecem
ber
2012
.Conductivity (uS)
11/9
105
/97
11/0
205
/08
10/1
3
Figure B67: Lake Whatcom historic conductivity data for Site 2. The decreasingconductivity trend is the result of changing to more sensitive equipment.

2011/2012 Lake Whatcom Report Page171
406080100120
Lake
Wha
tcom
con
duct
ivity
dat
a fo
r In
take
, Feb
ruar
y 19
88 th
roug
h D
ecem
ber
2012
.Conductivity (uS)
11/9
105
/97
11/0
205
/08
10/1
3
Figure B68: Lake Whatcom historic conductivity data for theIntake. The de-creasing conductivity trend is the result of changing to more sensitive equipment.

2011/2012 Lake Whatcom Report Page172
406080100120
Lake
Wha
tcom
con
duct
ivity
dat
a fo
r S
ite 3
, Feb
ruar
y 19
88 th
roug
h D
ecem
ber
2012
.Conductivity (uS)
11/9
105
/97
11/0
205
/08
10/1
3
Figure B69: Lake Whatcom historic conductivity data for Site 3. The decreasingconductivity trend is the result of changing to more sensitive equipment.

2011/2012 Lake Whatcom Report Page173
406080100120
Lake
Wha
tcom
con
duct
ivity
dat
a fo
r S
ite 4
, Feb
ruar
y 19
88 th
roug
h D
ecem
ber
2012
.Conductivity (uS)
11/9
105
/97
11/0
205
/08
10/1
3
Figure B70: Lake Whatcom historic conductivity data for Site 4. The decreasingconductivity trend is the result of changing to more sensitive equipment.

2011/2012 Lake Whatcom Report Page174
B.3 Long-term Water Quality Data (1988-present)

2011/2012Lake
Whatcom
Report
Page1
75
010
2030
4050
Lake Whatcom alkalinity data for Site 1, February 1988 through December 2012.A
lkal
inity
(m
g/L)
11/91 05/97 11/02 05/08 10/13
Detection Limit
Depth 0Depth 5Depth 10Depth 15Depth 20
Fig
ure
B7
1:
LakeW
hatco
malkalin
ityd
atafo
rS
ite1
.

2011/2012Lake
Whatcom
Report
Page1
76
010
2030
4050
Lake Whatcom alkalinity data for Site 2, February 1988 through December 2012.A
lkal
inity
(m
g/L)
11/91 05/97 11/02 05/08 10/13
Detection Limit
Depth 0Depth 5Depth 10Depth 15Depth 20
Fig
ure
B7
2:
LakeW
hatco
malkalin
ityd
atafo
rS
ite2
.

2011/2012Lake
Whatcom
Report
Page1
77
010
2030
4050
Lake Whatcom alkalinity data for Intake, February 1988 through December 2012.A
lkal
inity
(m
g/L)
11/91 05/97 11/02 05/08 10/13
Detection Limit
Depth 0Depth 5Depth 10
Fig
ure
B7
3:
LakeW
hatco
malkalin
ityd
atafo
rth
eIn
takesite.

2011/2012Lake
Whatcom
Report
Page1
78
010
2030
4050
Lake Whatcom alkalinity data for Site 3, February 1988 through December 2012.A
lkal
inity
(m
g/L)
11/91 05/97 11/02 05/08 10/13
Detection Limit
Depth 0Depth 5Depth 10Depth 20Depth 40Depth 60Depth 80
Fig
ure
B7
4:
LakeW
hatco
malkalin
ityd
atafo
rS
ite3
.

2011/2012Lake
Whatcom
Report
Page1
79
010
2030
4050
Lake Whatcom alkalinity data for Site 4, February 1988 through December 2012.A
lkal
inity
(m
g/L)
11/91 05/97 11/02 05/08 10/13
Detection Limit
Depth 0Depth 5Depth 10Depth 20Depth 40Depth 60Depth 80Depth 90
Fig
ure
B7
5:
LakeW
hatco
malkalin
ityd
atafo
rS
ite4
.

2011/2012Lake
Whatcom
Report
Page1
80
05
1015
20
Lake Whatcom turbidity data for Site 1, February 1988 through December 2012.Tu
rbid
ity (
NT
U)
11/91 05/97 11/02 05/08 10/13
Detection Limit
Depth 0Depth 5Depth 10Depth 15Depth 20
Fig
ure
B7
6:
LakeW
hatco
mtu
rbid
ityd
atafo
rS
ite1
.

2011/2012Lake
Whatcom
Report
Page1
81
05
1015
20
Lake Whatcom turbidity data for Site 2, February 1988 through December 2012.Tu
rbid
ity (
NT
U)
11/91 05/97 11/02 05/08 10/13
Detection Limit
Depth 0Depth 5Depth 10Depth 15Depth 20
Fig
ure
B7
7:
LakeW
hatco
mtu
rbid
ityd
atafo
rS
ite2
.

2011/2012Lake
Whatcom
Report
Page1
82
05
1015
20
Lake Whatcom turbidity data for Intake, February 1988 through December 2012.Tu
rbid
ity (
NT
U)
11/91 05/97 11/02 05/08 10/13
Detection Limit
Depth 0Depth 5Depth 10
Fig
ure
B7
8:
LakeW
hatco
mtu
rbid
ityd
atafo
rth
eIn
takesite.

2011/2012Lake
Whatcom
Report
Page1
83
05
1015
20
Lake Whatcom turbidity data for Site 3, February 1988 through December 2012.Tu
rbid
ity (
NT
U)
11/91 05/97 11/02 05/08 10/13
Detection Limit
Depth 0Depth 5Depth 10Depth 20Depth 40Depth 60Depth 80
Fig
ure
B7
9:
LakeW
hatco
mtu
rbid
ityd
atafo
rS
ite3
.

2011/2012Lake
Whatcom
Report
Page1
84
05
1015
20
Lake Whatcom turbidity data for Site 4, February 1988 through December 2012.Tu
rbid
ity (
NT
U)
11/91 05/97 11/02 05/08 10/13
Detection Limit
Depth 0Depth 5Depth 10Depth 20Depth 40Depth 60Depth 80Depth 90
Fig
ure
B8
0:
LakeW
hatco
mtu
rbid
ityd
atafo
rS
ite4
.

2011/2012Lake
Whatcom
Report
Page1
85
010
020
030
040
050
060
0
Lake Whatcom ammonium data for Site 1, February 1988 through December 2012.A
mm
oniu
m (
ug/L
)
11/91 05/97 11/02 05/08 10/13
Detection Limit
Depth 0Depth 5Depth 10Depth 15Depth 20
Fig
ure
B8
1:
LakeW
hatco
mam
mo
niu
md
atafo
rS
ite1
.

2011/2012Lake
Whatcom
Report
Page1
86
010
020
030
040
050
060
0
Lake Whatcom ammonium data for Site 2, February 1988 through December 2012.A
mm
oniu
m (
ug/L
)
11/91 05/97 11/02 05/08 10/13
Detection Limit
Depth 0Depth 5Depth 10Depth 15Depth 20
Fig
ure
B8
2:
LakeW
hatco
mam
mo
niu
md
atafo
rS
ite2
.

2011/2012Lake
Whatcom
Report
Page1
87
010
020
030
040
050
060
0
Lake Whatcom ammonium data for Intake, February 1988 through December 2012.A
mm
oniu
m (
ug/L
)
11/91 05/97 11/02 05/08 10/13
Detection Limit
Depth 0Depth 5Depth 10
Fig
ure
B8
3:
LakeW
hatco
mam
mo
niu
md
atafo
rth
eIn
takesite.

2011/2012Lake
Whatcom
Report
Page1
88
010
020
030
040
050
060
0
Lake Whatcom ammonium data for Site 3, February 1988 through December 2012.A
mm
oniu
m (
ug/L
)
11/91 05/97 11/02 05/08 10/13
Detection Limit
Depth 0Depth 5Depth 10Depth 20Depth 40Depth 60Depth 80
Fig
ure
B8
4:
LakeW
hatco
mam
mo
niu
md
atafo
rS
ite3
.

2011/2012Lake
Whatcom
Report
Page1
89
010
020
030
040
050
060
0
Lake Whatcom ammonium data for Site 4, February 1988 through December 2012.A
mm
oniu
m (
ug/L
)
11/91 05/97 11/02 05/08 10/13
Detection Limit
Depth 0Depth 5Depth 10Depth 20Depth 40Depth 60Depth 80Depth 90
Fig
ure
B8
5:
LakeW
hatco
mam
mo
niu
md
atafo
rS
ite4
.

2011/2012Lake
Whatcom
Report
Page1
90
020
040
060
0
Lake Whatcom nitrate/nitrite data for Site 1, February 1988 through December 2012.N
itrat
e/N
itrite
(ug
/L)
11/91 05/97 11/02 05/08 10/13
Detection Limit
Depth 0Depth 5Depth 10Depth 15Depth 20
Fig
ure
B8
6:
LakeW
hatco
mn
itrate/nitrite
data
for
Site
1.

2011/2012Lake
Whatcom
Report
Page1
91
020
040
060
0
Lake Whatcom nitrate/nitrite data for Site 2, February 1988 through December 2012.N
itrat
e/N
itrite
(ug
/L)
11/91 05/97 11/02 05/08 10/13
Detection Limit
Depth 0Depth 5Depth 10Depth 15Depth 20
Fig
ure
B8
7:
LakeW
hatco
mn
itrate/nitrite
data
for
Site
2.

2011/2012Lake
Whatcom
Report
Page1
92
020
040
060
0
Lake Whatcom nitrate/nitrite data for Intake, February 1988 through December 2012.N
itrat
e/N
itrite
(ug
/L)
11/91 05/97 11/02 05/08 10/13
Detection Limit
Depth 0Depth 5Depth 10
Fig
ure
B8
8:
LakeW
hatco
mn
itrate/nitrite
data
for
the
Intak
esite.

2011/2012Lake
Whatcom
Report
Page1
93
020
040
060
0
Lake Whatcom nitrate/nitrite data for Site 3, February 1988 through December 2012.N
itrat
e/N
itrite
(ug
/L)
11/91 05/97 11/02 05/08 10/13
Detection Limit
Depth 0Depth 5Depth 10Depth 20Depth 40Depth 60Depth 80
Fig
ure
B8
9:
LakeW
hatco
mn
itrate/nitrite
data
for
Site
3.

2011/2012Lake
Whatcom
Report
Page1
94
020
040
060
0
Lake Whatcom nitrate/nitrite data for Site 4, February 1988 through December 2012.N
itrat
e/N
itrite
(ug
/L)
11/91 05/97 11/02 05/08 10/13
Detection Limit
Depth 0Depth 5Depth 10Depth 20Depth 40Depth 60Depth 80Depth 90
Fig
ure
B9
0:
LakeW
hatco
mn
itrate/nitrite
data
for
Site
4.

2011/2012Lake
Whatcom
Report
Page1
95
050
010
0015
00
Lake Whatcom total nitrogen data for Site 1, February 1988 through December 2012.To
tal N
itrog
en (
ug/L
)
11/91 05/97 11/02 05/08 10/13
Detection Limit
Depth 0Depth 5Depth 10Depth 15Depth 20
Fig
ure
B9
1:
LakeW
hatco
mto
talnitro
gen
data
for
Site
1.

2011/2012Lake
Whatcom
Report
Page1
96
050
010
0015
00
Lake Whatcom total nitrogen data for Site 2, February 1988 through December 2012.To
tal N
itrog
en (
ug/L
)
11/91 05/97 11/02 05/08 10/13
Detection Limit
Depth 0Depth 5Depth 10Depth 15Depth 20
Fig
ure
B9
2:
LakeW
hatco
mto
talnitro
gen
data
for
Site
2.

2011/2012Lake
Whatcom
Report
Page1
97
050
010
0015
00
Lake Whatcom total nitrogen data for Intake, February 1988 through December 2012.To
tal N
itrog
en (
ug/L
)
11/91 05/97 11/02 05/08 10/13
Detection Limit
Depth 0Depth 5Depth 10
Fig
ure
B9
3:
LakeW
hatco
mto
talnitro
gen
data
for
the
Intake
site.

2011/2012Lake
Whatcom
Report
Page1
98
050
010
0015
00
Lake Whatcom total nitrogen data for Site 3, February 1988 through December 2012.To
tal N
itrog
en (
ug/L
)
11/91 05/97 11/02 05/08 10/13
Detection Limit
Depth 0Depth 5Depth 10Depth 20Depth 40Depth 60Depth 80
Fig
ure
B9
4:
LakeW
hatco
mto
talnitro
gen
data
for
Site
3.

2011/2012Lake
Whatcom
Report
Page1
99
050
010
0015
00
Lake Whatcom total nitrogen data for Site 4, February 1988 through December 2012.To
tal N
itrog
en (
ug/L
)
11/91 05/97 11/02 05/08 10/13
Detection Limit
Depth 0Depth 5Depth 10Depth 20Depth 40Depth 60Depth 80Depth 90
Fig
ure
B9
5:
LakeW
hatco
mto
talnitro
gen
data
for
Site
4.

2011/2012Lake
Whatcom
Report
Page2
00
010
2030
4050
Lake Whatcom soluble reactive phosphate data for Site 1, February 1988 through December 2012.S
olub
le R
eact
ive
Pho
spha
te (
ug/L
)
11/91 05/97 11/02 05/08 10/13
Detection Limit
Depth 0Depth 5Depth 10Depth 15Depth 20
Fig
ure
B9
6:
LakeW
hatco
mso
lub
lep
ho
sph
ated
atafo
rS
ite1
.

2011/2012Lake
Whatcom
Report
Page2
01
010
2030
4050
Lake Whatcom soluble reactive phosphate data for Site 2, February 1988 through December 2012.S
olub
le R
eact
ive
Pho
spha
te (
ug/L
)
11/91 05/97 11/02 05/08 10/13
Detection Limit
Depth 0Depth 5Depth 10Depth 15Depth 20
Fig
ure
B9
7:
LakeW
hatco
mso
lub
lep
ho
sph
ated
atafo
rS
ite2
.
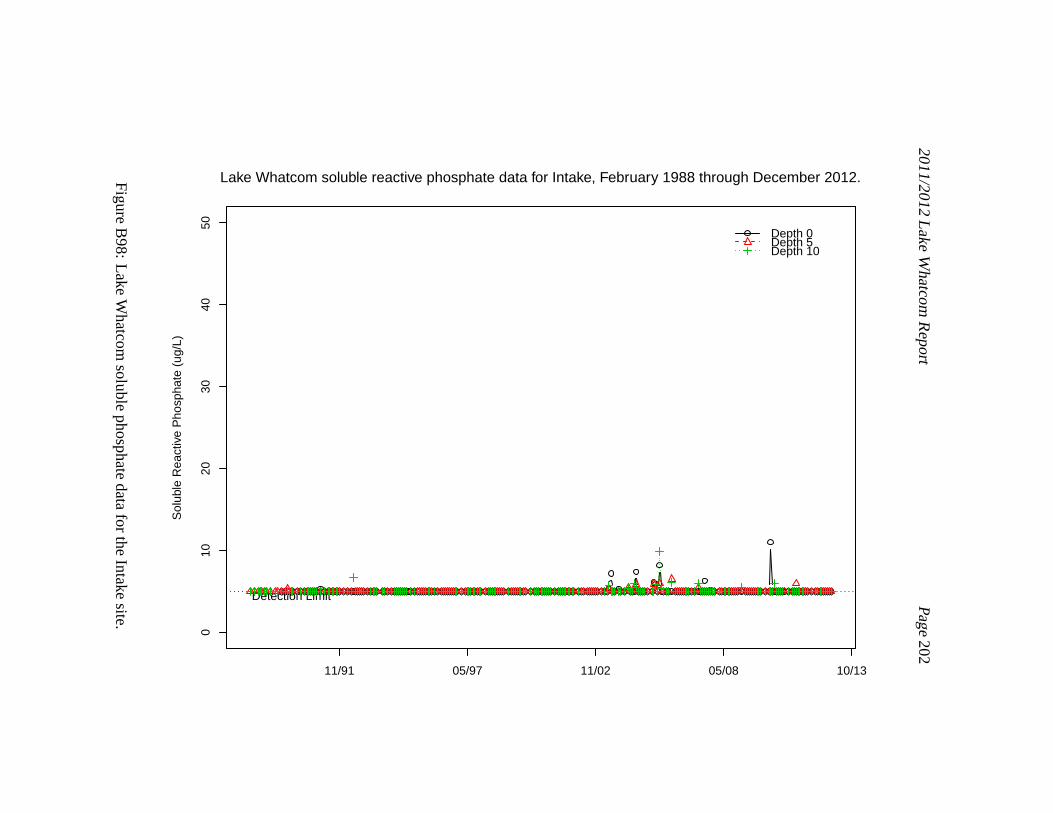
2011/2012Lake
Whatcom
Report
Page2
02
010
2030
4050
Lake Whatcom soluble reactive phosphate data for Intake, February 1988 through December 2012.S
olub
le R
eact
ive
Pho
spha
te (
ug/L
)
11/91 05/97 11/02 05/08 10/13
Detection Limit
Depth 0Depth 5Depth 10
Fig
ure
B9
8:
LakeW
hatco
mso
lub
lep
ho
sph
ated
atafo
rth
eIn
take
site.

2011/2012Lake
Whatcom
Report
Page2
03
010
2030
4050
Lake Whatcom soluble reactive phosphate data for Site 3, February 1988 through December 2012.S
olub
le R
eact
ive
Pho
spha
te (
ug/L
)
11/91 05/97 11/02 05/08 10/13
Detection Limit
Depth 0Depth 5Depth 10Depth 20Depth 40Depth 60Depth 80
Fig
ure
B9
9:
LakeW
hatco
mso
lub
lep
ho
sph
ated
atafo
rS
ite3
.

2011/2012Lake
Whatcom
Report
Page2
04
010
2030
4050
Lake Whatcom soluble reactive phosphate data for Site 4, February 1988 through December 2012.S
olub
le R
eact
ive
Pho
spha
te (
ug/L
)
11/91 05/97 11/02 05/08 10/13
Detection Limit
Depth 0Depth 5Depth 10Depth 20Depth 40Depth 60Depth 80Depth 90
Fig
ure
B1
00
:Lake
Wh
atcom
solu
ble
ph
osp
hate
data
for
Site
4.

2011/2012Lake
Whatcom
Report
Page2
05
050
100
150
200
Lake Whatcom total phosphorus data for Site 1, February 1988 through December 2012.To
tal P
hosp
horu
s (u
g/L)
11/91 05/97 11/02 05/08 10/13
Detection Limit
Depth 0Depth 5Depth 10Depth 15Depth 20
Fig
ure
B1
01
:Lake
Wh
atcom
totalp
ho
sph
oru
sd
atafo
rS
ite1
.

2011/2012Lake
Whatcom
Report
Page2
06
050
100
150
200
Lake Whatcom total phosphorus data for Site 2, February 1988 through December 2012.To
tal P
hosp
horu
s (u
g/L)
11/91 05/97 11/02 05/08 10/13
Detection Limit
Depth 0Depth 5Depth 10Depth 15Depth 20
Fig
ure
B1
02
:Lake
Wh
atcom
totalp
ho
sph
oru
sd
atafo
rS
ite2
.

2011/2012Lake
Whatcom
Report
Page2
07
050
100
150
200
Lake Whatcom total phosphorus data for Intake, February 1988 through December 2012.To
tal P
hosp
horu
s (u
g/L)
11/91 05/97 11/02 05/08 10/13
Detection Limit
Depth 0Depth 5Depth 10
Fig
ure
B1
03
:Lake
Wh
atcom
totalp
ho
sph
oru
sd
atafo
rth
eIn
take
site.
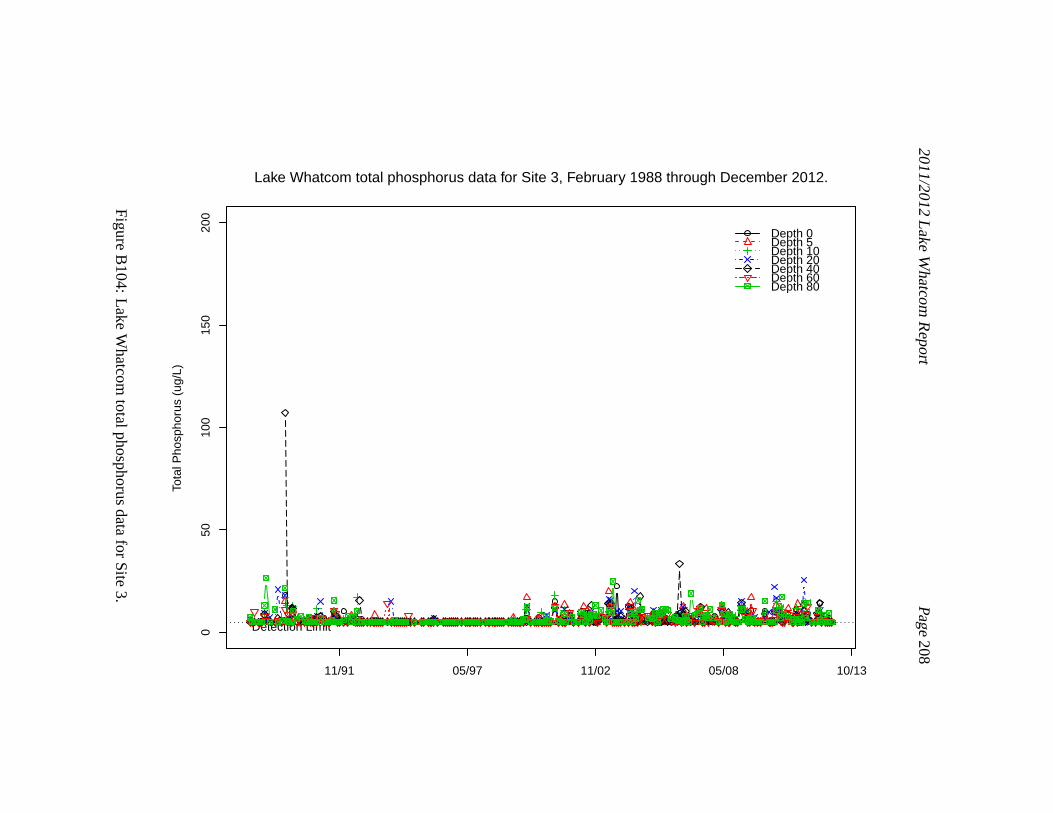
2011/2012Lake
Whatcom
Report
Page2
08
050
100
150
200
Lake Whatcom total phosphorus data for Site 3, February 1988 through December 2012.To
tal P
hosp
horu
s (u
g/L)
11/91 05/97 11/02 05/08 10/13
Detection Limit
Depth 0Depth 5Depth 10Depth 20Depth 40Depth 60Depth 80
Fig
ure
B1
04
:Lake
Wh
atcom
totalp
ho
sph
oru
sd
atafo
rS
ite3
.

2011/2012Lake
Whatcom
Report
Page2
09
050
100
150
200
Lake Whatcom total phosphorus data for Site 4, February 1988 through December 2012.To
tal P
hosp
horu
s (u
g/L)
11/91 05/97 11/02 05/08 10/13
Detection Limit
Depth 0Depth 5Depth 10Depth 20Depth 40Depth 60Depth 80Depth 90
Fig
ure
B1
05
:Lake
Wh
atcom
totalp
ho
sph
oru
sd
atafo
rS
ite4
.

2011/2012Lake
Whatcom
Report
Page2
10
05
1015
20
Lake Whatcom chlorophyll a data for Site 1, February 1988 through December 2012.C
hlor
ophy
ll a
(ug/
L)
11/91 05/97 11/02 05/08 10/13
Detection Limit
Depth 0Depth 5Depth 10Depth 15Depth 20
Fig
ure
B1
06
:Lake
Wh
atcom
chlo
rop
hylld
atafo
rS
ite1
.

2011/2012Lake
Whatcom
Report
Page2
11
05
1015
20
Lake Whatcom chlorophyll a data for Site 2, February 1988 through December 2012.C
hlor
ophy
ll a
(ug/
L)
11/91 05/97 11/02 05/08 10/13
Detection Limit
Depth 0Depth 5Depth 10Depth 15Depth 20
Fig
ure
B1
07
:Lake
Wh
atcom
chlo
rop
hylld
atafo
rS
ite2
.

2011/2012Lake
Whatcom
Report
Page2
12
05
1015
20
Lake Whatcom chlorophyll a data for Intake, February 1988 through December 2012.C
hlor
ophy
ll a
(ug/
L)
11/91 05/97 11/02 05/08 10/13
Detection Limit
Depth 0Depth 5Depth 10
Fig
ure
B1
08
:Lake
Wh
atcom
chlo
rop
hylld
atafo
rth
eIn
takesi
te.

2011/2012Lake
Whatcom
Report
Page2
13
05
1015
20
Lake Whatcom chlorophyll a data for Site 3, February 1988 through December 2012.C
hlor
ophy
ll a
(ug/
L)
11/91 05/97 11/02 05/08 10/13
Detection Limit
Depth 0Depth 5Depth 10Depth 20Depth 40Depth 60Depth 80
Fig
ure
B1
09
:Lake
Wh
atcom
chlo
rop
hylld
atafo
rS
ite3
.

2011/2012Lake
Whatcom
Report
Page2
14
05
1015
20
Lake Whatcom chlorophyll a data for Site 4, February 1988 through December 2012.C
hlor
ophy
ll a
(ug/
L)
11/91 05/97 11/02 05/08 10/13
Detection Limit
Depth 0Depth 5Depth 10Depth 20Depth 40Depth 60Depth 80Depth 90
Fig
ure
B1
10
:Lake
Wh
atcom
chlo
rop
hylld
atafo
rS
ite4
.

2011/2012Lake
Whatcom
Report
Page2
15
05
1015
20
Lake Whatcom Secchi data for Site 1, February 1988 through December 2012.S
ecch
i Dep
th
11/91 05/97 11/02 05/08 10/13
Fig
ure
B1
11
:Lake
Wh
atcom
Secch
idep
ths
for
Site
1.

2011/2012Lake
Whatcom
Report
Page2
16
05
1015
20
Lake Whatcom Secchi data for Site 2, February 1988 through December 2012.S
ecch
i Dep
th
11/91 05/97 11/02 05/08 10/13
Fig
ure
B1
12
:Lake
Wh
atcom
Secch
idep
ths
for
Site
2.

2011/2012Lake
Whatcom
Report
Page2
17
05
1015
20
Lake Whatcom Secchi data for Intake, February 1988 through December 2012.S
ecch
i Dep
th
11/91 05/97 11/02 05/08 10/13
Fig
ure
B1
13
:Lake
Wh
atcom
Secch
idep
ths
for
the
Intake
site.

2011/2012Lake
Whatcom
Report
Page2
18
05
1015
20
Lake Whatcom Secchi data for Site 3, February 1988 through December 2012.S
ecch
i Dep
th
11/91 05/97 11/02 05/08 10/13
Fig
ure
B1
14
:Lake
Wh
atcom
Secch
idep
ths
for
Site
3.

2011/2012Lake
Whatcom
Report
Page2
19
05
1015
20
Lake Whatcom Secchi data for Site 4, February 1988 through December 2012.S
ecch
i Dep
th
11/91 05/97 11/02 05/08 10/13
Fig
ure
B1
15
:Lake
Wh
atcom
Secch
idep
ths
for
Site
4.

2011/2012Lake
Whatcom
Report
Page2
20
05
1015
2025
30
Lake Whatcom fecal coliform data for Site 1, February 1988 through December 2012.F
ecal
Col
iform
s (c
fu/1
00 m
L)
05/97 11/02 05/08
Fig
ure
B1
16
:Lake
Wh
atcom
fecalcolifo
rmd
atafo
rS
ite1
.

2011/2012Lake
Whatcom
Report
Page2
21
05
1015
2025
30
Lake Whatcom fecal coliform data for Site 2, February 1988 through December 2012.F
ecal
Col
iform
s (c
fu/1
00 m
L)
05/97 11/02 05/08
Fig
ure
B1
17
:Lake
Wh
atcom
fecalcolifo
rmd
atafo
rS
ite2
.

2011/2012Lake
Whatcom
Report
Page2
22
05
1015
2025
30
Lake Whatcom fecal coliform data for Intake, February 1988 through December 2012.F
ecal
Col
iform
s (c
fu/1
00 m
L)
05/97 11/02 05/08
Fig
ure
B1
18
:Lake
Wh
atcom
fecalcolifo
rmd
atafo
rth
eIn
takesite.

2011/2012Lake
Whatcom
Report
Page2
23
05
1015
2025
30
Lake Whatcom fecal coliform data for Site 3, February 1988 through December 2012.F
ecal
Col
iform
s (c
fu/1
00 m
L)
05/97 11/02 05/08
Fig
ure
B1
19
:Lake
Wh
atcom
fecalcolifo
rmd
atafo
rS
ite3
.

2011/2012Lake
Whatcom
Report
Page2
24
05
1015
2025
30
Lake Whatcom fecal coliform data for Site 4, February 1988 through December 2012.F
ecal
Col
iform
s (c
fu/1
00 m
L)
05/97 11/02 05/08
Fig
ure
B1
20
:Lake
Wh
atcom
fecalcolifo
rmd
atafo
rS
ite4
.

2011/2012Lake
Whatcom
Report
Page2
250e
+00
1e+
062e
+06
3e+
064e
+06
Lake Whatcom plankton data for Site 1, February 1988 through December 2012.P
lank
ton
(#/L
)
11/91 05/97 11/02 05/08
ZooplanktonChrysophytaCyanobacteriaChlorophytaPyrrophyta
Fig
ure
B1
21
:Lake
Wh
atcom
plan
kton
data
for
Site
1.

2011/2012Lake
Whatcom
Report
Page2
260e
+00
1e+
062e
+06
3e+
064e
+06
Lake Whatcom plankton data for Site 2, February 1988 through December 2012.P
lank
ton
(#/L
)
11/91 05/97 11/02 05/08
ZooplanktonChrysophytaCyanobacteriaChlorophytaPyrrophyta
Fig
ure
B1
22
:Lake
Wh
atcom
plan
kton
data
for
Site
2.

2011/2012Lake
Whatcom
Report
Page2
270e
+00
1e+
062e
+06
3e+
064e
+06
Lake Whatcom plankton data for Intake, February 1988 through December 2012.P
lank
ton
(#/L
)
11/91 05/97 11/02 05/08
ZooplanktonChrysophytaCyanobacteriaChlorophytaPyrrophyta
Fig
ure
B1
23
:Lake
Wh
atcom
plan
kton
data
for
the
Intake
Site.

2011/2012Lake
Whatcom
Report
Page2
280e
+00
1e+
062e
+06
3e+
064e
+06
Lake Whatcom plankton data for Site 3, February 1988 through December 2012.P
lank
ton
(#/L
)
11/91 05/97 11/02 05/08
ZooplanktonChrysophytaCyanobacteriaChlorophytaPyrrophyta
Fig
ure
B1
24
:Lake
Wh
atcom
plan
kton
data
for
Site
3.

2011/2012Lake
Whatcom
Report
Page2
290e
+00
1e+
062e
+06
3e+
064e
+06
Lake Whatcom plankton data for Site 4, February 1988 through December 2012.P
lank
ton
(#/L
)
11/91 05/97 11/02 05/08
ZooplanktonChrysophytaCyanobacteriaChlorophytaPyrrophyta
Fig
ure
B1
25
:Lake
Wh
atcom
plan
kton
data
for
Site
4.

2011/2012Lake
Whatcom
Report
Page2
30
050
0000
1000
000
1500
000
Lake Whatcom plankton data for Site 1, February 1988 through December 2012.P
lank
ton
(#/L
)
11/91 05/97 11/02 05/08
ZooplanktonCyanobacteriaChlorophytaPyrrophyta
Fig
ure
B1
26
:Lake
Wh
atcom
plan
kton
data
for
Site
1,w
ithC
hry
sop
hyta
om
ittedto
show
remain
ing
plan
kton
gro
up
s.

2011/2012Lake
Whatcom
Report
Page2
31
050
0000
1000
000
1500
000
Lake Whatcom plankton data for Site 2, February 1988 through December 2012.P
lank
ton
(#/L
)
11/91 05/97 11/02 05/08
ZooplanktonCyanobacteriaChlorophytaPyrrophyta
Fig
ure
B1
27
:Lake
Wh
atcom
plan
kton
data
for
Site
2,w
ithC
hry
sop
hyta
om
ittedto
show
remain
ing
plan
kton
gro
up
s.

2011/2012Lake
Whatcom
Report
Page2
32
050
0000
1000
000
1500
000
Lake Whatcom plankton data for Intake, February 1988 through December 2012.P
lank
ton
(#/L
)
11/91 05/97 11/02 05/08
ZooplanktonCyanobacteriaChlorophytaPyrrophyta
Fig
ure
B1
28
:Lake
Wh
atcom
plan
kton
data
for
the
Intake
Site,
with
Ch
rysop
hyta
om
ittedto
show
remain
ing
plan
kton
gro
up
s.

2011/2012Lake
Whatcom
Report
Page2
33
050
0000
1000
000
1500
000
Lake Whatcom plankton data for Site 3, February 1988 through December 2012.P
lank
ton
(#/L
)
11/91 05/97 11/02 05/08
ZooplanktonCyanobacteriaChlorophytaPyrrophyta
Fig
ure
B1
29
:Lake
Wh
atcom
plan
kton
data
for
Site
3,w
ithC
hry
sop
hyta
om
ittedto
show
remain
ing
plan
kton
gro
up
s.

2011/2012Lake
Whatcom
Report
Page2
34
050
0000
1000
000
1500
000
Lake Whatcom plankton data for Site 4, February 1988 through December 2012.P
lank
ton
(#/L
)
11/91 05/97 11/02 05/08
ZooplanktonCyanobacteriaChlorophytaPyrrophyta
Fig
ure
B1
30
:Lake
Wh
atcom
plan
kton
data
for
Site
4,w
ithC
hry
sop
hyta
om
ittedto
show
remain
ing
plan
kton
gro
up
s.

2011/2012 Lake Whatcom Report Page235
B.4 Lake Whatcom Tributary Data (2004-present)
The figures in this appendix include the monthly baseline data collected from Oc-tober 2004 through September 2006, biannual data collectedfrom February 2007through September 2009, and monthly data collected during the current monitor-ing period. Each figure includes a dashed (blue) horizontal line that shows themedian value for Smith Creek and a solid (red) horizontal line that shows the me-dian value for each creek. Smith Creek was chosen as a reference because it is amajor tributary to the lake and has a history of being relatively unpolluted. Thefigures were scaled to include all but extreme outliers; off-scale outliers are listedin the figure caption. All data are available online at http://www.wwu.edu/iws.

2011/2012 Lake Whatcom Report Page236
05
1015
2025
Tem
pera
ture
(C
)
08/05 05/08 01/11
Anderson Creek
05
1015
2025
Tem
pera
ture
(C
)
08/05 05/08 01/11
Lower Austin Creek
05
1015
2025
Tem
pera
ture
(C
)
08/05 05/08 01/11
Smith Creek
05
1015
2025
Tem
pera
ture
(C
)
08/05 05/08 01/11
Whatcom Creek
Figure B131: Temperature data for Anderson, Austin, Smith,and WhatcomCreeks. Dashed (blue) horizontal reference line shows the median value for SmithCreek; solid (red) horizontal reference line shows the median value for each creek.

2011/2012 Lake Whatcom Report Page237
05
1015
2025
Tem
pera
ture
(C
)
08/05 05/08 01/11
Blue Canyon Creek
05
1015
2025
Tem
pera
ture
(C
)
08/05 05/08 01/11
Brannian Creek
05
1015
2025
Tem
pera
ture
(C
)
08/05 05/08 01/11
Carpenter Creek
05
1015
2025
Tem
pera
ture
(C
)
08/05 05/08 01/11
Olsen Creek
Figure B132: Temperature data for Blue Canyon, Brannian, Carpenter, and OlsenCreeks. Dashed (blue) horizontal reference line shows the median value for SmithCreek; solid (red) horizontal reference line shows the median value for each creek.

2011/2012 Lake Whatcom Report Page238
05
1015
2025
Tem
pera
ture
(C
)
08/05 05/08 01/11
Euclid Creek
05
1015
2025
Tem
pera
ture
(C
)
08/05 05/08 01/11
Millwheel Creek
05
1015
2025
Tem
pera
ture
(C
)
08/05 05/08 01/11
Park Place Drain
05
1015
2025
Tem
pera
ture
(C
)
08/05 05/08 01/11
Silver Beach Creek
Figure B133: Temperature data for Euclid, Millwheel, and Silver Beach Creeksand the Park Place drain. Dashed (blue) horizontal reference line shows the me-dian value for Smith Creek; solid (red) horizontal reference line shows the medianvalue for each creek.

2011/2012 Lake Whatcom Report Page239
05
1015
DO
(m
g/L)
08/05 05/08 01/11
Anderson Creek
05
1015
DO
(m
g/L)
08/05 05/08 01/11
Lower Austin Creek
05
1015
DO
(m
g/L)
08/05 05/08 01/11
Smith Creek
05
1015
DO
(m
g/L)
08/05 05/08 01/11
Whatcom Creek
Figure B134: Dissolved oxygen data for Anderson, Austin, Smith, and WhatcomCreeks. Dashed (blue) horizontal reference line shows the median value for SmithCreek; solid (red) horizontal reference line shows the median value for each creek.
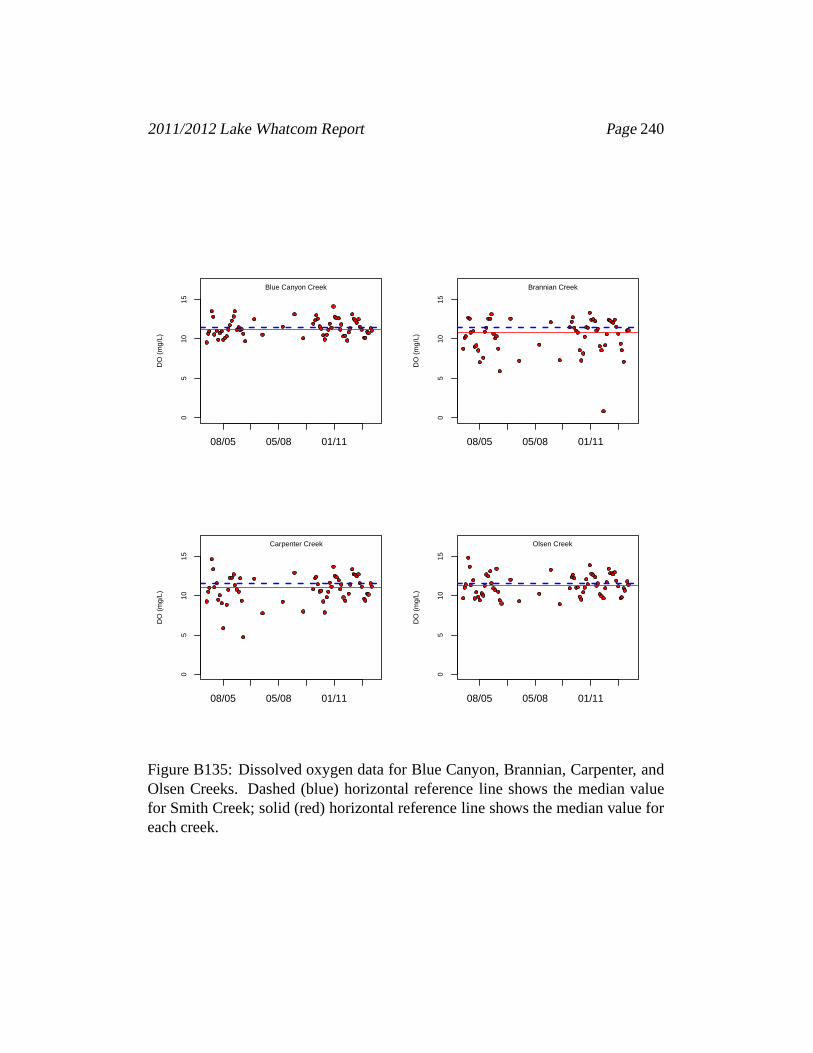
2011/2012 Lake Whatcom Report Page240
05
1015
DO
(m
g/L)
08/05 05/08 01/11
Blue Canyon Creek
05
1015
DO
(m
g/L)
08/05 05/08 01/11
Brannian Creek
05
1015
DO
(m
g/L)
08/05 05/08 01/11
Carpenter Creek
05
1015
DO
(m
g/L)
08/05 05/08 01/11
Olsen Creek
Figure B135: Dissolved oxygen data for Blue Canyon, Brannian, Carpenter, andOlsen Creeks. Dashed (blue) horizontal reference line shows the median valuefor Smith Creek; solid (red) horizontal reference line shows the median value foreach creek.

2011/2012 Lake Whatcom Report Page241
05
1015
DO
(m
g/L)
08/05 05/08 01/11
Euclid Creek
05
1015
DO
(m
g/L)
08/05 05/08 01/11
Millwheel Creek
05
1015
DO
(m
g/L)
08/05 05/08 01/11
Park Place Drain
05
1015
DO
(m
g/L)
08/05 05/08 01/11
Silver Beach Creek
Figure B136: Dissolved oxygen data for Euclid, Millwheel, and Silver BeachCreeks and the Park Place drain. Dashed (blue) horizontal reference line showsthe median value for Smith Creek; solid (red) horizontal reference line shows themedian value for each creek.
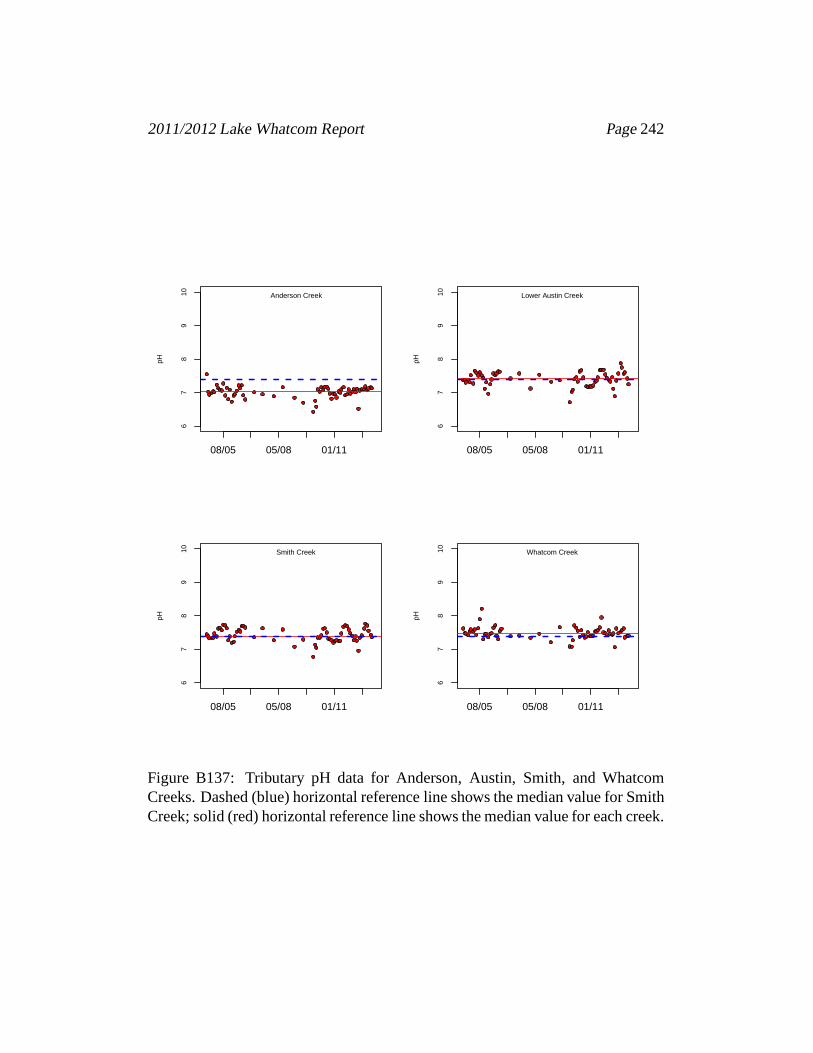
2011/2012 Lake Whatcom Report Page242
67
89
10
pH
08/05 05/08 01/11
Anderson Creek
67
89
10
pH
08/05 05/08 01/11
Lower Austin Creek
67
89
10
pH
08/05 05/08 01/11
Smith Creek
67
89
10
pH
08/05 05/08 01/11
Whatcom Creek
Figure B137: Tributary pH data for Anderson, Austin, Smith,and WhatcomCreeks. Dashed (blue) horizontal reference line shows the median value for SmithCreek; solid (red) horizontal reference line shows the median value for each creek.

2011/2012 Lake Whatcom Report Page243
67
89
10
pH
08/05 05/08 01/11
Blue Canyon Creek
67
89
10
pH
08/05 05/08 01/11
Brannian Creek
67
89
10
pH
08/05 05/08 01/11
Carpenter Creek
67
89
10
pH
08/05 05/08 01/11
Olsen Creek
Figure B138: Tributary pH data for Blue Canyon, Brannian, Carpenter, and OlsenCreeks. Dashed (blue) horizontal reference line shows the median value for SmithCreek; solid (red) horizontal reference line shows the median value for each creek.

2011/2012 Lake Whatcom Report Page244
67
89
10
pH
08/05 05/08 01/11
Euclid Creek
67
89
10
pH
08/05 05/08 01/11
Millwheel Creek
67
89
10
pH
08/05 05/08 01/11
Park Place Drain
67
89
10
pH
08/05 05/08 01/11
Silver Beach Creek
Figure B139: Tributary pH data for Euclid, Millwheel, and Silver Beach Creeksand the Park Place drain. Dashed (blue) horizontal reference line shows the me-dian value for Smith Creek; solid (red) horizontal reference line shows the medianvalue for each creek.

2011/2012 Lake Whatcom Report Page245
010
020
030
040
0
Con
d (u
S)
08/05 05/08 01/11
Anderson Creek
010
020
030
040
0
Con
d (u
S)
08/05 05/08 01/11
Lower Austin Creek
010
020
030
040
0
Con
d (u
S)
08/05 05/08 01/11
Smith Creek
010
020
030
040
0
Con
d (u
S)
08/05 05/08 01/11
Whatcom Creek
Figure B140: Conductivity data for Anderson, Austin, Smith, and WhatcomCreeks. Dashed (blue) horizontal reference line shows the median value for SmithCreek; solid (red) horizontal reference line shows the median value for each creek.

2011/2012 Lake Whatcom Report Page246
010
020
030
040
0
Con
d (u
S)
08/05 05/08 01/11
Blue Canyon Creek
010
020
030
040
0
Con
d (u
S)
08/05 05/08 01/11
Brannian Creek
010
020
030
040
0
Con
d (u
S)
08/05 05/08 01/11
Carpenter Creek
010
020
030
040
0
Con
d (u
S)
08/05 05/08 01/11
Olsen Creek
Figure B141: Conductivity data for Blue Canyon, Brannian, Carpenter, and OlsenCreeks. Dashed (blue) horizontal reference line shows the median value for SmithCreek; solid (red) horizontal reference line shows the median value for each creek.

2011/2012 Lake Whatcom Report Page247
010
020
030
040
0
Con
d (u
S)
08/05 05/08 01/11
Euclid Creek
010
020
030
040
0
Con
d (u
S)
08/05 05/08 01/11
Millwheel Creek
010
020
030
040
0
Con
d (u
S)
08/05 05/08 01/11
Park Place Drain
010
020
030
040
0
Con
d (u
S)
08/05 05/08 01/11
Silver Beach Creek
Figure B142: Conductivity data for Euclid, Millwheel, and Silver Beach Creeksand the Park Place drain. Dashed (blue) horizontal reference line shows the me-dian value for Smith Creek; solid (red) horizontal reference line shows the medianvalue for each creek.

2011/2012 Lake Whatcom Report Page248
050
100
150
200
Alk
alin
ity (
mg/
L)
08/05 05/08 01/11
Anderson Creek
050
100
150
200
Alk
alin
ity (
mg/
L)
08/05 05/08 01/11
Lower Austin Creek
050
100
150
200
Alk
alin
ity (
mg/
L)
08/05 05/08 01/11
Smith Creek
050
100
150
200
Alk
alin
ity (
mg/
L)
08/05 05/08 01/11
Whatcom Creek
Figure B143: Alkalinity data for Anderson, Austin, Smith, and Whatcom Creeks.Dashed (blue) horizontal reference line shows the median value for Smith Creek;solid (red) horizontal reference line shows the median value for each creek.

2011/2012 Lake Whatcom Report Page249
050
100
150
200
Alk
alin
ity (
mg/
L)
08/05 05/08 01/11
Blue Canyon Creek
050
100
150
200
Alk
alin
ity (
mg/
L)
08/05 05/08 01/11
Brannian Creek
050
100
150
200
Alk
alin
ity (
mg/
L)
08/05 05/08 01/11
Carpenter Creek
050
100
150
200
Alk
alin
ity (
mg/
L)
08/05 05/08 01/11
Olsen Creek
Figure B144: Alkalinity data for Blue Canyon, Brannian, Carpenter, and OlsenCreeks. Dashed (blue) horizontal reference line shows the median value for SmithCreek; solid (red) horizontal reference line shows the median value for each creek.

2011/2012 Lake Whatcom Report Page250
050
100
150
200
Alk
alin
ity (
mg/
L)
08/05 05/08 01/11
Euclid Creek
050
100
150
200
Alk
alin
ity (
mg/
L)
08/05 05/08 01/11
Millwheel Creek
050
100
150
200
Alk
alin
ity (
mg/
L)
08/05 05/08 01/11
Park Place Drain
050
100
150
200
Alk
alin
ity (
mg/
L)
08/05 05/08 01/11
Silver Beach Creek
Figure B145: Alkalinity data for Euclid, Millwheel, and Silver Beach Creeks andthe Park Place drain. Dashed (blue) horizontal reference line shows the medianvalue for Smith Creek; solid (red) horizontal reference line shows the medianvalue for each creek.

2011/2012 Lake Whatcom Report Page251
020
4060
8010
0
TS
S (
mg/
L)
08/05 05/08 01/11
Anderson Creek
020
4060
8010
0
TS
S (
mg/
L)
08/05 05/08 01/11
Lower Austin Creek
020
4060
8010
0
TS
S (
mg/
L)
08/05 05/08 01/11
Smith Creek
020
4060
8010
0
TS
S (
mg/
L)
08/05 05/08 01/11
Whatcom Creek
Figure B146: Total suspended solids data for Anderson, Austin, Smith, and What-com Creeks. Dashed (blue) horizontal reference line shows the median value forSmith Creek; solid (red) horizontal reference line shows the median value for eachcreek. Two outliers were off-scale (Austin and Anderson Creeks, Jan. 10, 2006).

2011/2012 Lake Whatcom Report Page252
020
4060
8010
0
TS
S (
mg/
L)
08/05 05/08 01/11
Blue Canyon Creek
020
4060
8010
0
TS
S (
mg/
L)
08/05 05/08 01/11
Brannian Creek
020
4060
8010
0
TS
S (
mg/
L)
08/05 05/08 01/11
Carpenter Creek
020
4060
8010
0
TS
S (
mg/
L)
08/05 05/08 01/11
Olsen Creek
Figure B147: Total suspended solids data for Blue Canyon, Brannian, Carpenter,and Olsen Creeks. Dashed (blue) horizontal reference line shows the median valuefor Smith Creek; solid (red) horizontal reference line shows the median value foreach creek. Two outliers were off-scale (Brannian and OlsenCreeks, Jan. 10,2006).

2011/2012 Lake Whatcom Report Page253
020
4060
8010
0
TS
S (
mg/
L)
08/05 05/08 01/11
Euclid Creek
020
4060
8010
0
TS
S (
mg/
L)
08/05 05/08 01/11
Millwheel Creek
020
4060
8010
0
TS
S (
mg/
L)
08/05 05/08 01/11
Park Place Drain
020
4060
8010
0
TS
S (
mg/
L)
08/05 05/08 01/11
Silver Beach Creek
Figure B148: Total suspended solids data for Euclid, Millwheel, and Silver BeachCreeks and the Park Place drain. Dashed (blue) horizontal reference line showsthe median value for Smith Creek; solid (red) horizontal reference line shows themedian value for each creek.

2011/2012 Lake Whatcom Report Page254
020
4060
8010
0
Turb
(N
TU
)
08/05 05/08 01/11
Anderson Creek
020
4060
8010
0
Turb
(N
TU
)
08/05 05/08 01/11
Lower Austin Creek
020
4060
8010
0
Turb
(N
TU
)
08/05 05/08 01/11
Smith Creek
020
4060
8010
0
Turb
(N
TU
)
08/05 05/08 01/11
Whatcom Creek
Figure B149: Turbidity data for Anderson, Austin, Smith, and Whatcom Creeks.Dashed (blue) horizontal reference line shows the median value for Smith Creek;solid (red) horizontal reference line shows the median value for each creek. Oneoutlier was off-scale (Anderson Creek, Jan. 10, 2006).

2011/2012 Lake Whatcom Report Page255
020
4060
8010
0
Turb
(N
TU
)
08/05 05/08 01/11
Blue Canyon Creek
020
4060
8010
0
Turb
(N
TU
)
08/05 05/08 01/11
Brannian Creek
020
4060
8010
0
Turb
(N
TU
)
08/05 05/08 01/11
Carpenter Creek
020
4060
8010
0
Turb
(N
TU
)
08/05 05/08 01/11
Olsen Creek
Figure B150: Turbidity data for Blue Canyon, Brannian, Carpenter, and OlsenCreeks. Dashed (blue) horizontal reference line shows the median value for SmithCreek; solid (red) horizontal reference line shows the median value for each creek.

2011/2012 Lake Whatcom Report Page256
020
4060
8010
0
Turb
(N
TU
)
08/05 05/08 01/11
Euclid Creek
020
4060
8010
0
Turb
(N
TU
)
08/05 05/08 01/11
Millwheel Creek
020
4060
8010
0
Turb
(N
TU
)
08/05 05/08 01/11
Park Place Drain
020
4060
8010
0
Turb
(N
TU
)
08/05 05/08 01/11
Silver Beach Creek
Figure B151: Turbidity data for Euclid, Millwheel, and Silver Beach Creeks andthe Park Place drain. Dashed (blue) horizontal reference line shows the medianvalue for Smith Creek; solid (red) horizontal reference line shows the medianvalue for each creek.

2011/2012 Lake Whatcom Report Page257
050
100
150
NH
4 (u
g−N
/L)
08/05 05/08 01/11
Anderson Creek
050
100
150
NH
4 (u
g−N
/L)
08/05 05/08 01/11
Lower Austin Creek
050
100
150
NH
4 (u
g−N
/L)
08/05 05/08 01/11
Smith Creek
050
100
150
NH
4 (u
g−N
/L)
08/05 05/08 01/11
Whatcom Creek
Figure B152: Ammonium data for Anderson, Austin, Smith, andWhatcomCreeks. Dashed (blue) horizontal reference line shows the median value for SmithCreek; solid (red) horizontal reference line shows the median value for each creek.

2011/2012 Lake Whatcom Report Page258
050
100
150
NH
4 (u
g−N
/L)
08/05 05/08 01/11
Blue Canyon Creek
050
100
150
NH
4 (u
g−N
/L)
08/05 05/08 01/11
Brannian Creek
050
100
150
NH
4 (u
g−N
/L)
08/05 05/08 01/11
Carpenter Creek
050
100
150
NH
4 (u
g−N
/L)
08/05 05/08 01/11
Olsen Creek
Figure B153: Ammonium data for Blue Canyon, Brannian, Carpenter, and OlsenCreeks. Dashed (blue) horizontal reference line shows the median value for SmithCreek; solid (red) horizontal reference line shows the median value for each creek.

2011/2012 Lake Whatcom Report Page259
050
100
150
NH
4 (u
g−N
/L)
08/05 05/08 01/11
Euclid Creek
050
100
150
NH
4 (u
g−N
/L)
08/05 05/08 01/11
Millwheel Creek
050
100
150
NH
4 (u
g−N
/L)
08/05 05/08 01/11
Park Place Drain
050
100
150
NH
4 (u
g−N
/L)
08/05 05/08 01/11
Silver Beach Creek
Figure B154: Ammonium data for Euclid, Millwheel, and Silver Beach Creeksand the Park Place drain. Dashed (blue) horizontal reference line shows the me-dian value for Smith Creek; solid (red) horizontal reference line shows the medianvalue for each creek. Three outliers were off-scale (Millwheel Creek, Feb. 8, 2005,July 11, 2011, Sept. 12, 2012).

2011/2012 Lake Whatcom Report Page260
050
010
0020
0030
00
NO
2/N
O3
(ug−
N/L
)
08/05 05/08 01/11
Anderson Creek
050
010
0020
0030
00
NO
2/N
O3
(ug−
N/L
)
08/05 05/08 01/11
Lower Austin Creek
050
010
0020
0030
00
NO
2/N
O3
(ug−
N/L
)
08/05 05/08 01/11
Smith Creek
050
010
0020
0030
00
NO
2/N
O3
(ug−
N/L
)
08/05 05/08 01/11
Whatcom Creek
Figure B155: Nitrate/nitrite data for Anderson, Austin, Smith, and WhatcomCreeks. Dashed (blue) horizontal reference line shows the median value for SmithCreek; solid (red) horizontal reference line shows the median value for each creek.

2011/2012 Lake Whatcom Report Page261
050
010
0020
0030
00
NO
2/N
O3
(ug−
N/L
)
08/05 05/08 01/11
Blue Canyon Creek
050
010
0020
0030
00
NO
2/N
O3
(ug−
N/L
)
08/05 05/08 01/11
Brannian Creek
050
010
0020
0030
00
NO
2/N
O3
(ug−
N/L
)
08/05 05/08 01/11
Carpenter Creek
050
010
0020
0030
00
NO
2/N
O3
(ug−
N/L
)
08/05 05/08 01/11
Olsen Creek
Figure B156: Nitrate/nitrite data for Blue Canyon, Brannian, Carpenter, and OlsenCreeks. Dashed (blue) horizontal reference line shows the median value for SmithCreek; solid (red) horizontal reference line shows the median value for each creek.

2011/2012 Lake Whatcom Report Page262
050
010
0020
0030
00
NO
2/N
O3
(ug−
N/L
)
08/05 05/08 01/11
Euclid Creek
050
010
0020
0030
00
NO
2/N
O3
(ug−
N/L
)
08/05 05/08 01/11
Millwheel Creek
050
010
0020
0030
00
NO
2/N
O3
(ug−
N/L
)
08/05 05/08 01/11
Park Place Drain
050
010
0020
0030
00
NO
2/N
O3
(ug−
N/L
)
08/05 05/08 01/11
Silver Beach Creek
Figure B157: Nitrate/nitrite data for Euclid, Millwheel, and Silver Beach Creeksand the Park Place drain. Dashed (blue) horizontal reference line shows the me-dian value for Smith Creek; solid (red) horizontal reference line shows the medianvalue for each creek.

2011/2012 Lake Whatcom Report Page263
010
0020
0030
0040
00
TN
(ug
−N
/L)
08/05 05/08 01/11
Anderson Creek
010
0020
0030
0040
00
TN
(ug
−N
/L)
08/05 05/08 01/11
Lower Austin Creek
010
0020
0030
0040
00
TN
(ug
−N
/L)
08/05 05/08 01/11
Smith Creek
010
0020
0030
0040
00
TN
(ug
−N
/L)
08/05 05/08 01/11
Whatcom Creek
Figure B158: Total nitrogen data for Anderson, Austin, Smith, and WhatcomCreeks. Dashed (blue) horizontal reference line shows the median value for SmithCreek; solid (red) horizontal reference line shows the median value for each creek.

2011/2012 Lake Whatcom Report Page264
010
0020
0030
0040
00
TN
(ug
−N
/L)
08/05 05/08 01/11
Blue Canyon Creek
010
0020
0030
0040
00
TN
(ug
−N
/L)
08/05 05/08 01/11
Brannian Creek
010
0020
0030
0040
00
TN
(ug
−N
/L)
08/05 05/08 01/11
Carpenter Creek
010
0020
0030
0040
00
TN
(ug
−N
/L)
08/05 05/08 01/11
Olsen Creek
Figure B159: Total nitrogen data for Blue Canyon, Brannian,Carpenter, andOlsen Creeks. Dashed (blue) horizontal reference line shows the median valuefor Smith Creek; solid (red) horizontal reference line shows the median value foreach creek.

2011/2012 Lake Whatcom Report Page265
010
0020
0030
0040
00
TN
(ug
−N
/L)
08/05 05/08 01/11
Euclid Creek
010
0020
0030
0040
00
TN
(ug
−N
/L)
08/05 05/08 01/11
Millwheel Creek
010
0020
0030
0040
00
TN
(ug
−N
/L)
08/05 05/08 01/11
Park Place Drain
010
0020
0030
0040
00
TN
(ug
−N
/L)
08/05 05/08 01/11
Silver Beach Creek
Figure B160: Total nitrogen data for Euclid, Millwheel, andSilver Beach Creeksand the Park Place drain. Dashed (blue) horizontal reference line shows the me-dian value for Smith Creek; solid (red) horizontal reference line shows the medianvalue for each creek.

2011/2012 Lake Whatcom Report Page266
020
4060
SR
P (
ug−
P/L
)
08/05 05/08 01/11
Anderson Creek
020
4060
SR
P (
ug−
P/L
)
08/05 05/08 01/11
Lower Austin Creek
020
4060
SR
P (
ug−
P/L
)
08/05 05/08 01/11
Smith Creek
020
4060
SR
P (
ug−
P/L
)
08/05 05/08 01/11
Whatcom Creek
Figure B161: Soluble phosphate data for Anderson, Austin, Smith, and WhatcomCreeks. Dashed (blue) horizontal reference line shows the median value for SmithCreek; solid (red) horizontal reference line shows the median value for each creek.

2011/2012 Lake Whatcom Report Page267
020
4060
SR
P (
ug−
P/L
)
08/05 05/08 01/11
Blue Canyon Creek
020
4060
SR
P (
ug−
P/L
)
08/05 05/08 01/11
Brannian Creek
020
4060
SR
P (
ug−
P/L
)
08/05 05/08 01/11
Carpenter Creek
020
4060
SR
P (
ug−
P/L
)
08/05 05/08 01/11
Olsen Creek
Figure B162: Soluble phosphate data for Blue Canyon, Brannian, Carpenter, andOlsen Creeks. Dashed (blue) horizontal reference line shows the median valuefor Smith Creek; solid (red) horizontal reference line shows the median value foreach creek.

2011/2012 Lake Whatcom Report Page268
020
4060
SR
P (
ug−
P/L
)
08/05 05/08 01/11
Euclid Creek
020
4060
SR
P (
ug−
P/L
)
08/05 05/08 01/11
Millwheel Creek
020
4060
SR
P (
ug−
P/L
)
08/05 05/08 01/11
Park Place Drain
020
4060
SR
P (
ug−
P/L
)
08/05 05/08 01/11
Silver Beach Creek
Figure B163: Soluble phosphate data for Euclid, Millwheel,and Silver BeachCreeks and the Park Place drain. Dashed (blue) horizontal reference line showsthe median value for Smith Creek; solid (red) horizontal reference line shows themedian value for each creek. One outlier was off-scale (Millwheel Creek, Feb. 8,2005).

2011/2012 Lake Whatcom Report Page269
050
100
150
200
TP
(ug
−P
/L)
08/05 05/08 01/11
Anderson Creek
050
100
150
200
TP
(ug
−P
/L)
08/05 05/08 01/11
Lower Austin Creek
050
100
150
200
TP
(ug
−P
/L)
08/05 05/08 01/11
Smith Creek
050
100
150
200
TP
(ug
−P
/L)
08/05 05/08 01/11
Whatcom Creek
Figure B164: Total phosphorus data for Anderson, Austin, Smith, and WhatcomCreeks. Dashed (blue) horizontal reference line shows the median value for SmithCreek; solid (red) horizontal reference line shows the median value for each creek.

2011/2012 Lake Whatcom Report Page270
050
100
150
200
TP
(ug
−P
/L)
08/05 05/08 01/11
Blue Canyon Creek
050
100
150
200
TP
(ug
−P
/L)
08/05 05/08 01/11
Brannian Creek
050
100
150
200
TP
(ug
−P
/L)
08/05 05/08 01/11
Carpenter Creek
050
100
150
200
TP
(ug
−P
/L)
08/05 05/08 01/11
Olsen Creek
Figure B165: Total phosphorus data for Blue Canyon, Brannian, Carpenter, andOlsen Creeks. Dashed (blue) horizontal reference line shows the median valuefor Smith Creek; solid (red) horizontal reference line shows the median value foreach creek.

2011/2012 Lake Whatcom Report Page271
050
100
150
200
TP
(ug
−P
/L)
08/05 05/08 01/11
Euclid Creek
050
100
150
200
TP
(ug
−P
/L)
08/05 05/08 01/11
Millwheel Creek
050
100
150
200
TP
(ug
−P
/L)
08/05 05/08 01/11
Park Place Drain
050
100
150
200
TP
(ug
−P
/L)
08/05 05/08 01/11
Silver Beach Creek
Figure B166: Total phosphorus data for Euclid, Millwheel, and Silver BeachCreeks and the Park Place drain. Dashed (blue) horizontal reference line showsthe median value for Smith Creek; solid (red) horizontal reference line shows themedian value for each creek. Three outliers were off-scale (Millwheel Creek,Sept. 14, 2010, Oct. 12, 2011, Sept. 12, 2012).

2011/2012 Lake Whatcom Report Page272
050
010
0015
0020
00
FC
(co
l/100
mL)
08/05 05/08 01/11
Anderson Creek
050
010
0015
0020
00
FC
(co
l/100
mL)
08/05 05/08 01/11
Lower Austin Creek
050
010
0015
0020
00
FC
(co
l/100
mL)
08/05 05/08 01/11
Smith Creek
050
010
0015
0020
00
FC
(co
l/100
mL)
08/05 05/08 01/11
Whatcom Creek
Figure B167: Fecal coliform data for Anderson, Austin, Smith, and WhatcomCreeks. Dashed (blue) horizontal reference line shows the median value for SmithCreek; solid (red) horizontal reference line shows the median value for each creek.One outlier was off-scale (Austin Creek, July 17, 2007.
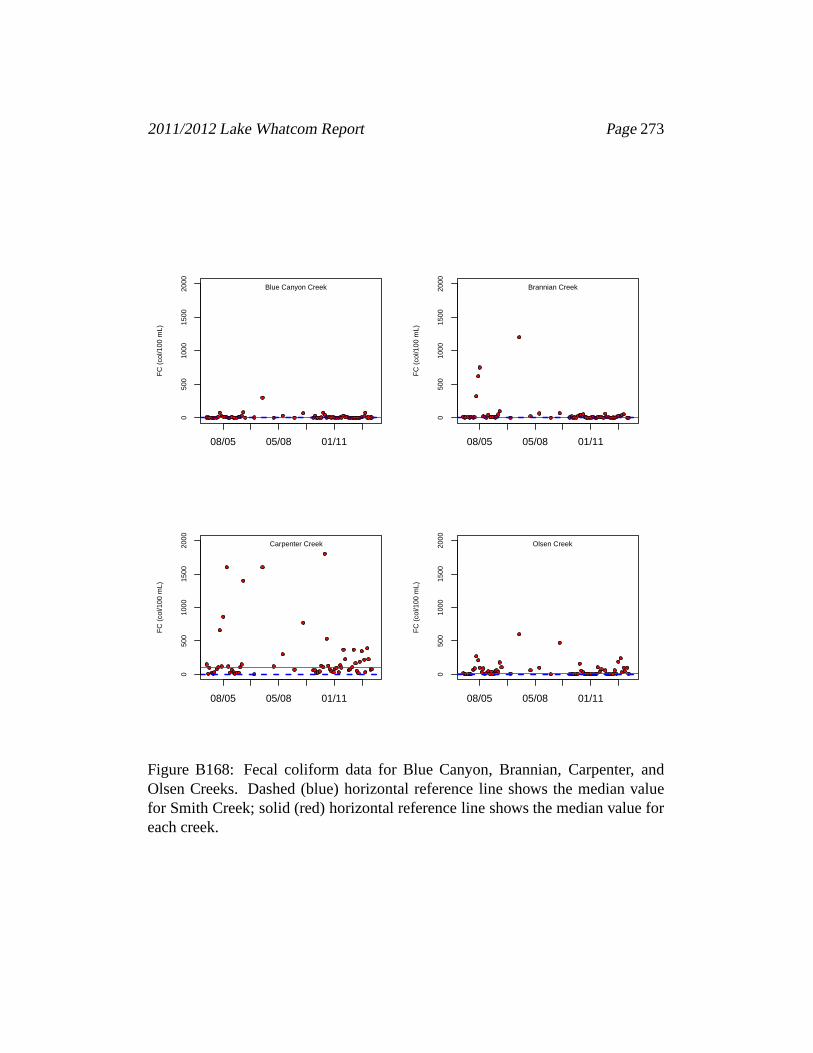
2011/2012 Lake Whatcom Report Page273
050
010
0015
0020
00
FC
(co
l/100
mL)
08/05 05/08 01/11
Blue Canyon Creek
050
010
0015
0020
00
FC
(co
l/100
mL)
08/05 05/08 01/11
Brannian Creek
050
010
0015
0020
00
FC
(co
l/100
mL)
08/05 05/08 01/11
Carpenter Creek
050
010
0015
0020
00
FC
(co
l/100
mL)
08/05 05/08 01/11
Olsen Creek
Figure B168: Fecal coliform data for Blue Canyon, Brannian,Carpenter, andOlsen Creeks. Dashed (blue) horizontal reference line shows the median valuefor Smith Creek; solid (red) horizontal reference line shows the median value foreach creek.

2011/2012 Lake Whatcom Report Page274
050
010
0015
0020
00
FC
(co
l/100
mL)
08/05 05/08 01/11
Euclid Creek
050
010
0015
0020
00
FC
(co
l/100
mL)
08/05 05/08 01/11
Millwheel Creek
050
010
0015
0020
00
FC
(co
l/100
mL)
08/05 05/08 01/11
Park Place Drain
050
010
0015
0020
00
FC
(co
l/100
mL)
08/05 05/08 01/11
Silver Beach Creek
Figure B169: Fecal coliform data for Euclid, Millwheel, andSilver Beach Creeksand the Park Place drain. Dashed (blue) horizontal reference line shows the me-dian value for Smith Creek; solid (red) horizontal reference line shows the medianvalue for each creek. Ten outliers were off-scale (Euclid Creek, Oct. 12, 2011;Millwheel Creek, Sept. 14, 2010, June 5, 2012; Park Place drain, Aug. 1 2006;Silver Beach Creek, Oct. 10, 2005, Sept. 13, 2005, Aug. 1, 2006, July 17, 2007,July 15, 2008, Sept. 13, 2011).

2011/2012 Lake Whatcom Report Page275
C Quality Control
C.1 Performance Evaluation Report
In order to maintain a high degree of accuracy and confidence in the water qualitydata all personnel associated with this project were trained according to standardoperating procedures for the methods listed in Table 1 (page16). Single-blindquality control tests were conducted as part of the IWS laboratory certificationprocess (Table C1). All results from the single-blind testswere within acceptancelimits.

2011/2012 Lake Whatcom Report Page276
Reported True Acceptance TestValue Value Limits Result
Specific conductivity (µS/cm at 25◦C) 420 418 375–462 accept
Total alkalinity (mg/L as CaCO3) 101 103 91.4–113 accept
Ammonium nitrogen, manual (mg-N/L) 7.69 7.74 5.70–9.74 accept
Ammonium nitrogen, autoanalysis (mg-N/L) 7.65 7.74 5.70–9.74 accept
Nitrate/nitrite nitrogen, autoanalysis (mg-N/L) 11.0 10.6 8.64–12.3 accept
Nitrite nitrogen, autoanalysis (mg-N/L) 0.470 0.480 0.349–0.602 accept
Orthophosphate, manual (mg-P/L) 2.37 2.40 1.94–2.88 accept
Orthophosphate, autoanalysis (mg-P/L) 2.45 2.40 1.94–2.88 accept
Total phosphorus, manual (mg-P/L) 1.64 1.66 1.31–2.06 accept
Total phosphorus, autoanalysis (mg-P/L) 1.68 1.66 1.31–2.06 accept
pH 7.78 7.80 7.60–8.00 accept
Solids, non-filterable (mg/L) 84.4 94.0 77.6–104 accept
Turbidity (NTU) 14.8 15.5 12.8–18.2 accept
Table C1: Single-blind quality control results, WP–183 (06/06/2012).

2011/2012 Lake Whatcom Report Page277
C.2 Laboratory Duplicates, Spikes, and Check Standards
Ten percent of all lake, storm water, and tributary samples analyzed in the labora-tory were duplicated to measure analytical precision. Sample matrix spikes wereanalyzed during each analytical run to evaluate analyte recovery for the nutrientanalyses (ammonium, nitrate/nitrite, total nitrogen, soluble reactive phosphate,and total phosphorus). External check standards were analyzed during each ana-lytical run to evaluate measurement precision and accuracy.27
The quality control results for laboratory duplicates, matrix spikes, and checkstandards are plotted in control charts. Upper and lower acceptance limits (±2 std. dev. from mean pair difference) and upper and lower warning limits (±3 std. dev. from mean pair difference) were developed using data from Septem-ber 2008 through September 2011 (upper examples in Figures C1–C30, pages278–307), and used to evaluate data from October 2011 through September 2012(lower examples in Figures C1–C30).
27External check standards are not available for all analytes.

2011/2012 Lake Whatcom Report Page278
−0.6
−0.4
−0.2
0.0
0.2
0.4
0.6
Alkalinity Laboratory Duplicates, Training Data
Dup
licat
e Q
C1−
QC
2
12/09 07/10 01/11 08/11
0.461 0.31
0.00939
−0.292 −0.442
−0.6
−0.4
−0.2
0.0
0.2
0.4
0.6
Alkalinity Laboratory Duplicates, Test Data
Dup
licat
e Q
C1−
QC
2
11/11 03/12 06/12 09/12
0.461 0.31
0.00939
−0.292 −0.442
Figure C1: Alkalinity laboratory duplicates for the Lake Whatcom monitoringprogram. Upper/lower acceptance limits (±2 std. dev. from mean pair difference)and upper/lower warning limits (±3 std. dev. from mean pair difference) werecalculated based on the preceding two years of lab duplicatedata.

2011/2012 Lake Whatcom Report Page279
−4
−2
0
2
4
Alkalinity Check Standards, Training Data
True
− M
easu
red
12/09 07/10 01/11 08/11
3.06 1.87
−0.513
−2.9 −4.09
−4
−2
0
2
4
Alkalinity Check Standards, Test Data
True
− M
easu
red
11/11 03/12 06/12 09/12
3.06 1.87
−0.513
−2.9 −4.09
Figure C2: Alkalinity high-range check standards for the Lake Whatcom moni-toring program. Upper/lower acceptance limits (±2 std. dev. from mean pair dif-ference) and upper/lower warning limits (±3 std. dev. from mean pair difference)were calculated based on the preceding two years of lab duplicate data.

2011/2012 Lake Whatcom Report Page280
−1.0
−0.5
0.0
0.5
1.0
1.5
Alkalinity Check Standards, Training Data
True
− M
easu
red
12/09 07/10 01/11 08/11
1.38 1.02
0.28
−0.454 −0.822
−1.0
−0.5
0.0
0.5
1.0
1.5
Alkalinity Check Standards, Test Data
True
− M
easu
red
11/11 03/12 06/12 09/12
1.38 1.02
0.28
−0.454 −0.822
Figure C3: Alkalinity low-range check standards for the Lake Whatcom moni-toring program. Upper/lower acceptance limits (±2 std. dev. from mean pair dif-ference) and upper/lower warning limits (±3 std. dev. from mean pair difference)were calculated based on the preceding two years of lab duplicate data.

2011/2012 Lake Whatcom Report Page281
−1.5−1.0−0.5
0.00.51.01.5
Chlorophyll Laboratory Duplicates, Training Data
Dup
licat
e Q
C1−
QC
2
12/09 07/10 01/11 08/11
1.31 0.911
0.11
−0.691 −1.09
−1.5−1.0−0.5
0.00.51.01.5
Chlorophyll Laboratory Duplicates, Test Data
Dup
licat
e Q
C1−
QC
2
11/11 03/12 06/12 09/12
1.31 0.911
0.11
−0.691 −1.09
Figure C4: Chlorophyll laboratory duplicates for the Lake Whatcom monitoringprogram (lake samples). Upper/lower acceptance limits (±2 std. dev. from meanpair difference) and upper/lower warning limits (±3 std. dev. from mean pair dif-ference) were calculated based on the preceding two years oflab duplicate data.

2011/2012 Lake Whatcom Report Page282
−2
−1
0
1
2
Conductivity Laboratory Duplicates, Training Data
Dup
licat
e Q
C1−
QC
2
12/09 07/10 01/11 08/11
1.76 1.18
0.0113
−1.15 −1.74
−2
−1
0
1
2
Conductivity Laboratory Duplicates, Test Data
Dup
licat
e Q
C1−
QC
2
11/11 03/12 06/12 09/12
1.76 1.18
0.0113
−1.15 −1.74
Figure C5: Conductivity laboratory duplicates for the LakeWhatcom monitoringprogram. Upper/lower acceptance limits (±2 std. dev. from mean pair difference)and upper/lower warning limits (±3 std. dev. from mean pair difference) werecalculated based on the preceding two years of lab duplicatedata.
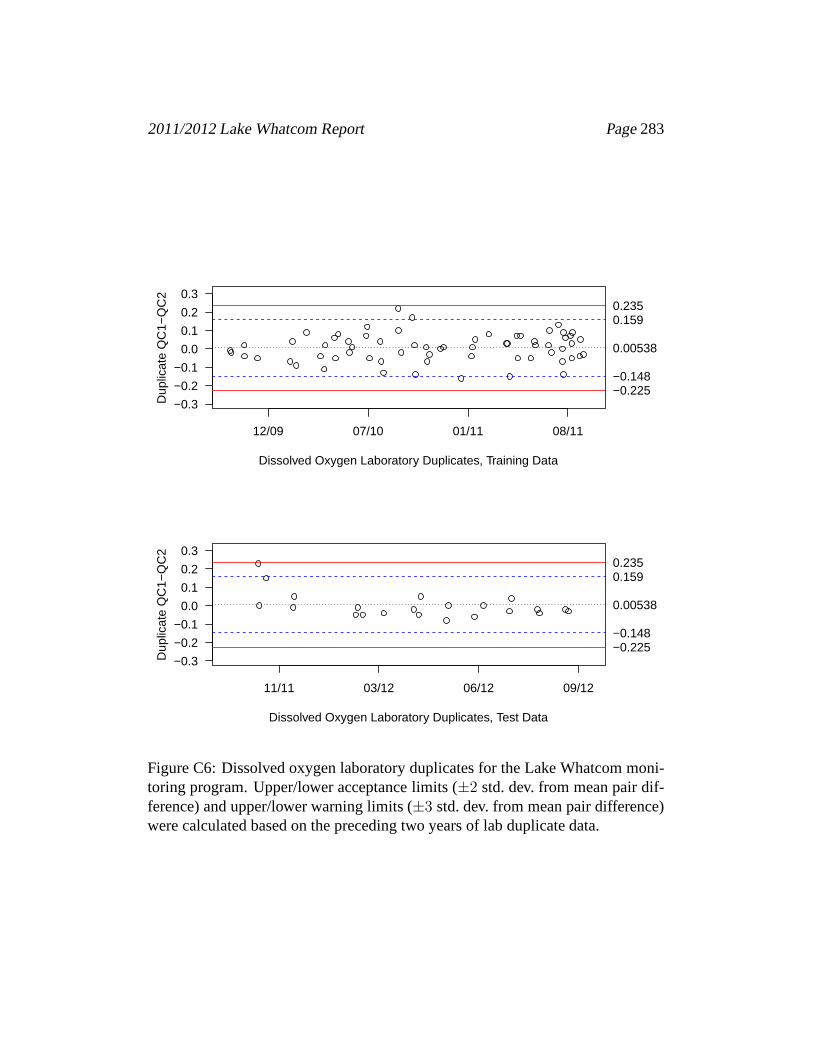
2011/2012 Lake Whatcom Report Page283
−0.3
−0.2
−0.1
0.0
0.1
0.2
0.3
Dissolved Oxygen Laboratory Duplicates, Training Data
Dup
licat
e Q
C1−
QC
2
12/09 07/10 01/11 08/11
0.235 0.159
0.00538
−0.148 −0.225
−0.3
−0.2
−0.1
0.0
0.1
0.2
0.3
Dissolved Oxygen Laboratory Duplicates, Test Data
Dup
licat
e Q
C1−
QC
2
11/11 03/12 06/12 09/12
0.235 0.159
0.00538
−0.148 −0.225
Figure C6: Dissolved oxygen laboratory duplicates for the Lake Whatcom moni-toring program. Upper/lower acceptance limits (±2 std. dev. from mean pair dif-ference) and upper/lower warning limits (±3 std. dev. from mean pair difference)were calculated based on the preceding two years of lab duplicate data.

2011/2012 Lake Whatcom Report Page284
−15−10
−505
1015
Ammonia Laboratory Duplicates, Training Data
Dup
licat
e Q
C1−
QC
2
12/09 07/10 01/11 08/11
12.7 8.54
0.272
−8 −12.1
−15−10
−505
1015
Ammonia Laboratory Duplicates, Test Data
Dup
licat
e Q
C1−
QC
2
11/11 03/12 06/12 09/12
12.7 8.54
0.272
−8 −12.1
Figure C7: Ammonium laboratory duplicates for the Lake Whatcom monitoringprogram. Upper/lower acceptance limits (±2 std. dev. from mean pair difference)and upper/lower warning limits (±3 std. dev. from mean pair difference) werecalculated based on the preceding two years of lab duplicatedata.

2011/2012 Lake Whatcom Report Page285
70
80
90
100
110
120
130
Ammonia Spike Recoveries, Training Data
Pct
. Rec
over
y
12/09 07/10 01/11 08/11
123 116
101
85.9 78.5
70
80
90
100
110
120
130
Ammonia Spike Recoveries, Test Data
Pct
. Rec
over
y
11/11 03/12 06/12 09/12
123 116
101
85.9 78.5
Figure C8: Ammonium matrix spikes for the Lake Whatcom monitoring program.Upper/lower acceptance limits (±2 std. dev. from mean pair difference) and up-per/lower warning limits (±3 std. dev. from mean pair difference) were calculatedbased on the preceding two years of lab duplicate data.

2011/2012 Lake Whatcom Report Page286
−20
0
20
40
Ammonia Check Standards, Training Data
True
− M
easu
red
12/09 07/10 01/11 08/11
30.9 21.5
2.76
−16 −25.4
−20
0
20
40
Ammonia Check Standards, Test Data
True
− M
easu
red
11/11 03/12 06/12 09/12
30.9 21.5
2.76
−16 −25.4
Figure C9: Ammonium high-range check standards for the LakeWhatcom moni-toring program. Upper/lower acceptance limits (±2 std. dev. from mean pair dif-ference) and upper/lower warning limits (±3 std. dev. from mean pair difference)were calculated based on the preceding two years of lab duplicate data.

2011/2012 Lake Whatcom Report Page287
−10
−5
0
5
10
Ammonia Check Standards, Training Data
True
− M
easu
red
12/09 07/10 01/11 08/11
10.5 7.38
1.11
−5.16 −8.3
−10
−5
0
5
10
Ammonia Check Standards, Test Data
True
− M
easu
red
11/11 03/12 06/12 09/12
10.5 7.38
1.11
−5.16 −8.3
Figure C10: Ammonium low-range check standards for the LakeWhatcom mon-itoring program. Upper/lower acceptance limits (±2 std. dev. from mean pair dif-ference) and upper/lower warning limits (±3 std. dev. from mean pair difference)were calculated based on the preceding two years of lab duplicate data.

2011/2012 Lake Whatcom Report Page288
−20
−10
0
10
20
Nitrate+Nitrite Laboratory Duplicates, Training Data
Dup
licat
e Q
C1−
QC
2
12/09 07/10 01/11 08/11
19.5 13.2
0.793
−11.7 −17.9
−20
−10
0
10
20
Nitrate+Nitrite Laboratory Duplicates, Test Data
Dup
licat
e Q
C1−
QC
2
11/11 03/12 06/12 09/12
19.5 13.2
0.793
−11.7 −17.9
Figure C11: Nitrate/nitrite laboratory duplicates for theLake Whatcom monitor-ing program. Upper/lower acceptance limits (±2 std. dev. from mean pair dif-ference) and upper/lower warning limits (±3 std. dev. from mean pair difference)were calculated based on the preceding two years of lab duplicate data.

2011/2012 Lake Whatcom Report Page289
80
90
100
110
120
Nitrate+Nitrite Spike Recoveries, Training Data
Pct
. Rec
over
y
12/09 07/10 01/11 08/11
114 109
98.1
87.4 82
80
90
100
110
120
Nitrate+Nitrite Spike Recoveries, Test Data
Pct
. Rec
over
y
11/11 03/12 06/12 09/12
114 109
98.1
87.4 82
Figure C12: Nitrate/nitrite matrix spikes for the Lake Whatcom monitoring pro-gram. Upper/lower acceptance limits (±2 std. dev. from mean pair difference)and upper/lower warning limits (±3 std. dev. from mean pair difference) werecalculated based on the preceding two years of lab duplicatedata.

2011/2012 Lake Whatcom Report Page290
−15−10
−505
101520
Nitrate+Nitrite Check Standards, Training Data
True
− M
easu
red
12/09 07/10 01/11 08/11
17 12.6
3.86
−4.91 −9.29
−15−10
−505
101520
Nitrate+Nitrite Check Standards, Test Data
True
− M
easu
red
11/11 03/12 06/12 09/12
17 12.6
3.86
−4.91 −9.29
Figure C13: Nitrate/nitrite high-range check standards for the Lake Whatcommonitoring program. Upper/lower acceptance limits (±2 std. dev. from mean pairdifference) and upper/lower warning limits (±3 std. dev. from mean pair differ-ence) were calculated based on the preceding two years of labduplicate data.

2011/2012 Lake Whatcom Report Page291
−5
0
5
10
Nitrate+Nitrite Check Standards, Training Data
True
− M
easu
red
12/09 07/10 01/11 08/11
8.11 6.11
2.12
−1.88 −3.88
−5
0
5
10
Nitrate+Nitrite Check Standards, Test Data
True
− M
easu
red
11/11 03/12 06/12 09/12
8.11 6.11
2.12
−1.88 −3.88
Figure C14: Nitrate/nitrite low-range check standards forthe Lake Whatcommonitoring program. Upper/lower acceptance limits (±2 std. dev. from mean pairdifference) and upper/lower warning limits (±3 std. dev. from mean pair differ-ence) were calculated based on the preceding two years of labduplicate data.
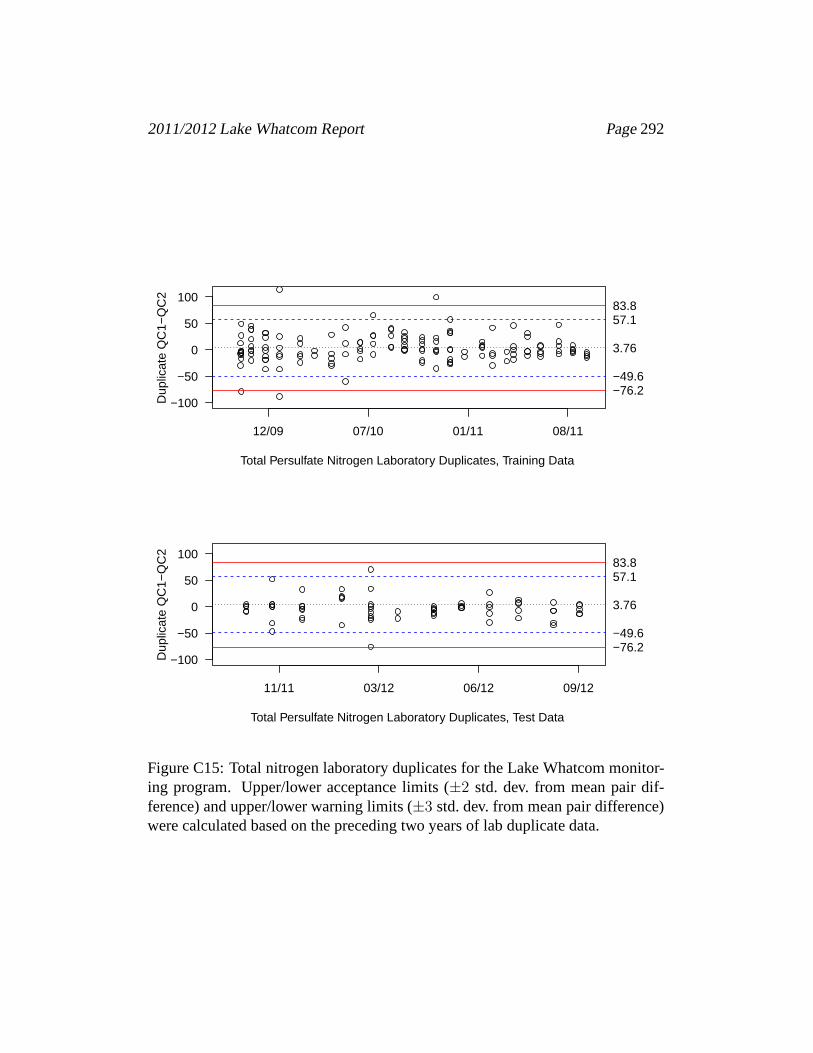
2011/2012 Lake Whatcom Report Page292
−100
−50
0
50
100
Total Persulfate Nitrogen Laboratory Duplicates, Training Data
Dup
licat
e Q
C1−
QC
2
12/09 07/10 01/11 08/11
83.8 57.1
3.76
−49.6 −76.2
−100
−50
0
50
100
Total Persulfate Nitrogen Laboratory Duplicates, Test Data
Dup
licat
e Q
C1−
QC
2
11/11 03/12 06/12 09/12
83.8 57.1
3.76
−49.6 −76.2
Figure C15: Total nitrogen laboratory duplicates for the Lake Whatcom monitor-ing program. Upper/lower acceptance limits (±2 std. dev. from mean pair dif-ference) and upper/lower warning limits (±3 std. dev. from mean pair difference)were calculated based on the preceding two years of lab duplicate data.

2011/2012 Lake Whatcom Report Page293
80
90
100
110
120
Total Persulfate Nitrogen Spike Recoveries, Training Data
Pct
. Rec
over
y
12/09 07/10 01/11 08/11
113 108
96.6
85.7 80.2
80
90
100
110
120
Total Persulfate Nitrogen Spike Recoveries, Test Data
Pct
. Rec
over
y
11/11 03/12 06/12 09/12
113 108
96.6
85.7 80.2
Figure C16: Total nitrogen matrix spikes for the Lake Whatcom monitoring pro-gram. Upper/lower acceptance limits (±2 std. dev. from mean pair difference)and upper/lower warning limits (±3 std. dev. from mean pair difference) werecalculated based on the preceding two years of lab duplicatedata.

2011/2012 Lake Whatcom Report Page294
−100
−50
0
50
Total Persulfate Nitrogen Check Standards, Training Data
True
− M
easu
red
12/09 07/10 01/11 08/11
55 29.5
−21.6
−72.6 −98.2
−100
−50
0
50
Total Persulfate Nitrogen Check Standards, Test Data
True
− M
easu
red
11/11 03/12 06/12 09/12
55 29.5
−21.6
−72.6 −98.2
Figure C17: Total nitrogen high-range check standards for the Lake Whatcommonitoring program. Upper/lower acceptance limits (±2 std. dev. from mean pairdifference) and upper/lower warning limits (±3 std. dev. from mean pair differ-ence) were calculated based on the preceding two years of labduplicate data.

2011/2012 Lake Whatcom Report Page295
−80−60−40−20
0204060
Total Persulfate Nitrogen Check Standards, Training Data
True
− M
easu
red
12/09 07/10 01/11 08/11
42.9 25
−10.8
−46.6 −64.5
−80−60−40−20
0204060
Total Persulfate Nitrogen Check Standards, Test Data
True
− M
easu
red
11/11 03/12 06/12 09/12
42.9 25
−10.8
−46.6 −64.5
Figure C18: Total nitrogen low-range check standards for the Lake Whatcommonitoring program. Upper/lower acceptance limits (±2 std. dev. from mean pairdifference) and upper/lower warning limits (±3 std. dev. from mean pair differ-ence) were calculated based on the preceding two years of labduplicate data.

2011/2012 Lake Whatcom Report Page296
−0.2
−0.1
0.0
0.1
0.2
ph Laboratory Duplicates, Training Data
Dup
licat
e Q
C1−
QC
2
12/09 07/10 01/11 08/11
0.185 0.124
0.00149
−0.121 −0.182
−0.2
−0.1
0.0
0.1
0.2
ph Laboratory Duplicates, Test Data
Dup
licat
e Q
C1−
QC
2
11/11 03/12 06/12 09/12
0.185 0.124
0.00149
−0.121 −0.182
Figure C19: Laboratory pH duplicates for the Lake Whatcom monitoring pro-gram. Upper/lower acceptance limits (±2 std. dev. from mean pair difference)and upper/lower warning limits (±3 std. dev. from mean pair difference) werecalculated based on the preceding two years of lab duplicatedata.

2011/2012 Lake Whatcom Report Page297
−3−2−1
0123
Soluble Phosphate Laboratory Duplicates, Training Data
Dup
licat
e Q
C1−
QC
2
12/09 07/10 01/11 08/11
2.5 1.63
−0.114
−1.86 −2.73
−3−2−1
0123
Soluble Phosphate Laboratory Duplicates, Test Data
Dup
licat
e Q
C1−
QC
2
11/11 03/12 06/12 09/12
2.5 1.63
−0.114
−1.86 −2.73
Figure C20: Soluble reactive phosphate laboratory duplicates for the Lake What-com monitoring program. Upper/lower acceptance limits (±2 std. dev. from meanpair difference) and upper/lower warning limits (±3 std. dev. from mean pair dif-ference) were calculated based on the preceding two years oflab duplicate data.

2011/2012 Lake Whatcom Report Page298
70
80
90
100
110
120
Soluble Phosphate Spike Recoveries, Training Data
Pct
. Rec
over
y
12/09 07/10 01/11 08/11
116 109
94.8
80.5 73.3
70
80
90
100
110
120
Soluble Phosphate Spike Recoveries, Test Data
Pct
. Rec
over
y
11/11 03/12 06/12 09/12
116 109
94.8
80.5 73.3
Figure C21: Soluble reactive phosphate matrix spikes for the Lake Whatcom mon-itoring program. Upper/lower acceptance limits (±2 std. dev. from mean pair dif-ference) and upper/lower warning limits (±3 std. dev. from mean pair difference)were calculated based on the preceding two years of lab duplicate data.

2011/2012 Lake Whatcom Report Page299
−2
0
2
4
Soluble Phosphate Check Standards, Training Data
True
− M
easu
red
12/09 07/10 01/11 08/11
4.09 3.14
1.25
−0.649 −1.6
−2
0
2
4
Soluble Phosphate Check Standards, Test Data
True
− M
easu
red
11/11 03/12 06/12 09/12
4.09 3.14
1.25
−0.649 −1.6
Figure C22: Soluble reactive phosphate high-range check standards for the LakeWhatcom monitoring program. Upper/lower acceptance limits (±2 std. dev. frommean pair difference) and upper/lower warning limits (±3 std. dev. from meanpair difference) were calculated based on the preceding twoyears of lab duplicatedata.

2011/2012 Lake Whatcom Report Page300
−2
0
2
4
Soluble Phosphate Check Standards, Training Data
True
− M
easu
red
12/09 07/10 01/11 08/11
3.39 2.45
0.572
−1.31 −2.25
−2
0
2
4
Soluble Phosphate Check Standards, Test Data
True
− M
easu
red
11/11 03/12 06/12 09/12
3.39 2.45
0.572
−1.31 −2.25
Figure C23: Soluble reactive phosphate low-range check standards for the LakeWhatcom monitoring program. Upper/lower acceptance limits (±2 std. dev. frommean pair difference) and upper/lower warning limits (±3 std. dev. from meanpair difference) were calculated based on the preceding twoyears of lab duplicatedata.

2011/2012 Lake Whatcom Report Page301
−30
−20
−10
0
10
20
30
Total Phosphorus Laboratory Duplicates, Training Data
Dup
licat
e Q
C1−
QC
2
12/09 07/10 01/11 08/11
21.3 14
−0.741
−15.5 −22.8
−30
−20
−10
0
10
20
30
Total Phosphorus Laboratory Duplicates, Test Data
Dup
licat
e Q
C1−
QC
2
11/11 03/12 06/12 09/12
21.3 14
−0.741
−15.5 −22.8
Figure C24: Total phosphorus laboratory duplicates for theLake Whatcom moni-toring program. Upper/lower acceptance limits (±2 std. dev. from mean pair dif-ference) and upper/lower warning limits (±3 std. dev. from mean pair difference)were calculated based on the preceding two years of lab duplicate data. Slightincrease in variability may be due to insufficient persulfate concentration; methodrevised to increase concentration.

2011/2012 Lake Whatcom Report Page302
70
80
90
100
110
120
Total Phosphorus Spike Recoveries, Training Data
Pct
. Rec
over
y
12/09 07/10 01/11 08/11
120 112
97.4
82.4 74.9
70
80
90
100
110
120
Total Phosphorus Spike Recoveries, Test Data
Pct
. Rec
over
y
11/11 03/12 06/12 09/12
120 112
97.4
82.4 74.9
Figure C25: Total phosphorus matrix spikes for the Lake Whatcom monitoringprogram. Upper/lower acceptance limits (±2 std. dev. from mean pair difference)and upper/lower warning limits (±3 std. dev. from mean pair difference) werecalculated based on the preceding two years of lab duplicatedata.

2011/2012 Lake Whatcom Report Page303
−10
−5
0
5
10
Total Phosphorus Check Standards, Training Data
True
− M
easu
red
12/09 07/10 01/11 08/11
6.83 4.32
−0.712
−5.74 −8.26
−10
−5
0
5
10
Total Phosphorus Check Standards, Test Data
True
− M
easu
red
11/11 03/12 06/12 09/12
6.83 4.32
−0.712
−5.74 −8.26
Figure C26: Total phosphorus high-range check standards for the Lake Whatcommonitoring program. Upper/lower acceptance limits (±2 std. dev. from mean pairdifference) and upper/lower warning limits (±3 std. dev. from mean pair differ-ence) were calculated based on the preceding two years of labduplicate data.

2011/2012 Lake Whatcom Report Page304
−5
0
5
Total Phosphorus Check Standards, Training Data
True
− M
easu
red
12/09 07/10 01/11 08/11
6.85 4.63
0.186
−4.26 −6.48
−5
0
5
Total Phosphorus Check Standards, Test Data
True
− M
easu
red
11/11 03/12 06/12 09/12
6.85 4.63
0.186
−4.26 −6.48
Figure C27: Total phosphorus low-range check standards forthe Lake Whatcommonitoring program. Upper/lower acceptance limits (±2 std. dev. from mean pairdifference) and upper/lower warning limits (±3 std. dev. from mean pair differ-ence) were calculated based on the preceding two years of labduplicate data.

2011/2012 Lake Whatcom Report Page305
−5
0
5
Total Suspended Solids Laboratory Duplicates, Training Data
Dup
licat
e Q
C1−
QC
2
12/09 07/10 01/11 08/11
5.24 3.22
−0.838
−4.89 −6.92
−5
0
5
Total Suspended Solids Laboratory Duplicates, Test Data
Dup
licat
e Q
C1−
QC
2
11/11 03/12 06/12 09/12
5.24 3.22
−0.838
−4.89 −6.92
Figure C28: Total suspended solids laboratory duplicates for the Lake Whatcommonitoring program (creek and storm water samples). Upper/lower acceptancelimits (±2 std. dev. from mean pair difference) and upper/lower warning limits(±3 std. dev. from mean pair difference) were calculated based on the precedingtwo years of lab duplicate data.

2011/2012 Lake Whatcom Report Page306
−2
0
2
4
Total Suspended Solids Check Standards, Training Data
True
− M
easu
red
12/09 07/10 01/11 08/11
3.41 2.5
0.684
−1.13 −2.04
−2
0
2
4
Total Suspended Solids Check Standards, Test Data
True
− M
easu
red
11/11 03/12 06/12 09/12
3.41 2.5
0.684
−1.13 −2.04
Figure C29: Total suspended solids check standards for the Lake Whatcom mon-itoring program (creek and storm water samples). Upper/lower acceptance lim-its (±2 std. dev. from mean pair difference) and upper/lower warning limits (±3
std. dev. from mean pair difference) were calculated based on the preceding twoyears of lab duplicate data.

2011/2012 Lake Whatcom Report Page307
−1.0
−0.5
0.0
0.5
1.0
Turbidity Laboratory Duplicates, Training Data
Dup
licat
e Q
C1−
QC
2
12/09 07/10 01/11 08/11
0.869 0.585
0.0178
−0.55 −0.833
−1.0
−0.5
0.0
0.5
1.0
Turbidity Laboratory Duplicates, Test Data
Dup
licat
e Q
C1−
QC
2
11/11 03/12 06/12 09/12
0.869 0.585
0.0178
−0.55 −0.833
Figure C30: Turbidity laboratory duplicates for the Lake Whatcom monitoringprogram. Upper/lower acceptance limits (±2 std. dev. from mean pair difference)and upper/lower warning limits (±3 std. dev. from mean pair difference) werecalculated based on the preceding two years of lab duplicatedata.

2011/2012 Lake Whatcom Report Page308
C.3 Field Duplicate Results
Field duplicates (FiguresC31–C49, pages 309–327) were collected and analyzedfor a minimum of 10% of all of the water quality parameters except the Hydrolabor YSI field meter data. To check the field meter measurements,duplicate sam-ples were analyzed for at least 10% of the field meter measurements using watersamples collected from the same depth as the field meter measurement.
The absolute mean difference for the field duplicates was calculated using thefollowing equation:
Absolute mean difference =
∑|Original Sample−Duplicate Sample|
number of duplicate pairs

2011/2012 Lake Whatcom Report Page309
17 18 19 20 21 22 23
1718
1920
2122
23
Alkalinity #1 (mg/L)
Alk
alin
ity #
2 (m
g/L)
abs mean = 0.15 mg/L
Figure C31: Alkalinity field duplicates for the 2011/2012 Lake Whatcom Moni-toring Project (lake samples). Diagonal reference line shows a 1:1 relationship.
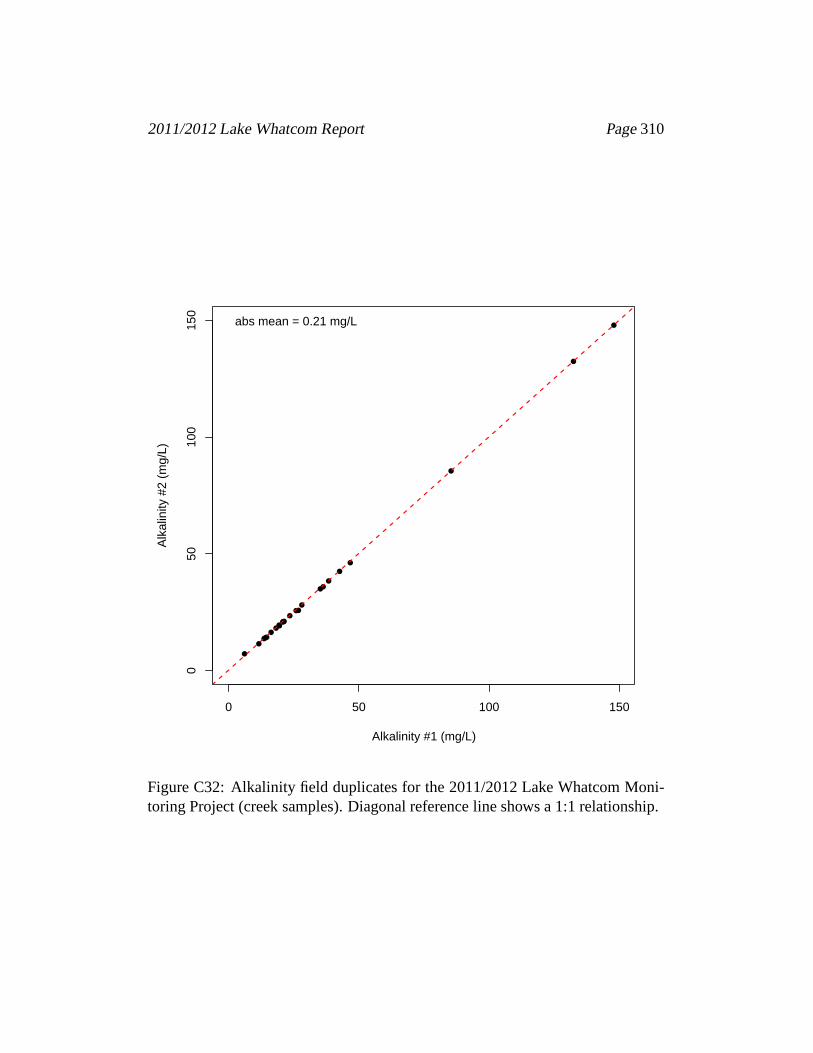
2011/2012 Lake Whatcom Report Page310
0 50 100 150
050
100
150
Alkalinity #1 (mg/L)
Alk
alin
ity #
2 (m
g/L)
abs mean = 0.21 mg/L
Figure C32: Alkalinity field duplicates for the 2011/2012 Lake Whatcom Moni-toring Project (creek samples). Diagonal reference line shows a 1:1 relationship.

2011/2012 Lake Whatcom Report Page311
0 2 4 6 8 10
02
46
810
Chlorophyll #1 (µg/L)
Chl
orop
hyll
#2 (µ
g/L)
abs mean = 0.25 ug/L
Figure C33: Chlorophyll field duplicates for the 2011/2012 Lake Whatcom Mon-itoring Project (lake samples). Diagonal reference line shows a 1:1 relationship.

2011/2012 Lake Whatcom Report Page312
55 60 65 70
5560
6570
Field Meter Conductivity (µS)
Labo
rato
ry C
ondu
ctiv
ity (µ
S)
abs mean = 1.21 uS/cm
Slight bias due to variationbetween field/lab meters
Figure C34: Conductivity field duplicates for the 2011/2012Lake Whatcom Mon-itoring Project (lake samples). Diagonal reference line shows a 1:1 relationship.The high degree of scatter is due to the low concentration of the samples.
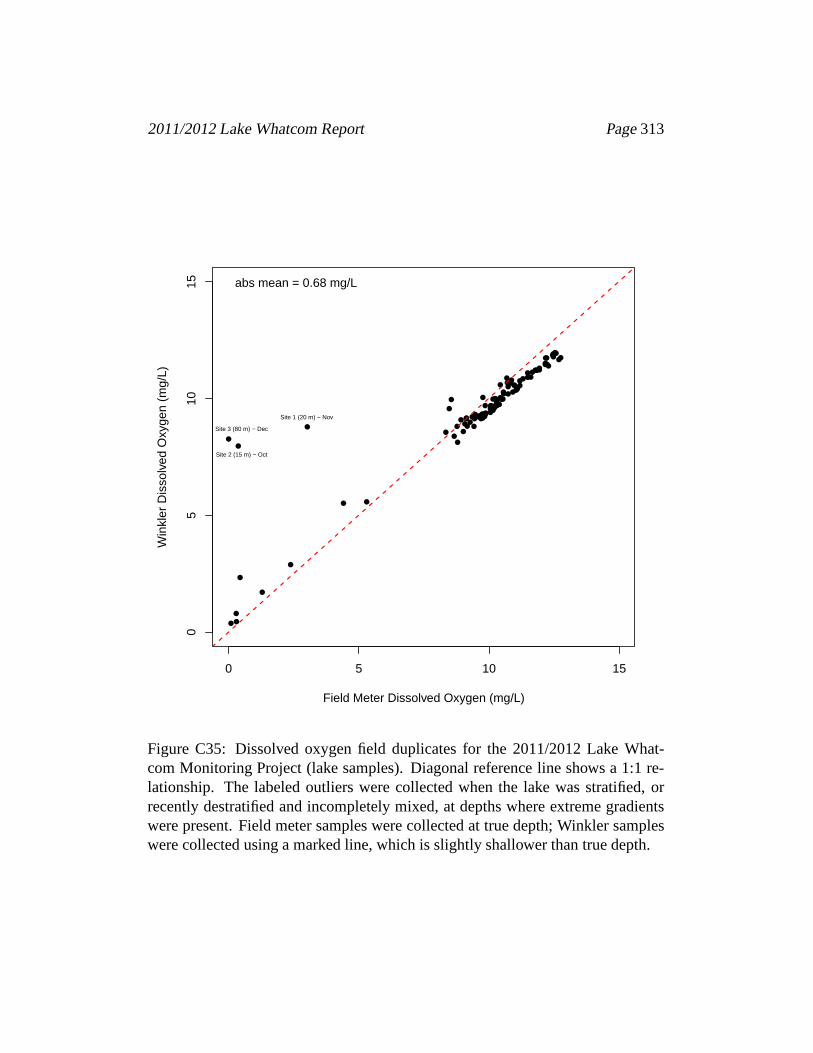
2011/2012 Lake Whatcom Report Page313
0 5 10 15
05
1015
Field Meter Dissolved Oxygen (mg/L)
Win
kler
Dis
solv
ed O
xyge
n (m
g/L)
abs mean = 0.68 mg/L
Site 3 (80 m) − Dec
Site 2 (15 m) − Oct
Site 1 (20 m) − Nov
Figure C35: Dissolved oxygen field duplicates for the 2011/2012 Lake What-com Monitoring Project (lake samples). Diagonal referenceline shows a 1:1 re-lationship. The labeled outliers were collected when the lake was stratified, orrecently destratified and incompletely mixed, at depths where extreme gradientswere present. Field meter samples were collected at true depth; Winkler sampleswere collected using a marked line, which is slightly shallower than true depth.

2011/2012 Lake Whatcom Report Page314
7 8 9 10 11 12 13 14
78
910
1112
1314
YSI Dissolved Oxygen (mg/L)
Win
kler
Dis
solv
ed O
xyge
n (m
g/L)
abs mean = 0.48 mg/L
Figure C36: Dissolved oxygen field duplicates for the 2011/2012 Lake WhatcomMonitoring Project (creek samples). Diagonal reference line shows a 1:1 relation-ship.

2011/2012 Lake Whatcom Report Page315
0 10 20 30 40 50
010
2030
4050
Ammonium #1 (µg−N/L)
Am
mon
ium
#2
(µg−
N/L
)
abs mean = 3.51 ug−N/L
Figure C37: Ammonium field duplicates for the 2011/2012 LakeWhatcom Mon-itoring Project (lake samples). Diagonal reference line shows a 1:1 relationship;horizontal reference line shows the current detection limits. The high degree ofscatter is due to the low concentrations of the samples.

2011/2012 Lake Whatcom Report Page316
0 5 10 15 20 25
05
1015
2025
Ammonium #1 (µg−N/L)
Am
mon
ium
#2
(µg−
N/L
)
abs mean = 3.73 ug−N/L
Figure C38: Ammonium field duplicates for the 2011/2012 LakeWhatcom Mon-itoring Project (creek samples). Diagonal reference line shows a 1:1 relationship;horizontal reference line shows the current detection limits. The high degree ofscatter is due to the low concentrations of the samples.
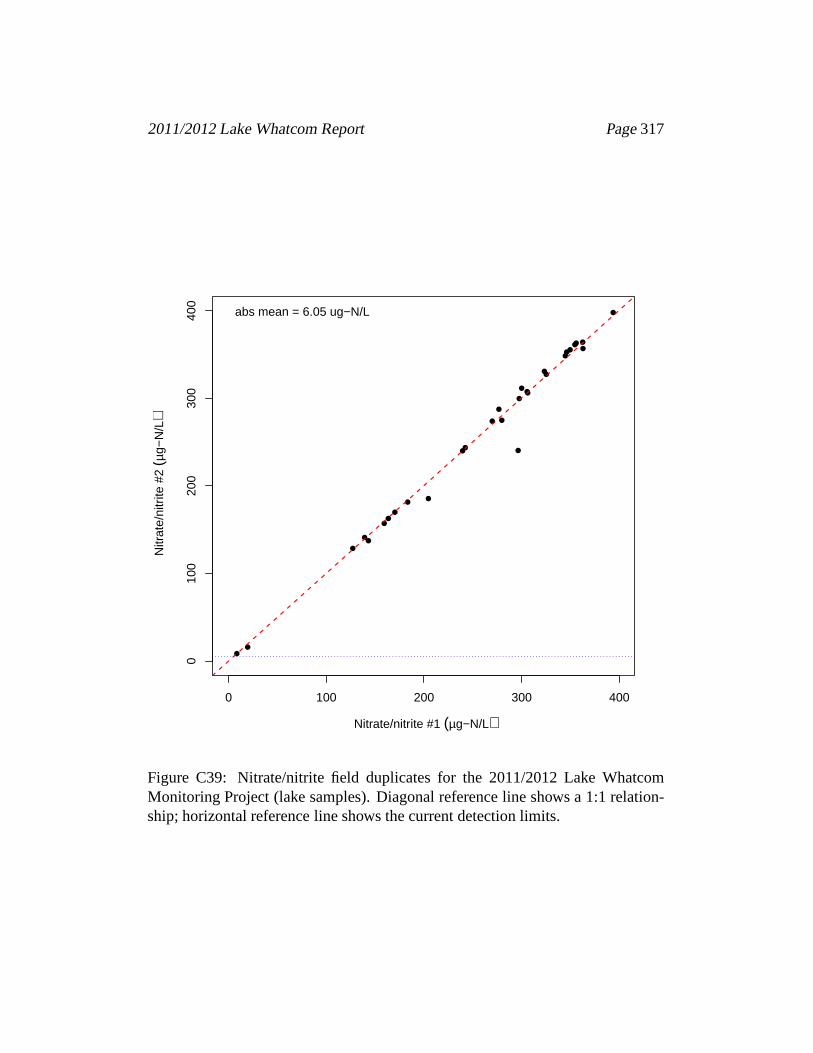
2011/2012 Lake Whatcom Report Page317
0 100 200 300 400
010
020
030
040
0
Nitrate/nitrite #1 (µg−N/L)
Nitr
ate/
nitr
ite #
2 (µ
g−N
/L)
abs mean = 6.05 ug−N/L
Figure C39: Nitrate/nitrite field duplicates for the 2011/2012 Lake WhatcomMonitoring Project (lake samples). Diagonal reference line shows a 1:1 relation-ship; horizontal reference line shows the current detection limits.

2011/2012 Lake Whatcom Report Page318
0 500 1000 1500
050
010
0015
00
Nitrate/nitrite #1 (µg−N/L)
Nitr
ate/
nitr
ite #
2 (µ
g−N
/L)
abs mean = 9.1 ug−N/L
Figure C40: Nitrate/nitrite field duplicates for the 2011/2012 Lake WhatcomMonitoring Project (creek samples). Diagonal reference line shows a 1:1 rela-tionship; horizontal reference line shows the current detection limits.

2011/2012 Lake Whatcom Report Page319
200 300 400 500 600
200
300
400
500
600
Total nitrogen (µg−N/L)
Tota
l nitr
ogen
(µg−
N/L
)
abs mean = 10.32 ug−N/L
Figure C41: Total nitrogen field duplicates for the 2011/2012 Lake WhatcomMonitoring Project (lake samples). Diagonal reference line shows a 1:1 relation-ship. All total nitrogen samples were above the detection limit.

2011/2012 Lake Whatcom Report Page320
0 500 1000 1500
050
010
0015
00
Total nitrogen #1 (µg−N/L)
Tota
l nitr
ogen
#2
(µg−
N/L
)
abs mean = 13.25 ug−N/L
Figure C42: Total nitrogen field duplicates for the 2011/2012 Lake WhatcomMonitoring Project (creek samples). Diagonal reference line shows a 1:1 relation-ship. All total nitrogen samples were above the detection limit.

2011/2012 Lake Whatcom Report Page321
5.5 6.0 6.5 7.0 7.5 8.0 8.5 9.0
5.5
6.0
6.5
7.0
7.5
8.0
8.5
9.0
Field Meter pH
Labo
rato
ry p
H
abs mean = 0.28 pH units
Slight bias due to variationbetween field/lab meters
Figure C43: Field duplicates for pH from the 2011/2012 Lake Whatcom Monitor-ing Project (lake samples). Diagonal reference line shows a1:1 relationship.

2011/2012 Lake Whatcom Report Page322
0 5 10 15 20
05
1015
20
Soluble phosphate #1 (µg−P/L)
Sol
uble
pho
spha
te #
2 (µ
g−P
/L)
abs mean = 1.21 ug−P/L
Figure C44: Soluble phosphorus field duplicates for the 2011/2012 Lake What-com Monitoring Project (creek samples). Diagonal reference line shows a 1:1 re-lationship; horizontal reference line shows the current detection limits. The highdegree of scatter is due to the low concentrations of the samples.

2011/2012 Lake Whatcom Report Page323
0 5 10 15 20
05
1015
20
Total phosphorus (µg−P/L)
Tota
l pho
spho
rus
(µg−
P/L
)
abs mean = 2.17 ug−P/L
Figure C45: Total phosphorus field duplicates for the 2011/2012 Lake WhatcomMonitoring Project (lake samples). Diagonal reference line shows a 1:1 relation-ship; horizontal reference line shows the current detection limits. The high degreeof scatter is due to the low concentrations of the samples.

2011/2012 Lake Whatcom Report Page324
0 10 20 30 40 50
010
2030
4050
Total phosphorus #1 (µg−P/L)
Tota
l pho
spho
rus
#2 (µ
g−P
/L)
abs mean = 2.62 ug−P/L
Figure C46: Total phosphorus field duplicates for the 2011/2012 Lake WhatcomMonitoring Project (creek samples). Diagonal reference line shows a 1:1 relation-ship; horizontal reference line shows the current detection limits. The high degreeof scatter is due to the low concentrations of the samples.

2011/2012 Lake Whatcom Report Page325
0 5 10 15
05
1015
T. Susp. Solids #1 (mg/L)
T. S
usp.
Sol
ids
#2 (
mg/
L)
abs mean = 0.64 mg/L
Figure C47: Total suspended solids field duplicates for the 2011/2012 Lake What-com Monitoring Project (creek samples). Diagonal reference line shows a 1:1relationship.

2011/2012 Lake Whatcom Report Page326
0.0 0.5 1.0 1.5 2.0
0.0
0.5
1.0
1.5
2.0
Turbidity #1 (NTU)
Turb
idity
#2
(NT
U)
abs mean = 0.07 NTU
Figure C48: Turbidity field duplicates for the 2011/2012 Lake Whatcom Moni-toring Project (lake samples). Diagonal reference line shows a 1:1 relationship.

2011/2012 Lake Whatcom Report Page327
0 2 4 6 8 10
02
46
810
Turbidity #1 (NTU)
Turb
idity
#2
(NT
U)
abs mean = 0.22 NTU
Figure C49: Turbidity field duplicates for the 2011/2012 Lake Whatcom Moni-toring Project (creek samples). Diagonal reference line shows a 1:1 relationship.

2011/2012 Lake Whatcom Report Page328
(This page blank)

2011/2012 Lake Whatcom Report Page329
D Lake Whatcom Online Data
The followingreadmefile describes the electronic data posted at the IWS web siteand additional data available from IWS. Please contact the Director of the Institutefor Watershed Studies if you have questions or trouble accessing the online data.
************************************************************** README FILE - LAKE WHATCOM ONLINE DATA
* THIS FILE WAS UPDATED MARCH 7, 2013
*************************************************************Most of the Lake Whatcom water quality data are available inelectronic format at the IWS website (http://www.wwu.edu/iws) or fromthe IWS Director.
The historic and current detection limits and abbreviations for eachparameter are listed in the annual reports. The historic detectionlimits for each parameter were estimated based on recommended lowerdetection ranges, instrument limitations, and analyst judgment on thelowest repeatable concentration for each test. Over time, someanalytical techniques have improved so that current detection limitsare usually lower than historic detection limits. Because the LakeWhatcom data set includes long-term monitoring data, which have beencollected using a variety of analytical techniques, this report setsconservative detection limits to allow comparisons between years.
All files are comma-separated ascii data files. The code "NA" hasbeen entered into all empty cells in the ascii data files to fill inunsampled dates and depths, missing data, etc. Questions aboutmissing data should be directed to the IWS Director.
Unless otherwise indicated, the electronic data files have NOT beencensored to flag or otherwise identify below detection and abovedetection values. As a result, the ascii files may contain negativevalues due to linear extrapolation of the standards regression curvefor below detection data. It is essential that any statistical oranalytical results that are generated using these data be reviewed bysomeone familiar with statistical uncertainty associated withuncensored data.

2011/2012 Lake Whatcom Report Page330
************************************************************** ONLINE LAKE DATA FILES:
*************************************************************Hydrolab/YSI data Water quality data Plankton data1988_hl.csv 1988_wq.csv plankton.csv1989_hl.csv 1989_wq.csv1990_hl.csv 1990_wq.csv1991_hl.csv 1991_wq.csv1992_hl.csv 1992_wq.csv1993_hl.csv 1993_wq.csv1994_hl.csv 1994_wq.csv1995_hl.csv 1995_wq.csv1996_hl.csv 1996_wq.csv1997_hl.csv 1997_wq.csv1998_hl.csv 1998_wq.csv1999_hl.csv 1999_wq.csv2000_hl.csv 2000_wq.csv2001_hl.csv 2001_wq.csv2002_hl.csv 2002_wq.csv2003_hl.csv 2003_wq.csv2004_hl.csv 2004_wq.csv2005_hl.csv 2005_wq.csv2006_hl.csv 2006_wq.csv2007_hl.csv 2007_wq.csv2008_hl.csv 2008_wq.csv2009_hl.csv 2009_wq.csv2010_hl.csv 2010_wq.csv2011_hl.csv 2011_wq.csv2012_hl.csv 2012_wq.csv
The *_hl.csv files include: site, depth (m), month, day, year, temp(water temperature, C), pH, cond (specific conductivity, uS/cm), do(dissolved oxygen, mg/L), lcond (lab conductivity quality controldata, uS/cm), secchi (secchi depth, m).
The *_wq.csv files include: site, depth (m), month, day, year, alk(alkalinity, mg/L as CaCO3), turb (turbidity. NTU), nh3 (ammonium,ug-N/L), tn (total persulfate nitrogen, ug-N/L), nos (nitrate/nitrite, ug-N/L), srp (soluble reactive phosphate, ug-P/L), tp (totalpersulfate phosphorus, ug-P/L), chl (chlorophyll, ug/L).
The plankton.csv file includes: site, depth (m), month, day, year,zoop (zooplankton, #/L), chry (chrysophyta, #/L), cyan(cyanobacteria, #/L), chlo (chlorophyta, #/L), pyrr (pyrrophyta,#/L).

2011/2012 Lake Whatcom Report Page331
************************************************************** ONLINE HYDROGRAPH DATA FILES:
*************************************************************WY1998.csvWY1999.csvWY2000_rev.csv (revised March 8, 2012)WY2001.csvWY2002.csvWY2003.csvWY2004_rev.csv (revised June 21, 2006)WY2005.csvWY2006.csvWY2007.csv (revised July 31, 2008)WY2008.csvWY2009.csvWY2010.csvWY2011.csvWY2012.csv
The WY*.csv files include: month, day, year, hour, min, sec, ander.g(anderson gage height, ft), ander.cfs(anderson discharge, cfs),austin.g (austin gage height, ft), austin.cfs (austin discharge,cfs), smith.g (smith gage height, ft), smith.cfs (smith discharge,cfs). Anderson Creek hydrograph data were deleted in WY2000_rev.csvdue to uncertainty about the gage height; Anderson Creek data areavailable for WY1998, WY1999, and WY2001-WY2007. Beginning withWY2002, the variable "time" replaced "hour, min, sec," with timereported daily on a 24-hr basis. Data are reported as PacificStandard Time without Daylight Saving Time adjustment.
************************************************************** STORM WATER DATA FILES
*************************************************************The storm water data include composite and grab samples from numeroussites in the Lake Whatcom watershed (1994--present), representing avariety of study objectives and sampling intensities over time. Theelectronic data files are not posted online, but may be obtained bycontacting the Institute for Watershed Studies.

2011/2012 Lake Whatcom Report Page332
************************************************************** TRIBUTARY DATA FILES:
*************************************************************CURRENT (ONLINE):The current creek data are listed in creeks.csv. The data filecontains the following variables: code (IWS site code), site(descriptive site name), month, day, year, time (24-hr basis), temp(water temperature, C), ph, do (dissolved oxygen, mg/L), cond(specific conductivity, uS/cm), turb (turbidity, NTU), alk(alkalinity, mg/L as CaCO3), tp (total phosphorus, ug-P/L), tn (totalnitrogen, ug-N/L), nos (nitrite+nitrate, ug-N/L), srp (solublereactive phosphate, ug-P/L), nh3 (ammonium, ug-N/L), tss (totalsuspended solids, mg/L), ts (total solids, mg/L), ecoli (E.coli,cfu/100 mL), fc (fecal coliforms, cfu/100 mL)
HISTORIC STORM WATER MONITORING DATA:Historic creek data include metals and toc data (creeksmetaltoc.csv);results from an intensive sampling effort in Austin Creek and Creek(creekwalk.csv); a 48-hr creek sampling project; and dischargeestimated from ungauged sites. The electronic data are not availableonline, but may be obtained by contacting the Institute for WatershedStudies.
************************************************************** SITE CODES
* ALL FILES - INCLUDES DISCONTINUED SITES AND OFF-LINE DATA
*************************************************************The site codes in the data are as follows:
11 = Lake Whatcom Site 121 = Lake Whatcom Intake site22 = Lake Whatcom Site 231 = Lake Whatcom Site 332 = Lake Whatcom Site 433 = Strawberry Sill site S134 = Strawberry Sill site S235 = Strawberry Sill site S3
AlabamaVault inlet = Alabama canister vault inletAlabamaVault outlet = Alabama canister vault outletBrentwood inlet = Brentwood wet pond inletBrentwood outlet = Brentwood wet pond outletParkPlace cell1 = Park Place wet pond cell 1ParkPlace cell2 = Park Place wet pond cell 2
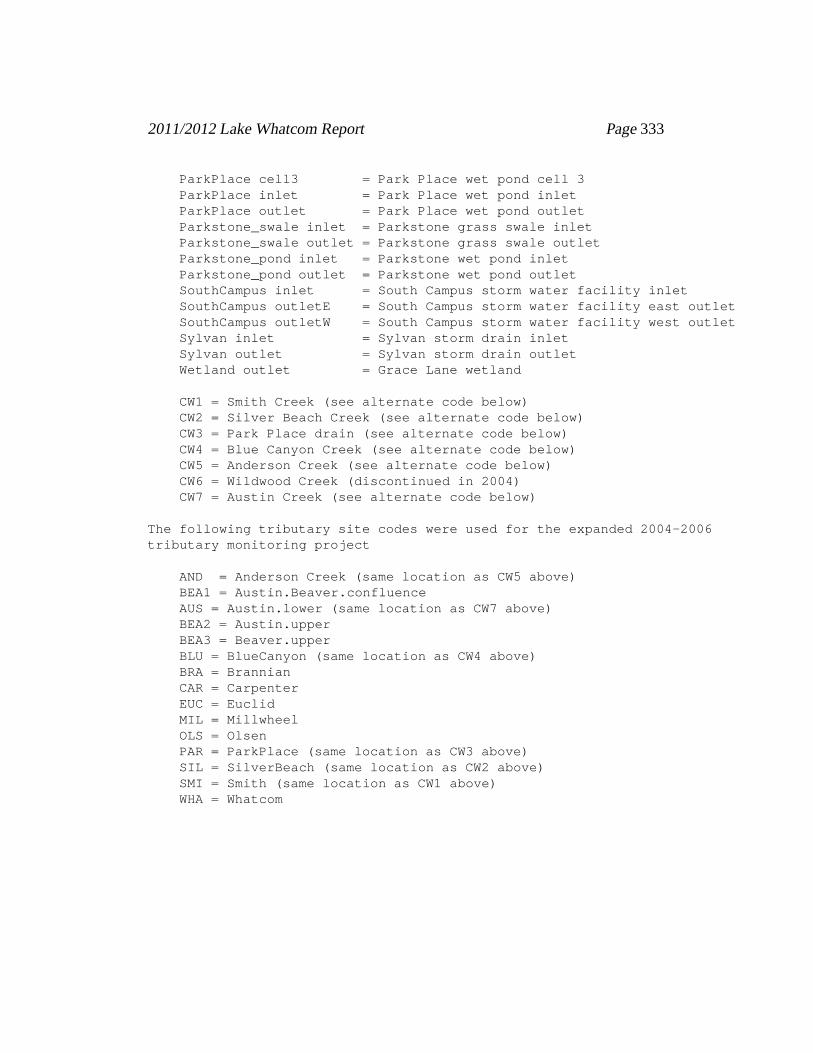
2011/2012 Lake Whatcom Report Page333
ParkPlace cell3 = Park Place wet pond cell 3ParkPlace inlet = Park Place wet pond inletParkPlace outlet = Park Place wet pond outletParkstone_swale inlet = Parkstone grass swale inletParkstone_swale outlet = Parkstone grass swale outletParkstone_pond inlet = Parkstone wet pond inletParkstone_pond outlet = Parkstone wet pond outletSouthCampus inlet = South Campus storm water facility inletSouthCampus outletE = South Campus storm water facility east outletSouthCampus outletW = South Campus storm water facility west outletSylvan inlet = Sylvan storm drain inletSylvan outlet = Sylvan storm drain outletWetland outlet = Grace Lane wetland
CW1 = Smith Creek (see alternate code below)CW2 = Silver Beach Creek (see alternate code below)CW3 = Park Place drain (see alternate code below)CW4 = Blue Canyon Creek (see alternate code below)CW5 = Anderson Creek (see alternate code below)CW6 = Wildwood Creek (discontinued in 2004)CW7 = Austin Creek (see alternate code below)
The following tributary site codes were used for the expanded 2004-2006tributary monitoring project
AND = Anderson Creek (same location as CW5 above)BEA1 = Austin.Beaver.confluenceAUS = Austin.lower (same location as CW7 above)BEA2 = Austin.upperBEA3 = Beaver.upperBLU = BlueCanyon (same location as CW4 above)BRA = BrannianCAR = CarpenterEUC = EuclidMIL = MillwheelOLS = OlsenPAR = ParkPlace (same location as CW3 above)SIL = SilverBeach (same location as CW2 above)SMI = Smith (same location as CW1 above)WHA = Whatcom

2011/2012 Lake Whatcom Report Page334
************************************************************** VERIFICATION PROCESS FOR THE LAKE WHATCOM DATA FILES
*************************************************************During the summer of 1998 the Institute for Watershed Studies begancreating an electronic data file that would contain long term datarecords for Lake Whatcom. These data were to be included with annualLake Whatcom monitoring reports. This was the first attempt to make along-term Lake Whatcom data record available to the public. Becausethese data had been generated using different quality control plansover the years, a comprehensive re-verification process was done.
The re-verification started with printing a copy of the entire datafile and checking 5% of all entries against historic laboratory benchsheets and field notebooks. If an error was found, the entire set ofvalues for that analysis were reviewed for the sampling periodcontaining the error. Corrections were noted in the printed copy andentered into the electronic file; all entries were dated and initialedin the archive copy.
Next, all data were plotted and descriptive statistics (e.g., minimum,maximum) were computed to identify outliers and unusual results. Alloutliers and unusual data were verified against original bench sheets.A summary of decisions pertaining to these data is presented below.All verification actions were entered into the printed copy, dated,and initialed by the IWS director.
The following is a partial list of the changes made to the verifiedLake Whatcom data files. For detailed information refer to the dataverification archive files in the IWS library.
Specific Deletions: 1) Rows containing only missing values weredeleted. 2) All lab conductivity for February 1993 were deleted forcause: meter inadequate for low conductivity readings (borrowedHuxley’s student meter). 3) All Hydrolab conductivity from April -December 1993 were deleted for cause: Hydrolab probe slowly lostsensitivity. Probe was replaced and Hydrolab was reconditioned priorto the February 1994 sampling. 4) All 1993 Hydrolab dissolved oxygendata less than or equal to 2.6 mg/L were deleted for cause: Hydrolabprobe lost sensitivity at low oxygen concentrations. Probe wasreplaced and Hydrolab was reconditioned prior to February 1994sampling. 5) All srp and tp data were deleted (entered as "missing"in 1989) from the July 10, 1989 wq data due to sample contamination inat least three samples. 6) December 2, 1991, Site 3, 0 m conductivitypoint deleted due to inconsistency with adjacent points. 7) December15, 1993, Site 4, 80 m lab conductivity point deleted because matching

2011/2012 Lake Whatcom Report Page335
field conductivity data are absent and point is inconsistent with allother lab conductivity points. 8) November 4, 1991, Site 2, 17-20 m,conductivity points deleted due to evidence of equipment problemsrelated to depth. 9) February 2, 1990, Site 1, 20 m, soluble reactivephosphate and total phosphorus points deleted due to evidence ofsample contamination. 10) August 6, 1990, Site 1, 0 m, solublereactive phosphate and total phosphorus points deleted due to evidenceof sample contamination. 11) October 5, 1992, Site 3, 80 m, all datadeleted due to evidence of sample contamination in turbidity,ammonium, and total phosphorus results. 12) August 31, 1992, Site 3,5 m, soluble reactive phosphate and total phosphorus data deleted dueto probable coding error. 13) All total Kjeldahl nitrogen data wereremoved from the historic record. This was not due to errors with thedata but rather on-going confusion over which records contained totalpersulfate nitrogen and which contained total Kjeldahl nitrogen. Thecurrent historic record contains only total persulfate nitrogen.Total Kjeldahl nitrogen data were retained in the IWS data base, butnot in the long-term Lake Whatcom data files.
************************************************************** ROUTINE DATA VERIFICATION PROCESS
*************************************************************1994-present: The Lake Whatcom data are verified using a four stepmethod: 1) The results are reviewed as they are generated. Outliersare checked for possible analytical or computational errors. Thisstep is completed by the Laboratory Analyst and IWS LaboratorySupervisor. 2) The results are reviewed monthly and sent to the City.Unusual results are identified. This step is completed by the IWSDirector. 3) The results are reviewed on an annual basis anddiscussed in the Lake Whatcom Monitoring Program Final Report.Unusual results are identified, and explained, if possible. This stepis completed by the IWS Director, IWS Laboratory Supervisor, andLaboratory Analyst. 4) Single-blind quality control samples,laboratory duplicates, and field duplicates are analyzed as specifiedin the Lake Whatcom Monitoring Program contract and in the IWSLaboratory Certification requirements. Unusual results that suggestinstrumentation or analytical problems are reported to the IWSDirector and City. The results from these analyses are summarized inthe annual report.
1987-1993: The lake data were reviewed as above except that the IWSDirector’s responsibilities were delegated to the PrincipleInvestigator in charge of the lake monitoring contract (Dr. RobinMatthews).

2011/2012 Lake Whatcom Report Page336
Prior to 1987: Data were informally reviewed by the Laboratory Analystand IWS Director. Laboratory and field duplicates were commonlyincluded as part of the analysis process, but no formal (i.e.,written) quality control program was in place. Laboratory logs weremaintained for most analyses, so it is possible to verify data againstoriginal analytical results. It is also possible to review laboratoryquality control results for some analyses.