lake tahoe water quality...
TRANSCRIPT

1
Lake Tahoe Water Quality
Investigations
Algal Bioassay • Phytoplankton • Atmospheric
Nutrient Deposition •
Periphyton •
Annual Report:
July 1, 2010– June 30, 2011
Agreement No. 10-031-160
Submitted to:
State Water Resources Control Board
Lahontan Regional Water Quality Control Board
Submitted by:
Tahoe Environmental Research Center
University of California, Davis
Scott H. Hackley
Brant C. Allen
Debbie A. Hunter
John E. Reuter, Principal Investigator
December 1, 2011

2
Table of Contents
Project Overview . . . . . . . . . . . . . . . . . . . . . . . . . . . . . . . . . . . . . . . . . . . . . . . . .4
Task 1. Project Management and Administration . . . . . . . . . . . . . . . . . . . . . . . .6
Task 2. Project Quality Assurance . . . . . . . . . . . . . . . . . . . . . . . . . . . . . . . . . . . 6
Task 3. Algal Growth Bioassays . . . . . . . . . . . . . . . . . . . . . . . . . . . . . . . . . . . . .8
Task 4a. Phytoplankton Enumeration and Analysis . . . . . . . . . . . . . . . . . . . . . 14
Task 4b. Archiving of Zooplankton Samples . . . . . . . . . . . . . . . . . . . . . . . . . . 18
Task 5. Atmospheric Deposition of Nitrogen and Phosphorus . . . . . . . . . . . . . 18
Task 6. Periphyton . . . . . . . . . . . . . . . . . . . . . . . . . . . . . . . . . . . . . . . . . . . . . . . 27
References . . . . . . . . . . . . . . . . . . . . . . . . . . . . . . . . . . . . . . . . . . . . . . . .52
Appendix 1 Ward Valley Lake Level Station Wet Deposition Data Summary . 53
Appendix 2 Ward Valley Lake Level Station Dry Deposition Data Summary .57
Appendix 3 Mid-lake Buoy (TB-1) Snow Tube Deposition Data Summary . . .61
Appendix 4 Mid-lake Buoy (TB-1) Dry-Bulk Deposition Data Summary . . . . 63
Appendix 5 Northwest Buoy (TB-4) Dry-Bulk Deposition Data Summary . . . 66

3
Acknowledgments
We are extremely grateful for the efforts of many individuals with the U.C. Davis Tahoe
Environmental Research Center who assisted with this work. In particular, Anne Liston, Tina
Hammel, and Veronica Edirveerasingam and their assistants continue to do excellent work in the
analytical labs. Thanks to Patty Arneson for assistance with data management. Thanks to
Andrea Parra Buxton for assistance with report maps. Dr. Geoff Schladow provided valuable
input. Thanks to George Malyj for administrative help. Finally we are very grateful for ongoing
support of this monitoring work provided by the State Water Resources Control Board, Lahontan
Regional Water Quality Control Board.

4
Project Overview
The following document is our Annual Report for work completed July 1, 2010 to June 30, 2011
for Agreement No. 10-031-160: Lake Tahoe Water Quality Investigations by the U.C. Davis –
Tahoe Environmental Research Center (TERC).
Under terms of this contract TERC is to provide the SWRCB with water quality research and
monitoring at Lake Tahoe to assess the progressive deterioration of the lake. This contract will
accomplish the necessary research, monitoring and data collection for addition to the Lake Tahoe
Interagency Monitoring Program (LTIMP), the State Water Board and other governmental
entities will be provided with the hard scientific data needed to develop planning, management
and enforcement strategies which will prevent future degradation of the lake‟s famous clarity and
protect the surrounding watershed and streams.
The objective of this project is to continue monitoring critical ongoing long-term water quality
parameters in Lake Tahoe. The primary research and monitoring tasks addressed in this project
include:
Algal growth bioassay tests to assess nutrient limitation (Task 3). The purpose of this task is to
determine the nutrient or nutrients which limit phytoplankton growth. These findings have been
very important in current efforts toward lake restoration. They have highlighted the need for an
expanded erosion control strategy. Bioassays are to be done four times per year using Lake
Tahoe water containing natural phytoplankton, collected at the TERC‟s Index station along the
west shore. The bioassay method to be used is described in detail in Hackley et al. (2007). It is
similar to that published in Goldman et al. (1993) with the exception that14C uptake is not
measured. In these bioassays, water is collected and composited from depths of 2,5,8,11,14,17
and 20m at TERC‟s Lake Tahoe Index Station following TERC standard protocol for sample
collection (Hunter et al., 1993). The water sample is returned to the laboratory where three
replicate samples are treated as follows: Control – no nutrient additions; N20 (add NH4NO3 to a
final concentration of approximately 20 µg/l N); P2 (add ortho-P to a final concentration of
approximately 2 µg/l P); P10 (10 µg/l P); N20P10 (20 µg/l N + 10 µg/l P). Flasks of lake water
and treatments are incubated under controlled laboratory conditions. Biomass accumulation over
the course of the experiment is measured by in vivo fluorescence.
Enumeration and identification of phytoplankton and collection of zooplankton samples for
archiving (Task 4). This task is particularly critical since changes in the biodiversity of the
phytoplankton are both indicators of pollution and affect food-chain structure. Implementation
of this task allows TERC to determine if new and undesirable species are colonizing the lake. In
addition, the size and composition of particles, including phytoplankton cells in the water, have a
significant effect on light transmittance, and hence affect the famed clarity of Lake Tahoe.
Characterization of phytoplankton dynamics in Lake Tahoe fills a critical knowledge gap,
allowing for more informed management decisions. Zooplankton are significant in the food
chain structure of the lake. The zooplankton community is composed of both herbivorous
species (which feed on phytoplankton) and predatory species (which feed on other zooplankton.)
Samples of both phytoplankton and zooplankton will be collected monthly from the Index and
Mid-lake stations. At the Index station monthly phytoplankton samples will include: a 0-105m

5
composite and discreet samples from depths of 5, 20, 40, 60, 75, 90m. At the Mid-lake station
monthly phytoplankton samples will include: a 0-100m composite sample and a 150-450m
composite. Phytoplankton samples are preserved with an iodine preservative (Lugol‟s reagent)
and counted to the species level when feasible following established TERC protocol (e.g. Hunter
et al., 1990; Hunter et al., 1993). Monthly samples of zooplankton will include: a 150m to
surface tow at both the Index and Mid-lake stations. Zooplankton samples are preserved with
formalin and archived.
Atmospheric deposition of nitrogen and phosphorus (Task 5). The purpose of this task is to
provide ongoing information on nutrient loading to the lake via atmospheric deposition. The
historical TERC data shows that atmospheric deposition of nitrogen, and to a lesser extent
phosphorus, is an important source of nutrients to the lake. Atmospheric deposition also
contributes fine particles directly to the lake surface. Atmospheric deposition data from TERC
monitoring was utilized in the Tahoe TMDL to help determine estimates of wet deposition loads
and to provide additional information on dry loading of nutrients to the lake. Data collected
from collectors located on buoys on the lake has proved valuable in providing estimates of N and
P loading directly to the lake. Continued collection of atmospheric deposition data is important
for updating and applying the Tahoe lake clarity model. Atmospheric deposition monitoring will
be continued at TERC‟s Lower Ward Valley station and on buoys on the lake. Approximately
35 dry bucket samples and 30 wet samples are to be collected over the year at Ward Lake level,
30 dry-bulk samples and approximately 15 snow tube samples are to be collected at the mid-lake
station, and approximately 30 dry-bulk samples are to be collected at an additional lake buoy
station i.e. TB-4. Samples are to be analyzed for NO3-N, NH4-N, TKN, DP and TP.
Monitoring of attached algae or periphyton along the shoreline (Task 6). The purpose of this
monitoring is to assess levels of nearshore attached algae (periphyton) growth around the lake.
Thick growths of periphyton coat the rocks in the spring in many areas around the lake and
bright green filamentous algae occur along portions of the shoreline in the summer. The rate of
periphyton growth is an indicator of local nutrient loading and long-term environmental changes.
Monitoring trends in periphyton growth is important in assessing local and lake-wide nutrient
loading trends. The near shore periphyton can significantly impact the aesthetic, beneficial use
of the shore zone in areas where thick growth develops. Nine sites are to be monitored for
periphyton biomass a minimum of five times per year. Three of the samplings are to be done
between January and June when attached algae growth in the eulittoral zone (0.5m) is greatest;
the remaining two samplings are to be done between July – December. Duplicate biomass
samples will be taken from natural substrate at each site for a total of 90 samples per year.
Biomass is to be reported as chlorophyll a and Ash Free Dry Weight (AFDW). Once a year, 39
additional sites will be visited and visual assessment of the level of growth visible near shore
(ranking 1-5) will be done.
The additional tasks associated with this project include: project management (Task 1), quality
assurance (Task 2), and reporting of data. The summary of % work completed based on a three-
year granting period is shown in Table 1.

6
Table 1. The summary of % work completed (based on a 3 year granting period) for the period
July 1, 2010 – June 30, 2011) for each task is listed below:
Task % Completion in Quarter
(for full 3 yr granting period)
1 – Project Management 33.333%
2 – Quality Assurance 33.333%
3 – Algal Growth Bioassays 33.333%
4 – Phytoplankton and Zooplankton Analysis 33.333%
5 – Atmospheric Deposition of Nutrients 33.333%
6 – Periphyton 33.333%
7 - Reporting 33.333%
Task 1. Project Management and Administration
1.1. Project oversight – Entailed sampling coordination, overall project coordination,
discussions with staff, assist in data evaluation, interfacing with agency staff, and
incorporation of data into other Basin research/monitoring projects.
1.2. Quarterly invoicing – Entails ensuring that contract requirements were met through
completion of this quarterly status report and the report was submitted to the SWRCB
Project Representative on schedule. Ensure that invoicing is properly carried out.
Task 2. Project Quality Assurance
Standardized QA/QC practices for components were followed as specified in the TRG QA/QC
Manual (Janik et al., 1990). For QA/QC applied to periphyton monitoring see “Periphyton
Quality Assurance Project Plan” in Hackley et al. (2004). QA/QC procedures for algal bioassays
are described in Appendix 7 of Hackley et al. (2007).
A primary objective for the atmospheric deposition quality control samples was to check for
potential contamination associated with field monitoring and equipment. Nutrient levels in field
blanks were compared with the source blank samples to check for levels of contamination. Table
2 presents the results for analyses of atmospheric deposition field quality control samples
collected July 2010 to September 2011. A total of 18 QA/QC samples were collected.
The QA/QC results indicated generally levels of N and P in source and field blanks were
generally low, however some elevated levels of N were found in the initial set of samples in July,
2010. The level of NO3-N in a source blank collected from the deionized water system on
7/15/10 was slightly elevated (NO3-N = 12 μg/l) while NO3-N in samples collected from all field
blanks which also utilized this water were below the MDL except in the WLL Wet field Blank.
In that sample slight contamination with NO3-N was found (NO3-N= 6 μg/l). Slight
contamination with NH4-N or TKN was also found in some of the field blanks for this date.
NH4-N and TKN were elevated in the WLL Dry field blank (NH4-N = 25.84 μg/l and TKN =
379.75) while NH4-N for the other field blank values were also slightly elevated ranging from 6-
9 μg/l. P was low in the source and field blanks (SRP ≤ 2 μg/l, DP ≤ 3 μg/l, TP ≤ μg/l).

7
The presence of several elevated N values for either source blanks or field blanks was an
indicator of potential contamination either in the sample bottles or collection containers for this
date. These quality control samples provided a check of the collection container cleaning done
by a new intern. They indicated more thorough cleaning of sample bottles or collectors was
needed to be done by the intern. Collectors were cleaned by this intern during the 8/3/10-9/2/10
period. Sample data for this period should be used with caution realizing some samples may
have had similar levels of contamination as in these July QA/QC samples.
On subsequent dates, nutrient levels in source and field blank samples were generally very low.
Levels of N and P were very low in the majority of deionized water “DIW Blk” source blanks
with many samples below the method detection level (MDL). TKN in one source blank
collected 11/15/10 was elevated (65.88 μg/l). N and P levels were also very low in the majority
of field blank samples with many below or close to the MDL.
Due to typically very low levels of P in atmospheric deposition samples, any sample
contamination introduced in the field sampling or bucket cleaning can impact estimates of P
loads for individual samples. Many of the container of field blanks were below the MDL but
when they did have levels of phosphorus above the MDL, they typically were only slightly
elevated (SRP typically elevated by 1-2 μg/l above the MDL and levels of DP, TP typically
within 1-3 μg/l of the MDL). It should be stressed these values were very near the lower limits
for the P analyses. The source blank water was also occasionally elevated above the MDL and
higher at times then container or field blanks using this water. Atmospheric deposition samples
using DIW as part of the collection system, i.e. for Dry and Dry-bulk samples, may slightly
overestimate P loading when P is present in this DIW water. Overall, the amounts of P
introduced to samples as a result of cleaning or field sampling appear to be low.

8
Table 2. Quality Control samples collected for the atmospheric deposition monitoring July 1,
2010 to September 30, 2011.
QC Vol. NO3-N NH4-N TKN SRP DP TP
Sample Date Type liters (µg/l) (µg/l) (µg/l) (µg/l) (µg/l) (µg/l) Notes
Source Blk 7/14/10 11:10 Source Blk - 11.77 5.37 MDL MDL MDL 5.62 1
FBWLLD 7/15/10 14:15 Field Blk 4.017 MDL 25.84 379.75 1.59 3.42 4.68 2
FBTB1D 7/15/10 13:50 Field Blk 4.015 MDL 9.0 NA 1.14 MDL 3.12 3
FBTB1ST 7/15/10 13:30 Field Blk 0.5 MDL 5.8 46.39 1.59 3.1 MDL 4
FBWLLW 7/16/10 10:30 Field Blk 0.5 5.8 7.5 MDL 1.59 MDL 4.66 5
Source Blk 11/15/10 15:15 Source Blk - MDL MDL 65.88 MDL 2.19 5.94 1
FBTB1D 11/16/10 15:00 Field Blk 4.0 MDL MDL NA MDL 3.39 4.38 3
FBWLLD 11/16/10 16:10 Field Blk 4.0 2.71 4.29 MDL MDL 4.07 3.75 2
FBWLLW 11/17/10 10:45 Field Blk 0.5 MDL 3.02 NA MDL MDL 3.13 6
Source Blk 11/30/10 15:15 Source Blk - MDL MDL MDL MDL 3.44 4.69 1
FBWLLW 11/30/10 15:25 Field Blk 0.5 MDL 4.47 MDL MDL 3.44 3.44 7
Source Blk 4/13/11 14:25 Source Blk MDL MDL MDL MDL MDL MDL 1
FBWLLD 4/14/11 15:45 Field Blk 4.0 2.89 3.49 NA 1.14 4.66 4.66 2
FBTB1D 4/14/11 16:00 Field Blk 4.0 MDL MDL MDL MDL 3.73 4.97 3
FBTB1ST 4/14/11 15:25 Field Blk 0.5 2.12 3.28 MDL MDL 3.1 4.04 4
Source Blk 8/18/11 16:15 Source Blk - MDL MDL MDL MDL 2.16 3.09 1
FBTB1D 8/19/11 18:15 Field Blk 4.0 MDL MDL MDL MDL 3.09 3.09 2
FBTB1ST 8/19/11 18:30 Field Blk 0.500 3.81 MDL MDL MDL 3.39 3.39 3
MDL 2 3 40 1 2 2 12
Notes 1- Deionized water system source blank.
2- Ward Lake Level Dry Field Blank, ~4 liters deionized water to sealed Dry bucket for approx. 24 hours.
3- TB-1 Dry-Bulk Field Blank, ~4 liters deionized water to sealed Dry-Bulk bucket for approx. 24 hours.
4- TB-1 Snow Tube (ST) Field Blank, 0.5 liters deionized water to sealed ST for approx. 24 hours.
5- Ward Lake Level Wet Field Blank, 0.5 liters deionized water to Wet bucket in Aerochem Metrics sampler,
overnight during dry period. Note, significant construction ongoing at station. Potential for impact on station
results.
6- Ward Lake Level Wet Field Blank, 0.5 liters deionized water to Wet bucket in Aerochem Metrics sampler, for
approximately 2 days during dry period.
7- Equipment cleaning blank, new intern cleaned bucket, then added 0.5 liters deionized water and processed.
8- MDL = Method Detection Limit
Task 3. Algal Growth Bioassays
We continued to monitor the growth response of algae to nutrient additions using lake
phytoplankton bioassays. In a typical bioassay, lake water is collected from the upper photic
zone (0-20 m water was used for these bioassays), pre-filtered through 80 µm mesh netting to
remove the larger zooplankton and returned to the lab. The water is distributed among
experimental flasks to which small amounts of N (20 µg N/L) or P (at two different levels: 2 µg
P/L and 10 µg P/L) or the combination of both N and P are added. One set of flasks is left as a
"control" in which no nutrients are added and all treatments are replicated in triplicate. The
flasks are then placed in a laboratory incubator under fluorescent lighting at ambient lake

9
temperature and day length, and growth response of phytoplankton is measured over a period of
six days. Relative growth was assessed by measuring changes in algal biomass (i.e. fluorescence
or chlorophyll a). Treatments are "stimulatory" if the mean growth response exceeds the control
at the p≤0.05 level of significance. (See Appendix 7 in the 2004-2007 Final Report (Hackley et
al., 2007) for a more detailed description of the bioassay method).
The response of Lake Tahoe water to nitrogen (N) and phosphorus (P) enrichment has been
tested using algal growth bioassays since the 1960‟s. The record of bioassays for Lake Tahoe
has proven extremely useful for evaluating long-term changes. When combined with lake
chemistry data and information on atmospheric and watershed nutrient loading ratios, these
simple enrichment bioassays allow us to better understand patterns of nutrient limitation in Lake
Tahoe.
Summary of Bioassay Results 2010-2011
In this summary we present the results for standard bioassay experiments done during the period
July 1 2010 to July 30, 2011. Five total bioassays were done on a schedule of approximately one
bioassay every three months. Table 3 (a-e) presents the results for each of the individual
bioassays; Table 4 presents the results for all bioassays done during the period 2002-2011 and
Figure 1 summarizes the 2002-2010 results for bioassays for complete years based on 3 periods:
Jan.-April, May-Sep. and Oct.-Dec.
In the bioassays done during July 2010 to July 2011, nitrogen was stimulatory more frequently
than phosphorus, while the combination of N and P added together increased phytoplankton
growth in all five bioassays. Nitrogen added alone was stimulatory in four of five bioassays,
which included bioassays done during both summers (8/17/10 and 7/11/11) as well as fall 2010
(11/9/10) and spring 2011 (5/20/11). Phosphorus added alone was stimulatory only in the winter
2011 (1/21/11) bioassay. Nitrogen limitation has been prevalent in the summer the last four years
and also frequently occurred in the fall. Phosphorus limitation continues to be prevalent in the
winter.
The data for all bioassays done during the period is included in Table 4. The results for complete
years 2002-2010 were grouped in Figure 1 based on time of year and typical lake stratification
patterns: January to April (no thermal stratification to early onset of stratification); May to
September (continued development of stratification to fully stratified); October to December
(breakdown of stratification). Patterns reported in the 2010 Summary Report (Hackley et al.,
2010) continued in 2011:
1) For 2002-2010 bioassays, during the period January – April, P limitation continues to be
prevalent and the combination of N+P was stimulatory over 90 percent of the time.
2) During May to September, N limitation was more frequent (41% of bioassays) than P
limitation (12% of bioassays) (N limitation during this period has occurred every year for
the last four years). The combination of N+P always increased growth during this period.
3) During October to December, P limitation occurred in 46% of the bioassays, N limitation
occurred in 31% of the bioassays and the combination of N+P always increased growth.

10
P limitation has not been observed in Oct. – Dec. bioassays since 2005. While N
limitation was observed in 4 out of the six years during 2005-2010.
Figure 1. Percentage of bioassays done during three periods: Jan.-April (unstratified – onset
of stratification period), May – Sept. (stratified period), and Oct. – Dec. (breakdown of
stratification) in which N, P or N+P significantly increased phytoplankton growth.
Decisions on control nutrient inputs to Lake Tahoe should not be made on the basis of these
growth bioassays alone. Increased nutrient loading affects the growth of attached algae
(periphyton) on hard surfaces in the nearshore. The observation that N+P additions almost
always stimulate growth is strong evidence that nutrient load should be controlled as called for as
part of the Lake Tahoe TMDL. While any future management action to specifically control N-
loading will use this bioassay response data, these actions will require additional supportive
information.
Summary Points for Bioassay Monitoring 2010-2011
1. There was a significant growth response to the combination of N+P in all bioassays
(5 of 5 bioassays). The observation that N+P additions almost always stimulate algal
growth is strong evidence that nutrient load should be controlled as called for as
part of the Lake Tahoe TMDL.
2. Nitrogen added alone was stimulatory in the bioassays done during both summers
in 2010 and 2011, as well as fall 2010 and spring 2011. Nitrogen limitation has been
prevalent in the summer the last four years and also frequent in the fall.
3. Phosphorus added alone was stimulatory in the winter 2011 (1/21/11) bioassay.
Phosphorus limitation continues to be prevalent in the winter.

11
Table 3a. Bioassay done using 2,5,8,11,14,17,20m lake water collected 8/17/10.
Treatment Day 5 Mean
Fluorescence
Std.
Dev.
n Day 5 Mean
Fluorescence as
% of Control
Statistically
Signif. (p≤.05)
Response =“*”
Control 0.216 0.008 3 100
N(20) 0.307 0.020 3 142 *
P(2) 0.231 0.012 3 107
P(10) 0.234 0.005 3 108
N(20)P(2) 0.381 0.005 3 176 *
N(20)P(10) 0.388 0.091 3 179 *
Note – used Day 5 fluorescence results
Table 3b. Bioassay done using 2,5,8,11,14,17,20m lake water collected 11/9/10.
Treatment Day 6 Mean
Fluorescence
Std.
Dev.
n Day 6 Mean
Fluorescence as
% of Control
Statistically
Signif. (p≤.05)
Response =“*”
Control 0.261 0.010 3 100
N(20) 0.338 0.006 3 130 *
P(2) 0.268 0.014 3 103
P(10) 0.268 0.010 3 103
N(20)P(2) 0.501 0.011 3 192 *
N(20)P(10) 0.646 0.008 3 248 *
Table 3c. Bioassay done using 2,5,8,11,14,17,20m lake water collected 1/21/11.
Treatment Day 6 Mean
Fluorescence
Std.
Dev.
n Day 6 Mean
Fluorescence as
% of Control
Statistically
Signif. (p≤.05)
Response =“*”
Control 0.502 0.004 3 100
N(20) 0.517 0.008 3 103
P(2) 0.564 0.008 3 112 *
P(10) 0.564 0.007 3 112 *
N(20)P(2) 0.870 0.009 3 173 *
N(20)P(10) 0.965 0.017 3 192 *

12
Table 3d. Bioassay done using 2,5,8,11,14,17,20m lake water collected 5/20/11.
Treatment Day 6 Mean
Fluorescence
Std.
Dev.
n Day 6 Mean
Fluorescence as
% of Control
Statistically
Signif. (p≤.05)
Response =“*”
Control 0.465 0.013 3 100
N(20) 0.557 0.028 3 120 *
P(2) 0.479 0.034 3 103
P(10) 0.455 0.015 3 98
N(20)P(2) 0.784 0.027 3 169 *
N(20)P(10) 0.959 0.040 3 206 *
Table 3e. Bioassay done using 2,5,8,11,14,17,20m lake water collected 7/11/11.
Treatment Day 6 Mean
Fluorescence
Std.
Dev.
n Day 6 Mean
Fluorescence as
% of Control
Statistically
Signif. (p≤.05)
Response =“*”
Control 0.290 0.003 3 100
N(20) 0.502 0.010 3 173 *
P(2) 0.292 0.003 3 101
P(10) 0.306 0.008 3 106
N(20)P(2) 0.841 0.009 3 290 *
N(20)P(10) 1.053 0.025 3 364 *
Note – used Day 5 fluorescence results
Table 4. Summary of N and P bioassay treatment responses as % of control done in: (a) 2002,
(b) 2003, (c) 2004, (d) 2005, (e) 2006, (f) 2007, (g) 2008, (h) 2009, (i) 2010, (j) 2011.
Treatment responses statistically significantly different from the control at the p≤.05 level are
indicated with borders and shading.
(a) 2002 Bioassays
2/7/02 4/1/02 6/12/02 8/30/02 10/28/02 12/30/02
Control 100 100 100 100 100 100
N20 104 97 101 101 93 101
P2 154 - - 108 - 116
P10 135 157 104 100 113 110
N20P2 139 - - 157 151 118
N20P10 138 178 180 231 238 116

13
Table 4 cont‟d
(b) 2003 Bioassays 1/30/03 2/26/03 4/8/03 5/21/03 6/16/03 7/10/03 8/29/03 10/20/03 12/3/03
Control 100 100 100 100 100 100 100 100 100
N20 101 98 102 138 116 141 129 101 107
P2 112 129 168 101 99 100 100 100 98
P10 114 134 181 98 104 106 105 106 104
N20P2 141 136 178 253 248 221 196 187 124
N20P10 159 147 190 264 297 317 280 334 142
(c) 2004 Bioassays
1/5/04 4/23/04 8/20/04 10/28/04 12/11/04
Control 100 100 100 100 100
N20 100 97 112 104 99
P2 133 112 101 103 134
P10 135 122 112 114 150
N20P2 132 153 210 127 161
N20P10 134 202 248 185 173
(d) 2005 Bioassays
2/16/05 4/15/05 6/10/05 8/15/05 10/20/05 12/15/05
Control 100 100 100 100 100 100
N20 99 97 109 105 109 113
P2 121 193 99 109 110 102
P10 122 233 105 105 121 108
N20P2 123 214 176 177 143 162
N20P10 127 241 239 258 193 190
(e) 2006 Bioassays
2/21/06 4/12/06 6/19/06 8/9/06 10/31/06
Control 100 100 100 100 100
N20 98 98 84 117 98
P2 181 155 85 113 100
P10 214 162 91 141 113
N20P2 195 155 153 120 135
N20P10 200 161 253 173 273
(f) 2007 Bioassays
1/9/07 3/2/07 4/13/07 6/12/07 9/27/07 11/9/07
Control 100 100 100 100 100 100
N20 99 100 97 100 143 114
P2 142 112 131 113 91 104
P10 143 112 136 93 89 108
N20P2 143 120 138 145 202 150
N20P10 146 118 136 176 284 180
14
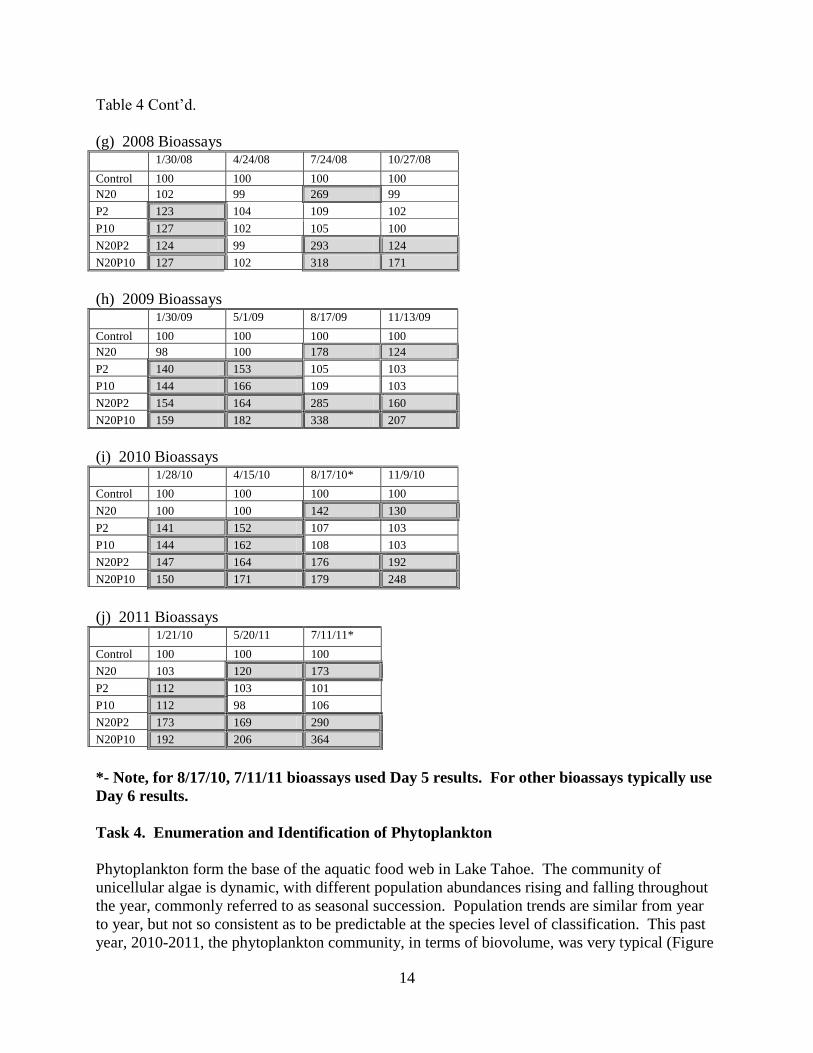
Table 4 Cont‟d.
(g) 2008 Bioassays
1/30/08 4/24/08 7/24/08 10/27/08
Control 100 100 100 100
N20 102 99 269 99
P2 123 104 109 102
P10 127 102 105 100
N20P2 124 99 293 124
N20P10 127 102 318 171
(h) 2009 Bioassays
1/30/09 5/1/09 8/17/09 11/13/09
Control 100 100 100 100
N20 98 100 178 124
P2 140 153 105 103
P10 144 166 109 103
N20P2 154 164 285 160
N20P10 159 182 338 207
(i) 2010 Bioassays
1/28/10 4/15/10 8/17/10* 11/9/10
Control 100 100 100 100
N20 100 100 142 130
P2 141 152 107 103
P10 144 162 108 103
N20P2 147 164 176 192
N20P10 150 171 179 248
(j) 2011 Bioassays
1/21/10 5/20/11 7/11/11*
Control 100 100 100
N20 103 120 173
P2 112 103 101
P10 112 98 106
N20P2 173 169 290
N20P10 192 206 364
*- Note, for 8/17/10, 7/11/11 bioassays used Day 5 results. For other bioassays typically use
Day 6 results.
Task 4. Enumeration and Identification of Phytoplankton
Phytoplankton form the base of the aquatic food web in Lake Tahoe. The community of
unicellular algae is dynamic, with different population abundances rising and falling throughout
the year, commonly referred to as seasonal succession. Population trends are similar from year
to year, but not so consistent as to be predictable at the species level of classification. This past
year, 2010-2011, the phytoplankton community, in terms of biovolume, was very typical (Figure

15
2). The lowest community biovolume was seen during the late fall and early winter. The highest
biovolume was during the summer months, typically June and July. The population abundance
also followed similar patterns (Figure 3). Community composition changed throughout the year
with diatoms being the dominant algal group in biovolume and abundance during the season of
highest phytoplankton growth. In contrast, during the times of lowest abundance and
biovolume, the community was often the most diverse.
This routine of annual phytoplankton ecology is deceptive. Without a doubt, the past year was
one of the most remarkable years in the recent history of Lake Tahoe. The abundance of diatoms
during the summer season (Figure 3) was the highest ever recorded, with over one million cells
per liter. Winder et. al. (2009), attributed this recurring summer bloom to climate changes.
Indeed, since that paper was written, the trend continues with ever increasing magnitude. The
cells are small centric diatoms called Cyclotella spp. They have the ability to grow in a wide
range of depths but the most abundant populations are located in the upper euphotic, less than
20m. The algal community is dominated by these cells, requiring a shift in the patterns of
interaction between taxonomic groups. For example, one taxonomic group, dinoflagellates used
to be common in Lake Tahoe during the autumn. In recent years, this group has been appearing
with regularity during the late spring. These cells, generally larger than the centric diatoms,
occur with relatively smaller abundances. They are flagellated cells with chloroplasts and since
they have the cellular „equipment‟ to photosynthesize, they are considered plants. However, they
also have been reported to use other „strategies‟ for obtaining nutrition, such as phagocytosis.
This past year in Lake Tahoe, microscopic observation has captured these cells in the process of
consuming centric diatoms by ingestion. The fact that dinoflagellate populations have „changed‟
season is mostly likely a response to this available food source. Further impacts of the diatom
bloom can be seen in the phytoplankton growth rates, as measured by C14 uptake. The
Cyclotella spp. are small (4 – 6 µm), metabolically active cells. Logarithmic increases of
primary production in Lake Tahoe over time can, in large part, be attributed to these cells.
In a broader context, Cyclotella spp. are an important food source for protozoans and
zooplankton, their small size being a factor that enhances herbivory. Cyclotella spp. are
tremendously important for all biological processes within the food web. Physically, the
additional particulate loading in the water column has a deleterious effect on water visibility.
The presence of over one million cells per liter is only a count of the „living‟ cells. The empty
diatom frustules (deceased cells) which co-exist in the water column during the bloom are often
2 or 3 times greater than the living individuals. Taken together, the number of small particles
attributed to this one event, the Cyclotella spp. bloom, has a significant impact on light
absorption and transmission.
While the summer months have important long-term impacts in the phytoplankton, the
other seasons are also important. During the fall of 2010, diatoms were still major community
members, but the importance of Cyclotella spp. diminished after early autumn. Once the lake
begins to mix, generally in November, the biovolume dominance shifts to other algal groups.
Chlorophytes typically do well in Tahoe‟s waters from August through the winter season.
During 2010, this same trend was observed. Ankistrodesmus spiralis was the dominant green
alga but other species were strong performers (Cosmarium phaseolus, Tetraedron minimum, and
Planktonema lauterbornii). Over the last 12 years, community populations of the green algae has
been very interesting. The chlorophyte biovolume and abundance steadily increased over time
(Table 5). Additionally, the species richness of chlorophytes since 2003 has been firmly in the
16
double digits. These trends might have some long term implications for the productivity of
Tahoe.
The phytoplankton community in January 2011 was remarkably robust. Cell abundance
and total bio-volume were high compared with historical records. The euphotic water column
was well mixed and all five depth samples had total bio-volumes ranging from 188-197 mm3/m
3.
For comparison, in January 2010, total biovolumes from five individual depth samples ranged
from 63-87 mm3/m
3. The phytoplankton bio-volume doubled in 2011. This increase can be
attributed to the diatom population. Diatoms represent 50% of the total bio-volume of the
samples. Based on historical records, January is not typically dominated by diatoms. However,
in 2011, the centric diatom, Stephanodiscus alpinus was the dominant diatom at all sampled
depths. Smaller centrics and a couple of pennate species also contributed to the grand total.
The prolonged winter and unsettled spring impacted phytoplankton community
dynamics. The growth response within the diatoms seemed to be regional and spotty, with the
mid-lake station having almost twice the abundance as the near-shore index station by mid April.
Typically, April diatoms dominate the assemblage. This year was not different, but the
populations did not hold sustained populations, instead fluctuated. The centric, Stephanodiscus
alpinus and the pennate, Synedra acus var. radians were the dominant biovolume contributors.
The most abundant diatom was the small Cyclotella gordonensis, with 16,000 – 20,000 cells per
liter. As the spring progressed, diatoms continued to gain strength. By mid-May diatoms
comprised over 40% of the phytoplankton biovolume. The dominants Stephanodiscua alpinus
and Synedra acus var. radians were still community leaders but populations began to transition
to the summer assemblage. The growing abundance (~25000 cells per liter) of the small
Cyclotella spp. overwhelmed all other species.
By June the long-awaited seasonal succession of diatoms was in full swing. Twelve
diatom species comprised 60% of the phytoplankton biovolume and completely overtook the
community in abundance. Cyclotella gordonensis and Cyclotella glomerata (both similar in size
~5µm) had over 300,000 cells per liter in early June, growing to over 700,000 cells per liter by
late June. The phytoplankton biovolume and abundance was not as strong as the summer of
2010.
Phytoplankton are in many ways controlled by ambient physical conditions. Seasonal
fluctuations and variability due to weather patterns impact the overall performance of the
phytoplankton. Nevertheless, despite inter-annual differences, it is still very interesting that
changes in the phytoplankton community over time can be discerned without statistical analysis.
The changes are sometimes dramatic, as in the Cyclotella spp. populations. The changes are also
subtle, with seasonal maneuvering within the community composition. It all works together to
tell a story and if climate change is a major driving force for this change, the story will continue
to unfold as time goes on.

17
Figure 2: Biovolume bbbbbbbbbbBBBiovolume
Figure 3: Abundance fAbundance

18
Table 5: Autumn Season Chlorophytes
Task 4 b. Archiving of Zooplankton samples.
During the period July 1, 2010 to June 30, 2011 18 zooplankton samples were collected
and archived for possible later enumeration. These samples included nine 150-0m tows
at the Index station and nine 150-0m tows at the Mid-lake station.
Task 5. Atmospheric Deposition of Nitrogen and Phosphorus
Monitoring of atmospheric deposition is crucial to an understanding of its role in
degradation of the lake and for use in watershed management. Atmospheric deposition
contributes nitrogen, phosphorus and fine particles which all impact lake clarity.
Atmospheric deposition contributes about 55% of the total nitrogen, 15% of the total
phosphorus and 15% of the total fine (<20µm) particles to the lake. A significant portion
of the nitrogen, phosphorus and fine particles in the atmospheric deposition is thought to
originate in the basin. Control of air pollutants generated within the basin is therefore
potentially a tool for watershed managers to reduce pollutants which impact the clarity of
the lake. The atmospheric deposition monitoring program of TERC provides basic
information on nutrient loading from this source (atmospheric deposition both in the
watershed on land and directly to the lake surface), as well as on precipitation timing and
amounts. The data also provides information on past and current trends in atmospheric
deposition.
n = # of sampling
events
1999 n=5
2000 n=4
2001 n=11
2002 n=9
2003 n=12
2004 n=11
2005 n=10
2006 n=5
2007 n=5
2008 n=4
2009 n=7
2010 n=7
PHYTOPLANKTON BIOVOLUME (mm
3/m
3)
35
51
51
43
37
49
54
59
54
53
68
95
CHLOROPHYTE BIOVOLUME (mm
3/m
3)
3
3
3
2
6
12
18
3
4
14
7
16
CHLOROPHYTE BIOVOLUME AS
PERCENT OF TOTAL
9%
6%
6%
5%
16%
24%
32%
5%
7%
26%
12%
17%
CHLOROPHYTE ABUNDANCE AS
PERCENT OF TOTAL
12%
5%
5%
6%
27%
32%
41%
13%
13%
36%
20%
36%
PHYTOPLANKTON TOTAL SPECIES
RICHNESS
31
28
33
33
32
35
32
36
36
42
42
37
CHLOROPHYTE SPECIES RICHNESS
10
8
9
9
12
12
9
10
12
16
15
12

19
The current contract provides for atmospheric monitoring at 3 primary stations: the lower
Ward Lake Level station and two stations located on the lake: the Mid-lake buoy station
(TB-1) and buoy station TB-4.
Stations and Methods
Lower Ward Valley Lake Level Station
This station is located slightly south of the Ward Creek mouth on an estate,
approximately 75-100 m back from the lake edge. This station has an Aerochem Metrics
model 301 wet/dry deposition sampler. This sampler contains two deposition collection
buckets and moveable lid, which automatically covers one, or the other bucket depending
on whether precipitation is detected by a sensor. A 3 ½ gallon standard HDPE plastic
bucket is used in the Wet-side of the sampler. This “Wet bucket” is covered by the lid
during dry periods and exposed when wet precipitation is detected during a storm event.
The Dry-side contains a modified HDPE bucket with reduced side-wall height, filled with
4 liters of deionized water, (and contains a heater in winter). This “Dry-bucket” is
exposed during dry periods and covered by the lid when precipitation is detected. Wet
samples are collected from this station also on an event basis, or as wet buckets fill with
snow. Dry samples are collected about every 7-10 days and collection is usually
coordinated with lake buoy Dry-Bulk sample collection.
Mid-lake Buoy Station
This station is located in the northern middle portion of the lake. During the
current study the station was located on a large buoy (TB-1) in the north central portion
of the lake (coordinates 39 09.180 N and 120 00.020 W). The collector consists of a
HDPE plastic bucket similar to the Aerochem Metrics modified dry collector. It is filled
with 4 liters of deionized water when placed out. However, the bucket also contains
plastic baffles to dampen splash from the bucket. Unlike the Dry bucket, this collector
collects both wet and dry deposition and therefore is called a Dry-Bulk collector. The
station also contains a Snow Tube for collection of wet precipitation. Sample collection
from this station is done as much as possible on a regular basis (7-10 days if possible),
however, lake conditions and weather govern frequency to a large extent. The buoy also
has a variety of scientific instrumentation for NASA‟s studies on the lake in addition to
the atmospheric deposition collectors.
Northwest Lake (TB-4) Station
Station TB-4 (coordinates 39 09.300 N and 120 04.330 W) was located between
the mid-lake (TB-1) station and Tahoe City. This was desirable since it provided a second
collection site to compare with Mid-lake data. The station contained a Dry-Bulk sampler
similar to that used on the Mid-lake station. Samples were collected on the same
frequency as the Mid-lake samples. The station was supported on a large buoy (TB-4).
The buoy has a variety of scientific instrumentation for NASA‟s studies on the lake in
addition to the atmospheric deposition collectors. (Note for more detailed methods at the
different stations see the TERC‟s Standard Operating Procedures for precipitation
monitoring).

20
Results
Data collected for this task include information on atmospheric deposition
concentrations, precipitation amounts and timing. The nutrient concentration data was
used to calculate atmospheric deposition loads and loading rates for Water Years 2010
and 2011. Data from the end of May 2010 (the approximate ending date of data
presented in the 2010 Summary Report (Hackley et al., 2010) through the end of
September 2011 is presented in this report. The data, sampling period loads and loading
rates for Lower Ward Wet, Dry, Buoy TB1 Dry-bulk and Snow Tube and Buoy TB4
Dry-bulk is presented in Appendices 1-5. WY totals are presented in this section.
During July 1, 2010 through September, 2011, 145 samples were collected from the 3
primary stations (30 dry bucket and 50 wet bucket samples from the Ward Lake Level
station, 26 dry-bulk samples from each of the lake buoy stations and 13 Mid-lake snow
tube samples). Samples were analyzed for ammonium (NH4-N), nitrate (NO3-N), total
Kjeldahl nitrogen (TKN), soluble reactive phosphorus (SRP), total dissolved phosphorus
(DP) and total phosphorus (TP).
General Patterns for Precipitation July 1, 2010- September, 2011
The period of study included the end of Water Year 2010 and all of WY 2011. Figure 4
below shows the distribution of precipitation amounts for samples collected at the Lower
Ward Valley station during the June 2010- Sept.
Small amounts of precipitation occurred at in the summer 2010 and overall precipitation
for WY 2010 was moderate. The summer of 2010 was generally dry, with a few periods
in which isolated thunderstorms occurred. A locally heavy thunderstorm occurred in
Ward Valley on 8/7/10 which dropped 0.91 inches of precipitation as rain and hail. At
the end of August (Aug. 28-29) a small amount of rain also occurred from a cold low
pressure system. September was mostly dry. Total WY 2010 precipitation was 38.64
inches which is mid-range among values since 1981.
WY 2011 had significant precipitation (66.92 inches total) which occurred predominantly
during two periods: Oct. to Dec. 2010 and mid-February to June 2011. The first three
months of WY 2011 (Oct.-Dec.) were extremely “wet” with significant events occurring
during each month. Rain events began in early October and a very significant rain event
occurred late in October. A total of 7.21 inches of rain occurred at the lower Ward Station
10/23-10/25/10 (much of the precipitation fell on 10/24/10) associated with a low
pressure system containing significant tropical moisture. Small amounts of rain occurred
again at the end of Oct. with some rain and snow in early November. Then, the first
major snow storm of the WY occurred 11/18-11/23/10 associated with a strong arctic low
pressure system. This very cold, windy system dropped 3-4 feet of snow at the Lower
Ward station. Very cold air remained in the Basin for a period after this storm, with
another foot of snow falling on 11/27/10. Warmer temperatures were observed during
the first part of December. Periods of rain, snow, mixed precipitation and drizzle
occurred at Lake Level during 12/5-12/8/10. Then a moderate storm with 3.39 inches of
precipitation as rain and snow at the Lower Ward station and snow at higher elevations

21
occurred 12/13-12/14/10. A major storm occurred in the basin from 12/17-12/20/10
contributing over 8 inches of precipitation as rain/snow mix at the Lower Ward Valley
station. This storm was associated with a stationary low pressure system which merged
cold air, with tropical moisture from near Hawaii. The elevation at which rain changed to
snow was low enough however, to prevent significant rises on the west shore streams. A
small amount of additional snow and rain occurred during 12/23-12/27/10. One more
significant storm was observed at the end of December leaving approximately 3 more
feet of dense wet snow at the Lower Ward Valley station. The series of wet storms in
December contributed to a snowpack that was over 200% of average for early January
(Sierra Sun, Jan. 10, 2011).
Figure 4. Precipitation amounts occurring at the Lower Ward Valley station. Each
vertical bar represents total amount of precipitation during a collection period for a
sample – in some cases samples include multiple events, (date under bars are collection
dates).
A distinct lull in the wet pattern occurred during January to mid-February 2011. Very
little precipitation (0.84 inches) occurred during this period. During the second half of
Jan. and the first half of Feb. there were periods of relatively mild day-time temperatures.
A “wet” pattern re-developed in mid-February, with frequent storms and significant
precipitation. Approximately 6 feet of new snow accumulated at the Lower Ward station
Feb. 16-19, with another 2 feet Feb. 24 and 25 associated with a windy storm. Significant
precipitation occurred in March including: nearly 4 inches of rain and snow early in the
month, 5.69 inches of precipitation as rain, wet snow, then snow in the middle of March,
then frequent snow during most of the second half of March with at least 7-8 feet of
additional snow. By the end of March, a very significant snowpack had accumulated.
After a brief break in the storms in early April, snow or mixed precipitation storms
(several very windy) occurred frequently in the last two weeks of April. In May, periods
of milder weather were interspersed with cool, wet weather. Several snow or rain and

22
snow events occurred in the second half of May, with primarily snow falling at the end of
May. After rain and snow in the first week of June, a drier, warmer, weather pattern
finally developed, which lasted most of the month. One additional rain event occurred at
the end of June. The remaining summer portion of 2011 was generally dry and warm with
a few periods of isolated thunderstorms. Thunderstorms with some rain were noted along
the west shore on July 6, September 10, 11, 12. Particularly heavy thunderstorm-
associated rain was observed in the Tahoe Vista and Kings Beach area on 9/11/11.
Overall WY 2011 precipitation (66.92 inches) was the second highest in the last 30 years.
WY 1995 was the highest with 73.29 inches. Other WY with nearly similar amounts as
WY 2011 included: WY 2006 (65.99 inches), WY 1983 (65.46 inches), WY 1997 (63.54
inches), and WY 1986 (63.26 inches).
There were some significant hydrological impacts associated with the heavy precipitation
in 2010-2011. Significant rises occurred on the west shore streams during the Oct. 24,
2010 fall rain event with likely enhanced sediment and nutrient loading. The increased
flows on Blackwood Cr. during this event resulted in particularly noticeable erosion of
the stream banks in the vicinity of the USGS gage. The winter and spring of 2011 was
very wet and cool. As a result, a significant snowpack developed and the major portion
of the spring snowmelt was delayed until the second half of June into early July. The rise
in lake level elevation was very significant during WY2011 as a consequence of the
significant precipitation and runoff. The lake level rose nearly five feet, from a minimum
on Oct. 1, 2010 (6223.46 ft.) to a maximum of 6228.42 ft. on July 31, 2011. The bulk of
the rise in lake surface elevation (nearly 4 feet) occurred between mid-Feb. through the
end of July, 2011.
Annual Loading of Nitrogen and Phosphorus in Atmospheric Deposition
The atmospheric deposition monitoring in the Ward Creek watershed and on the lake at
the buoy sampling locations provides data from which N and P deposition loading
estimates are calculated. Appendices 1b-5b show the estimated loads (grams/hectare) of
N and P associated with samples collected. Table 6 below presents estimated overall WY
2010 and WY2011 N and P loading expressed as a rate (grams/hectare/day) at the Lower
Ward Valley, Mid-lake buoy TB-1 and buoy TB4 stations. Values for WY 2006-2009
are shown for comparison. To determine a daily loading rate for Wet or Wet/Bulk
precipitation samples, the annual total load for a nutrient was first extrapolated by
dividing the total load for samples analyzed by the proportion of total precipitation
analyzed. This annual load was then divided by number of days/year to estimate daily
loading rate. To determine dry deposition loading rate, the load for analyzed dry samples
was divided by the total number of sampling days for the analyzed samples.

23
Table 6. Comparisons of loading rates (grams/ hectare/ day) of N and P at the Upper and
Lower Ward Valley and buoy stations TB-1 and TB-4 during Water Years 2006 through
2011. Note this data was updated from previous reports to include all available chemistry
data. Precip. NO3-N NH4-N TKN SRP DP TP
(in) g/ha/d g/ha/d g/ha/d g/ha/d g/ha/d g/ha/d
Lower Ward (Wet) WY‟06 65.99 1.59 1.56 2.83 0.06 0.24 0.42
Lower Ward (Wet) WY‟07 27.92 0.71 0.79 2.16 0.08 0.12 0.20
Lower Ward (Wet) WY‟08 24.98 0.75 0.73 1.93 0.05 0.13 0.25
Lower Ward (Wet) WY‟09 37.34 1.11* 1.06* 2.90* 0.10* 0.14* 0.23*
Lower Ward (Wet) WY‟10 38.64 1.26 1.65 3.76 0.05 0.11 0.46
Lower Ward (Wet) WY‟11 66.92 1.91 2.34 4.39 0.10 0.23 0.34
Lower Ward (Dry) WY‟06 0.89 1.00 11.94 0.17 0.51 1.31
Lower Ward (Dry) WY‟07 0.74 1.01 12.55 0.26 0.44 1.03
Lower Ward (Dry) WY‟08 0.98 1.01 12.23 0.66 0.88 2.10
Lower Ward (Dry) WY‟09 1.13* 1.26* 11.73* 0.24* 0.39* 0.92*
Lower Ward (Dry) WY‟10 1.03** 1.17** 14.50** 0.21** 0.32** 0.92**
Lower Ward (Dry) WY‟11 1.14** 1.06** 12.78** 0.15** 0.25** 0.82**
Lower Ward (Wet+Dry) WY‟06 2.48 2.57 14.78 0.23 0.75 1.73
Lower Ward (Wet+Dry) WY‟07 1.45 1.80 14.71 0.34 0.56 1.23
Lower Ward (Wet+Dry) WY‟08 1.73 1.74 14.16 0.71 1.01 2.35
Lower Ward (Wet+Dry) WY‟09 2.24 2.32 14.63 0.34 0.53 1.15
Lower Ward (Wet+Dry) WY‟10 2.29** 2.82** 18.26** 0.26** 0.43** 1.38**
Lower Ward (Wet+Dry) WY‟11 3.05** 3.40** 17.17** 0.25** 0.48** 1.16**
TB-4 (Dry-Bulk) WY‟06 1.81 2.10 3.51 0.05 0.14 0.24
TB-4 (Dry-Bulk) WY‟07 2.18 1.61 3.93 0.04 0.09 0.24
TB-4 (Dry-Bulk) WY‟08 1.66 2.43 4.29 0.12 0.19 0.35
TB-4 (Dry-Bulk) WY‟09 1.92 2.48 4.49 0.04 0.06 0.14
TB-4 (Dry-Bulk) WY‟10 2.26 2.08 6.10 0.06 0.11 0.19
TB-4 (Dry-Bulk) WY‟11 1.88 1.83 3.28 0.04 0.09 0.19
Mid-lake TB-1 (Dry-Bulk) WY‟06 2.05 1.88 4.06 0.09 0.21 0.45
Mid-lake TB-1 (Dry-Bulk) WY‟07 2.19 1.63 3.14 0.06 0.13 0.27
Mid-lake TB-1 (Dry-Bulk) WY‟08 1.78 1.87 3.93 0.12 0.19 0.35
Mid-lake TB-1 (Dry-Bulk) WY‟09 1.90 2.03 3.61 0.05 0.07 0.16
Mid-lake TB-1 (Dry-Bulk) WY‟10 2.52 2.67 6.11 0.07 0.11 0.25
Mid-lake TB-1 (Dry-Bulk) WY‟11 2.01 1.68 3.09 0.06 0.11 0.23
Notes: “*” – The Wet/Dry sampler malfunctioned in Dec. 2008, resulting in the Dry
bucket collecting a portion of the precipitation for several storms, the Wet bucket loading
values shown do not account for Wet precipitation in the Dry bucket, the Dry bucket
values include some Wet precipitation “**” – during some periods in WY 2010, 2011
there were power interruptions and problems with dust due to construction on property at
the Lower Ward Valley station, samples noted to be contaminated with significant
amounts of silt or organic material were not used. In early October 2010 the power line
to the station was removed during construction activities. The Wet and Dry buckets were
continually exposed to deposition for 2-3 weeks. Both Wet and Dry deposition collected
in the Wet buckets during storm events was included in the Wet total loading.

24
Annual N and P Loads in Wet Precipitation in Lower Ward Valley
WY 2011 had the highest Wet precipitation loading rates1of NO3-N (1.91 g/ha/d), NH4-N
(2.34 g/ha/d) and TKN (4.39 g/ha/d) of the last six years. WY 2006 which was the
closest to WY2011 in terms of precipitation amount (65.9 inches) had less N loading, i.e.
NO3-N (1.59 g/ha/d), NH4-N (1.56 g/ha/d).TKN (2.83 g/ha/d). TKN was higher both in
WY 2010 and 2011 than the previous 4 years.
Loading rates for phosphorus in Wet precipitation were within the range of values
observed for SRP and DP the last six years. TP loading rates in wet precipitation were
highest in WY2010 (0.46 g/ha/d) and less in WY 2011 (0.34 g/ha/d).
The elevated TKN in 2010 and 2011 values may reflect to some extent disturbance
around the station in these years. In both years, there was construction activity near the
station which included grading and tree removal. Silt and organic matter from these
activities may have been resuspended and fallen in the Wet bucket during winds
associated with storms. (During some dry periods, material resuspended during
construction or by winds was captured in the Dry bucket - samples with unusually heavy
levels of silt or organic matter which was suspected to be associated with construction,
were not used in loading estimates). Contribution of resuspended material from
construction activities would have been most likely during periods when snow cover was
absent. It is interesting to note, there also had been forest thinning in the Ward Valley
watershed during summer 2010. It‟s also possible some of the small organic debris left
after such thinning contributed to the Wet and Dry deposition at the Lower Ward site.
Though the local contribution due to construction seems most probable, some
contribution also from forest thinning cannot be ruled out.
Two other consequences associated with changes on the property around the station
during 2010 and 2011 should be noted. First, in early October 2010 the power line to the
station was cut off. During a period of 2-3 weeks, the Aerochem Metrics Wet/Dry
collector lid was removed, allowing both the Wet and Dry bucket to capture any
deposition (Wet or Dry) for this period. Wet and Dry deposition collected in the Wet
buckets during storm events was included in the Wet total loading during this period. A
second more general affect during 2010-2011, that should be noted, the construction of
new buildings near the station and removal of some trees may have some impact on long-
term deposition loading patterns (in addition to any short-term impacts occurring during
construction). Current and future data from this site should take into consideration site
changes which occurred in 2010 and 2011.
Figures 5 and 6 present the WY 1981- 2011 data for Dissolved Inorganic Nitrogen (DIN)
and Soluble Reactive Phosphorus respectively in Wet deposition at the Lower Ward
station. A couple of patterns are apparent for the most recent Wet deposition data. DIN
load showed a steady increase WY 2009 to WY2011. The most significant increase was
1 Total Wet loads for the year were divided by #days to obtain a daily rate for comparison
with daily rates determined for Dry and Dry-Bulk loading.

25
in WY 2011 coinciding with the large increase in precipitation this year. The high DIN
load in WY 2011 (1534.43 g/ha) was the highest total since WY 1999. The SRP load in
WY 2011 (35.97 g/ha) was approximately twice that that occurred in WY 2010 (17.52
g/ha). Much of the increase in SRP loading in WY 2011 may be attributed to overall
increased precipitation.
Figure 5. Summary plot of Water Year (WY) total precipitation (inches), average
Dissolved Inorganic Nitrogen (DIN) concentration (ppb), and extrapolated annual DIN
load (g/ha/yr) in Wet Deposition at the Ward Valley Lake Level station for WY 1981-
2011. A Water Year begins Oct. 1 and ends Sept. 30 (i.e. WY 1981 ended 9/30/81).
Figure 6. Summary plot of Water Year (WY) total precipitation (inches), average
Soluble Reactive Phosphorus (SRP) concentration (ppb), and extrapolated annual SRP
load (g/ha/yr) in Wet Deposition at the Ward Valley Lake Level station WY 1981-2011.

26
Annual N and P Loads in Dry Deposition in Lower Ward Valley
Construction activities near the station in 2010 and 2011 caused apparent contamination
of several Dry deposition samples in both years. Samples with heavy silt or organic
matter were censored and not used in the loading calculations. Since the Dry buckets are
continually exposed during dry periods, they are susceptible to contamination by dust and
organic matter during construction activities and through resuspension of settled particles
by wind. The field notes and lab results were used to determine which samples had high
amounts of silt or organic matter in them during the active construction season and these
were censored. Dry deposition loading rate data for the Lower Ward station are shown in
Table 6.
The loading rates for WY 2010 and 2011 were relatively similar to WY2009 rates when
samples with obvious silt or organic contamination were excluded. Loading rates by
nutrient (g/ha/d) during WY 2009, 2010, 2011 respectively were: NO3-N (1.13, 1.03,
1.14); NH4-N (1.26, 1.17, 1.06), TKN (11.73, 14.40, 12.78), SRP (0.24, 0.21, 0.15), DP
(0.39, 0.32, 0.25) and TP (0.92, 0.92, 0.82). In comparison, rates for NO3-N and NH4-N
loading were slightly less during WY 2006-2008 (range 0.74-0.98 g/ha/d for NO3-N and
range 1.00-1.01 g/ha/d for NH4-N). TKN was slightly higher in WY 2010 than WY
2006-2009, 2011 (range 11.73-12.78 g/ha/d). Loading rates for SRP, DP and TP for WY
2006 -2007, 2009-2011 were fairly close, however WY 2008 values were much higher
(WY 2008 SRP= 0.66g/ha/d, DP=0.88 g/ha/d, TP=2.35g/ha/d) as a result of an wildfire-
associated ash deposition event resulted in noticeably higher loading rates at the Lower
Ward station (see Hackley et al., 2010).
Annual N and P Loads in Dry-bulk Deposition at Buoys TB1, TB4
The loading rates at buoy stations TB-1 and TB-4 in WY 2010 and 2011, for most N and
P constituents remained close to levels observed the previous 4 years (Table 6). WY
2010-2011 ranges at TB-1 and TB-4 for N and P in grams/hectare/day were: NO3-N
(1.88-2.52), NH4-N (1.68-2.67), TKN (3.09-6.11), SRP (0.04-0.07), DP (0.09-0.11), TP
(0.19-0.25). 2006-2009 ranges for N and P were: NO3-N (1.66-2.19), NH4-N (1.61-2.48),
TKN (3.14-4.49), SRP ( 0.04-0.12), DP (0.06-0.21), TP ( 0.14-0.45). Data from a few
extremely long collection periods (6/3-7/2/10, 1/4/11-2/11/11, 4/22/11-6/7/11) was not
used in the loading estimates. TKN loading was significantly higher in WY 2010 (6.10
and 6.11 g/ha/d at buoys TB-4 and TB-1 respectively) compared to levels WY2006-2009
and WY 2011).
Summary Points for Atmospheric Deposition Monitoring WY2010, 2011
1. Precipitation amounts were mid-range among values since 1981 in WY 2010
(38.64 in.) and second highest (66.92 in.) in WY 2011 at the TERC Lower
Ward Valley station.
2. There were some significant hydrological impacts associated with the heavy
precipitation in 2010-2011. Significant rises occurred on the west shore

27
streams during the Oct. 24, 2010 fall rain event with likely enhanced
sediment and nutrient loading. The increased flows on Blackwood Cr.
during this event resulted in particularly noticeable erosion of the stream
banks in the vicinity of the USGS gage. The winter and spring of 2011 was
very wet and cool. As a result, a significant snowpack developed and the
major portion of the spring snowmelt was delayed until the second half of
June into early July. The rise in lake surface elevation was very significant
during WY2011 as a consequence of the significant precipitation and runoff.
The lake level rose nearly five feet, from a minimum on Oct. 1, 2010 (6223.46
ft.) to a maximum of 6228.42 ft. on July 31, 2011.
3. Atmospheric deposition continues to be a significant source of nitrogen and
phosphorus loading for the lake.
4. WY 2011 had the highest Wet precipitation loading rates of NO3-N (1.91
g/ha/d), NH4-N (2.34 g/ha/d) of the last six years at the Lower Ward Valley
station. WY 2006 which was the closest to WY2011 in terms of precipitation
amount (65.9 inches) still had significantly lower N loading, i.e. NO3-N (1.59
g/ha/d), NH4-N (1.56 g/ha/d).
5. DIN load in Wet deposition showed an increase WY 2009 to WY2011. The
most significant increase was in WY 2011 coinciding with the large increase
in precipitation this year. The high DIN load in WY 2011 (1534.43 g/ha) was
the highest total since WY 1999. The SRP load in WY 2011 (35.97 g/ha) was
approximately twice that that occurred in WY 2010 (17.52 g/ha). Much of
the increase in SRP loading in WY 2011 may be attributed to overall
increased precipitation.
6. The N and P loading rates for WY 2010 and 2011 in dry deposition were
relatively similar to WY2009. Construction activities at the site in 2010 and
2011 likely contributed silt and organic matter to deposition samples at
times, data from obviously contaminated samples was excluded from the
loading estimates.
7. The loading rates at buoy stations TB-1 and TB-4 in WY 2010 and 2011, for
most N and P constituents remained close to levels observed the previous 4
years.
Task 6. Periphyton
The purpose of the periphyton monitoring task is to assess the levels of nearshore
attached algae (periphyton) growth around the lake. As for phytoplankton, nutrient
availability plays a large role in promoting periphyton growth. The amount of periphyton
growth can be an indicator of local nutrient loading and long-term environmental
changes.
Periphyton grows in the littoral (shore) zone of Lake Tahoe, which may be divided into
the eulittoral zone and the sublittoral zone, each with distinct periphyton communities.
The eulittoral zone is the shallow area between the low and high lake level and is

28
significantly affected by wave activity. It represents only a very small (<1%) of the total
littoral area. Substrata within this region desiccate as the lake level declines, and
periphyton must recolonize this area when lake level rises. The sublittoral zone extends
from the bottom of the eulittoral to the maximum depth of the photoautotrophic growth.
The sublittoral zone remains constantly submerged and represents the largest littoral
benthic region of Lake Tahoe.
The eulittoral zone community is typically made up of filamentous green algae i.e.
Ulothrix sp, Zygnema sp and stalked diatom species i.e. Gomphoneis herculeana. The
attached algae in the eulittoral zone display significant growth allowing for rapid
colonization. These algae are able to take advantage of localized soluble nutrients, and
can establish a thick coverage over the substrate within a matter of months. Similarly, as
nutrient concentrations diminish and shallow nearshore water temperatures warm with
the onset of summer, this community rapidly dies back. The algae can slough from the
substrate and disperse into the open water, as well as be washed ashore. In areas where
biomass is high, the slimy coating over rocks and sloughed material accumulated along
shore can be a nuisance. The eulittoral zone periphyton plays an important role in the
aesthetic, beneficial use of the shorezone. It is the rapid growth ability of the eulittoral
periphyton in response to nutrient inputs that lend particular value to monitoring this
community as an indicator of localized differences in nutrient loading.
The sublittoral zone is made up of different algal communities down through the euphotic
zone. Cyanophycean (Blue-green) algal communities make up a significant portion of
the uppermost sublittoral zone. These communities are slower growing and more stable
than the filamentous and diatom species in the eulittoral zone.
Stations and Methods
Nine routine stations were monitored during Oct. 2010- July, 2011 (Rubicon Pt., Sugar
Pine Pt., Pineland, Tahoe City, Dollar Pt., Zephyr Pt., Deadman Pt., Sand Pt, Incline
West). These nine sites are located around the lake (Table 7) and represent a range of
backshore disturbance levels from relatively undisturbed land (Rubicon Point and
Deadman Point) to a developed urban center (Tahoe City).
Table 7. Locations of Routine Periphyton Monitoring Stations
SITE NAME LOCATION
Rubicon N38 59.52; W120 05.60
Sugar Pine Point N39 02.88; W120 06.62
Pineland N39 08.14; W120 09.10
Tahoe City N39 10.24; W120 08.42
Dollar Point N39 11.15; W120 05.52
Zephyr Point N39 00.10; W119 57.66
Deadman Point N39 06.38; W11957.68
Sand Point N39 10.59; W119 55.70
Incline West N39 14.83; W119 59.75

29
A detailed description of the sample collection and analysis procedures is given in
Hackley et al. (2004). Briefly, the method entails collection while snorkeling of duplicate
samples of attached algae from a known area of natural rock substrate at a depth of 0.5m,
using a syringe and toothbrush sampler. These samples are transported to the laboratory
where the samples are processed and split, with one portion of the sample analyzed for
Ash Free Dry Weight (AFDW) and the other portion frozen for later analysis of
Chlorophyll a concentration (both AFDW and chlorophyll a are used as measures of
algal biomass). We also measure average filament length, % algal coverage, and estimate
the visual score in field observations. The visual score is a subjective ranking (1-5) of the
level of algal growth viewed underwater (as well as above water for a portion of the data)
where 1 is least offensive appearing (usually natural rock surface with little or no growth)
and 5 is the most offensive condition with very heavy growth.
Results
Monitoring at Routine Sites
In this report we summarize the data collected from July 2010- July 2011. Nine routine
sites were sampled. All sites were sampled five or more times during the period except
Deadman Pt. which was sampled four times. Three of the sampling circuits were made
during the spring (March-June), with additional sampling circuits made during Oct. 2010
and early Jan. 2011. Table 8 presents the results for biomass (chlorophyll a and Ash
Free Dry Weight (AFDW)) and field observations (visual score, average filament length,
percent algal coverage, biomass index and basic algal types) at the nine routine
periphyton sites for the period July 2010-July 2011. The results for periphyton
Chlorophyll a biomass are also presented graphically in Figures 7(a-i). In Water Year
2011, lake level played an important role in the levels of periphyton biomass measured.
Figure 8 shows fluctuation in lake level during the study period and Figure 9 shows
fluctuation in lake level since 2000.
Water Year 2011 Patterns of Periphyton Biomass
In WY 2011 (Oct. 1, 2010 – Sept. 30, 2011) measurements of periphyton biomass were
strongly affected by the significant increase in lake surface elevation. The lake rose
nearly five feet, (from 6223.46ft minimum surface elevation in October, 2010 to 6228.42
ft in August 2011) (Figs. 8,9) as a result of significant precipitation and runoff.
Monitoring was done during very low lake levels early in the WY (Oct. and Jan.) and
also during high lake level late in June 2011. During very low lake levels significant
biomass associated with the Blue-green algae was present at the 0.5m sampling depth at
many sites.2 As the lake rose very rapidly later in the year, newly submerged substrate
2 During years when lake surface elevation is very low, biomass associated with the
stable deeper, blue-green algal communities may be located in proximity to the surface.
This heavy biomass is not necessarily a consequence of high nutrient availability but
rather is a consequence of the lowering lake level. Conversely, during years where lake
level rapidly rises and substrate near the surface has been recently submerged, very little
biomass may be present, due to the short period of time for colonization.
30
was typically in proximity to the surface, whereas developing thicker growths of stalked
diatoms were submerged to greater and greater depths.
Significant periphyton biomass associated with Blue-green algae growth, was measured
at several sites in October, 2010 (Table 8; Figures 7a,b,g,h). Biomass levels were the
highest for the WY at several of these sites including: Rubicon Pt. (Chl a=133.34mg/m2),
Sugar Pine Pt. (27.85 mg/m2), Sand Pt. (53.69 mg/m
2) and Deadman Pt. (40.83 mg/m
2).
The lake level rose about a foot between Oct. 1, 2010 and Jan. 1, 2011 associated with
significant precipitation (Figure 8). Significant Blue-greens were still noted on the rocks
at 0.5m in January at several sites. At Incline West an annual maximum for chlorophyll a
was measured (62.46 mg/m2) (Figure 7f) associated with growth of both Blue-green algae
and filamentous green algae. At a couple of other sites, stalked diatoms contributed
significantly to the biomass. At Pineland (Figure 7c), the highest biomass of the WY was
measured (177.15 mg/m2) attributable to heavy stalked diatom growth over Blue-greens.
Zephyr Pt. had moderate amounts of stalked diatoms (34.25 mg/m2) in January (Figure
7i).
The heavy growth of stalked diatoms (Gomphoneis herculeana) at Pineland in early
January was particularly interesting. This early heavy growth may have been caused by a
combination of factors. Of particular note during this period, surface runoff and
subsurface inputs of nutrients associated with the wet storms in October and Dec. may
have contributed to the heavy growth. Upwelling of NO3-N to surface waters during
strong fall and early winter storms may also have contributed to this growth. Other
factors may have contributed as well.
During the period January through about mid-February there was a lull in the storm
activity, periphyton growing during this period may have been able to take advantage of
increased nutrients in the water from earlier storms, increasing solar radiation, calm
conditions (which would not subject the periphyton to sloughing), and stable lake level
which may have allowed significant colonization of rock submerged since late December.
Lake level held stable through about mid-February, then began to steadily increase.
Between mid-February and May 1 the lake rose about 1.5 ft (Figure 8). During this
period, significant growth of stalked diatoms occurred at many sites on newly submerged
substrate and below. Monitoring done during March to May for routine sites and April-
May (see Figure 8) for expanded monitoring sites captured this period of heavy stalked
diatom growth.
Highest spring levels of stalked diatom biomass were observed on the westshore
including very heavy chlorophyll a biomass at Pineland (154.06 mg/m2) (Figure 7c),
moderate levels at Tahoe City (45.35 mg/m2) (Figure 7d), Dollar Pt. (67.71 mg/m
2)
(Figure 7e), and Rubicon Pt. (30.1 mg/m21) (Figure 7b). The level of stalked diatom
biomass was also moderate at Incline West (38.08 mg/m2) (Figure 7f) in the northern
portion of the lake and Zephyr Pt (Figure 7i) along the south east shore (21.93 mg/m2).
31
In contrast, sites along the north east shore and Sugar Pine Pt. along the west shore had
very little or no periphyton biomass. Maximum chlorophyll a levels for these sites
during March through early May included: Sand Pt. ( 4.07 mg/m2) (Figure 7b), Deadman
Pt. (0 mg/m2) (Figure 7h) and Sugar Pine Pt. (7.35 mg/m
2) (Figure 7b).
From mid-May through the end of June rapid lake level rise (Figure 8), helped preclude
the establishment of large biomass of stalked diatoms near the surface at many sites.
With a lake level rise of about a foot and a half between mid-May and the end of June,
substrate at 0.5 was only submerged for about 1.5 months which was a short time for
establishment of significant growth. Sloughing of algae earlier in the spring from deeper
substrate at some sites, and perhaps reduced nutrient availability in surface waters and
warming temperatures may have also contributed to the low biomasses seen in late June.
Comparisons of visual observation of Periphyton Biomass Index (PBI) at fixed elevations
monitored earlier in the year with PBI levels in May often indicated PBI levels either
held constant or continued to increase on surfaces as the rocks were submerged to greater
and greater depths (Table 8). For instance, filament length was 0.2cm and % coverage
80% (PBI =0.16) at Rubicon Pt. 0.5m at 6223.98 ft elevation on March 28, 2011. On
5/13/11 biomass at approximately the same elevation 6224.02 ft. (0.71m sampling depth)
was much greater, (filament length=2.0 cm and % coverage 100% (PBI =2.0)) showing
that biomass increased between 3/28/11 and 5/13/11 for this fixed sampling elevation
even as the rock was submerged to a greater depth. A similar pattern of increase was
observed at Dollar Pt. for a fixed elevation near 6224.00 ft between 3/28/11 (PBI = 0.07)
and 5/9/11 (PBI =1.62) and for Incline West (fixed elevation also 6224.0 ft) between
3/31/11 (PBI = 0.27) and 5/6/11 (PBI =1.5). PBI also was compared at fixed elevations
for these sites for fixed elevation samples between 1/5/11 and the May sampling dates,
and PBI was much increased in May at all three sites after an increase in depth of
approximately a half meter. This indicated conditions for growth remained favorable at
these sites between January and May, and the stalked diatoms could establish over the
Blue-green algae present in January.
In contrast, comparisons of PBI between samples collected in April or May at fixed
elevations with values for samples in late June, indicated some samples increased in PBI
and some significantly decreased. At Incline West, elevation 6224.38, PBI increased
between 5/6/11 (PBI =0.60) and 6/30/11 (PBI =0.90). In contrast, decreases in PBI
between April and late June, at fixed elevations, were observed at: Tahoe City (6224.40
ft. elevation) between 4/29/11 (PBI =2.70) and 6/30/11 (PBI =0.25) and Sugar Pine Pt.
(6224.40 ft elevation) where PBI declined from (PBI=0.24) on 4/29/11 to PBI=0 on
6/30/11. Conditions may have become less favorable for growth at these sites and/or
sloughing of algae occurred. Significant sloughing of periphyton was observed at Tahoe
City in late May the day after a strong South wind event associated with a snow storm on
5/25/11.
Significant periphyton stalked diatom growth (PBI=5.0) was still observed at 1.3m at
Pineland on 6/30/11. Conditions were still favorable at that depth for sustaining biomass.
However, biomass was very low at 0.5m (PBI=0.14) indicating minimal colonization.

32
Table 8. Summary of eulittoral periphyton Chlorophyll a (Chlor.a), Ash Free Dry Weight (AFDW), visual score from above and below water,
average filament length, percent algal coverage, and predominant algal types estimated visually underwater (where SD= stalked diatoms; FG=
filamentous greens; CY= blue-green algae) for routine periphyton monitoring sites during July 2010-July 2011. Note for Chlorophyll a and AFDW,
n=2 unless otherwise indicated (i.e. two replicate samples were taken). Visual score is a subjective ranking of the aesthetic appearance of algal
growth (“above” viewed above water; “below” viewed underwater) where 1 is the least offensive and 5 is the most offensive. Biomass Index is
Filament Length times % Algal Cover. Also,“na” = not available or not collected; “nes” = not enough sample for analysis. Sampling depth and
corresponding sampling elevation are also indicated.
Sampling Above Below Fil. Algal
Depth/Elev Chlor. a Std Dev AFDW Std Dev Visual Visual Length Cover. Biomass Algal
Site Date (m/ ft) (mg/m2) (mg/m
2) (g/m
2) (g/m
2) Score Score (cm) (%) Index Type
Rubicon Pt. 10/13/10 0.5/6221.89 133.34 43.27 89.98 12.88 2 3 1.0 70 0.70 CY
1/5/11 0.5/6222.91 108.68 25.23 62.89 8.28 3 3.5 0.8 90 0.72 CY,FG
3/28/11 0.5/6223.98 14.60 3.22 5.99 1.30 3 2.5 0.2 80 0.16 SD
5/5/11 0.5/6224.51 11.50 1.35(n=3) 6.06 1.56(n=3) 4 3 1.2 50 0.6 SD
5/13/11 0.59/6224.38 30.11 2.56(n=3) 18.18 4.72(n=3) 4 4 1.8 100 1.8 SD
5/13/11 0.71/6224.02 - - - - - - 2.0 100 2.0 SD
5/13/11 1.03/6222.97 - - - - - - 2.0 80 1.6 FG,SD
Sugar Pine Pt. 10/13/10 0.5/6221.89 27.85 14.58 24.89 11.80 2 0.2 80% 0.16 CY
1/5/11 0.5/6222.91 10.06 1.18 8.80 0.23 NA 2 0.2 50% 0.10 CY,FG
3/28/11 0.5/6223.98 7.35 1.15 2.89 1.19 2.5 2.5 0.3 90% 0.27 SD
4/29/11 0.5/6224.40 6.56 0.88 2.00 1.12 NA 3 0.3 80% 0.24 SD
6/30/11 0.5/6226.36 BLD BLD BLD BLD 1 1 0.0 0% 0.00 NA
6/30/11 0.88/6225.11 NES NES 0.00 0.00 1 0.0 0% 0.00 SD
6/30/11 1.1/6224.39 - - - - 1 1 0.0 <1% NA
Pineland 10/13/10 0.5/6221.89 37.41 2.10 33.90 8.68 2 2 0.3 70% 0.21 CY
1/5/11 0.5/6222.91 177.15 49.00 79.24 24.50 3.5 3 1.5 80% 1.20 CY,SD,FG
3/28/11 0.5/6223.98 67.43 30.39 56.28 35.80 5 5 3.0 100% 3.00 SD
4/29/11 0.5/6224.40 154.06* 78.56 91.31* 27.41 4 5 3.5 90% 3.15 SD
5/13/11 0.59/6224.38 68.22 19.06(n=3) 32.27 5.96 (n=3) 4 2.0 90% 1.80 SD
6/30/11 0.5/6226.36 1.76 (n=1) 3.81 (n=1) 2 2 0.2 70% 0.14 SD
6/30/11 0.85/6225.11 16.71 1.16 33.37 2.41 4 2.5 90% 2.25 SD,FG
6/30/11 1.3/6223.73 - - - - 5 5 5.0 100% 5.00 SD,FG

33
Sampling Above Below Fil. Algal
Depth/Elev Chlor. a Std Dev AFDW Std Dev Visual Visual Length Cover. Biomass Algal
Site Date (m/ ft) (mg/m2) (mg/m
2) (g/m
2) (g/m
2) Score Score (cm) (%) Index Type
Tahoe City 10/13/10 0.5/6221.89 18.66 0.19 20.10 2.55 1 2 0.1 50% 0.05 SD
1/5/11 0.5/6222.91 37.03 4.03 36.17 10.38 2 2.5 0.5 10% 0.05 SD
3/28/11 0.5/6223.98 24.91 2.85 14.65 0.66 2 3 0.4 90% 0.36 SD
4/29/11 0.5/6224.40 43.12 20.49 48.78 26.54(n=3) 4 4 3.0 90% 2.70 SD
5/9/11 0.56/6224.44 45.35 13.58(n=3) 65.15 19.54(n=3) 4 4 2.5 90% 2.25 SD
5/26/11 0.7/6224.40 - - - - - - 0.6 variable NA SD
6/30/11 0.5/6226.36 2.00 0.08 3.23 0.02 2 2 0.2 80% 0.16 SD
6/30/11 0.85/6225.21 4.59 0.78 7.49 0.15 NA NA 0.3 50% 0.15 SD
6/30/11 1.1/6224.39 - - - - - - 0.5 50% 0.25 SD
Dollar Pt. 10/13/10 0.5/6221.89 14.77 5.32 17.41 3.54 1 1 0.1 40% 0.04 SD or BG
1/5/11 0.5/6222.91 34.35(n=1) NA 35.79 (n=1) 2 2 0.2 60% 0.12 SD,FG
3/31/11 0.5/6224.00 13.08 1.61 4.98 0.59 2 2 0.1 70% 0.07 SD
4/29/11 0.5/6224.40 67.71 14.31 67.00 15.70 3 3.5 1.5 80% 1.20 SD
5/9/11 0.56/6224.44 - - - - - 3.5 1.0 90% 0.90 SD
5/9/11 0.69/6224.02 - - - - - - 1.8 90% 1.62 SD
5/9/11 1.0/6223.00 - - - - - - 3.0 100% 3.0 SD
7/1/11 0.5/6226.40 2.49 0.08 3.83 0.51 1.5 2 0.1 90% 0.09 SD
7/1/11 0.85/6225.25 5.31 2.36 9.46 1.27 - 2 0.3 70% 0.21 SD
7/1/11 1.15/6224.27 - - - - - 2.5 0.5 10% 0.05 SD
Incline West 10/13/10 0.5/6221.89 38.69 4.57 43.95 5.13 2 3 0.4 90% 0.36 CY,FG
1/5/11 0.5/6222.91 62.46 n=1** 66.09 n=1** 2 3 0.7 90% 0.63 CY,FG
3/31/11 0.5/6224.00 15.42 3.27 7.37 1.01 2 2 0.3 90% 0.27 SD
5/6/11 0.54/6224.38 38.08 3.80 16.58 1.20 2 3 2.0 30% 0.60 SD
5/6/11 0.65/6224.02 - - - - - 4 2.5 60% 1.5 SD
5/6/11 0.98/6223.06 - - - - - 3 1.6 90% 1.44 SD
7/1/11 0.5/6226.40 2.22 0.13 NES NES 1.5 2 0.1 70% 0.07 SD
7/1/11 0.85/6225.25 3.49 0.41 5.81 1.41 - 0.5 60% 0.30 SD
7/1/11 1.1/6224.43 - - - - - 3 1.5 60% 0.90 CY,FG,SD

34
Sampling Above Below Fil. Algal
Depth/Elev Chlor. a Std Dev AFDW Std Dev Visual Visual Length Cover. Biomass Algal
Site Date (m/ ft) (mg/m2) (mg/m
2) (g/m
2) (g/m
2) Score Score (cm) (%) Index Type
Sand Point 10/13/11 0.5/6221.89 53.69 3.76 70.01 0.88 3 3 0.8 80% 0.64 CY,FG
1/5/11 0.5/6222.91 40.24 5.03 34.81 4.35 2 2 0.4 50% 0.20 CY,FG
3/31/11 0.5/6224.00 BLD BLD BLD BLD 1 1 0.0 0% 0.00 none
5/6/11 0.54/6224.38 4.07 1.11 3.68 N=1 3 3 0.8 60% 0.48 SD
7/1/11 0.5/6226.40 NES NES NES NES 1 1 0.0 0% 0.00 none
7/1/11 0.85/6225.25 NES NES NES NES 1 1 0.0 0% 0.00 none
Deadman Pt. 10/13/11 0.5/6221.89 40.83 2.63 51.24 0.46 3.5 3 0.6 75% 0.45 CY,FG
1/5/11 0.5/6222.91 22.28 5.22 26.48 3.84 2 2 0.3 50% 0.15 CY
3/31/11 0.5/6224.00 BLD BLD 5.62 5.01 1 1 0.0 0% 0.00 none
5/6/11 0.54/6224.38 BLD BLD 1.82 0.90 1 1 0.0 0% 0.00 none
5/6/11 0.65/6224.02 - - - - 1 1 0.0 0% 0.00 none
5/6/11 0.98/6223.06 - - - - - 3 0.5 90% 0.45 CY,FG
Zephyr Point 10/13/10 0.5/6221.89 28.95 11.05 25.86 10.20 3 3 0.6 70% 0.42 CY,FG
1/5/11 0.5/6222.91 34.25 20.71 28.51 17.59 2 2 1.0 70% 0.70 SD
3/31/11 0.5/6224.00 21.93 6.03 8.96 5.26 3 3 0.4 100% 0.40 SD
5/5/11 0.5/6224.51 15.39 2.64 6.98 1.66(n=3) 3 3 0.5 90% 0.45 SD
5/23/11 0.67/6224.40 12.90 2.22(n=3) 10.16 2.60(N=3) 3 3 0.7 90% 0.63 SD
7/1/11 0.5/6226.40 BLD BLD NES NES - 1.5 <0.1 0% 0.00 none
7/1/11 0.85/6225.25 1.61 0.01 NES NES - - <0.1 1% 0.00 SD
7/1/11 1.1/6224.43 - - - - - - 0.5 30% 0.15 SD
Notes - * -One Pineland biomass sample replicate had anomalously high chlorophyll a = 478.17 mg/m2 and AFDW= 224.31 g/m
2 and was not
included in the Pineland chlorophyll a and AFDW means for 4/29/11; one Incline West biomass sample replicate (1/5/11) was anomalously high
based on the observations of growth at the site ranking and biomass index, (chlorophyll a = 227.41 mg/m2), this sample was not included in totals
for chlorophyll a and AFDW.

35
Figure 7 a. Rubicon Pt. periphyton biomass (chlorophyll a) Oct. 2010-July 2011.
Predominant algae type(s) observed are indicated for each collection date
(CY=Cyanophytes or Blue-green algae; FG= Filamentous green algae; SD=Stalked
diatoms). Samples were collected at 0.5m sampling depth except where different depth
indicated with “*”. Sample collection elevations are indicated along bottom of chart, for
reference, the natural rim of the lake is 6223.0 ft.
Figure 7 b. Sugar Pine Pt. periphyton biomass (chlorophyll a) Oct. 2010-July 2011.

36
Figure 7 c. Pineland periphyton biomass (chlorophyll a) Oct. 2010-July 2011.
Figure 7 d. Tahoe City periphyton biomass (chlorophyll a) Oct. 2010-July 2011.

37
Figure 7 e. Dollar Pt. periphyton biomass (chlorophyll a) Oct. 2010-July 2011.
Figure 7 f. Incline West periphyton biomass (chlorophyll a) Oct. 2010-July 2011.

38
Figure 7 g. Sand Pt. periphyton biomass (chlorophyll a) Oct. 2010-July 2011.
Figure 7 h. Deadman Pt. periphyton biomass (chlorophyll a) Oct. 2010-July 2011.

39
Figure 7 i. Zephyr Pt. periphyton biomass (chlorophyll a) Oct. 2010-July 2011.
Figure 8. Fluctuation in Lake Tahoe surface elevation 6/1/10-8/1/11. Periphyton
samples were typically collected during the period at a depth of 0.5m below the surface
on natural rock substrata (dotted line). During the expanded sites monitoring in the
spring 2011 (period shown encompassed in small box), the sampling elevation was
maintained near 6224.40 ft as the lake began to rise rapidly.

40
Figure 9. Fluctuation in Lake Tahoe surface elevation 1/1/00-8/1/11. Periphyton
samples were typically collected during the period at a depth of 0.5m below the surface
on natural rock substrata. The 0.5m sampling depth (shown as a dotted line) fluctuates
with the lake surface elevation. The elevation of the natural rim of Lake Tahoe is 6223
ft. The top 6.1 ft. of the lake above the rim are operated as a reservoir.

41
Figure 10. Annual maximum periphyton Chlorophyll a Water Years 2008-2011 at the nine routine periphyton monitoring sites at
0.5m. In Water Year 2011, a significant lake level rise of nearly five feet occurred, (from 6223.46ft minimum surface elevation in
October, 2010 to 6228.42 ft in August 2011). During low lake level Oct. 2010-Jan. 2011 biomass at many sites was primarily due to
Blue-green algae (Cyanophytes) and also filamentous green algae and was quite high, notably at Rubicon Pt. (the maximum biomass
for Oct. 2010-Jan. 2011 is shown above as the light blue bar). During the spring, 2011, as lake level rose rapidly, periphyton
colonized newly submerged rock, this growth was primarily stalked diatoms (the spring maximum growth for 2011 is shown by the
red bar). The maximum for the whole year is the larger of the two maximums, indicated by dashed lines in the figure.
42
Annual Maximum Biomass
WY 2008-WY2011 maximum biomass values as estimated by chlorophyll a for all sites
are shown in Figure 10. WY 2011 was a bit unusual in that biomass was high at many
sites early in the year associated with low lake levels and significant Blue-green algae
biomass. Later in the spring significant biomass associated with stalked diatoms was also
present at several sites. So peaks in annual biomass occurred from some sites early in the
WY, while for others the peaks occurred in the spring. Pineland actually had peaks in
both periods. To reflect the importance of the two periods relative to annual maximum
growth in WY2011, data for both Oct./Jan. period and the spring were presented in the
summary chart showing annual maximum chlorophyll a (Figure 10). The highest of the
two bars represents the maximum for the year.
The pattern for maximum annual biomass (when the maximum for both periods
combined was used) was slightly different from that typically seen in the long-term
monitoring. In past years, three sites in the northwest portion of the lake, (i.e. Pineland,
Tahoe City and Dollar Pt.) often had the highest annual maximum chlorophyll a. In WY
2011, Pineland continued to have extremely high maximum chlorophyll a while, levels at
Tahoe City and Dollar were only moderate (not strikingly different from some of the
other sites around the lake). These results may be in large part explained by high
biomass associated with Blue-greens early in the year at some of the other sites (for
instance at several of the east shore sites as well as at Rubicon Pt., levels of biomass early
in the year were near maximum). At Tahoe City the Annual Maximum chlorophyll a was
less than it had been the last three years.
When the data for maximum chlorophyll a associated with stalked diatom growth during
the spring period is compared, however, the results however do remain consistent with
patterns observed in past years. During the spring of 2011 the highest annual periphyton
biomass was still observed at these three sites (Pineland, Tahoe City and Dollar Pt. in the
northwest portion of the lake). Periphyton biomass in the spring at sites along the east
shore was very low in WY 2011 and was moderate at Incline West in the northern part of
the lake.
It is interesting to note that at Tahoe City the Annual Maximum chlorophyll a was less
than it had been the last three years. However, Ash Free Dry Weight (another measure of
biomass, which included all the organic material present) at Tahoe City during the peak
in 2011 (65.15 g/m2) was close to the peak in 2010 (69.48 g/m2). During peak growth at
Tahoe City the growth of stalked diatoms was very heavy and covered the sandy bottom
as well as cobble. So a large amount of biomass was present. It‟s possible there was less
chlorophyll a per unit organic material at Tahoe City in 2011.

43
Expanded Monitoring 2011
While the nine routine sampling sites provide data from many different regions around
the lake with differing levels of backshore development and disturbance, the limited
number of these sites does not provide enough resolution to determine periphyton
biomass on a whole-lake scale. For this reason an “expanded” synoptic sampling was
done in the spring in which 43 additional sites along with the nine routine sites were
monitored for level of periphyton growth. Table 9 presents the names and locations of
these synoptic sites. This synoptic monitoring was timed as much as possible to
correspond to peak periphyton growth in each region of the lake.
During spring 2011, the 43 expanded sites were monitored visually while snorkeling.
Measurements of filament length, % coverage, above and below water visual ranking,
and observations on main algal types present were made. In addition biomass samples
(chlorophyll a and AFDW were collected at 7 of the sites).
Table 9. Periphyton expanded monitoring locations.
WEST SHORE
SITE
DESIGNATION SITE NAME LOCATION
A Cascade Creek N38 57.130; W120 04.615
B S. of Eagle Point N38 57.607; W120 04.660
C E.Bay/Rubicon N38 58.821; W120 05.606
D Gold Coast N39 00.789; W120 06.796
E S. Meeks Point N39 01.980; W120 06.882
F N. Meeks Bay N39 02.475; W120 07.194
G Tahoma N39 04.199; W120 07.771
H S. Fleur Du Lac N39 05.957; W120 09.774
I Blackwood Creek N39 06.411; W120 09.424
J Ward Creek N39 07.719; W120 09.304
K N. Sunnyside N39 08.385; W120 09.135
L Tavern Point N39 08.806; W120 08.628
TCT Tahoe City Tributary (adjacent to T.C. Marina)
M TCPUD Boat Ramp N39 10.819; W120 07.177
N S. Dollar Point N39 11.016; W120 05.888
O S. Dollar Creek N39 11.794; W120 05.699
P Cedar Flat N39 12.567; W120 05.285
Q Garwood‟s N39 13.486; W120 04.974
R Flick Point N39 13.650; W120 04.155
S Stag Avenue N39 14.212; W120 03.710
T Agatam Boat Launch N39 14.250; W120 02.932
EAST SHORE
E1 South side of Elk Point N38 58.965; W119 57.399
E2 North Side of Elk Point N38 59.284; W119 57.341
E3 South Side of Zephyr Point N38 59.956; W119 57.566
E4 North Zephyr Cove N39 00.920; W119 57.193
E5 Logan Shoals N39 01.525; W119 56.997

44
E6 Cave Rock Ramp N39 02.696; W119 56.935
E7 South Glenbrook Bay N39 04.896;W119 56.955
E8 South Deadman Point N39 05.998; W119 57.087
E9 Skunk Harbor N39 07.856; W119 56.597
E10 Chimney Beach N39 09.044; W119 56.008
E11 Observation Point N39 12.580; W119 55.861
NORTH SHORE
E12 Hidden Beach N39 13.263; W119 55.832
E13 Burnt Cedar Beach N39 14.680; W119 58.132
Incline Condo N39 14.90; W119 59.63
Old Incline West (100 yds No. Incline West)
E14 Stillwater Cove N39 13.789; W120 00.020
E15 North Stateline Point N39 13.237; W120 00.193
E16 Brockway Springs N39 13.560; W120 00.829
E17 Kings Beach Ramp Area N39 14.009; W120 01.401
SOUTH SHORE
S1 Tahoe Keys Entrance N38 56.398; W120 00.390
S2 Kiva Point N38 56.555; W120 03.203
Timber Cove Rocks Rocks west T. Cove Pier

45
Figure 11. Extrapolated regional distribution of periphyton biomass measured as
Biomass Index (Avg. Filament Length x % Area Covered with Algae) April 12 – May
13, 2011.

46
2011 Expanded Monitoring Results
Data collected for the expanded monitoring 2011 is summarized in Table 10. Figure 11
presents a map showing the general distribution of periphyton biomass (as Biomass
Index) around the lake in spring 2011. The 2011 expanded monitoring was done during
the spring when lake level was increasing rapidly and significant stalked diatom growth
was still present at 0.5m. Sites at South Shore were sampled slightly earlier (on 4/12/11)
than other sites (spring biomass often peaks earlier there than at the other sites.) The
remaining expanded sites as well as routine sites were sampled during the period 4/29/11
to 5/13/11. Due to rapid lake level rise, after 5/5/11, a fixed sampling elevation of
~6224.40 ft. was used for monitoring to help assure algae had colonized substrate for
approximately the same length of time.
Again, it is important to note that due to the issue of variable timing of growth and
subsequent die-off of periphyton at various locations around the lake and also the rapid
lake rise, this synoptic data is best considered as supplemental to the routine seasonal
monitoring. Conclusions related to the ability of a specific site to support periphyton
should be tempered by these considerations.
Along the southwest shore, from Cascade Creek to Sugar Pine Pt. growth was light to
moderate with regions of heavier growth in the E.Bay/Rubicon and Rubicon Pt. areas and
near Cascade Cr. E. Bay/Rubicon and Rubicon Pt. areas: U/W visual score was 4 at both
sites; Biomass Index values were 1.98 and 1.80 at the sites respectively; chlorophyll a
was moderately high at both sites (34.62 and 30.11 mg/m2 respectively). Near the
mouth of Cascade Cr. U/W visual score was 4 and Biomass Index 1.5 (chlorophyll a was
not measured).
Along much of the northwest shore from Tahoma to near Dollar Cr. growth was
moderate to very heavy (underwater visual scores of 4-5 and Biomass Indexes > 1) with
some areas of low-to-moderate growth (Biomass Indexes < 1) interspersed. Areas of
heavy biomass were attributable to stalked diatoms. Areas with the heaviest amounts of
biomass (U/W visual ranking of 5) included: Tahoma, Kaspian Pt., Ward Cr., Pineland
and Tahoe City Tributary. Chlorophyll a was measured at two of the sites and was very
heavy at Ward Cr. (323.1 mg/m2) and Pineland (154.1 mg/m2). Areas with light growth
included the mouth of Blackwood Cr. where substrate is likely unfavorable for growth
(sand, gravel, small cobble) and North Sunnyside, where nearshore substrate may also be
unfavorable (small cobble prone to tumbling in wave activity).
Further north from Cedar Flat to Stateline Pt. biomass was light to moderate with a region
of heavier biomass in the Kings Beach (U/W rank=4, Biomass Index = 1.90) and
Brockway Springs (U/W rank = 5, Biomass Index =2.52) areas.
Growth was generally light along the north east and east shore between Stillwater Cove
and Zephyr Pt. with a few pockets of heavier growth. One area of heavier growth was in
the northeast corner of Crystal Bay at Incline Condominiums (U/W rank=4.5, Biomass
Index= 1.82), Incline West adjacent to this site had light-moderate growth (U/W rank = 3,

47
Biomass Index=0.60, chlorophyll a= 38.08 mg/m2). Moderate growth was also observed
at Chimney Beach (U/W rank = 3.5, Biomass Index=1.5) along the east shore.
Along the south shore growth was moderate both at the south east and south west
corners, with light growth near the Tahoe Keys. Moderate growth was observed at So.
Elks Pt. (U/W rank=4, Biomass Index=1.60) and Timber Cove boulders (U/W rank=4,
Biomass Index = 1.8) at the south east corner of the lake. Moderate growth was also
observed at Kiva Beach (U/W rank=4, Biomass Index=1.08).
Overall, during the spring of WY 2011, periphyton biomass was heavier along the west
shore, with heaviest growth in the northwest portion of the lake from Tahoma to Dollar
Creek. There were also areas of heavier growth in the Kings Beach/Brockway Springs
areas, and Incline Condominium site in the northern portion of the lake and at the South
west and south east corners of the lake. Growth was lighter along most of the east shore
with one area of heavier growth at Chimney Beach. The periphyton appeared to be
dominated by the stalked diatom Gomphoneis herculeana at most sites in the spring. At a
couple sites, Garwood‟s and Timber Cove there was also some filamentous green algae
present.
It is likely a combination of many factors affected patterns of periphyton biomass in
WY2011. These factors include nutrient inputs with surface runoff, enhanced inputs
from urban/disturbed areas, groundwater, lake mixing/upwelling/currents), lake level,
substrate availability and wind/wave events which may affect periphyton loss from the
rocks. WY 2011 was a particularly heavy precipitation year. The contribution of
nutrients from surface and tributary runoff from the many wet storms may have had more
of an impact on nearshore periphyton growth this year compared with years with less
precipitation. Several sites with very high biomass this year were in regions that are
likely influenced by tributaries and surface runoff (i.e. Ward Cr., Tahoe City Tributary,
South Dollar Cr., Pineland may also be influenced by Ward Cr., and the Kings Beach site
is near an urban inflow). Upwelling of NO3-N during frequent storms early in this WY
may also have contributed to patterns of biomass observed. Finally, the rapid rise in lake
elevation as a result of the wet year, resulted in relatively little periphyton right near the
surface later in the year. The heavier biomass associated with the spring growth was
eventually submerged to depths greater than 0.5m and was not readily apparent right near
the surface by early summer.

48
Table 10. Summary of 0.5m periphyton Chlorophyll a, Ash Free Dry Weight (AFDW), visual score, avg. filament length and % algal coverage,
predominant algae present based on visual observations while snorkeling (FG=filamentous greens; SD=stalked diatoms; CY= blue green algae), for
routine sites (shaded) and expanded periphyton monitoring sites during 2011. Note for chlorophyll a and AFDW, n=2 unless otherwise indicated.
Visual score is a subjective ranking of the aesthetic appearance of algal growth (viewed underwater) where 1 is the least offensive and 5 is the most
offensive. Biomass Index is Filament Length times % Algal Cover. “na” = not available or not collected; “nes” = not enough sample for analysis.
Sampling depth and corresponding sampling elevation are also indicated. Sampling Above Below Fil. Algal
Depth/Elev Chl a Std Dev AFDW Std Dev Visual Visual Length Cover. Biomass Algal
Site Site Name Date (m/ ft) (mg/m2) (mg/m
2) (g/m
2) (mg/m
2) Score Score (cm) % Index Type
A Cascade Creek 5/13/11 0.59/6224.38 3 4 2.5 60% 1.50 SD
B S. of Eagle Point 5/13/11 0.59/6224.38 2 3 1.2 70% 0.84 SD
C E.Bay/Rubicon 5/13/11 0.59/6224.38 34.62 8.86 14.55 9.74 4 4 2.2 90% 1.98 SD
Rubicon Pt. 5/13/11 0.59/6224.38 30.11 2.56(n=3) 18.18 4.72(n=3) 4 4 1.8 100 1.8 SD
D Gold Coast 5/13/11 0.59/6224.38 2 3 1.0 60% 0.60 SD
E S. Meeks Point 5/13/11 0.59/6224.38 2.5 3 1.4 60% 0.84 SD
F N. Meeks Bay 5/13/11 0.59/6224.38 3 3 1.0 70% 0.70 SD
Sugar Pine Pt. 4/29/11 0.5/6224.40 6.56 0.88 2.00 1.12 NA 3 0.3 80% 0.24 SD
G Tahoma 4/29/11 0.5/6224.40 NA 5 1.5 80% 1.20 SD
H S. Fleur Du Lac 4/29/11 0.5/6224.40 NA 4 1.4 90% 1.26 SD
I Blackwood Creek 4/29/11 0.5/6224.40 NA 2 0.2 60% 0.12 SD
Kaspian Pt. 4/29/11 0.5/6224.40 NA 5 3.0 90% 2.70 SD
J Ward Creek 4/29/11 0.5/6224.40 323.10* 92.54 431.81 156.86 NA 5 5.5 100% 5.50 SD
Pineland 4/29/11 0.5/6224.40 154.06* 78.56 91.31* 27.41 4 5 3.5 90% 3.15 SD
K N. Sunnyside 4/29/11 0.5/6224.40 NA 4 0.5 90% 0.45 SD
L Tavern Pt. 4/29/11 0.5/6224.40 4 4 1.5 90% 1.35 SD
Tahoe City 4/29/11 0.5/6224.40 43.12 20.49 48.78 26.54(n=3) 4 4 3.0 90% 2.70 SD
TCT Tahoe City Trib. 4/29/11 0.5/6224.40 5 5 3.0 90% 2.70 SD
M TCPUD Boat Ramp 4/29/11 0.5/6224.40 NA 4 2.0 80% 1.60 SD
N S. Dollar Pt. 4/29/11 0.5/6224.40 2 3 1.0 90% 0.90 SD
Dollar Pt. 4/29/11 0.5/6224.40 67.71 14.31 67.00 15.70 3 3.5 1.5 80% 1.20 SD
O S. Dollar Creek 4/29/11 0.5/6224.40 3 4 2.0 80% 1.60 SD
P Cedar Flat 4/29/11 0.5/6224.40 3.5 3.5 1.2 80% 0.96 SD
Q Garwood‟s 5/9/11 0.56/6224.44 3.5 4 1.0 90% 0.90 SD,FG
R Flick Point 5/6/11 0.54/6224.38 2 3 1.0 60% 0.60 SD
S Stag Avenue 5/9/11 0.56/6224.44 3 3 0.5 60% 0.30 SD
T Agatam Boat R. 5/9/11 0.56/6224.44 3 3.5 1.0 50% 0.50 SD

49
Sampling Above Below Fil. Algal
Depth/Elev Chl a Std Dev AFDW Std Dev Visual Visual Length Cover. Biomass Algal
Site Site Name Date (m/ ft) (mg/m2) (mg/m
2) (g/m
2) (mg/m
2) Score Score (cm) % Index Type
E17 Kings Beach 5/9/11 0.56/6224.44 3.5 4 2.0 95% 1.90 SD
E16 Brockway Springs 5/6/11 0.54/6224.38 4 5 2.8 90% 2.52 SD
E15 No. Stateline Point 5/6/11 0.54/6224.38 3.64 0.53 NES NES 4 2 0.2 80% 0.16 SD
E14 Stillwater Cove 5/6/11 0.54/6224.38 3 2 1.0 50% 0.50 SD
Old Incine West 5/6/11 0.54/6224.38 3 3 0.9 60% 0.54 SD
Incline West 5/6/11 0.54/6224.38 38.08 3.80 16.58 1.20 2 3 2.0 30% 0.60 SD
Incline Condo 5/6/11 0.54/6224.38 3 4.5 2.6 70% 1.82 SD
E13 Burnt Cedar Beach 5/6/11 0.54/6224.38 2.5 2.5 0.5 70% 0.35 SD
E12 Hidden Beach 5/6/11 0.54/6224.38 1.5 1.5 0.1 40% 0.04 SD
E11 Observation Point 5/9/11 0.56/6224.44 3 3 0.6 70% 0.42 SD
Sand Pt. 5/6/11 0.54/6224.38 4.07 1.11 3.68 N=1 3 3 0.8 60% 0.48 SD
E10 Chimney Beach 5/6/11 0.54/6224.38 2 3.5 1.5 100% 1.50 SD
E9 Skunk Harbor 5/6/11 0.54/6224.38 1 1 0.0 0% 0.00 none
Deadman Pt. 5/6/11 0.54/6224.38 BLD BLD 1.82 0.90 1 1 0.0 0% 0.00 none
E8 So. Deadman Point 5/6/11 0.54/6224.38 3 3 0.7 40% 0.28 SD
E7 So. Glenbrook Bay 5/6/11 0.54/6224.38 1 1.5 0.1 60% 0.06 SD
E6 Cave Rock Ramp 5/5/11 0.5/6224.51 2 2 0.2 50% 0.10 SD
E5 Lincoln Park 5/5/11 0.5/6224.51 2 2 0.2 80% 0.16 SD
E4 No. Zephyr Cove 5/5/11 2 2 0.3 40% 0.12 SD
E3 So. Zephyr Pt. 5/5/11 0.5/6224.51 2 3 1.0 50% 0.50 SD
Zephyr Pt. 5/5/11 0.5/6224.51 15.39 2.64 6.98 1.66(n=3) 3 3 0.5 90% 0.45 SD
E2 No. Elk Pt. 5/5/11 0.5/6224.51 7.05 1.52(n=3) 4.93 0.13(n=3) 2 3 1.0 80% 0.80 SD
E1 So. Elk Point 5/5/11 0.5/6224.51 3 4 2.0 80% 1.60 SD
Timber Cove Rock 4/12/11 0.50/6224.12 67.28 18.99(n=3) 38.40 10.02(n=3) NA 4 1.2 90% 1.08 SD,FG
S1 T. Keys Entrance 4/12/11 0.50/6224.12 28.18 5.91(n=3) 12.72 3.51(n=3) 4.5 3 0.7 60% 0.42 SD
S2 Kiva Point 4/12/11 0.50/6224.12 62.93 22.14(n=3) 40.75 13.46(n=3) 3 4 1.2 90% 1.08 SD
Note - * -One Pineland biomass sample replicate had anomalously high chlorophyll a = 478.17 mg/m2 and AFDW= 224.31 g/m
2 and was not
included in the Pineland chlorophyll a and AFDW means for 4/29/11.

50
Summary Points for Periphyton Monitoring
1. In WY 2011 (Oct. 1, 2010 – Sept. 30, 2011) measurements of periphyton
biomass were strongly affected by the significant ~5 ft. rise in lake surface
elevation. Biomass was high at many sites early in the year associated with
low lake levels and significant Blue-green algae biomass. Annual maximum
levels of chlorophyll a were measured in October at: Rubicon Pt. (133.34
mg/m2), Sugar Pine Pt. (27.85 mg/m
2), Sand Pt. (53.69 mg/m
2) and Deadman
Pt. (40.83 mg/m2). An annual maximums was measured in January at
Incline West (62.46 mg/m2) associated with growth of both Blue-green algae
and filamentous green algae.
2. At two sites, stalked diatoms contributed significantly to the January 2011
chlorophyll a biomass and resulted in annual maximum levels. These sites
inclued: Pineland (177.15 mg/m2) which had very heavy stalked diatom
growth over Blue-greens and Zephyr Pt. which had moderate amounts of
stalked diatoms (34.25 mg/m2).
3. During the spring monitoring of routine sites in 2011, similar to past years,
the highest annual periphyton biomass associated with stalked diatom
growth was observed at three sites in the northwest portion of the lake:
Pineland, Tahoe City and Dollar Pt. Pineland had very high chlorophyll a
biomass (154.06 mg/m2) while moderate levels were observed at Tahoe City
(45.35 mg/m2 – which was less than the last three years), Dollar Pt. (67.71
mg/m2 which was similar annual maximum in 2010 but less than levels in
2008 and 2009), and Rubicon Pt. (30.1 mg/m2 – which was less than the
annual maximums observed the last three years). The level of stalked diatom
biomass was also moderate at Incline West (38.08 mg/m2) in the northern
portion of the lake and Zephyr Pt along the south east shore (21.93 mg/m2).
In contrast, 0.5m sites along the north east shore (Sand Pt. and Deadman Pt.)
and Sugar Pine Pt. along the west shore had very little or no periphyton
biomass in spring 2011.
4. The results of the expanded and routine monitoring during the spring of WY
2011, showed that periphyton biomass was heavier along the west shore, with
heaviest growth in the northwest portion of the lake from Tahoma to Dollar
Creek. Areas with the heaviest amounts of biomass (U/W visual ranking of
5) included: Tahoma, Kaspian Pt., Ward Cr., Pineland and Tahoe City
Tributary. There were also areas of heavier growth in the Kings
Beach/Brockway Springs areas, and Incline Condominium site in the
northern portion of the lake and at the South west and south east corners of
the lake. Growth was lighter along most of the east shore with one area of
heavier growth at Chimney Beach. The periphyton appeared to be
dominated by the stalked diatom Gomphoneis herculeana at most sites in the
spring.

51
5. Between May 1 and July 1 the lake rose and additional 2 feet. Very little
periphyton biomass developed at 0.5m and above during this period due to
the rapid lake level increase. Very little periphyton was observed near the
surface down to 0.5m in late June. However, at some sites a significant layer
of biomass from the spring growth was still present deeper at about 1m.
6. It is likely a combination of many factors affected patterns of periphyton
biomass in WY2011. These factors include nutrient inputs with surface
runoff, enhanced inputs from urban/disturbed areas, groundwater, lake
mixing/upwelling/currents), lake level, substrate availability and wind/wave
events which may affect periphyton loss from the rocks. WY 2011 was a
particularly heavy precipitation year. The contribution of nutrients from
surface and tributary runoff from the many wet storms may have had more
of an impact on nearshore periphyton growth this year compared with years
with less precipitation. Several sites with very high biomass this year were in
regions that are likely influenced by tributaries and surface runoff (i.e. Ward
Cr., Tahoe City Tributary, South Dollar Cr., Pineland may also be
influenced by Ward Cr., and the Kings Beach site is near an urban inflow).
Upwelling of NO3-N during frequent storms early in this WY may also have
contributed to patterns of biomass observed.
7. The heavy growth of stalked diatoms (Gomphoneis herculeana) at Pineland
in early January was particularly interesting. This early heavy growth may
have been caused by a combination of factors. Of particular note during this
period, surface runoff and subsurface inputs of nutrients associated with the
wet storms in October and Dec. may have contributed to the heavy growth.
Upwelling of NO3-N to surface waters during strong fall and early winter
storms may also have contributed to the growth. Other factors may have
contributed as well.

52
References
Goldman, C.R., A.D. Jassby and S.H. Hackley. 1993. Decadal, Interannual, and
seasonal variability in enrichment bioassays at Lake Tahoe, California-Nevada, USA.
Can. J. Fish. Aquat. Sci. 50(7): 1489-1496.
Hackley, S. H., Allen, B.C., Hunter, D.A., and J.E. Reuter. 2004. Lake Tahoe water
quality investigations: algal bioassay, phytoplankton, atmospheric nutrient deposition,
periphyton. Final report submitted to State Water Resources Control Board,
Lahontan Regional Water Quality Control Board. Tahoe Research Group, University
of California, Davis.
Hackley, S. H., Allen, B.C., Hunter, D.A., and J.E. Reuter. 2007. Lake Tahoe water
quality investigations: algal bioassay, phytoplankton, atmospheric nutrient deposition,
periphyton, Final Report 2004-2007. Submitted to State Water Resources Control
Board, Lahontan Regional Water Quality Control Board. Tahoe Environmental
Research Center, University of California, Davis. 121p.
Hackley, S. H., Allen, B.C., Hunter, D.A., and J.E. Reuter. 2010. Lake Tahoe water
quality investigations: algal bioassay, phytoplankton, atmospheric nutrient deposition,
periphyton, Angora fire water quality monitoring task conclusions. Final Report, July
1, 2007 – June 30, 2010. Submitted to State Water Resources Control Board,
Lahontan Regional Water Quality Control Board. Tahoe Environmental Research
Center, University of California, Davis. 136p.
Hunter, D.A., Goldman, C.R., and E.R. Byron. 1990. Changes in the phytoplankton
community structure in Lake Tahoe, California-Nevada. Verh. Internat. Verein.
Limnol. 24:505-508.
Hunter, D.A., Reuter, J.E., and C.R. Goldman. 1993. Standard Operating Procedures.
In: Lake Tahoe Interagency Monitoring Program, U.C. Davis.
Janik, M., Byron, E., Hunter, D., and Reuter J.E. 1990. Lake Tahoe Interagency
Monitoring Program: Quality Assurance Manual, 2nd
Edition. Division of
Environmental Studies, Univ. of California, Davis. 75 p.
Winder, M., Reuter, J.E., and Schladow, S.G. 2009. Lake warming favors small-sized
planktonic diatom species. Proc. R. Soc. B. 276, 427-435.

53
Appendix Table 1a. Precipitation amounts, N and P concentrations in wet deposition at the Ward Valley Lake Level Station 6/9/10-
9/30/11. Ward Valley Wet Lake Level (Conc.)
Samp. Collection Precip. Precip. Collector Wet Bkt NO3-N NH4-N TKN SRP DP TP
No. Date-Time (in) Form Type Amt. (in) (µg/l) (µg/l) (µg/l) (µg/l) (µg/l) (µg/l) Notes
6/9/10 17:45 0.43 R W 0.43 48.89 19.8 185.03 1.14 5.01 5.01
6/26/10 20:35 0.14 R W 0.14 344.13 152.72 283.23 0.46 1.25 188.88
1 8/3/10 10:25 0.01 R W 0.01 53.16 5.69 78.18 0.91 2.48 5.28 1
2 8/10/10 16:30 0.91 R+H W 0.91 209.95 261.99 506.54 4.08 6.62 20.61 2
3 8/30/10 16:50 0.08 R W 0.08 42.75 48.34 42.97 4.76 8.39 12.42 3
10/3/10 16:45 NA R D NA
4 10/4/10 09:20 0.70 R+DF W+D 0.70 254.37 365.88 459.83 2.71 1.87 3.41 18
5 10/5/10 16:15 0.60 R+S+DF W+D 0.60 96.75 69.59 110.55 4.06 5.55 13.82 19
6 10/8/10 11:20 0.16 R+DF W+D 0.16 259.05 353.13 626.79 5.65 9.26 36.44 19
7 10/19/10 14:35 0.46 R+DF W+D 0.46 68.35 155.25 189.58 3.61 4.03 4.98 20
8 10/25/10 17:20 7.21 RS W 7.21 16.95 46.34 119.36 2.47 6.78 8.94 21
9 11/2/10 10:25 0.11 R W 0.11 17.28 22.39 52.23 2.92 6.47 6.47 22
10 11/9/10 10:35 1.87 RS W 1.87 29.44 36.80 274.61 0.45 3.25 4.00 23
11 11/15/10 16:50 0.40 W 0.40 47.5 77.52 189.56 0.90 4.38 6.57
12 11/21/10 17:45 2.02+ S W 2.02 60.44 81.62 105.89 2.04 4.69 7.2 24
13 11/22/10 17:30 0.47+ S W 0.47 21.25 24.86 51.56 0.68 4.38 5.94
14 11/23/10 19:10 1.00 S W 1.00 18.33 18.23 27.57 0.68 4.38 5.01 25
15 11/28/10 13:00 0.97 S W 0.97 19.69 20.17 28.47 0.45 4.07 5.94 26
16 12/6/10 17:15 2.38 RS W 2.38 48.15 9.36 28.1 1.57 8.00 8.51
17 12/16/10 10:50 3.39 RS W 3.39 24.39 7.28 13.45 1.13 NA 3.7 27
18 12/19/10 15:40 7.40 RS W 7.40 28.17 8.20 7.55 1.35 3.39 2.77 28
19 12/20/10 13:10 0.66 S+DF W 0.66 43.43 16.19 53.96 2.25 3.70 6.16 29
20 12/22/10 11:00 0.21 S+DF W 0.21 157.19 30
21 12/28/10 10:30 0.51 RS W 0.51 22.56 14.09 127.44 1.13 3.08 6.78 31
22 12/29/10 14:40 1.70 S W 1.70 10.00 5.88 85.12 0 4.59 5.19 32
23 1/6/11 11:35 0.52 S W 0.52 19.22 12.24 24.79 2.93 4.01 4.94

54
Ward Valley Wet Lake Level (Conc.)
Samp. Collection Precip. Precip. Collector Wet Bkt NO3-N NH4-N TKN SRP DP TP
No. Date-Time (in) Form Type Amt.(in) (µg/l) (µg/l) (µg/l) (µg/l) (µg/l) (µg/l) Notes
24 1/14/11 11:10 0.35 RS W 0.35 9.68 10.49 79.35 1.36 4.04 16.76
25 2/3/11 10:30 0.49 S W 0.49 19.83 9.82 36.34 1.45 4.01 5.86
26 2/16/11 16:00 1.43 S W 1.43 46 79.48 164.64 1.81 2.05 8.18 47
27 2/17/11 12:10 0.66 S W 0.66 21.85 21.84 33.85 0.91 1.43 4.09 48
28 2/18/11 11:40 1.17+ S W 1.17 11.7 21.43 24.78 0.9 1.11 3.46 49
29 2/19/11 14:30 1.16 S W 1.17 36.64 13.84 36.34 1.13 1.11 4.09 50
30 2/26/11 11:30 2.40e S W 1.13+ 28.95 17.22 32.98 .68 .8 5.03 54
31 3/4/11 18:45 1.64 RS W 1.64 39.68 53.91 116.96 1.82 4.04 4.67
32 3/9/11 10:00 2.22 RS W 2.22 22.65 23.30 97.17 1.59 4.67 5.91
33 3/16/11 13:05 5.69 RS W 5.69 33.68 33.81 54.26 1.36 4.03 3.41 55
35 3/19/11 11:35 1.71 S W 1.71 37.44 52.54 95.71 3.4 4.96 7.44 56
36 3/20/11 16:50 1.48 S W 1.48 11.89 7.59 42.04 2.27 3.72 4.65 57
37 3/24/11 11:00 1.01 S W 1.01 45.56 44.99 82.63 1 4.34 10.54 58
36 3/25/11 14:15 1.27+ S W 1.27 15.45 17.12 41.14 0.77 4.65 33.80 59
37 4/1/11 10:35 0.72 S W 0.72 20.72 34.67 78.12 0.77 2.16 7.73
38 4/13/11 09:50 0.89 S W 0.89 131.83 NA 340.3 8.63 13.66 26.08
39 4/22/11 13:35 1.98 RS W 1.98 91.53 183.35 246.8 3.86 7.12 12.7 67
40 4/25/11 13:05 0.88 RS W 0.88 78.3 226.12 204.65 2.72 5.89 7.74
41 5/16/11 17:10 1.28 RS W 1.28 81.04 125.1 131.9 4.07 8.92 13.22
42 5/20/11 11:20 0.88 RSG W 0.88 55.19 55.10 67.57 4.08 6.26 8.45
43 5/28/11 11:00 0.70 S W 0.70 187.22 327.99 344.02 8.19 13.46 21.28
44 5/31/11 15:45 0.69 S W 0.69 33.67 52.53 56.29 2.49 3.27 4.2
45 6/3/11 11:30 0.29 RS W 0.29 97.1 146.31 118.79 4.55 4.04 5.6
46 6/10/11 11:30 1.60 RS W 1.69 23.21 34.34 68.75 2.94 3.42 3.42
47 7/6/11 17:15 0.02+ R W 0.02+ 19.32 44.07 235.56 8.19 5.52 9.2 68
48 7/6/11 20:20 0.03 R W 0.03 39.80 44.28 294.22 5.46 6.19 17.94 80
49 9/12/11 08:00 0.26 R W 0.26 220.04 NA NA 19.62 25.83 39.98 81
50 9/13/11 11:40 0.15e R W 0.15e 201.21 322.59 NA 9.81 14.15 15.38 82
9/20/11 10:30 T NA W 0 NA NA NA NA NA NA 83

55
Appendix Table 1.b. Precipitation loads of N and P in wet deposition at the Ward Valley Lake Level Station 6/9/10-9/30/11.
Ward Valley Wet Lake Level (Load)
Samp. Collection Precip. Precip. Collector Wet Bkt NO3-N NH4-N TKN SRP DP TP
No. Date-Time (in) Form Type Amt. (in) (g/ha) (g/ha) (g/ha) (g/ha) (g/ha) (g/ha) Notes
6/9/10 17:45 0.43 R W 0.43 5.34 2.16 20.21 0.12 0.55 0.55
6/26/10 20:35 0.14 R W 0.14 12.24 5.43 10.07 0.02 0.04 6.72
1 8/3/10 10:25 0.01 R W 0.01 4.14 0.44 6.10 0.07 0.19 0.41 1
2 8/10/10 16:30 0.91 R+H W 0.91 48.53 60.56 117.08 0.94 1.53 4.76 2
3 8/30/10 16:50 0.08 R W 0.08 3.33 3.77 3.35 0.37 0.65 0.97 3
10/3/10 16:45 NA R D NA NA NA NA NA NA NA
4 10/4/10 09:20 0.70 R+DF W+D 0.70 45.23 65.05 81.76 0.48 0.33 0.61 18
5 10/5/10 16:15 0.60 R+S+DF W+D 0.60 14.74 10.61 16.85 0.62 0.85 2.11 19
6 10/8/10 11:20 0.16 R+DF W+D 0.16 10.53 14.35 25.47 0.23 0.38 1.48 19
7 10/19/10 14:35 0.46 R+DF W+D 0.46 7.99 18.14 22.15 0.42 0.47 0.58 20
8 10/25/10 17:20 7.21 RS W 7.21 31.04 84.86 218.59 4.52 12.42 16.37 21
9 11/2/10 10:25 0.11 R W 0.11 1.36 1.76 4.11 0.23 0.51 0.51 22
10 11/9/10 10:35 1.87 RS W 1.87 13.98 17.48 130.43 0.21 1.54 1.90 23
11 11/15/10 16:50 0.40 W 0.40 4.83 7.88 19.26 0.09 0.45 0.67
12 11/21/10 17:45 2.02+ S W 2.02 31.01 41.88 54.33 1.05 2.41 3.69 24
13 11/22/10 17:30 0.47+ S W 0.47 2.54 2.97 6.16 0.08 0.52 0.71
14 11/23/10 19:10 1.00 S W 1.00 4.66 4.63 7.00 0.17 1.11 1.27 25
15 11/28/10 13:00 0.97 S W 0.97 4.85 4.97 7.01 0.11 1.00 1.46 26
16 12/6/10 17:15 2.38 RS W 2.38 29.11 5.66 16.99 0.95 4.84 5.14
17 12/16/10 10:50 3.39 RS W 3.39 21.00 6.27 11.58 0.97 NA 3.19 27
18 12/19/10 15:40 7.40 RS W 7.40 52.95 15.41 14.19 2.54 6.37 5.21 28
19 12/20/10 13:10 0.66 S+DF W 0.66 7.28 2.71 9.05 0.38 0.62 1.03 29
20 12/22/10 11:00 0.21 S+DF W 0.21 3.14 1.66 8.38 0.16 0.28 0.35 30
21 12/28/10 10:30 0.51 RS W 0.51 2.92 1.83 16.51 0.15 0.40 0.88 31
22 12/29/10 14:40 1.70 S W 1.70 4.32 2.54 36.75 0.00 1.98 2.24 32
23 1/6/11 11:35 0.52 S W 0.52 2.54 1.62 3.27 0.39 0.53 0.65

56
Ward Valley Wet Lake Level (Load)
Samp. Collection Precip. Precip. Collector Wet Bkt NO3-N NH4-N TKN SRP DP TP
No. Date-Time (in) Form Type Amt. (in) (g/ha) (g/ha) (g/ha) (g/ha) (g/ha) (g/ha) Notes
24 1/14/11 11:10 0.35 RS W 0.35 0.86 0.93 7.05 0.12 0.36 1.49
25 2/3/11 10:30 0.49 S W 0.49 2.47 1.22 4.52 0.18 0.50 0.73
26 2/16/11 16:00 1.43 S W 1.43 16.71 28.87 59.80 0.66 0.74 2.97 47
27 2/17/11 12:10 0.66 S W 0.66 3.66 3.66 5.67 0.15 0.24 0.69 48
28 2/18/11 11:40 1.17+ S W 1.17 3.48 6.37 7.36 0.27 0.33 1.03 49
29 2/19/11 14:30 1.16 S W 1.17 10.80 4.08 10.71 0.33 0.33 1.21 50
30 2/26/11 11:30 2.40e S W 1.13+ 8.31 4.94 9.47 0.20 0.23 1.44 54
31 3/4/11 18:45 1.64 RS W 1.64 16.53 22.46 48.72 0.76 1.68 1.95
32 3/9/11 10:00 2.22 RS W 2.22 12.77 13.14 54.79 0.90 2.63 3.33
33 3/16/11 13:05 5.69 RS W 5.69 48.68 48.86 78.42 1.97 5.82 4.93 55
35 3/19/11 11:35 1.71 S W 1.71 16.26 22.82 41.57 1.48 2.15 3.23 56
36 3/20/11 16:50 1.48 S W 1.48 4.47 2.85 15.80 0.85 1.40 1.75 57
37 3/24/11 11:00 1.01 S W 1.01 11.69 11.54 21.20 0.26 1.11 2.70 58
36 3/25/11 14:15 1.27+ S W 1.27 4.98 5.52 13.27 0.25 1.50 10.90 59
37 4/1/11 10:35 0.72 S W 0.72 3.79 6.34 14.29 0.14 0.40 1.41
38 4/13/11 09:50 0.89 S W 0.89 29.80 NA 76.93 1.95 3.09 5.90
39 4/22/11 13:35 1.98 RS W 1.98 46.03 92.21 124.12 1.94 3.58 6.39 67
40 4/25/11 13:05 0.88 RS W 0.88 17.50 50.54 45.74 0.61 1.32 1.73
41 5/16/11 17:10 1.28 RS W 1.28 26.35 40.67 42.88 1.32 2.90 4.30
42 5/20/11 11:20 0.88 RSG W 0.88 12.34 12.32 15.10 0.91 1.40 1.89
43 5/28/11 11:00 0.70 S W 0.70 33.29 58.32 61.17 1.46 2.39 3.78
44 5/31/11 15:45 0.69 S W 0.69 5.90 9.21 9.87 0.44 0.57 0.74
45 6/3/11 11:30 0.29 RS W 0.29 7.15 10.78 8.75 0.34 0.30 0.41
46 6/10/11 11:30 1.60 RS W 1.69 9.43 13.96 27.94 1.19 1.39 1.39
47 7/6/11 17:15 0.02+ R W 0.02+ 1.51 3.44 NA 0.64 0.43 0.72 68
48 7/6/11 20:20 0.03 R W 0.03 3.10 3.45 22.94 0.43 0.48 1.40 80
49 9/12/11 08:00 0.26 R W 0.26 14.53 17.94 NA 1.30 1.71 2.64 81
50 9/13/11 11:40 0.15e R W 0.15e 7.67 12.29 16.66 0.37 0.54 0.59 82
9/20/11 10:30 T NA W T NA NA NA NA NA NA 83

57
Appendix Table 2.a. N and P concentrations in dry deposition at the Ward Valley Lake Level Station 5/15/10-10/4/11. Ward Valley Dry Lake Level Conc.
Samp. Start Collection Vol. Precip. Collector NO3-N NH4-N TKN SRP DP TP
No. Date-Time Date-Time Liters Form Type (µg/l) (µg/l) (µg/l) (µg/l) (µg/l) (µg/l) Notes
5/15/10 17:00 6/1/10 17:10 3.179 DF DRY 34.08 26.5 120.1 1.83 3.99 13.59 x
6/1/10 17:10 6/26/10 20:35 0.993 DF DRY 13.15c NA 3796.15c 24.98c 53.09c NA z
1 6/26/10 20:35 7/2/10 10:40 3.030 DF DRY 22.20 71.04 1510.26 5.27 7.18 18.82
2 7/2/10 10:40 7/16/10 10:30 1.918 DF DRY 13.78c 10.7c 1230.5c 31.81c 46.88c 135.36c 4
3 7/16/10 10:30 7/23/10 13:55 2.664 DF DRY 10.88 8.07 823.56 5.39 8.07 22.97 5
4 7/23/10 13:55 8/3/10 10:25 2.295 DF DRY 13.51 8.24 55.88 2.05 5.58 64.95 15
5 7/23/10 13:55 8/12/10 12:00 2.810 DF DRY 26.38 6.06 287.36 2.26 2.26 24.04 6
6 8/16/10 14:00 9/2/10 16:55 1.576 DF DRY 14.02c 8.41c 2974.7c 2.95c 7.14c 99.71c 7
7 9/2/10 16:55 9/23/10 10:40 1.755 DF DRY 4.24c 19.39c 1405.06c 6.57c 13.58c 172.05c 8
8 9/23/10 10:40 10/14/10 14:45 5.342 R+S+DF DRY 11.06 7.23 804.45 2.93 7.41 31.19 33
9 10/14/10 14:45 10/22/10 14:40 3.626 DF DRY 25.03 29.91 381.72 4.05 5.89 7.78 34
10 10/22/10 14:40 11/2/10 10:25 3.764 DF DRY 2.98 5.81 484.61 5.84 6.47 23.12 35
11 11/2/10 10:25 11/17/10 10:45 3.744 DF DRY 18.06 57.68 345.77 6.78 8.81 10.01 36
12 11/17/10 10:45 12/1/10 16:45 4.025 S+DF DRY 42.51 62.41 276.55 4.72 4.61 9.53 37
13 12/1/10 16:45 12/22/10 11:00 4.079 R+S+DF DRY 21.91 17.88 86.82 2.7 4.01 21.88 38
14 12/22/10 11:00 1/6/10 11:35 4.400 S+DF DRY 12.36 17.75 18.18 2.93 5.55 12.34 39
15 1/6/10 11:35 1/14/11 11:10 3.375+ DF DRY 21.03 40.86 71.91 1.36 3.72 4.97 60
16 1/14/11 11:10 1/24/11 11:45 2.880 DF DRY 13.81 26.89 97.89 4.31 5.59 23.28
17 1/24/11 11:45 2/13/11 10:45 1.968 DF DRY 27.73 19.3 166.44 6.8 9.86 96.6 61
18 2/13/11 10:45 3/4/11 18:45 2.975 DF DRY 48.2 8.42 132.7 1.59 4.04 18.67
19 3/4/11 18:45 3/18/11 16:00 2.877 DF DRY 34.87 29.33 143.98 5.45 7.44 17.68
20 3/18/11 16:00 4/13/11 09:50 1.670 DF DRY 96.17 54.58 190.39 1.36 4.97 48.12
21 4/13/11 09:50 4/25/11 13:05 2.972 DF DRY 47.49 57.25 115.62 1.59 5.27 11.15
22 4/25/11 13:05 5/16/11 17:10 0.500 DF DRY NAc NAc NAc NAc NAc NAc 69
23 5/16/11 17:10 6/15/11 17:00 DF DRY 5.47c 8.31c 3312.46c 18.62c 63.81c 411.45c y
24 6/15/11 17:00 6/30/11 16:10 3.345 DF DRY 29.27c 7.78c NAc 2.52c 51.8c 122.3c 70
25 6/30/11 16:10 7/22/11 17:45 0.902 DF DRY 14.84c 20.72c 3189c 35.36c 102.24c 384.05c 84

58
Ward Valley Dry Lake Level Conc.
Samp. Start Collection Vol. Precip. Collector NO3-N NH4-N TKN SRP DP TP
No. Date-Time Date-Time Liters Form Type (µg/l) (µg/l) (µg/l) (µg/l) (µg/l) (µg/l) Notes
26 7/22/11 17:45 8/4/11 14:45 2.400 DF DRY 14.22 10.75 661.8 4.89 9.86 53.9 85
27 8/4/11 14:45 8/22/11 17:45 1.822 DF DRY 12.38 3.37 828.32 2.72 17.59 54.63 86
28 8/22/11 17:45 9/12/11 08:00 2.288 DF+R DRY-BULK 63.25 10.14 1202.87 4.56 7.69 42.75 87
29 9/12/11 08:00 9/20/11 10:30 3.550 DF+R DRY-BULK 28.3 4.58 377.94 1.59 2.39 8.58 88
30 9/20/11 10:30 10/4/11 16:00 2.910 DF+R DRY-BULK NA NA 640.22 NA NA NA 89
Appendix Table 2.b. N and P loads in dry deposition at the Ward Valley Lake Level Station 5/15/10-10/4/11. Ward Valley Dry Lake Level Conc.
Samp. Start Collection Vol. Precip. Collector NO3-N NH4-N TKN SRP DP TP
No. Date-Time Date-Time Liters Form Type (g/ha) (g/ha) (g/ha) (g/ha) (g/ha) (g/ha) Notes
5/15/10 17:00 6/1/10 17:10 3.179 DF 21.38 16.63 75.35 1.15 2.50 8.53 x
6/1/10 17:10 6/26/10 20:35 0.993 DF C C C C C C z
1 6/26/10 20:35 7/2/10 10:40 3.030 DF DRY 13.28 42.48 903.10 3.15 4.29 11.25
2 7/2/10 10:40 7/16/10 10:30 1.918 DF DRY C C C C C C 4
3 7/16/10 10:30 7/23/10 13:55 2.664 DF DRY 5.72 4.24 432.98 2.83 4.24 12.08 5
4 7/23/10 13:55 8/3/10 10:25 2.295 DF DRY 6.12 3.73 25.31 0.93 2.53 29.42 15
5 7/23/10 13:55 8/12/10 12:00 2.810 DF DRY 14.63 3.36 159.36 1.25 1.25 13.33 6
6 8/16/10 14:00 9/2/10 16:55 1.576 DF DRY C C C C C C 7
7 9/2/10 16:55 9/23/10 10:40 1.755 DF DRY C C C C C C 8
8 9/23/10 10:40 10/14/10 14:45 5.342 R+S+DF DRY C C C C C C 33V
9 10/14/10 14:45 10/22/10 14:40 3.626 DF DRY 9.93 3.26 251.01 2.48 3.74 4.99 34,w
10 10/22/10 14:40 11/2/10 10:25 3.764 DF DRY 2.21 4.32 359.99 4.34 4.81 17.17 35
11 11/2/10 10:25 11/17/10 10:45 3.744 DF DRY 13.34 42.62 255.49 5.01 6.51 7.40 36
12 11/17/10 10:45 12/1/10 16:45 4.025 S+DF DRY 33.77 49.58 219.68 3.75 3.66 7.57 37
13 12/1/10 16:45 12/22/10 11:00 4.079 R+S+DF DRY 17.64 14.39 69.89 2.17 3.23 17.61 38
14 12/22/10 11:00 1/6/10 11:35 4.400 S+DF DRY 10.73 15.41 15.79 2.54 4.82 10.72 39
15 1/6/10 11:35 1/14/11 11:10 3.375+ DF DRY 14.01 27.22 47.90 0.91 2.48 3.31 60
16 1/14/11 11:10 1/24/11 11:45 2.880 DF DRY 7.85 15.28 55.64 2.45 3.18 13.23

59
Ward Valley Dry Lake Level Conc.
Samp. Start Collection Vol. Precip. Collector NO3-N NH4-N TKN SRP DP TP
No. Date-Time Date-Time Liters Form Type (g/ha) (g/ha) (g/ha) (g/ha) (g/ha) (g/ha) Notes
17 1/24/11 11:45 2/13/11 10:45 1.968 DF DRY 10.77 7.50 64.64 2.64 3.83 37.52 61
18 2/13/11 10:45 3/4/11 18:45 2.975 DF DRY 28.30 4.94 77.91 0.93 2.37 10.96
19 3/4/11 18:45 3/18/11 16:00 2.877 DF DRY 19.80 16.65 81.75 3.09 4.22 10.04
20 3/18/11 16:00 4/13/11 09:50 1.670 DF DRY 31.70 17.99 62.75 0.45 1.64 15.86
21 4/13/11 09:50 4/25/11 13:05 2.972 DF DRY 27.85 33.58 67.81 0.93 3.09 6.54
22 4/25/11 13:05 5/16/11 17:10 0.500 DF DRY C C C C C C 69
23 5/16/11 17:10 6/15/11 17:00 DF DRY C C C C C C y
24 6/15/11 17:00 6/30/11 16:10 3.345 DF DRY C C C C C C 70
25 6/30/11 16:10 7/22/11 17:45 0.902 DF DRY C C C C C C 84
26 7/22/11 17:45 8/4/11 14:45 2.400 DF DRY 6.74 5.09 313.46 2.32 4.67 25.53 85
27 8/4/11 14:45 8/22/11 17:45 1.822 DF DRY 4.45 1.21 297.84 0.98 6.32 19.64 86
28 8/22/11 17:45 9/12/11 08:00 2.288 DF+R DRY-BULK 30.04 4.82 571.36 2.17 3.65 20.31 87
29 9/12/11 08:00 9/20/11 10:30 3.550 DF+R DRY-BULK 19.83 3.21 264.79 1.11 1.67 6.01 88
30 9/20/11 10:30 10/4/11 16:00 2.910 DF+R DRY-BULK NA NA 386.77 NA NA NA 89
Appendix Table 2.c. N and P loading per day in dry deposition at the Ward Valley Lake Level Station 5/15/10-10/4/11. Ward Valley Dry Lake Level (Load/day)
Samp. Start Collection Vol. Precip. Collector NO3-N NH4-N TKN SRP DP TP
No. Date-Time Date-Time Liters Form Type (g/ha/d) (g/ha/d) (g/ha/d) (g/ha/d) (g/ha/d) (g/ha/d) Notes
5/15/10 17:00 6/1/10 17:10 3.179 DF 1.26 0.98 4.43 0.07 0.15 0.50 x
6/1/10 17:10 6/26/10 20:35 0.993 DF C C C C C C z
1 6/26/10 20:35 7/2/10 10:40 3.030 DF DRY 2.38 7.60 161.65 0.56 0.77 2.01
2 7/2/10 10:40 7/16/10 10:30 1.918 DF DRY C C C C C C 4
3 7/16/10 10:30 7/23/10 13:55 2.664 DF DRY 0.80 0.59 60.62 0.40 0.59 1.69 5
4 7/23/10 13:55 8/3/10 10:25 2.295 DF DRY 0.56 0.34 2.33 0.09 0.23 2.71 15
5 7/23/10 13:55 8/12/10 12:00 2.810 DF DRY 1.61 0.37 17.58 0.14 0.14 1.47 6
6 8/16/10 14:00 9/2/10 16:55 1.576 DF DRY C C C C C C 7
7 9/2/10 16:55 9/23/10 10:40 1.755 DF DRY C C C C C C 8

60
Ward Valley Dry Lake Level (Load/day)
Samp. Start Collection Vol. Precip. Collector NO3-N NH4-N TKN SRP DP TP
No. Date-Time Date-Time Liters Form Type (g/ha/d) (g/ha/d) (g/ha/d) (g/ha/d) (g/ha/d) (g/ha/d) Notes
8 9/23/10 10:40 10/14/10 14:45 5.342 R+S+DF DRY C C C C C C 33,v
9 10/14/10 14:45 10/22/10 14:40 3.626 DF DRY 1.24 0.41 31.39 0.31 0.47 0.62 34,w
10 10/22/10 14:40 11/2/10 10:25 3.764 DF DRY 0.20 0.40 33.26 0.40 0.44 1.59 35
11 11/2/10 10:25 11/17/10 10:45 3.744 DF DRY 0.89 2.84 17.02 0.33 0.43 0.49 36
12 11/17/10 10:45 12/1/10 16:45 4.025 S+DF DRY 2.37 3.48 15.42 0.26 0.26 0.53 37
13 12/1/10 16:45 12/22/10 11:00 4.079 R+S+DF DRY 0.85 0.69 3.37 0.10 0.16 0.85 38
14 12/22/10 11:00 1/6/10 11:35 4.400 S+DF DRY 0.71 1.03 1.05 0.17 0.32 0.71 39
15 1/6/10 11:35 1/14/11 11:10 3.375+ DF DRY 1.75 3.41 6.00 0.11 0.31 0.41 60
16 1/14/11 11:10 1/24/11 11:45 2.880 DF DRY 0.78 1.52 5.55 0.24 0.32 1.32
17 1/24/11 11:45 2/13/11 10:45 1.968 DF DRY 0.54 0.38 3.24 0.13 0.19 1.88 61
18 2/13/11 10:45 3/4/11 18:45 2.975 DF DRY 1.46 0.26 4.03 0.05 0.12 0.57
19 3/4/11 18:45 3/18/11 16:00 2.877 DF DRY 1.43 1.20 5.89 0.22 0.30 0.72
20 3/18/11 16:00 4/13/11 09:50 1.670 DF DRY 1.23 0.70 2.44 0.02 0.06 0.62
21 4/13/11 09:50 4/25/11 13:05 2.972 DF DRY 2.30 2.77 5.59 0.08 0.25 0.54
22 4/25/11 13:05 5/16/11 17:10 0.500 DF DRY C C C C C C 69
23 5/16/11 17:10 6/15/11 17:00 DF DRY C C C C C C y
24 6/15/11 17:00 6/30/11 16:10 3.345 DF DRY C C C C C C 70
25 6/30/11 16:10 7/22/11 17:45 0.902 DF DRY C C C C C C 84
26 7/22/11 17:45 8/4/11 14:45 2.400 DF DRY 0.52 0.40 24.35 0.18 0.36 1.98 85
27 8/4/11 14:45 8/22/11 17:45 1.822 DF DRY 0.25 0.07 16.43 0.05 0.35 1.08 86
28 8/22/11 17:45 9/12/11 08:00 2.288 DF+R DRY-BULK 1.46 0.23 27.74 0.11 0.18 0.99 87
29 9/12/11 08:00 9/20/11 10:30 3.550 DF+R DRY-BULK 2.45 0.40 32.67 0.14 0.21 0.74 88
30 9/20/11 10:30 10/4/11 16:00 2.910 DF+R DRY-BULK NA NA 27.18 NA NA NA 89

61
Appendix Table 3.a. Precipitation amounts, N and P concentrations in bulk deposition collected in Snow Tube collector at the Mid-
lake Buoy (TB-1) Station 6/3/10-9/30/11. Mid-lake (TB-1) Snow Tube (Conc.)
Start Collection Precip. Precip. Collector NO3-N NH4-N TKN SRP DP TP
No. Date-Time Date-Time (in.) Form Type (µg/l) (µg/l) (µg/l) (µg/l) (µg/l) (µg/l) Notes
1 6/3/10 09:37 7/2/10 08:05 0.04 R ST 147.95c 532.83c 2693.31c 96.95c 30.29c 163.1c 10
2 7/2/10 08:05 7/20/10 10:35 0.01 R ST 32.82c 25.07c 428.97c 45.58c 51.54c 67.06c 11
7/20/10 10:35 8/3/10 09:30 0 ST
3 8/3/10 09:30 8/12/10 09:50 0.08 R ST 183.27 19.63 764.58 4.54 12.53 68.51 12
8/12/10 09:50 8/31/10 10:30 0 ST
8/31/10 10:30 9/9/10 09:40 T R ST
9/9/10 09:40 9/22/10 09:15 0 ST
4 9/22/10 09:15 10/13/10 09:40 1.67 R ST 495.6 527.03 939.81 39.53 47.86 82.75 40
5 10/13/10 09:40 10/20/10 15:24 0.36+ R ST 127.14 138.78 137 5.85 8.68 12.14 41
6 10/20/10 15:24 11/9/10 09:02 0.07 R+S ST 21.13 12.85 653.13 0.45 2.79 3.41 42
11/9/10 09:02 11/17/10 07:25 NA NA NA NA NA NA NA NA NA 43
11/17/10 07:25 12/1/10 10:45 NA NA NA NA NA NA NA NA NA 44
12/1/10 10:45 12/15/10 13:50 NA NA NA NA NA NA NA NA NA 45
7 12/15/10 13:50 1/4/11 09:57 2.73+ R+S ST 44.33 19.66 63.54 2.03 4.01 5.86 46
8 1/4/11 09:57 2/11/11 11:07 0.14 RS ST 50.44 7.18 164.64 1.13 3.7 6.47 62
2/11/11 11:07 3/1/11 08:30 NA ST NA NA NA NA NA NA 63
9 3/1/11 08:30 3/28/11 09:55 2.89 RS ST 53.81 45.43 153.45 0.55 2.47 4.02 64
3/28/11 09:55 4/22/11 10:15 NA ST NA NA NA NA NA NA 71
10 4/22/11 10:15 6/7/11 14:35 2.36+ RS ST 129.47 160.09 386.83 3.63 4.04 9.64 72
11 6/7/11 14:35 7/2/11 12:25 0.30 RS ST NAc NAc NAc NAc NAc NAc 73
12 7/2/11 12:25 7/23/11 11:22 0.29 R ST 99.73c 219.31c 571.95c 10.88c 19.71c 73.61c 90
7/23/11 11:22 8/4/11 11:10 0 ST NA NA NA NA NA NA
8/4/11 11:10 8/26/11 10:30 0 ST NA NA NA NA NA NA
8/26/11 10:30 9/8/11 10:02 0 ST NA NA NA NA NA NA
13 9/8/11 10:02 9/21/11 09:13 0.03 R ST 147.03 109.16 312.58 7.52 13.23 24.3 91

62
Appendix Table 3.b. Precipitation amounts, N and P loads in bulk deposition collected in Snow Tube collector at the Mid-lake Buoy
(TB-1) Station 6/3/10-9/30/11. Mid-lake (TB-1) Snow Tube (Conc.)
Start Collection Precip. Precip. Collector NO3-N NH4-N TKN SRP DP TP
No. Date-Time Date-Time (in.) Form Type (g/ha) (g/ha) (g/ha) (g/ha) (g/ha) (g/ha) Notes
1 6/3/10 09:37 7/2/10 08:05 0.04 R ST C C C C C C 10
2 7/2/10 08:05 7/20/10 10:35 0.01 R ST C C C C C C 11
7/20/10 10:35 8/3/10 09:30 0 ST
3 8/3/10 09:30 8/12/10 09:50 0.08 R ST 28.25 3.03 117.84 0.70 1.93 10.56 12
8/12/10 09:50 8/31/10 10:30 0 ST
8/31/10 10:30 9/9/10 09:40 T R ST
9/9/10 09:40 9/22/10 09:15 0 ST
4 9/22/10 09:15 10/13/10 09:40 1.67 R ST 210.22 223.56 398.65 16.77 20.30 35.10 40
5 10/13/10 09:40 10/20/10 15:24 0.36+ R ST 24.75+ 27.01+ 26.67+ 1.14+ 1.34+ 2.36+ 41
6 10/20/10 15:24 11/9/10 09:02 0.07 R+S ST 3.26 1.98 100.66 0.07 0.43 0.53 42
11/9/10 09:02 11/17/10 07:25 NA NA NA 43
11/17/10 07:25 12/1/10 10:45 NA NA NA 44
12/1/10 10:45 12/15/10 13:50 NA NA NA 45
7 12/15/10 13:50 1/4/11 09:57 2.73+ R+S ST 30.74+ 13.63+ 44.06+ 1.41+ 2.78+ 4.06+ 46
8 1/4/11 09:57 2/11/11 11:07 0.14 RS ST 7.77 1.11 25.38 0.17 0.57 1.00 62
2/11/11 11:07 3/1/11 08:30 NA ST 63
9 3/1/11 08:30 3/28/11 09:55 2.89 RS ST 39.50 33.35 112.64 0.40 1.81 2.95 64
3/28/11 09:55 4/22/11 10:15 NA ST 71
10 4/22/11 10:15 6/7/11 14:35 2.36+ RS ST 77.61+ 95.96+ 231.88+ 2.18+ 2.42+ 5.78+ 72
11 6/7/11 14:35 7/2/11 12:25 0.30 RS ST C C C C C C 73
12 7/2/11 12:25 7/23/11 11:22 0.29 R ST C C C C C C 90
7/23/11 11:22 8/4/11 11:10 0 ST
8/4/11 11:10 8/26/11 10:30 0 ST
8/26/11 10:30 9/8/11 10:02 0 ST
13 9/8/11 10:02 9/21/11 09:13 0.03 R ST 22.66 16.82 48.18 1.16 2.04 3.75 91

63
Appendix Table 4.a. N and P concentrations in dry-bulk deposition (buoy bucket) at Mid-lake Buoy (TB-1) Station 6/3/10-10/12/11. Mid-lake (TB-1) Dry-Bulk (Conc.)
Samp. Start Collection Vol. Precip. Collector NO3-N NH4-N TKN SRP DP TP
No. Date-Time Date-Time Liters Form Type (µg/l) (µg/l) (µg/l) (µg/l) (µg/l) (µg/l) Notes
1 6/3/10 9:37 7/2/10 8:05 0.5 DF+R DRY-BULK 293.02c 192.92c 2253.81c 21.09c 127.41c NAc 13
2 7/2/10 8:05 7/20/10 10:35 0.5 DF+R DRY-BULK 219.05 26.91 869.67 30.99 38.5 154.92 14
3 7/20/10 10:35 8/3/10 9:30 0.5 DF DRY-BULK 203.42 95.88 234.99 1.82 11.17 45.69 14
4 8/3/10 9:30 8/12/10 9:50 0.365 DF+R DRY-BULK 736.96 927.72 2198.17 6.81 12.53 30.88
5 8/12/10 9:50 8/31/10 10:30 0.5 DF DRY-BULK 243.22 21.01 1155.83 6.58 11.49 40.69 14
6 8/31/10 10:30 9/9/10 9:40 0.5 DF+T DRY-BULK 321.79 666.73 1591.88 10.02 12.42 23.61 16
7 9/9/10 9:40 9/22/10 9:15 0.5 DF DRY-BULK 426.56 801.37 1126.41 1.59 5.25 NA 17
8 9/22/10 09:15 10/13/10 09:40 1.895 DF+R DRY-BULK 387.82 364.87 465.74 11.97 16.67 28.72
9 10/13/10 9:40 10/20/10 15:24 2.192 DF+R DRY-BULK 102.5 172.11 296 2.25 3.72 4.05
10 10/20/10 15:24 11/9/10 9:02 0.47 DF+R+S DRY-BULK 495.74 385.79 1381.38 4.51 11.55 23.85
11 11/9/10 9:02 11/17/10 7:25 1.76 DF+S? DRY-BULK 57.13 29.87 46.34 0.68 4.07 4.07
12 11/17/10 7:25 12/1/10 10:45 0.735 DF+S DRY-BULK 219.71 202.11 343.1 3.15 4.6 8.28
13 12/1/10 10:45 12/15/10 13:50 2.351 DF+R+S DRY-BULK 80.76 18.53 33.5 1.8 2.78 3.08
14 12/15/10 13:50 1/4/11 9:57 0.958 DF+R+S DRY-BULK 89.85 18.6 36.24 1.58 3.39 7.41
15 1/4/11 9:57 2/11/11 11:07 0.275 DF+R+S DRY-BULK 46.34* 463.31* 351.98* 16.77* 18.49* 26.81*
16 2/11/11 11:07 3/1/11 8:30 0.833 S DRY-BULK 118.59 117.88 178.94 2.27 3 10.07
17 3/1/11 8:30 3/28/11 9:55 1.77 DF+R+S DRY-BULK 110.58 98.97 115.56 1.45 4.02 9.28 65
18 3/28/11 9:55 4/22/11 10:15 0.5 DF+R+S DRY-BULK 488.19 554.75 1029.72 10.22 16.42 26.95 74
19 4/22/11 10:15 6/7/11 14:35 2.14 DF+R+S DRY-BULK 169.67* 132.53* 243.32* 14.03* 14.62* 22.08* 75
20 6/7/11 14:35 7/2/11 12:25 0.5 DF+R+S DRY-BULK 188.42 87.14 NA 34.1 61 131.19 76
21 7/2/11 12:25 7/23/11 11:22 0.5 DF+R+S DRY-BULK 128.64 191.46 579.01 31.74 62.83 149.06 92
22 7/23/11 11:22 8/4/11 11:10 0.5 DF DRY-BULK 322.9 376.24 885.8 7.39 25.25 93.01 93
23 8/4/11 11:10 8/26/11 10:30 0.5 DF DRY-BULK NA NA NA NA NA NA 94
24 8/26/11 10:30 9/8/11 10:02 0.5 DF DRY-BULK 226.94 210.64 288.37 3.42 10.15 19.38 95
25 9/8/11 10:02 9/21/11 9:13 0.433 DF+R DRY-BULK 641.91 92.99 NA 4.1 9.23 15.07
26 9/21/11 9:13 10/12/11 15:12 0.5 DF+R+S DRY-BULK 821.95 580.13 NA 5.3 12.36 NA

64
Appendix Table 4.b. N and P loads in dry-bulk deposition (buoy bucket) at the Mid-lake Buoy (TB-1) Station 6/3/10-10/12/11. Mid-lake (TB-1) Dry-Bulk (Conc.)
Samp. Start Collection Vol. Precip. Collector NO3-N NH4-N TKN SRP DP TP
No. Date-Time Date-Time Liters Form Type (g/ha) (g/ha) (g/ha) (g/ha) (g/ha) (g/ha) Notes
1 6/3/10 09:37 7/2/10 08:05 0.500 DF+R DRY-BULK C C C C C C 13
2 7/2/10 08:05 7/20/10 10:35 0.500 DF+R DRY-BULK 21.62 2.66 85.82 3.06 3.80 15.29 14
3 7/20/10 10:35 8/3/10 09:30 0.500 DF DRY-BULK 20.07 9.46 23.19 0.18 1.10 4.51 14
4 8/3/10 09:30 8/12/10 09:50 0.365 DF+R DRY-BULK 53.09 66.83 158.34 0.49 0.90 2.22
5 8/12/10 09:50 8/31/10 10:30 0.500 DF DRY-BULK 24.00 2.07 114.05 0.65 1.13 4.02 14
6 8/31/10 10:30 9/9/10 09:40 0.500 DF+T DRY-BULK 31.75 65.79 157.08 0.99 1.23 2.33 16
7 9/9/10 09:40 9/22/10 09:15 0.500 DF DRY-BULK 42.09 79.08 111.15 0.16 0.52 17
8 9/22/10 09:15 10/13/10 09:40 1.895 DF+R DRY-BULK 145.04 136.46 174.18 4.48 6.23 10.74
9 10/13/10 09:40 10/20/10 15:24 2.192 DF+R DRY-BULK 44.34 74.45 128.05 0.97 1.61 1.75
10 10/20/10 15:24 11/9/10 09:02 0.470 DF+R+S DRY-BULK 45.98 35.78 128.13 0.42 1.07 2.21
11 11/9/10 09:02 11/17/10 07:25 1.760 DF+S? DRY-BULK 19.84 10.38 16.10 0.24 1.41 1.41
12 11/17/10 07:25 12/1/10 10:45 0.735 DF+S DRY-BULK 31.87 29.32 49.77 0.46 0.67 1.20
13 12/1/10 10:45 12/15/10 13:50 2.351 DF+R+S DRY-BULK 37.47 8.60 15.54 0.84 1.29 1.43
14 12/15/10 13:50 1/4/11 09:57 0.958 DF+R+S DRY-BULK 16.99 3.52 6.85 0.30 0.64 1.40
15 1/4/11 09:57 2/11/11 11:07 0.275 DF+R+S DRY-BULK NA NA NA NA NA NA
16 2/11/11 11:07 3/1/11 08:30 0.833 S DRY-BULK 19.50 19.38 29.42 0.37 0.49 1.66
17 3/1/11 08:30 3/28/11 09:55 1.770 DF+R+S DRY-BULK 38.63 34.57 40.37 0.51 1.40 3.24 65
18 3/28/11 09:55 4/22/11 10:15 0.500 DF+R+S DRY-BULK 48.17 54.74 101.61 1.01 1.62 2.66 74
19 4/22/11 10:15 6/7/11 14:35 2.140 DF+R+S DRY-BULK NA NA NA NA NA NA 75
20 6/7/11 14:35 7/2/11 12:25 0.500 DF+R+S DRY-BULK 18.59 8.60 NA 3.36 6.02 12.95 76
21 7/2/11 12:25 7/23/11 11:22 0.500 DF+R+S DRY-BULK 12.69 18.89 57.13 3.13 6.20 14.71 92
22 7/23/11 11:22 8/4/11 11:10 0.500 DF DRY-BULK 31.86 37.13 87.41 0.73 2.49 9.18 93
23 8/4/11 11:10 8/26/11 10:30 0.500 DF DRY-BULK NA NA NA NA NA NA 94
24 8/26/11 10:30 9/8/11 10:02 0.500 DF DRY-BULK 22.39 20.79 28.46 0.34 1.00 1.91 95
25 9/8/11 10:02 9/21/11 09:13 0.433 DF+R DRY-BULK 54.85 7.95 NA 0.35 0.79 1.29
26 9/21/11 9:13 10/12/11 15:12 0.5 DF+R+S DRY-BULK 81.11 57.25 NA 0.52 1.22 NA

65
Appendix Table 4.c. N and P loading per day in dry-bulk deposition (buoy bucket) at Mid-lake Buoy (TB-1) Station 6/3/10-10/12/11. Mid-lake (TB-1) Dry-Bulk (Load/day)
Samp. Start Collection Vol. Precip. Collector NO3-N NH4-N TKN SRP DP TP
No. Date-Time Date-Time Liters Form Type (g/ha/d) (g/ha/d) (g/ha/d) (g/ha/d) (g/ha/d) (g/ha/d) Notes
1 6/3/10 09:37 7/2/10 08:05 0.500 DF+R DRY-BULK C C C C C C 13
2 7/2/10 08:05 7/20/10 10:35 0.500 DF+R DRY-BULK 1.19 0.15 4.74 0.17 0.21 0.84 14
3 7/20/10 10:35 8/3/10 09:30 0.500 DF DRY-BULK 1.44 0.68 1.66 0.01 0.08 0.32 14
4 8/3/10 09:30 8/12/10 09:50 0.365 DF+R DRY-BULK 5.89 7.41 17.57 0.05 0.10 0.25
5 8/12/10 09:50 8/31/10 10:30 0.500 DF DRY-BULK 1.26 0.11 5.99 0.03 0.06 0.21 14
6 8/31/10 10:30 9/9/10 09:40 0.500 DF+T DRY-BULK 3.54 7.34 17.52 0.11 0.14 0.26 16
7 9/9/10 09:40 9/22/10 09:15 0.500 DF DRY-BULK 3.24 6.09 8.56 0.01 0.04 NA 17
8 9/22/10 09:15 10/13/10 09:40 1.895 DF+R DRY-BULK 6.90 6.49 8.29 0.21 0.30 0.51
9 10/13/10 09:40 10/20/10 15:24 2.192 DF+R DRY-BULK 6.13 10.29 17.69 0.13 0.22 0.24
10 10/20/10 15:24 11/9/10 09:02 0.470 DF+R+S DRY-BULK 2.33 1.81 6.49 0.02 0.05 0.11
11 11/9/10 09:02 11/17/10 07:25 1.760 DF+S? DRY-BULK 2.50 1.31 2.03 0.03 0.18 0.18
12 11/17/10 07:25 12/1/10 10:45 0.735 DF+S DRY-BULK 2.25 2.07 3.52 0.03 0.05 0.08
13 12/1/10 10:45 12/15/10 13:50 2.351 DF+R+S DRY-BULK 2.65 0.61 1.10 0.06 0.09 0.10
14 12/15/10 13:50 1/4/11 09:57 0.958 DF+R+S DRY-BULK 0.86 0.18 0.35 0.02 0.03 0.07
15 1/4/11 09:57 2/11/11 11:07 0.275 DF+R+S DRY-BULK NA NA NA NA NA NA
16 2/11/11 11:07 3/1/11 08:30 0.833 S DRY-BULK 1.09 1.08 1.64 0.02 0.03 0.09
17 3/1/11 08:30 3/28/11 09:55 1.770 DF+R+S DRY-BULK 1.43 1.28 1.49 0.02 0.05 0.12 65
18 3/28/11 09:55 4/22/11 10:15 0.500 DF+R+S DRY-BULK 1.93 2.19 4.06 0.04 0.06 0.11 74
19 4/22/11 10:15 6/7/11 14:35 2.140 DF+R+S DRY-BULK NA NA NA NA NA NA 75
20 6/7/11 14:35 7/2/11 12:25 0.500 DF+R+S DRY-BULK 0.75 0.35 NA 0.14 0.24 0.52 76
21 7/2/11 12:25 7/23/11 11:22 0.500 DF+R+S DRY-BULK 0.61 0.90 2.73 0.15 0.30 0.70 92
22 7/23/11 11:22 8/4/11 11:10 0.500 DF DRY-BULK 2.66 3.10 7.29 0.06 0.21 0.77 93
23 8/4/11 11:10 8/26/11 10:30 0.500 DF DRY-BULK NA NA NA NA NA NA 94
24 8/26/11 10:30 9/8/11 10:02 0.500 DF DRY-BULK 1.73 1.60 2.19 0.03 0.08 0.15 95
25 9/8/11 10:02 9/21/11 09:13 0.433 DF+R DRY-BULK 4.23 0.61 NA 0.03 0.06 0.10
26 9/21/11 9:13 10/12/11 15:12 0.5 DF+R+S DRY-BULK 3.82 2.69 NA 0.02 0.06 NA

66
Table 5.a. N and P concentrations in dry-bulk deposition (buoy bucket) at the Northwest Buoy (TB-4) Station 6/3/10-10/12/11. Buoy TB-4 Dry-Bulk (Conc.)
Samp. Start Collection Vol. Precip. Collector NO3-N NH4-N TKN SRP DP TP
No. Date-Time Date-Time Liters Form Type (µg/l) (µg/l) (µg/l) (µg/l) (µg/l) (µg/l) Notes
1 6/3/10 9:18 7/2/10 8:20 0.5 DF+R DRY-BULK 245.89c 38.92c 1610.6c 48.36c 64.64c NAc 13
2 7/2/10 8:20 7/20/10 10:16 0.5 DF+R DRY-BULK 136.72 26.71 544.27 21.78 30.42 69.54 9
3 7/20/10 10:16 8/3/10 9:07 0.5 DF DRY-BULK 190.85 136.16 226.14 1.82 8.37 25.48 14
4 8/3/10 9:07 8/12/10 10:14 0.485 DF+R DRY-BULK 688.84 174.85 2741.74 24.05 27.46 44.25
5 8/12/10 10:14 8/31/10 14:05 0.5 DF DRY-BULK 232.59 16.74 1179.73 5.67 9.32 32.61 14
6 8/31/10 14:05 9/9/10 9:20 0.685 DF+R DRY-BULK 252.43 283.28 1024.42 2.96 5.9 10.56
7 9/9/10 9:20 9/22/10 8:55 0.32 DF DRY-BULK 577.46 613.45 1464.77 3.4 7.1 14.05
8 9/22/10 8:55 10/13/10 9:40 1.232 DF+R DRY-BULK 487.31 530.23 793.13 2.93 10.19 15.75
9 10/13/10 9:40 10/20/10 15:24 2.374 DF+R DRY-BULK 112.36 137.71 204 1.8 2.79 1.71
10 10/20/10 15:24 11/9/10 9:02 0.818 DF+R+S DRY-BULK 303.4 374.61 736.6 1.35 5.4 20.16
11 11/9/10 9:02 11/17/10 7:25 1.515 DF+S? DRY-BULK 70.43 36.2 87.8 0.68 3.39 4.38
12 11/17/10 7:25 12/1/10 10:45 1.131 DF+S DRY-BULK 154.37 158.79 264.28 1.35 3.99 14.73
13 12/1/10 10:45 12/15/10 13:50 2.775 DF+R+S DRY-BULK 57.29 14.78 13.45 1.35 3.08 3.39
14 12/15/10 13:50 1/4/11 9:40 1.35 DF+R+S DRY-BULK 92.98 24.53 134.05 1.35 1.54 3.39
15 1/4/11 9:40 2/11/11 10:46 0.5 DF+R+S DRY-BULK 639.33* 282.57* 453.79* 6.57* 8.32* 28.35* 66
16 2/11/11 10:46 3/1/11 8:48 0.627 S DRY-BULK 142.87 138.84 175.76 2.27 3.31 33.03
17 3/1/11 8:48 3/28/11 9:25 1.828 DF+R+S DRY-BULK 113.54 95.91 143.98 1.68 3.71 9.28
18 3/28/11 9:25 4/22/11 9:19 0.5 DF+R+S DRY-BULK 501.13 716.5 1012.64 11.35 19.2 50.18 77
19 4/22/11 9:19 6/7/11 15:08 1.869 DF+R+S DRY-BULK 158.19* 147.37* 182.69* 11.36* 10.88* 14.62* 78
20 6/7/11 15:08 7/2/11 11:45 0.5 DF+R+S DRY-BULK 169.89 67.6 581.01 16.25 45.67 65.29 79
21 7/2/11 11:45 7/23/11 10:54 0.5 DF+R DRY-BULK 150.7 94.97 569.51 17.01 38.19 109.95 96
22 7/23/11 10:54 8/4/11 10:25 0.5 DF DRY-BULK 253.59 314.9 382.03 6.26 16.01 47.74 97
23 8/4/11 10:25 8/26/11 10:05 0.5 DF DRY-BULK 81.87 79.21 193.49 5.44 9.69 21.9 97
24 8/26/11 10:05 9/8/11 9:19 0.5 DF DRY-BULK 185.54 206.25 478.46 3.88 9.53 24.91 97
25 9/8/11 9:19 9/21/11 9:33 0.5 DF+R DRY-BULK 186.62 250.39 NA 3.64 9.23 12.61 98
26 9/21/11 9:33 10/12/11 15:37 0.5 DF+R+S DRY-BULK 753.99 677.69 NA 2.35 8.03 16.05

67
Appendix Table 5.b. N and P loads in dry-bulk deposition (buoy bucket) at the Northwest Buoy (TB-4) Station 6/3/10-10/12/11. Buoy TB-4 Dry-Bulk (Load)
Samp. Start Collection Vol. Precip. Collector NO3-N NH4-N TKN SRP DP TP
No. Date-Time Date-Time Liters Form Type (g/ha) (g/ha) (g/ha) (g/ha) (g/ha) (g/ha) Notes
1 6/3/10 09:18 7/2/10 08:20 0.500 DF+R DRY-BULK C C C C C C 13
2 7/2/10 08:20 7/20/10 10:16 0.500 DF+R DRY-BULK 13.49 2.64 53.71 2.15 3.00 6.86 9
3 7/20/10 10:16 8/3/10 09:07 0.500 DF DRY-BULK 18.83 13.44 22.31 0.18 0.83 2.51 14
4 8/3/10 09:07 8/12/10 10:14 0.485 DF+R DRY-BULK 65.93 16.74 262.43 2.30 2.63 4.24
5 8/12/10 10:14 8/31/10 14:05 0.500 DF DRY-BULK 22.95 1.65 116.41 0.56 0.92 3.22 14
6 8/31/10 14:05 9/9/10 09:20 0.685 DF+R DRY-BULK 34.13 38.30 138.49 0.40 0.80 1.43
7 9/9/10 09:20 9/22/10 08:55 0.320 DF DRY-BULK 36.47 38.74 92.50 0.21 0.45 0.89
8 9/22/10 08:55 10/13/10 09:10 1.232 DF+R DRY-BULK 118.48 128.92 192.84 0.71 2.48 3.83
9 10/13/10 09:40 10/20/10 15:03 2.374 DF+R DRY-BULK 52.64 64.52 95.58 0.84 1.31 0.80
10 10/20/10 15:24 11/9/10 08:44 0.818 DF+R+S DRY-BULK 48.98 60.47 118.91 0.22 0.87 3.25
11 11/9/10 09:02 11/17/10 07:45 1.515 DF+S? DRY-BULK 21.06 10.82 26.25 0.20 1.01 1.31
12 11/17/10 07:25 12/1/10 10:25 1.131 DF+S DRY-BULK 34.46 35.44 58.99 0.30 0.89 3.29
13 12/1/10 10:45 12/15/10 14:25 2.775 DF+R+S DRY-BULK 31.38 8.09 7.37 0.74 1.69 1.86
14 12/15/10 13:50 1/4/11 09:40 1.350 DF+R+S DRY-BULK 24.77 6.54 35.71 0.36 0.41 0.90
15 1/4/11 09:40 2/11/11 10:46 0.500 DF+R+S DRY-BULK NA NA NA NA NA NA 66
16 2/11/11 10:46 3/1/11 08:48 0.627 S DRY-BULK 17.68 17.18 21.75 0.28 0.41 4.09
17 3/1/11 08:48 3/28/11 09:25 1.828 DF+R+S DRY-BULK 40.96 34.60 51.94 0.61 1.34 3.35
18 3/28/11 09:25 4/22/11 09:19 0.500 DF+R+S DRY-BULK 49.45 70.70 99.92 1.12 1.89 4.95 77
19 4/22/11 09:19 6/7/11 15:08 1.869 DF+R+S DRY-BULK NA NA NA NA NA NA 78
20 6/7/11 15:08 7/2/11 11:45 0.500 DF+R+S DRY-BULK 16.76 6.67 57.33 1.60 4.51 6.44 79
21 7/2/11 11:45 7/23/11 10:54 0.500 DF+R DRY-BULK 14.87 9.37 56.20 1.68 3.77 10.85 96
22 7/23/11 10:54 8/4/11 10:25 0.500 DF DRY-BULK 25.02 31.07 37.70 0.62 1.58 4.71 97
23 8/4/11 10:25 8/26/11 10:05 0.500 DF DRY-BULK 8.08 7.82 19.09 0.54 0.96 2.16 97
24 8/26/11 10:05 9/8/11 09:19 0.500 DF DRY-BULK 18.31 20.35 47.21 0.38 0.94 2.46 97
25 9/8/11 09:19 9/21/11 09:33 0.500 DF+R DRY-BULK 18.41 24.71 NA 0.36 0.91 1.24 98
26 9/21/11 9:33 10/12/11 15:37 0.5 DF+R+S DRY-BULK 74.40 66.87 NA 0.23 0.79 1.58

68
Appendix Table 5.c. N and P load per day in dry-bulk deposition (buoy bucket) at the Northwest Buoy (TB-4) Sta. 6/3/10-10/12/11. Buoy TB-4 Dry-Bulk (Load/day)
Samp. Start Collection Vol. Precip. Collector NO3-N NH4-N TKN SRP DP TP
No. Date-Time Date-Time Liters Form Type (g/ha/d) (g/ha/d) (g/ha/d) (g/ha/d) (g/ha/d) (g/ha/d) Notes
1 6/3/10 09:18 7/2/10 08:20 0.500 DF+R DRY-BULK NA NA NA NA NA NA 13
2 7/2/10 08:20 7/20/10 10:16 0.500 DF+R DRY-BULK 0.75 0.15 2.97 0.12 0.17 0.38 9
3 7/20/10 10:16 8/3/10 09:07 0.500 DF DRY-BULK 1.35 0.96 1.60 0.01 0.06 0.18 14
4 8/3/10 09:07 8/12/10 10:14 0.485 DF+R DRY-BULK 7.29 1.85 29.01 0.25 0.29 0.47
5 8/12/10 10:14 8/31/10 14:05 0.500 DF DRY-BULK 1.20 0.09 6.08 0.03 0.05 0.17 14
6 8/31/10 14:05 9/9/10 09:20 0.685 DF+R DRY-BULK 3.88 4.35 15.73 0.05 0.09 0.16
7 9/9/10 09:20 9/22/10 08:55 0.320 DF DRY-BULK 2.81 2.98 7.13 0.02 0.03 0.07
8 9/22/10 08:55 10/13/10 09:10 1.232 DF+R DRY-BULK 5.64 6.14 9.18 0.03 0.12 0.18
9 10/13/10 09:40 10/20/10 15:03 2.374 DF+R DRY-BULK 7.29 8.93 13.23 0.12 0.18 0.11
10 10/20/10 15:24 11/9/10 08:44 0.818 DF+R+S DRY-BULK 2.48 3.07 6.03 0.01 0.04 0.17
11 11/9/10 09:02 11/17/10 07:45 1.515 DF+S? DRY-BULK 2.65 1.36 3.30 0.03 0.13 0.16
12 11/17/10 07:25 12/1/10 10:25 1.131 DF+S DRY-BULK 2.44 2.51 4.18 0.02 0.06 0.23
13 12/1/10 10:45 12/15/10 14:25 2.775 DF+R+S DRY-BULK 2.22 0.57 0.52 0.05 0.12 0.13
14 12/15/10 13:50 1/4/11 09:40 1.350 DF+R+S DRY-BULK 1.25 0.33 1.80 0.02 0.02 0.05
15 1/4/11 09:40 2/11/11 10:46 0.500 DF+R+S DRY-BULK NA NA NA NA NA NA 66
16 2/11/11 10:46 3/1/11 08:48 0.627 S DRY-BULK 0.99 0.96 1.21 0.02 0.02 0.23
17 3/1/11 08:48 3/28/11 09:25 1.828 DF+R+S DRY-BULK 1.52 1.28 1.92 0.02 0.05 0.12
18 3/28/11 09:25 4/22/11 09:19 0.500 DF+R+S DRY-BULK 1.98 2.83 4.00 0.04 0.08 0.20 77
19 4/22/11 09:19 6/7/11 15:08 1.869 DF+R+S DRY-BULK NA NA NA NA NA NA 78
20 6/7/11 15:08 7/2/11 11:45 0.500 DF+R+S DRY-BULK 0.67 0.27 2.31 0.06 0.18 0.26 79
21 7/2/11 11:45 7/23/11 10:54 0.500 DF+R DRY-BULK 0.71 0.45 2.68 0.08 0.18 0.52 96
22 7/23/11 10:54 8/4/11 10:25 0.500 DF DRY-BULK 2.09 2.59 3.15 0.05 0.13 0.39 97
23 8/4/11 10:25 8/26/11 10:05 0.500 DF DRY-BULK 0.37 0.36 0.87 0.02 0.04 0.10 97
24 8/26/11 10:05 9/8/11 09:19 0.500 DF DRY-BULK 1.41 1.57 3.64 0.03 0.07 0.19 97
25 9/8/11 09:19 9/21/11 09:33 0.500 DF+R DRY-BULK 1.42 1.90 NA 0.03 0.07 0.10 98
26 9/21/11 9:33 10/12/11 15:37 0.5 DF+R+S DRY-BULK 3.50 3.15 NA 0.01 0.04 0.07

69
Table Legend:
Precipitation Form: (S=snow; R=rain; DF= dry fall (Dry deposition); H=hail; G=graupel; NA=information on type not available; T=trace of precip.)
Collector Type: (ST= 8 in. dia. Snow tube; TBG= 8 in. dia. Electrically heated tipping bucket rain and snow gauge; Wet= Aerochem Metrics Wet Bucket; Dry= Dry-Bulk bucket with 4
liter deionized water added, placed in dry-side of Aerochem Metrics sampler; Dry-Bulk= Aerochem Metrics bucket with reduced side height, filled with 4 liters of
deionized H2O)
pH: (NES= not enough sample); C= sample contaminated; NA= not measured. “*”= prolonged collection period, data not used in loading calculations.
Nutrient Concentrations: (C= sample contamination; NA= Not available or not enough sample for analysis; note units are micrograms/liter; TBA= data not yet available; where
concentrations are shown with a “c”, sample was considered contaminated and not used in loading calculations).
Table Notes
Small amount of precipitation from thunderstorms, 20ml sample + 480 ml deionized water; (2) localized thunderstorm on 8/7/10 which caused rise on Ward Cr.; (3) 125ml precipitation
+ 375 ml deionized water; (4) much pollen and large dead crane fly in dry sample, possible contamination, not used for loading; (5) dry bucket had much pollen, small amount of
sample spilled in transit; (6) removed Aerochem Metrics sampler on 8/12/10 12:00 to paint tower; (7) thunderstorm this period, Dry bucket had much debris and dust, still
construction on property and unpaved road, thunderstorm this period also, construction may have led to unusual silt resuspension, don’t use data for loading, also approximate start
time when Aerochem Metrics station back up and running; (8) couple aspen leaves, much debris, silt and organic matter in sample, grading and logging on property during period,
don’t use this sample; (9) much pollen and a few very small bugs in dry bucket; (10) 32ml + 468ml deionized water, much pollen, many dead bugs in ST; (11) added 495ml deionized
water to 5ml of sample; (12) 70ml of precipitation from thunderstorms added to 430ml of deionized water; (13) dry bucket out for very long period, 500ml deionized water to process;
(14) bucket dry, 500ml deionized water added to process; (15) bucket dry, much pollen, 500 ml deionized water added to process; (16) 220ml sample + 280ml deionized water;(17) 10ml
of sample + 490ml deionized water; (18) no power to station, contractor disconnected power cord both Wet and Dry buckets open this period, lid removed; (19)Aerochem Metrics lid
removed, Wet + Dry buckets exposed during period; (20) Aerochem Metrics lid over Wet part of period, shifted manually over Dry at 10/18/10 at 0900; (21) 10/22/10 1440 extension
cord connected to station, Aerochem Metrics working properly during storm, storm mostly rain from intense rain/ tropical moisture event; (22) 185ml sample + 320ml deionized water;
(23) 2 aspen leaves in sample; (24) bucket collected 11/20/10 13:25 with snow 3-4 inches above rim, was combined with bucket collected 11/21/10 17:45 with snow 10-12 inches above
rim, snow compacted down for both, melt water added together, lid stuck over dry so bucket collected some dry deposition also, very cold; (25) very cold arctic low pressure system
with gusty winds, about 15-18 inches of snow from storm, snow may have blown off over-topped snow, only ½ inch snow above rim of bucket, area more open now due to removal of
trees near the lake on the property; (26) snow 3-4 inches above rim, compacted down; (27) very wet storm with much rain at lower elevations, heavy snow, approximately 1 foot at end
of storm; (28) much water in bucket, snow also accumulated 1 inch above rim, strong winds had blown snow roof off Aerochem Metrics lid, rain and snow this storm, stationary low
pressure system merging cold air and tropical moisture from near Hawaii, power off to station, Wet side open; (29) Wet bucket collected some dry deposition, windy this period; (30)
power off, ground-fault interrupter tripped during storm, Wet caught some Dry deposition; (31) Dry bucket may have caught some precipitation; (32) snow 1 ½ feet above rim bucket
compacted down, heavy wet snow from strong storm; (33) no power to station, contractor removed disconnected power cord, both Wet and Dry buckets open this period, lid removed
10/3/10, dry bucket caught precipitation during storm 10/2/10; Wet + Dry buckets exposed during period; (34) Dry bucket open during period until10/18/10 0900 when manually
shifted lid to cover, Dry closed the rest of the period; (35) many aspen leaves in Dry bucket; (36) Dry bucket had ice in it, no heater in place; (37) snow and ice accumulated on screen
over Dry bucket, no heater in place; (38) power was cut to station sometime during period, estimate 12/15/10, ground fault interrupter tripped, likely in heavy snow or rain, lid loose
over dry during power outage; (39) Dry bucket frozen with some snow on it, connected heater to timer for next Dry collection; (40) precip rain from thunderstorms; (41) ST leaked, 61
ml caught in another bag, added 268ml deionized water to 232ml sample remaining in ST;(42) 55ml sample + 445 ml deionized H2O; (43) ST bag had leak, re-sealed and placed back
out; (44) ST bag leaked, sample lost; (45) no ST in place this period; (46) ST had a leak, some sample lost, amount low, ST cap gone; (47) snow accumulated 6-8 inches above rim,
compacted down; (48) snow accumulated ~4 inches above rim; (49) ~2 feet new light snow at station, compacted into bucket; (50) snow accumulated ~4 inches above rim, compacted
down; (51-53) no notes; (54) 1 wet bucket spilled, ~2 feet snow accumulated, collected snow by coring down to wet bucket with another wet bucket, precip spilled out of one bucket in
transit to the lab, estimated amount by using SNOTEL Ward 3 precipitation accumulated during period 3.6 inches of water divided by 1.5 (approximate factor Ward #3 is greater than
Lower Ward Valley station; (55)~15 inches new snow; (56) snow accumulated 1 ft. above rim, used 2nd bucket to core down to bucket in sampler; (57) used clean bucket to core

70
approximately 1 foot to wet bucket in sampler, combined buckets; (58) snow 1 inch above bucket rim; (59) used 2nd bucket to core down to bucket in sampler, strong windy storm with
heavy snow, bucket likely did not collect all snow due to strong winds which may have blown snow from top of sample away; (60) Dry bucket frozen on surface portion of the period;
(61) much silt in sample; (62) 117ml of precip + 383ml deionized water; (63) no ST cap, bag blew upwards preventing collection of precip; (64) no cap, but ST still collected precip; (65)
small pc of green organic matter in TB Dry; (66) bucket dry, added 500ml deionized water to process; (67) last storm very windy; (68) power cut to station, house which had been
source of power is being torn down, dry bucket caught most of the precipitation, 29ml of sample + 471ml deionized water; (69) 145 ml of sample + 355 ml deionized water; (70) much
pollen and organic matter in sample; (71) no ST or ST cap out this period; (72) ST may have leaked; (73) ST had many dead flies in it, measured volume and discarded water; (74)
bucket dry, added 500ml deionized water to process; (75) bucket may have gone dry during portion of the period; (76) dry bucket had trace of precipitation in it, much pollen in dry
bucket; (77) 50ml of sample + 450ml deionized water; (78) bucket may have gone dry during portion of the period; (79) 285 ml sample + 215ml deionized sample; (80) 56ml sample +
444ml deionized water, manually switched lid back over wet bucket, had switched over dry bucket at 1715 with onset of precipitation, power to station out, house which was source of
power has been torn down; (81) lid on Aerochem Metrics sampler removed 9/11/11 at 1505 prior to thunderstorms (1730-1930) – note there was heavy rain and Tahoe Vista from
thunderstorms, a few sprinkles occurred the previous day and were caught in the dry bucket, after changing wet bucket, left lid off sampler; (82) collected precip from wet bucket and
left out, collected in new 250 HDPE bottle rinsed 4-5 times with sample; (83) no precipitation or trace, had evaporated; (84) much silt and pollen in sample, roadhouse demolished
now, 1 aspen leaf in sample, diluted 60ml of filtered water with 180ml of deionized water due to very slow filtration; raw water was not diluted; (85) bucket very dirty, still much
construction on property, may be stirring up dust; (86) many particles on filter; (87) dry bucket lid had been removed from Aerochem sampler the previous day 9/11/11 at 1505, so dry
bucket also caught precip 9/11/11 1730-1930; (88) Aerochem Metrics lid removed so Dry bucket caught some precipitation as did Wet bucket; (89) Dry bkt collected after about ½ hour
of rain, replaced with Wet bucket, still no power to station; (90) many small black bugs in ST sample, added 242 ml of sample to 258ml deionized water; (91) ST had 22ml or precip to
which added 478ml deionized water; (92) bucket dry although precip during period, added 500ml to process, much pollen in sample; (93) 48ml sample + 452ml deionized water; (94)
bucket dry, added 500ml deionized water to process, many plastic flakes; (95) bucket dry, added 500ml deionized water to process; (96) bucket dry added 500ml deionized water to
process, much pollen; (97) bucket dry, added 500ml deionized water to process; (98) 190 ml sample + 310ml deionized water; (x) additional 2 liters deionized water added, small
amount spilled in transit; (z) pine needles, seeds, sprouts in sample, contamination, long collection period, don’t use sample; (y) many pieces of organic matter in sample, don’t use;
(v) bucket out long period, sample caught wet and dry, unable to separate wet contribution from dry in calculations, use Wet bucket estimates of Wet+ Dry during collection periods
ending 10/3/10 16:45, 10/4/10 09:20, 10/5/10 16:15; 10/8/10 11:20, do not use 10/14/10 dry sample; (w) in calculation of loading and loading rate, subtracted the contribution from the
wet sample collected 10/19/11 to estimate the dry contribution;

71