lake havasu interim report 2011 - mississippi state university
TRANSCRIPT

Lake Havasu Aquatic Plant Monitoring 2011 Interim Report
An Interim Report Submitted to RNT Consulting and the Central Arizona Project John D. Madsen, Ryan M. Wersal, Amanda Fernandez and Gray Turnage
Geosystems Research Institute, Mississippi State University
GRI Report #4008
April 16, 2012

GRI#4008: Lake Havasu Aquatic Plant Interim Report
Mississippi State University Page 2
Lake Havasu Aquatic Plant Monitoring 2011 Interim Report
John Madsen, Ryan M. Wersal, Amanda Fernandez and Gray Turnage Geosystems Research Institute, Mississippi State University
Executive Summary
Conclusions
Lake Havasu has a relatively diverse flora of seventeen aquatic plant species. Submersed
aquatic plants are found to a depth of 30 feet, with rooted plants founds to 27 feet. The littoral zone, where plants can grow, extends to 30 feet deep. Of the littoral points surveyed, approximately 51% were vegetated which represents 21% of the entire lake bottom. While much of this depth range is not habitable by plants, some may be colonized in the future.
Secchi disk transparency of 15 to 20 feet indicates that rooted plants should be able to grow to depths of at least 30 feet, and macroalgae to at least 45 feet.
The most common plants in our September survey were spiny naiad (Najas marina, 27% of littoral points), followed by the macroalga chara (Chara sp., 13%), sago pondweed (Stuckenia pectinata, 9%), and southern naiad (Najas guadalupensis, 8%). The invasive submersed plants Eurasian watermilfoil (Myriophyllum spicatum, 3%) and curlyleaf pondweed (Potamogeton crispus, less than 1%) were also observed in the lake.
Biomass production at four sites in the lake indicated a maximum biomass of 60 gDW/m2 (that is, grams dry weight per square meter) for sago pondweed, 100 gDW/m2 for southern naiad, and 70 gDW/m2 for spiny naiad. This corresponds to a rough calculation of 12,200 tons of fresh weight submersed plants per year for these three species in the lake.
The phenology and times for senescence of the three species roughly translates to when these species occurred in dead mats at the Mark Wilmer plant.
Recommendations
Perform point surveys in the early and late summer to ensure detecting species before
senescence, particularly curlyleaf pondweed and southern naiad. Continue biomass and phenology studies, possibly at a three week frequency, to better
model plant phenology and senescence. Use hydroacoustics to map deep beds of spiny naiad and estimate abundance. Increase the amount of plant spread monitoring to better evaluate the source of plants. A mat mobility study is needed for both the Bill Williams area, and to study transport
down the length of the reservoir, possibly even from the Colorado River inlet. The study should encompass possible sources, speed of transport relative to windspeed and Mark Wilmer pump operation, and strata of transport (if mats are drifting on the surface or are moving at other water depths).

GRI#4008: Lake Havasu Aquatic Plant Interim Report
Mississippi State University Page 3
Develop a spatial model of plant production and dead matter development, to develop better estimates of possible dead plant production that could be transported to the Mark Wilmer plant.
Introduction
For several decades, Lake Havasu on the Colorado River has been the source of a significant amount of water for the Central Arizona Project (CAP), and operated without significant nuisance vegetation problems. Over the past few years, there has been an increase in the amount of dead plant matter periodically floating into the intake and interrupting operations at the Mark Wilmer pumping plant. The origin of these problems was discussed in a previous report (Madsen 2011), but the most likely explanation is increased water transparency caused by the introduction and establishment of quagga mussels (Dreissena rostriformis bugensis) (Figure 1).
We initiated three activities to assist in predicting the scope and source of nuisance vegetation, and predict the timing of nuisance plant mats. These include a lake survey, a study of the seasonal life history of plants in the lake (or phenology), and plant dispersal monitoring. We proposed a two-year study; and this is an interim report of the first year results. Study Site
Lake Havasu is a 20,400 acre reservoir, formed by the Parker Dam on the lower Colorado River, and sits astride the border between Arizona and California (Figure 2). Lake Havasu is 45 miles long, and has a total capacity of 646,200 acre-feet (Bureau of Reclamation webpage, www.usbr.gov). The US Bureau of Reclamation built Parker Dam beginning in 1934, and it was completed in 1938. Lake Havasu is only one in a chain of reservoirs in the Lower Colorado River (Figure 3). The primary purposes of constructing Parker Dam and creating Lake Havasu was to provide reservoir storage for water, and secondarily to construct a powerplant for generating electricity. Primary water consumers are the Central Arizona Project, which diverts 489 billion gallons of water per year for use throughout Arizona, and the Metropolitan Water District of Southern California (MWD), which delivers 1 billion gallons of drinking water per day to metro areas of Southern California. Since then, Lake Havasu has become a popular tourist destination. Several government agencies collaborate to enhance the fishery of the reservoir, which generates $34B per year in revenue for the area (Anderson 2001). The primary species caught in Lake Havasu are largemouth bass (Micropterus salmoides), striped bass (Morone saxatilis), crappie (Pomoxis nigromaculatus), sunfish (Lepomis spp.), and channel catfish (Ictalurus punctatus). Lake Havasu is also popular with boaters, campers, and other outdoor activities. Lake Havasu has several areas of National Wildlife Refuge, all incorporated into the Havasu National Wildlife Refuge. In addition, Lake Havasu is listed as habitat for two federally-listed
GRI#4008: Lake Havasu Aquatic Plant Interim Report
Mississippi State University Page 4
endangered species, the Razorback Sucker (Xyrauchen texanus) and the Bonytail Chub (Gila
elegans) (Marsh and Minckley 1989, Bozek et al. 1984, Schooley and Marsh 2007).
Materials and Methods
Lake Survey
We conducted a point intercept survey of the entire lake using a grid of points spaced 200 meters apart. Survey methods were similar to that utilized in projects across the United States (Wersal et al. 2006, Madsen and Wersal 2008, Madsen and Cheshier 2009, Wersal et al. 2009, Wersal et al. 2010). Surveys were conducted by boat using GPS (Global Positioning System) technology. A Trimble Yuma tablet computer was used to both navigate to survey locations and enter attribute data for each point as indicated below. Survey accuracy is typically 3-10 ft. (1-3 meters) depending on satellite reception. At each survey point, a weighted plant rake was deployed to determine the presence of plant species. Water depth was recorded at each point as well, either using an echolocation depthfinder or a PVC sounding rod. Plant and spatial data were recorded electronically using FarmWorks software. Collected data were recorded in database templates using specific pick lists constructed for this project. The utilization of this software also allows for displaying geographic information as well as navigation to specific points to further increase survey accuracy. The point intercept survey was performed from September 7 to 9 and September 16-19, for a total of seven full days of work. A total of 1623 points were surveyed. An early growth season survey to measure spring and early summer species was not performed due to finalizing the contract after the appropriate time period. Seasonal Life History of Aquatic Plants
Four locations were selected after a survey of possible locations and discussions with Doug Adams, (Aquatic Biologist, Bureau of Land Management). Sites selected were identified as Bill Williams Bay South, Bill Williams Bay North, Standard Wash, and Thompson Bay (Figure 4). Two sites were selected at Bill Williams given that it seemed likely to be a significant source of plants to the Mark Wilmer plant. Environmental data. Environmental data including temperature, dissolved oxygen, pH, and conductivity were collected during each biomass harvest event using a Hydrolab Quantum. We also collected transparency data using a Secchi Disk, and light profiles with a LiCOR submersible probe and surface probe. Environmental profiles were collected at 1 m intervals in the open water location for each site, and at 0.5 m intervals at the shallow water locations (near biomass sampling sites). Data from these sites were averaged for each profile for this report. Continuous temperature. Temperature was also collected using Onset Pendant loggers that were deployed at each site, and will record temperature data in one hour intervals through the winter of 2011/2012. Environmental data were used to determine species specific phenology, or the timing of important points in the plants life cycle with environmental factors. After a

GRI#4008: Lake Havasu Aquatic Plant Interim Report
Mississippi State University Page 5
complete annual cycle is completed, it will be possible to use a degree-day approach to calculate the transition times in each species life cycle, and thus predict when the plants will senesce and form floating mats. Phenology information will be valuable in timing management techniques to appropriate times in the target plants life cycle in order to maximize management efficacy. Biomass and Phenology. At each location, 30 biomass samples were collected monthly from June through October 2011 using a PVC coring device (Madsen et al. 2007). These samples were sorted the same day they were collected and sorted by species. The presence of foliage, flowers, fruit, and propagules were recorded. All samples were bagged and shipped express to MSU where they were dried in an oven at approximately 70 C and weighed. Biomass is reported as grams dry weight per square meter (gDW/m2). Composition of Mats
The proportional composition of mats collected at the Mark Wilmer plant was analyzed daily by plant personnel, and are included here for reference to the biomass data. Plant Dispersal Monitoring
The Geosystems Research Institute developed a 1st generation GPS drone that can be deployed in an area and transmits location information in set intervals back to a receiver. We released several drones in the Bill Williams area in September and October to evaluate drift patterns from these sites that are suspected to be sources for aquatic plants into Lake Havasu. While this information was presented in a separate report (Fernandez et al. 2011); it will be repeated in this report. To determine the movement of large mats of dead aquatic vegetation in Lake Havasu, a drift study was conducted on September 10, 2011 and repeated on October 9, 2011. The southern-most portion of the lake, hereafter referred to as Bill Williams, is thought to be the source of the large mats. Drones were released at various spots throughout the Bill Williams area. Drone movement was monitored by marking the geographic coordinates of the drone release location and then marking the location where the drones were collected on a Trimble Yuma. Data were transmitted from the drones to the receiver in set intervals during the study. Some of the drones were allowed to float freely while others were placed on top of the floating mats. They were allowed to drift for varying amounts of time depending on the movement observed.
Results and Discussion
Lake Survey
Lake Havasu is a steep-sided reservoir with a significant area with depths in the range of 30 to 38 ft (Figure 5A). The median depth is approximately 35 ft. (Figure 5B). Lake Havasu has very steep sides and few locations with habitats under three feet deep; as light transparency increases, the available habitats for plants increases substantially as well. A plot of species richness versus

GRI#4008: Lake Havasu Aquatic Plant Interim Report
Mississippi State University Page 6
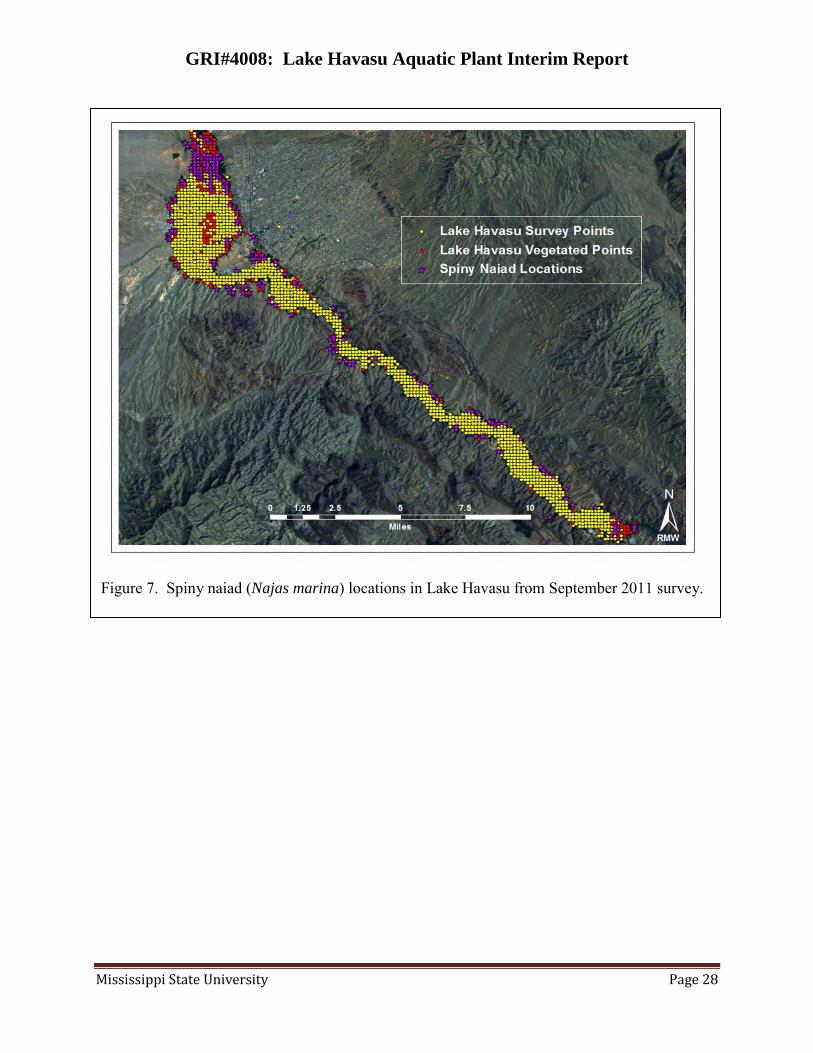
depth of survey points demonstrates that the maximum observed depth of colonization for aquatic plants was 30 ft (Figure 6). Subsequent analyses referring to the “littoral zone” or range to which rooted plants will survive refers to the area of the reservoir from 0 to 30 feet deep. Also notice that, as a general trend, aquatic plant diversity (richness) tends to decrease with water depth; the most diverse habitats are in waters from 2 to 4 feet deep. The littoral zone was represented as 680 of the 1623 points in the lake, or about 42% of the lake surface area (or bottom). Seventeen different aquatic plant species were observed in Lake Havasu during 2011 (Table 1). Most will not be discussed at length, because they do not contribute to the floating mat problem. While the scientific name and authority are indicated in Table 1, hereafter only common names will be used, with the exact identification referenced in Table 1. By far the most widespread plant was spiny naiad, at 26.9% of the littoral zone, or a gross estimate of 1810 acres based on each point representing 9.9 acres (Table 2). Spiny naiad grew in dense beds in the northern end of the lake, from the north end of Lake Havasu City to the delta of the Colorado River at the inlet (Figure 7). Much of this area is from 20 to 27 feet deep, and at the time of the survey had 10’ or more of plant growth from the bottom (Figure 8). Spiny naiad grew extensively from 3 to 25 ft of water depth (Figure 9). Spiny naiad had reached the peak of its growth cycle at the time of the survey in September (see Phenology). The next most common species was sago pondweed, which was found in 9% of the littoral zone comprising an estimated 604 acres (Table 2). This species was also found throughout the lake, though usually in somewhat shallower water than spiny naiad, particularly in deltaic areas and embayments (Figure 10). Sago pondweed was past the peak of its growth cycle at the time of the survey (see Phenology), so it may be more common than represented from this one survey. Sago pondweed is most widely distributed in depths from 3 to 16 feet (Figure 11). The third most common species (see Biomass) was southern naiad (Najas guadalupensis), which was found in about 8.4% of points for an estimated acreage of 564 acres (Table 2). Similarly to sago pondweed, it was found in shallow embayments throughout the lake (Figure 12). Southern naiad has a fairly continuous distribution across depth (Figure 13; the 2 ft depth interval has very few points). Southern naiad was well past its peak of biomass by the time of the survey, thus it may have been more common earlier in the year (see Phenology). Southern naiad was a major component of dead floating mats around the lake at the time of the survey, though other species were also observed (Figure 14). Chara (Chara sp.) was a common species found during the survey, occurring at 13.4% of littoral zone points (Table 2). Chara, like Nitella (a minor species in Lake Havasu), is a macroalga, meaning that is visible to the naked eye. Propagated by spores, it is often the first species to colonize an open area of littoral zone, and often can occur deeper than the vascular rooted plants (Figure 15). This often results in a bimodal depth distribution, being excluded from depths in which rooted plants are very abundant. Overall, vegetation occurred at 21.2% of points lakewide (or 3,406 acres), with 50.6% of littoral points bearing some vegetation (Table 3). Species diversity as determined by average number of
GRI#4008: Lake Havasu Aquatic Plant Interim Report
Mississippi State University Page 7
species per point in the littoral zone was 0.802. The average depth of the lake was 32.4 ft, the average depth of the littoral zone was 19.0 ft. A map of vegetated points (Figure 16) shows that embayments in the southern end of the lake held vegetation, but the open lake typically did not. In contrast, vegetation was prevalent in waters of the northernmost end of the lake except in areas that were too deep. Almost all points from 2 to 11 feet water depth were vegetated, about 60% (or 0.6 proportion) of points from 12 to 22 feet deep were vegetated, and the proportion of vegetated points at intervals greater than 22 feet declines out to a maximum of 30 ft (Figure 17). Most of the available habitat is filled by aquatic plants in waters less than 12 ft deep, which provides significant habitat for littoral zone fishes. Much of the littoral zone in the remaining 49% not colonized by plants may be either too rocky for plants or otherwise unsuitable. However, some of this space is undoubtedly available for colonization. In addition, continued improvements in water clarity may further increase the available littoral zone. Two invasive aquatic plant species were found: curlyleaf pondweed (Potamogeton crispus) and Eurasian watermilfoil (Myriophyllum spicatum; Tables 1, 2). Very few locations of curlyeaf pondweed were found (0.7%), possibly because this species is dominant in the spring and senesces to turions by early summer (Woolf and Madsen 2003). Eurasian watermilfoil was found at 3% of points, or approximately 208 acres (Table 2). Eurasian watermilfoil was not observed south of Lake Havasu City, and was found commonly near the delta of the Colorado River (Figure 18). Eurasian watermilfoil was first detected while on reconnaissance with Doug Adams of BLM, on June 22, 2011 (Figure 19). Eurasian watermilfoil has the capability to spread within the Lake Havasu system; so at a minimum, continued monitoring is warranted. Eurasian watermilfoil is an aggressive invasive plant that may displace other vegetation (Madsen et al. 1991, Madsen 2005, Madsen 2009). If Eurasian watermilfoil were to expand, displacing current species, the timing of dead mats is somewhat uncertain. Eurasian watermilfoil produces more biomass throughout the season than most natives, and some of this material dies continuously throughout the growing season. The standing biomass also tends to die in the fall, which may push the peak of dead mat formation to later in the year. Seasonal Life History of Aquatic Plants
Environmental Data. Each time biomass was collected, water quality data were collected at a location inside the weed bed (I), typically 12 to 15 ft deep, and outside of the weedbed (O), typically in 25 to 30 feet water depth. If water depth and Secchi disk were the same, then the Secchi disk was resting on the bottom (“B”) and a true measure of transparency was not made. Secchi disk indicates the water transparency at the site. These measures are best in areas without vegetation, because in a weed bed it is likely the weeds rather than water transparency that are affecting the reading. An unpublished rule of thumb is that rooted aquatic plants can be found in water depths up to 2 times the Secchi disk depth, and algae can live in waters up to 3 times the Secchi disk depth (Fleming et al. 2011). From this rough estimate, rooted plants could potentially colonize as deep as 30 to 45 feet, and macroalgae to depths of 45 to 60 feet (Table 4). A further analysis of light and depth of colonization will be made in the final report. Water temperature was already 25 C or higher by the time we started sampling in June of 2011 (Table 4). Because we had already surpassed a typical threshold temperature for a degree-day analysis, a degree-day analysis of biomass development and phenology will not be undertaken

GRI#4008: Lake Havasu Aquatic Plant Interim Report
Mississippi State University Page 8
with 2011 data. With temperature datasondes already in the water for 2012, this analysis should be possible with 2012 data. Dissolved oxygen ranged from 7 to almost 17 mg/L. While some of this may be due to supersaturation, some difficulties were encountered in July and August with the same sensors. Continuous Temperature. Water temperature recording devices were placed on permanent structures near the biomass sampling sites at Bill Williams South, Bill Williams North, and Thompson Bay. A suitable structure could not be located at Standard Wash, so this sensor was placed on the dock at Partners Point, the BLM Habitat Field Station. The sensor was lost from the Thompson Bay structure, but all the remaining three temperature sondes were recovered in September, and replaced with new sondes to carry through the winter and spring. The remaining three sondes recorded similar temperature patterns ranging from 25 to 35 C during this time (Figure 20). The sonde at Bill Williams South was covered by a dense mat of decomposing plant material. Biomass and Phenology. Biomass tends to be a highly variable parameter, since plant distribution is often patchy. That being said, the confidence intervals on the data from Lake Havasu are relatively accurate (Figure 21). Sago pondweed is not the dominant species, at least in the biomass plots, at any of the sites selected. In all but Thompson Bay, sago pondweed had an early season peak in July, and then a later season peak in September. The highest biomass value for sago pondweed is approximately 60 g/m2 (that is, grams dry weight per square meter), from Bill Williams South. Southern naiad is the dominant species at both Bill Williams sites, with a peak of 100 g/m2. Southern naiad reaches maximum biomass in September, and senesces rapidly after that time. Spiny naiad is the dominant species at the remaining two sites (Standard Wash and Thompson Bay), with a maximum biomass of 70 g/m2. Spiny naiad has a biomass peak in August, but declines more gradually than the other two species after that peak (Figure 21). While the estimates of the total lakewide production are neither accurate nor precise, they are at least a starting point. Using the maximum biomass peak for the three dominant biomass species, we can estimate annual plant production (Table 5). Biomass is estimated from dried plant matter per unit area basis. Submersed aquatic plants are only 8% dry matter and 92% water (Westlake 1965). Production usually incorporates belowground as well as aboveground biomass (Carpenter 1980), but since we are interested in only the floating mats of dead shoot material, we excluded belowground biomass from this calculation. Total production would also include a loss factor, or some other factor that describes the difference between production and maximum standing biomass, such as the P/B ratio (Carpenter 1980, Westlake 1965). Since this is a rough preliminary estimate, these factors have not been included in the estimate. P/B ratios can range from slightly more than one to almost four (Madsen 1991). For instance, one study of sago pondweed estimated P/B to be 2.01 (Madsen 1986). Using the very rough estimation that each point equals 9.9 acres of plants, the estimated acreage of each species is used to calculate the total projected shoot production for each species, and those are summed for the three dominant species (Table 5). Spiny naiad contributes more than 50% of the mass, at 7,060 tons per year. Southern naiad follows, with 3,140 tons, and sago pondweed last with 2,020 tons. The total estimated shoot production is roughly calculated at 12,200 tons per year.

GRI#4008: Lake Havasu Aquatic Plant Interim Report
Mississippi State University Page 9
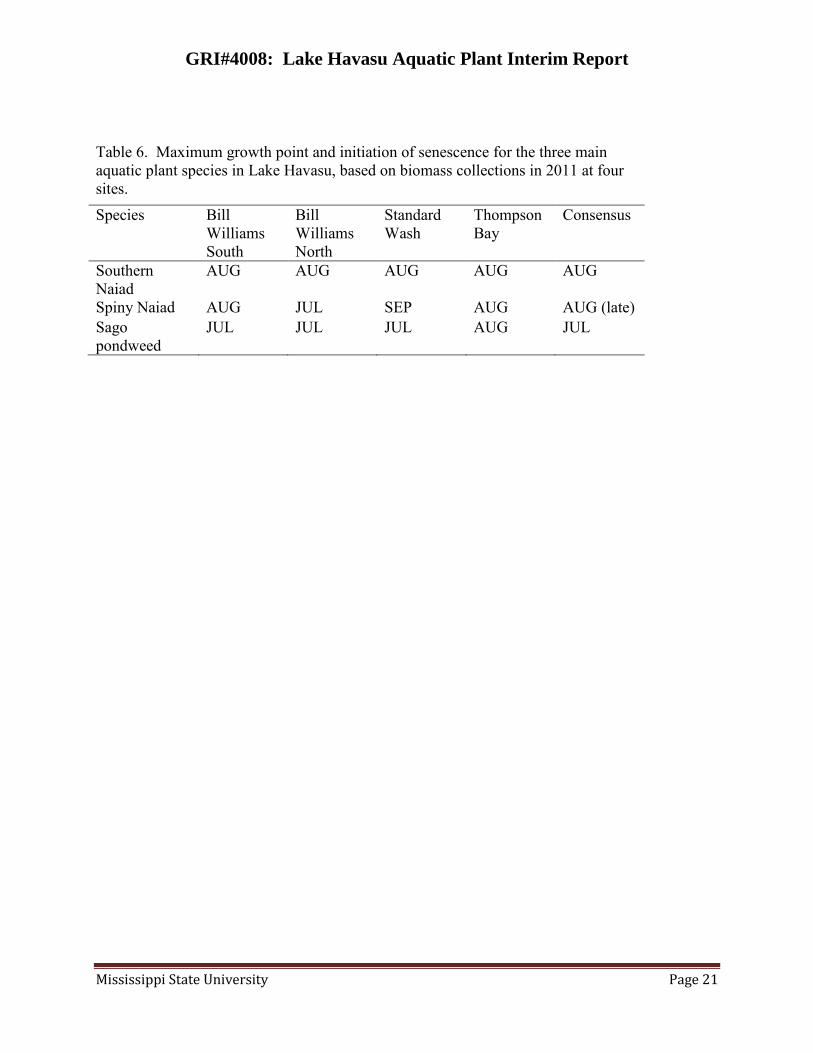
We also looked at the proportion of biomass samples which had foliage, flowers and fruits of each of the three dominant species. At Bill Williams South (Figure 22), southern naiad flowering peaked in August, with foliage found throughout the sampling periods. Spiny naiad had a more distinct peak in August, but was not a common component at this site. Sago pondweed peaked in July. At Bill Williams North (Figure 23), southern naiad peaked in August. Spiny naiad was a negligible component at this site. Sago had a strong peak in July, followed by a peak in September of foliage. Tubers became the predominant life stage in October. At Standard Wash (Figure 24), southern naiad peaked in August, and spiny naiad had broad amplitude across August and September. Sago pondweed followed a similar pattern here as in Bill Williams North, with a strong peak in July, followed by a secondary peak in September. Thompson Bay (Figure 25) was dominated by spiny naiad and sago pondweed. Southern naiad was negligible at this site, but what grew here peaked in August. Spiny naiad peaked from July through August. Sago pondweed foliage peaked in July and August, with fruits appearing in August and tuber formation beginning in July. A review of all four sites presents a relative order of senescence for these three species (Table 6). Sago pondweed senesces first, in July, though some stem material will remain. Southern naiad is next, with senescence in early to mid-August. Spiny naiad tends to be last, with senescence in mid to late-August. By the time we started our point intercept survey, senescence was well underway, and biomass was reduced – particularly in the southern end. Although we do not have data to support this observation, we did note that senescence was earlier in the southern end of the lake, and delayed as the sites progressed towards the inlet of the Colorado River. Water temperatures are much cooler closer to the inlet. Also, senescence is earlier in shallow waters, and delayed as the depth increases. The spiny naiad growing in more than 20 ft water depth showed no indication of senescence. Given these issues, we suggest performing two point surveys, one in June after plants emerge, and one in mid-to-late August, before senescence is widespread. Also, given the short growing cycle of late May to July or August, it would be helpful to have biomass samples every three weeks during this period, rather than once per month. Additional data sources of biomass would assist in these estimates as well, such as hydroacoustics, to map abundance or biovolume in the deep plant beds of spiny naiad in the northern basin. Composition of Mats
The composition of floating mats provides some substantiation for the observations made regarding phenology above, with sago pondweed occurring first, followed by southern naiad and spiny naiad (Figure 26). Two inconsistencies do arise regarding the composition of the mats arriving at Mark Wilmer: 1) the late peak in southern naiad, and 2) the high proportion of spiny naiad. Southern naiad is resurgent in the mats late in August. This may in part be that the mats often are not completely dead, and the shoots can survive for a long period of time. Mats in the Bill Williams area started appearing in August, and persisted into October (Figure 27). While

GRI#4008: Lake Havasu Aquatic Plant Interim Report
Mississippi State University Page 10
the Bill Williams area is a logical source of plants and forms large mats that are already documented to float out towards the opening of the Mark Wilmer plant, it is composed almost entirely of southern naiad and sago pondweed. On the other hand, large mats are also seen floating in the open water upstream of the Mark Wilmer area, and many of these mats (such as the one shown in Figure 28) are entirely composed of spiny naiad. The high proportion of spiny naiad in the mats at Mark Wilmer must come from areas other than the Bill Williams shallows, and this could be from the many small embayments along the main stem of the lake. While it is unlikely that mats would survive all the way from the inlet area, there is a large amount of spiny naiad growing in that area as well. To further examine this aspect of the problem, it would be helpful if some qualitative or rough quantitative measure of the amount of material coming in to Mark Wilmer was collected. This could be the number of boat loads, the number of dumpster truck loads, or any other assessment of quantity. Plant Dispersal Monitoring
On September 10, winds were out of the south with maximum sustained winds of 17mph and gusts up to 32 mph. Four drones were released in open water about 20m from the large plant beds (Figure 29). After two hours, the drones were collected. They had moved west, past the pumping station inlet, averaging 4.25 feet per second (initially reported as 464 meters (m) per hour) (Figure 29). The four drones were then released in pairs at the mouth of the inlet leading to the pumping station and allowed to float for thirty minutes. Both pairs drifted northwest away from the pump (Figure 30). The four drones were released a final time in spots that were farther south than the first release locations (Figure 31). Three of the drones were free-floating while one was placed on a plant bed. The three free floating drones moved northwest at 7.10 feet per second (initially reported as 774 meters per hour) while the drone sitting on the plant mat moved in the same direction but only at 2.21 feet per second (initially reported as 242 meters per hour) (Figure 31). On October 9, winds were from the north northwest with maximum sustained wind speed of 15mph and gusts up to 24mph. In addition, the Mark Wilmer pumps were running. Four drones were released in the northern half of Bill Williams and drifted east deeper into the wildlife refuge (Figure 32). To see if the pump could create enough suction to pull the drones around the peninsula that creates the inlet to the pump, five drones were released on both sides of the peninsula (Figure 33). The two drones above the peninsula were not pulled around it but instead were moved southeast. The drone released exactly above the peninsula point moved below the peninsula and into the inlet, and the two drones released below the peninsula moved southeast into the inlet (Figure 33). Further investigation will be necessary to determine from where the plant mats are originating; however, both of these studies suggest that the surface water current created by the wind is more influential in driving mat movement than current created from the pumps. Since both days sampled had very strong winds, monitoring the mat movement in Bill Williams should include days where winds are not as influential to help determine just how strong the current is resulting from the pump. Certainly, wind-driven movements are important in delivering the mat to a

GRI#4008: Lake Havasu Aquatic Plant Interim Report
Mississippi State University Page 11
location close enough to the opening of the Mark Wilmer barrier to allow the pump-activated currents to pull mats into the pumping station. Mat movement from other heavily vegetated areas such as the northern part of the lake at the mouth of the Colorado River should also be monitored. Since the two plant communities are quite different at each end of the lake, identifying the plant composition of the mats may be helpful in determining the source of the mats.
Conclusions
Lake Havasu has a relatively diverse flora of seventeen aquatic plant species. Submersed
aquatic plants are found to a depth of 30 feet, with rooted plants founds to 27 feet. The littoral zone, where plants can grow, extends to 30 feet deep. Approximately 51% of littoral zone points were vegetated, constituting 21% of the entire lake bottom. While much of this depth range is not habitable by plants, some may be colonized in the future.
The most common plants in our September survey were spiny naiad (Najas marina, 27% of littoral points), followed by the macroalga chara (Chara sp., 13%), sago pondweed (Stuckenia pectinata, 9%), and southern naiad (Najas guadalupensis, 8%). The invasive submersed plants Eurasian watermilfoil (Myriophyllum spicatum, 3%) and curlyleaf pondweed (Potamogeton crispus, no detection in survey) were also observed in the lake.
Secchi disk transparency of 15 to 20 feet indicates that rooted plants should be able to grow out to at least 30 feet, and macroalgae to at least 45 feet.
Biomass production at four sites in the lake indicated a maximum biomass of 60 gDW/m2 for sago pondweed, 100 gDW/m2 for southern naiad, and 70 gDW/m2 for spiny naiad. This corresponds to a rough calculation of 12,200 tons of fresh weight submersed plants per year for these three species in the lake.
The phenology and times for senescence of the three species roughly translates to when these species occurred in dead mats at the Mark Wilmer plant.
Plant dispersal monitoring indicated that the dead mats are highly mobile, but as yet no “smoking gun” for where the plants are coming from has been determined. It is unlikely that all of the dead mat material can possibly come from only the Bill Williams area; the timing and species composition of the dead material does not match the biomass composition of Bill Williams NWR or the species occurrence data. Further investigation is needed in tracing the source of plant mats.
Recommendations
Perform point surveys in the early and late summer to ensure coverage of species before
senescence. Continue biomass and phenology studies, possibly at a 3 week frequency, to better model
plant phenology and senescence. Use hydroacoustics to map deep beds of spiny naiad and estimate abundance. Increase the amount of plant spread monitoring to better evaluate the source of plants. A mat mobility study is needed for both the Bill Williams area, and to study transport
down the length of the reservoir, possibly even from the Colorado River inlet. The study should encompass possible sources, speed of transport relative to windspeed and Mark

GRI#4008: Lake Havasu Aquatic Plant Interim Report
Mississippi State University Page 12
Wilmer pump operation, and strata of transport (if mats are drifting on the surface or are moving at other water depths).
Develop a spatial model of plant production and dead matter development, to develop better estimates of possible dead plant production that could be transported to the Mark Wilmer plant.
Acknowledgements
We were assisted in the field by Research Associates Alan Pryor, Scott Watson and Kathryn Welch, and undergraduate Daisy Polk; all of GRI. We received special assistance from Doug Adams, Bill Bryan, and other staff of the Bureau of Land Management Lake Havasu Field Office; they took us out on the lake in their boat to sample. Al Graves of Central Arizona Project provided significant insight into the operations of CAP and the Mark Wilmer Plant. Thanks to Renata Claudi for inviting us to work on this interesting project. Contact Information:
Dr. John D. Madsen Geosystems Research Institute Box 9627 Mississippi State University Mississippi State, MS 39762-9627 Ph. 662-325-2428 e-mail [email protected]

GRI#4008: Lake Havasu Aquatic Plant Interim Report
Mississippi State University Page 13
Literature Cited
Anderson, B.E. 2001. The Socio-Economic Impacts of the Lake Havasu Fisheries Improvement Program. Report to the Lake Havasu Chapter of Anglers United. Anderson and Associates, Durango, CO, October 30, 2001. Bozek, M.A., L.J. Paulson, and J.E. Deacon. 1984. Factors affecting reproductive success of bonytail chubs and razorback suckers in Lake Mohave. U.S. Fish and Wildlife Service, Publications (WR). Paper 71. January 1, 1984. Carpenter, S.R. 1980. Estimating net shoot production by a hierarchical cohort method of herbaceous plants subject to high mortality. American Midland Naturalist 104:163-175. Fernandez, A., S. Watson and J.D. Madsen. 2011. Preliminary Study of Weed Mat Drift in Lake Havasu. Letter Report to RNT Consulting, Geosystems Research Institute, Mississippi State University. October 24, 2011. Fleming, J. P., J. D. Madsen, and E. D. Dibble. 2011. Development of a GIS Model to Enhance Macrophyte Re-establishment Projects. Applied Geography 32:629-635. Madsen, J.D. 2011. Lake Havasu Aquatic Vegetation Management Reconnaisance Report. A Letter Report to the Central Arizona Project, January 13, 2011. Madsen, J. D. 2009. Chapter 13.2: Eurasian Watermilfoil, Pp. 95-98. In: Biology and control of aquatic plants: A best management practices handbook. (Gettys, L.A., W.T. Haller, and M. Bellaud, eds.). Marietta, GA: Aquatic Ecosystem Restoration Foundation. 210. Madsen, J. D. 2005. Eurasian Watermilfoil Invasions and Management Across the United States. Currents: The Journal of Marine Education. 21(2), 21-26. Madsen, J. D. 1991. Resource allocation at the individual plant level. In: M. S. Adams (Editor), The Ecology of Submersed Aquatic Macrophytes. Elsevier, Amsterdam. Special Issue, Aquatic Botany 41:67-86. Madsen, J.D. 1986. The Production and Physiological Ecology of the Submerged Macrophyte Community in Badfish Creek, Wisconsin. PhD Dissertation, Botany, University of Wisconsin-Madison. December 1986. 449pp. Madsen, J. D., & Cheshier, J. 2009. Eurasian Watermilfoil Survey of Three Reservoirs in the Lower Clarks Fork River, Montana: I. Results of the Field Vegetation Survey. GRI Report #5033. Mississippi State University: Geosystems Research Institute. Madsen, J.D., J.W. Sutherland, J.A. Bloomfield, L.W. Eichler, and C.W. Boylen. 1991. The decline of native vegetation under dense Eurasian watermilfoil canopies. Journal of Aquatic Plant Management 29:94-99.

GRI#4008: Lake Havasu Aquatic Plant Interim Report
Mississippi State University Page 14
Madsen, J. D., & Wersal, R. M. 2008. Assessment of Eurasian watermilfoil (Myriophyllum
spicatum L.) Populations in Lake Pend Oreille, Idaho for 2007. GeoResources Institute, Mississippi State University. Madsen, J. D., Wersal, R. M., & Woolf, T. E. 2007. A New Core Sampler for Estimating Biomass of Submersed Aquatic Macrophytes. Journal of Aquatic Plant Management. 45, 31-34. Marsh, P.C. and W.L. Minckley. 1989. Observations on recruitment and ecology of razorback sucker: Lower Colorado River, Arizona-California-Nevada. Great Basin Naturalist 49:71-78. Schooley, J.D. and P.C. Marsh. 2007. Stocking of endangered razorback suckers in the lower Colorado River basin over three decades: 1974-2004. North American Journal of Fisheries Management 27:43-51. U.S. Geological Survey [USGS] 1994. Accounting for consumptive use of Lower Colorado River water in Arizona, California, Nevada, and Utah. USGS Fact Sheet 94-074, US Geological Survey, December 1994. Wersal, R. M., Madsen, J. D., & Cheshier, J. 2010. Aquatic Plant Monitoring In Noxon Rapids Reservoir and Cabinet Gorge Reservoir for 2010. Mississippi State University: Geosystems Research Institute Report 5042. 18. Wersal, R. M., Madsen, J. D., & Cheshier, J. 2009. Eurasian Watermilfoil Monitoring and Mapping In Noxon Rapids Reservoir for 2009. Mississippi State University: Geosystems Research Institute. Wersal, R. M., J. D. Madsen and M. L. Tagert. (2006). Aquatic plant survey of Ross Barnett Reservoir for 2005. GRI Report #5003. Geosystems Research Institute, Mississippi State University. Westlake, D.F. 1965. Some basic data for investigations of the productivity of aquatic macrophytes. Pp. 229-248. In: C.R. Goldman, ed. Primary Productivity in Aquatic Environments. Mem. Ist. Ital. Idrobiol., 18 suppl. University of California Press, Berkeley. Woolf, T. E., and J. D. Madsen. 2003. Seasonal Biomass and Carbohydrate Allocation Patterns in Southern Minnesota Curlyleaf Pondweed Populations. Journal of Aquatic Plant Management. 41, 113-118.

GRI#4008: Lake Havasu Aquatic Plant Interim Report
Mississippi State University Page 15
Tables Table 1. List of species found in Lake Havasu during 2011 by scientific name and authority, common name, and growth form. Scientific Name and Authority Common Name Growth form Arundo donax L. Giant reed Emergent Chara sp. Chara Submersed Myriophyllum spicatum L. Eurasian watermilfoil Submersed Najas guadalupensis (Spreng.) Magnus Southern naiad Submersed Najas marina L. Spiny naiad Submersed Nitella sp. Nitella Submersed Potamogeton crispus L. Curlyleaf pondweed Submersed Potamogeton foliosus Raf. Narrowleaf pondweed Submersed Potamogeton nodosus Poir. American pondweed Submersed/Floating Ruppia maritima L. Widgeongrass Submersed Schoenoplectus californicus (C.A. Mey) Palla California bulrush Emergent Schoenoplectus tabernaemontani (C. C. Gmel.) Palla
Softstem bulrush Emergent
Stuckenia filiformis (Pers.) Borner Fineleaf pondweed Submersed Stuckenia pectinata (L.) Borner Sago pondweed Submersed Typha angustifolia L. Narrowleaf cattail Emergent Typha latifolia L. Broadleaf cattail Emergent Zannichellia palustris L. Horned pondweed Submersed

GRI#4008: Lake Havasu Aquatic Plant Interim Report
Mississippi State University Page 16
Table 2. Lake Havasu aquatic plant point intercept survey conducted in September 2011 with the common name, number of points at which the species were observed (count), percent frequency of lakewide points and littoral zone only points, and number of acres estimated at each point representing 9.9 acres. % Frequency of
Occurrence
Common Name Count Lakewide Littoral Acres* Giant reed 2 0.1 0.3 19.8 Chara 91 5.6 13.4 901 Eurasian watermilfoil 21 1.3 3.1 208 Southern naiad 57 3.5 8.4 564 Spiny naiad 183 11.3 26.9 1810 Nitella 32 2.0 4.7 317 Curlyleaf pondweed 5 0.3 0.7 49.5 Narrowleaf pondweed 7 0.4 1.0 69.3 American pondweed 5 0.3 0.7 49.5 Widgeongrass 39 2.4 5.7 386 California bulrush 11 0.7 1.6 109 Softstem bulrush 7 0.4 1.0 69.3 Fineleaf pondweed 8 0.5 1.2 79.2 Sago pondweed 61 3.8 9.0 604 Narrowleaf cattail 11 0.7 1.6 109 Broadleaf cattail 5 0.3 0.7 49.5 Horned pondweed# 0 0.0 0.0 0 #Not observed during the point intercept survey *Each point represents 4 hectares or 9.9 acres

GRI#4008: Lake Havasu Aquatic Plant Interim Report
Mississippi State University Page 17
Table 3. Littoral zone plant survey parameters from a point survey on Lake Havasu in September 2011. Lakewide Littoral Parameter Count Mean %Frequency Mean %Frequency Acres* Vegetated points 344 0.212 21.2 0.506 50.6 3406 Average Species Richness per Point
0.336 0.802
Depth (ft) 32.4 19.0 *Each point represents 4 hectares or 9.9 acres

GRI#4008: Lake Havasu Aquatic Plant Interim Report
Mississippi State University Page 18
Table 4. Mean water quality data collected at sites throughout Lake Havasu in 2011 both within and outside existing aquatic vegetation. All values in the vertical profile were averaged. A “B” indicates the Secchi was resting on the bottom. Month Site
Lo
cati
on
(I=
insi
de
veg
eta
tio
n;
O=
ou
tsid
e
veg
eta
tio
n)
Wa
ter
Dep
th (
ft)
Sec
chi
Dep
th (
ft)
Tem
per
atu
re (
C)
Dis
solv
ed O
xy
gen
(mg
L-1
)
pH
June Thompson Bay I 15 15B 26.3 7.1 8.3 O 26 22 24.7 7.2 8.3 Standard Wash I 15 10 25.0 7.3 8.3 O 32 22 24.5 7.3 8.3 Bill Williams South I 14 8 26.3 7.2 8.3 Bill Williams North I 10 7 27.1 7.2 8.2 Bill Williams O 29 16 25.5 7.2 8.4 July Thompson Bay I O Standard Wash I O Bill Williams South I 14 14B 28.2 8.7 Bill Williams O 29 17 27.3 8.6 August Thompson Bay I 15 15B 29.4 9.7 8.2 O 26 22 27.9 12.12 8.3 Standard Wash I 15 11 28.8 11.0 8.1 O 32 17 28.0 11.7 8.4 Bill Williams South I 14 9 29.1 16.5 8.6 Bill Williams North I 9 9B 29.7 8.5 Bill Williams O 29 20 27.8 10.7 8.3

GRI#4008: Lake Havasu Aquatic Plant Interim Report
Mississippi State University Page 19
Table 4. continued.
Month Site
Lo
cati
on
(I=
insi
de
veg
eta
tio
n;
O=
ou
tsid
e v
eget
ati
on
)
Wa
ter
Dep
th (
ft)
Sec
chi
Dep
th (
ft)
Tem
per
atu
re (
C)
Dis
solv
ed O
xy
gen
(mg
L-1
)
pH
September Thompson Bay I 17 15 27.8 9.0 8.1 O 26 11 27.1 8.6 8.1 Standard Wash I 14 12 28.1 9.5 8.2 O 32 13 27.4 8.6 8.4 Bill Williams South I 14 9 27.8 7.0 8.3 Bill Williams North I 9 8 28.0 5.6 8.0 Bill Williams O 31 8 27.2 8.5 8.3 October Thompson Bay I 25 21.9 7.5 8.1 O 25 21.8 6.6 7.9 Standard Wash I 12 23.1 6.6 8.2 O 31 22.6 6.1 8.1 Bill Williams South I 15 23.5 6.3 8.2 Bill Williams North I 10 23.6 6.4 8.1 Bill Williams O 28 23.1 5.9 8.2

GRI#4008: Lake Havasu Aquatic Plant Interim Report
Mississippi State University Page 20
Table 5. A very rough estimate of the total production of mass in tons per year for each of the three main species in Lake Havasu.
Species Biomass
(gDW/m2) Wet weight (tons / acre)
Estimated Acres
Estimated Lakewide
Production, tons/year
Spiny naiad 70 3.90 1810 7,060 Southern naiad 100 5.56 564 3,140 Sago pondweed 60 3.34 604 2,020 Total
12,200
GRI#4008: Lake Havasu Aquatic Plant Interim Report
Mississippi State University Page 21
Table 6. Maximum growth point and initiation of senescence for the three main aquatic plant species in Lake Havasu, based on biomass collections in 2011 at four sites. Species Bill
Williams South
Bill Williams North
Standard Wash
Thompson Bay
Consensus
Southern Naiad
AUG AUG AUG AUG AUG
Spiny Naiad AUG JUL SEP AUG AUG (late) Sago pondweed
JUL JUL JUL AUG JUL

GRI#4008: Lake Havasu Aquatic Plant Interim Report
Mississippi State University Page 22
Figures
Figure 1. Quagga mussels (Dreissena rostriformis bugensis) collected from Lake Havasu in September 2011. Photo by John D. Madsen

GRI#4008: Lake Havasu Aquatic Plant Interim Report
Mississippi State University Page 23
Figure 2. Map of Lake Havasu. Inlet is on the northwestern end, outlet is adjacent to Parker Dam. Bill Williams NWR and Bill Williams River enters the embayment on the southeastern end.

GRI#4008: Lake Havasu Aquatic Plant Interim Report
Mississippi State University Page 24
Figure 3. Chain of reservoirs along the Lower Colorado River. Map from USGS 1994.

GRI#4008: Lake Havasu Aquatic Plant Interim Report
Mississippi State University Page 25
Figure 4. Biomass collection sites on Lake Havasu in 2011 were Bill Williams North, Bill Williams South, Standard Wash, and Thompson Bay.

GRI#4008: Lake Havasu Aquatic Plant Interim Report
Mississippi State University Page 26
Figure 5. Depth characteristics of Lake Havasu, September 2011. A) Frequency of occurrence of individual 1 ft depth intervals out of 1623 points, B) Cumulative depth distribution.

GRI#4008: Lake Havasu Aquatic Plant Interim Report
Mississippi State University Page 27
Figure 6. Species richness per point plotted against depth (ft) of the point for Lake Havasu points collected in September 2011. Maximum observed depth of rooted plants was 30 ft.
GRI#4008: Lake Havasu Aquatic Plant Interim Report
Mississippi State University Page 28
Figure 7. Spiny naiad (Najas marina) locations in Lake Havasu from September 2011 survey.

GRI#4008: Lake Havasu Aquatic Plant Interim Report
Mississippi State University Page 29
Figure 8. Scott Watson (formerly with GRI) holding a dense growth of spiny naiad (Najas
marina) obtained from a point intercept sampling rake toss in the bay off of Lake Havasu City (background), in more than 25 ft of water depth. Photo by John Madsen.

GRI#4008: Lake Havasu Aquatic Plant Interim Report
Mississippi State University Page 30
Figure 9. Depth distribution of spiny naiad in Lake Havasu, as the proportion of points (0 to 1) at each depth which had spiny naiad present in September 2011 survey.

GRI#4008: Lake Havasu Aquatic Plant Interim Report
Mississippi State University Page 31
Figure 10. Map of the distribution of sago pondweed (Stuckenia pectinata) in Lake Havasu from a September 2011 survey.

GRI#4008: Lake Havasu Aquatic Plant Interim Report
Mississippi State University Page 32
Figure 11. Sago pondweed (Stuckenia pectinata) depth distribution, as proportion of all points at each depth in which sago pondweed is present, from a September 2011 survey of Lake Havasu.

GRI#4008: Lake Havasu Aquatic Plant Interim Report
Mississippi State University Page 33
Figure 12. Southern naiad (Najas guadalupensis) locations in Lake Havasu from a Septemebr 2011 point intercept survey.

GRI#4008: Lake Havasu Aquatic Plant Interim Report
Mississippi State University Page 34
Figure 13. Depth distribution of southern naiad (Najas guadalupensis) by proportion of points at each depth interval with southern naiad present in Lake Havasu from a September 2011 survey.

GRI#4008: Lake Havasu Aquatic Plant Interim Report
Mississippi State University Page 35
Figure 14. In many areas of Lake Havasu, large mats of dead floating plants were observed during the plant survey in September 2011. The main constituents of these mats were southern naiad, spiny naiad, and sago pondweed. Photo by John Madsen, GRI.

GRI#4008: Lake Havasu Aquatic Plant Interim Report
Mississippi State University Page 36
Figure 15. Depth distribution of chara (Chara sp.) by proportion of points per depth interval from a September 2011 survey of Lake Havasu.
GRI#4008: Lake Havasu Aquatic Plant Interim Report
Mississippi State University Page 37
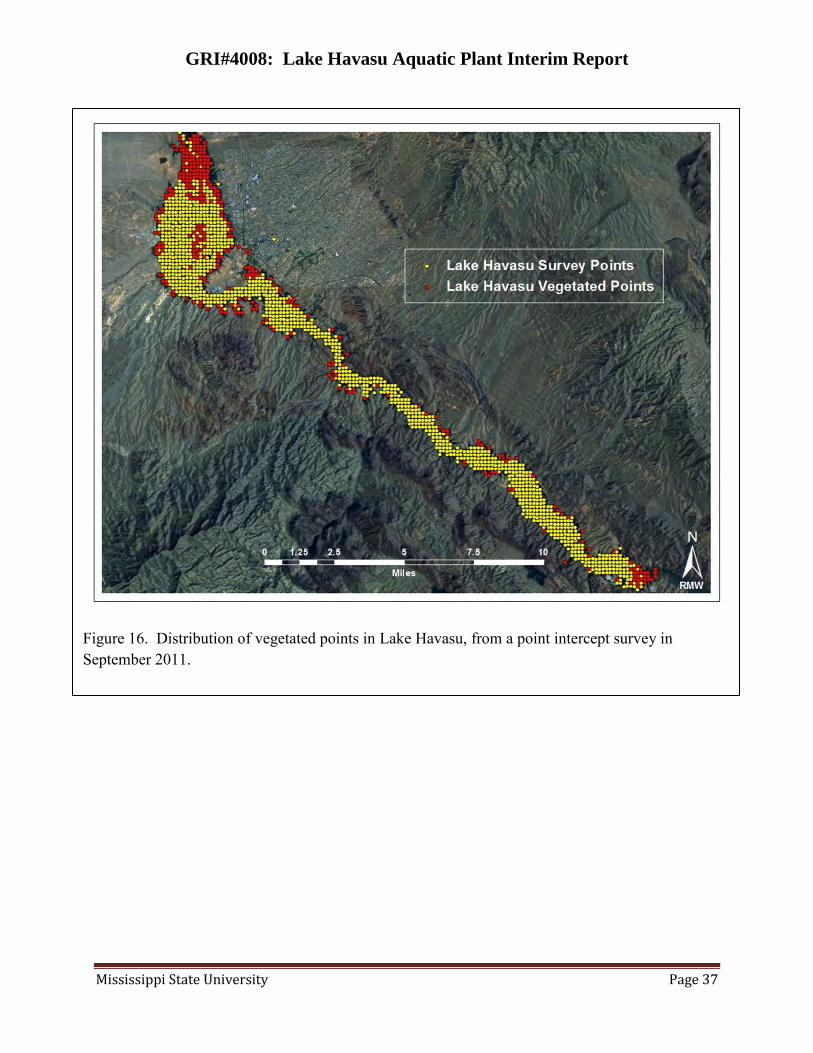
Figure 16. Distribution of vegetated points in Lake Havasu, from a point intercept survey in September 2011.

GRI#4008: Lake Havasu Aquatic Plant Interim Report
Mississippi State University Page 38
Figure 17. Depth distribution of points with vegetation, as a proportion of all points, from a point intercept survey of Lake Havasu in September 2011.

GRI#4008: Lake Havasu Aquatic Plant Interim Report
Mississippi State University Page 39
Figure 18. Distribution of Eurasian watermilfoil (Myriophyllum spicatum) in Lake Havasu from a September 2011 survey.

GRI#4008: Lake Havasu Aquatic Plant Interim Report
Mississippi State University Page 40
Figure 19. Eurasian watermilfoil (Myriophyllum spicatum) found in Lake Havasu on a reconnaissance trip, June 22, 2011. Photo by John Madsen, GRI.

GRI#4008: Lake Havasu Aquatic Plant Interim Report
Mississippi State University Page 41
Figure 20. Continuous water temperature averaged every hour for June 24 to September 10, 2011 for probes placed near Bill Williams North, Bill Williams South, and Partnership Point.

GRI#4008: Lake Havasu Aquatic Plant Interim Report
Mississippi State University Page 42
Figure 21. Biomass (grams dry weight per square meter) of sago pondweed, spiny naiad, southern naiad, and chara monthly from June through October 2011 for four sites in Lake Havasu.

GRI#4008: Lake Havasu Aquatic Plant Interim Report
Mississippi State University Page 43
Figure 22. Phenological stage of southern naiad, spiny naiad, and sago pondweed at Bill Williams South (Lake Havasu) for monthly samples in 2011. The Y axis is the proportion of samples (from zero to one) which have that growth stage of the species.

GRI#4008: Lake Havasu Aquatic Plant Interim Report
Mississippi State University Page 44
Figure 23. Phenological stage of southern naiad, spiny naiad, and sago pondweed at Bill Williams North (Lake Havasu) for monthly samples in 2011. The Y axis is the proportion of samples which have that growth stage of the species.

GRI#4008: Lake Havasu Aquatic Plant Interim Report
Mississippi State University Page 45
Figure 24. Phenological stage of southern naiad, spiny naiad, and sago pondweed at Standard Wash (Lake Havasu) for monthly samples in 2011. The Y axis is the proportion of samples which have that growth stage of the species.

GRI#4008: Lake Havasu Aquatic Plant Interim Report
Mississippi State University Page 46
Figure 25. Phenological stage of southern naiad, spiny naiad, and sago pondweed at Thompson Bay (Lake Havasu) for monthly samples in 2011. The Y axis is the proportion of samples which have that growth stage of the species.

GRI#4008: Lake Havasu Aquatic Plant Interim Report
Mississippi State University Page 47
Figure 26. Percent of the dead floating plant mat composed of sago pondweed (top), southern naiad (center), and spiny naiad (bottom) at the Mark Wilmer pumping station, as collected by station personnel in 2011.

GRI#4008: Lake Havasu Aquatic Plant Interim Report
Mississippi State University Page 48
Figure 27. Mats of predominantly southern naiad forming in the Bill Williams bay area, September 2011.

GRI#4008: Lake Havasu Aquatic Plant Interim Report
Mississippi State University Page 49
Figure 28. Mat floating in the open water on Lake Havasu, September 7, 2011. Metro pumping station on California side is visible in the background.

GRI#4008: Lake Havasu Aquatic Plant Interim Report
Mississippi State University Page 50
Figure 29. First drone release location in Bill Williams on September 10, 2011.

GRI#4008: Lake Havasu Aquatic Plant Interim Report
Mississippi State University Page 51
Figure 30. Drone release location at the mouth of the pump inlet in Bill Williams on September 10, 2011.

GRI#4008: Lake Havasu Aquatic Plant Interim Report
Mississippi State University Page 52
Figure 31. Final drone release location in Bill Williams on September 10, 2011.

GRI#4008: Lake Havasu Aquatic Plant Interim Report
Mississippi State University Page 53
Figure 32. First drone release location in Bill Williams on October 9, 2011.

GRI#4008: Lake Havasu Aquatic Plant Interim Report
Mississippi State University Page 54
Figure 33. Drone release surrounding the peninsula in Bill Williams on October 9, 2011.