lake erie monitoring - ohio epa home€¦ · · 2014-04-07lake erie monitoring justin chaffin...
TRANSCRIPT

Lake Erie Monitoring Justin Chaffin
Stone Laboratory and Ohio Sea Grant
The Ohio State University
Song Qian, Thomas Bridgeman
Lake Erie Center
University of Toledo OWRC – Water Monitoring Work Group Meeting March 21, 2014

Groups monitoring the western basin
LAKE BOTTOM OR THERMOCLINE
OEPA Nearshore USGS Sandusky
ODNR
Univ Toledo USGS Ann Arbor OSU Stone Lab
Fishing
Charter Boats

Water Collection Methods
LAKE BOTTOM OR THERMOCLINE
OEPA Nearshore (most samples)
USGS Sandusky ODNR
Univ Toledo USGS Ann Arbor OSU Stone Lab
Fishing
Charter Boats
1 meter, pooled
Mid depth, pooled
1 meter above bottom, pooled
Surface to 2x Secchi depth
Surface to 1 meter above sediments
(up to 8 meter)
Surface to 2 meter
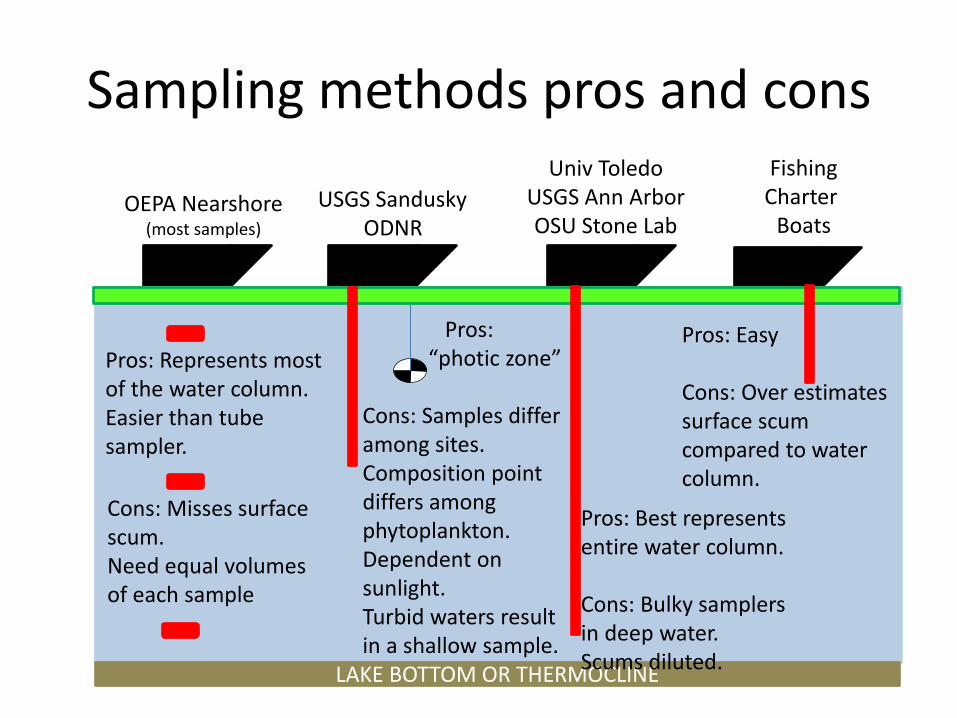
Sampling methods pros and cons
USGS Sandusky ODNR
Univ Toledo USGS Ann Arbor OSU Stone Lab
Fishing
Charter Boats
LAKE BOTTOM OR THERMOCLINE
Pros: Represents most of the water column. Easier than tube sampler.
Cons: Misses surface scum. Need equal volumes of each sample
Pros: Best represents entire water column. Cons: Bulky samplers in deep water. Scums diluted.
Pros: Easy Cons: Over estimates surface scum compared to water column.
Pros: “photic zone”
Cons: Samples differ among sites. Composition point differs among phytoplankton. Dependent on sunlight. Turbid waters result in a shallow sample.
OEPA Nearshore (most samples)

Sampling Frequency
LAKE BOTTOM OR THERMOCLINE
OEPA Nearshore USGS Sandusky
ODNR
Univ Toledo USGS Ann Arbor OSU Stone Lab
Fishing
Charter Boats
One a month Every-other week Grid sample Jun& Sept
Every-other week Event-based
Every-other week Event-based

Water Quality Analyzes
LAKE BOTTOM OR THERMOCLINE
OEPA Nearshore USGS Sandusky
ODNR
Univ Toledo USGS Ann Arbor OSU Stone Lab
Fishing
Charter Boats
TP, Chlorophyll a DRP (SRP), Nitrate, Microcystin, Phytoplankton
TP, Chlorophyll a Phytoplankton
TP, Chlorophyll a DRP (SRP), TDP, Nitrate, Nitrite, Silicate, Ammonium, Total Kjeldahl N, Microcystin**, Phytoplankton, Microcystis biovolume
TP, Chlorophyll a DRP (SRP), Nitrate, Microcystin, Phytoplankton
*Different analysis methods ** UT does not regularly measure Microcystin
Water Quality Analyzes
LAKE BOTTOM OR THERMOCLINE
OEPA Nearshore USGS Sandusky
ODNR
Univ Toledo USGS Ann Arbor OSU Stone Lab
Fishing
Charter Boats
TP, Chlorophyll a* DRP (SRP), Nitrate, Microcystin, Phytoplankton
TP, Chlorophyll a* Phytoplankton
TP, Chlorophyll a* DRP (SRP), Nitrate, Microcystin, Phytoplankton
*Different analysis methods
TP, Chlorophyll a* DRP (SRP), TDP, Nitrate, Nitrite, Urea, TDN, Ammonium, Total Kjeldahl N, Silicate, Total SS, NVSS, Microcystin, Phytoplankton, Microcystis biovolume
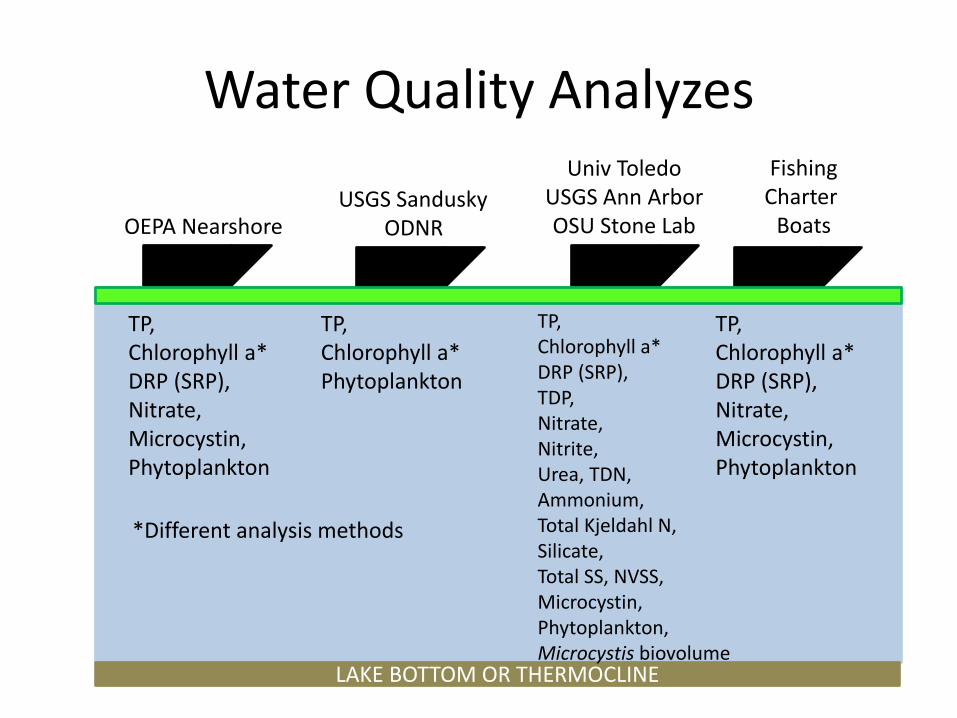


A Bayesian Hierarchical Modeling Approach for Comparing Water Quality Measurements from
Different Sources
• Song Qian and Thomas Bridgeman – University of Toledo
• Other team members: – OSU Stone Lab, USGS, Univ. Michigan, Ohio EPA,
Ohio DNR, Heidelberg University
• Funded by University of Michigan Water Center, Graham Sustainability Institute
• Ohio EPA provided funding in 2013
• Ohio Sea Grant/ Stone Lab REU program

Question and Project Phases:
• Do the different data sets differ, and if so, is there a conversion factor we can use?
• Phase 1: Compile existing data from the different institutions and develop models linking measurements (Song Qian – UT).
• Phase 2: Field study to compare side-by-side water samples that were collected using multiple sampling methods (Chaffin – OSU, Bridgeman – UT)

Sampling equipment
LAKE BOTTOM OR THERMOCLINE
OEPA Nearshore USGS Sandusky
ODNR
Univ Toledo USGS Ann Arbor OSU Stone Lab
Fishing
Charter Boats
Van Dorn Sampler Integrated Tube Samplers
Photo Credit: Justin Chaffin

Water Collection Methods
LAKE BOTTOM OR THERMOCLINE
OEPA Nearshore (most samples)
USGS Sandusky ODNR
Univ Toledo USGS Ann Arbor OSU Stone Lab
Fishing
Charter Boats
1 meter, pooled
Mid depth, pooled
1 meter above bottom, pooled
Surface to 2x Secchi depth
Surface to 1 meter above sediments
(up to 8 meter)
Surface to 2 meter

Overall Study Methods
• Sampled July 15 to October 29 2013
• 4 water samples collected at each site/date using the 4 different methods
– Samples within 0.5 m were considered the same
• TP ranged from 0.0084 to 0.1829 mg P/L
• Chl a ranged from 3.9 to 127.8 µg/L
• 224 samples analyzed
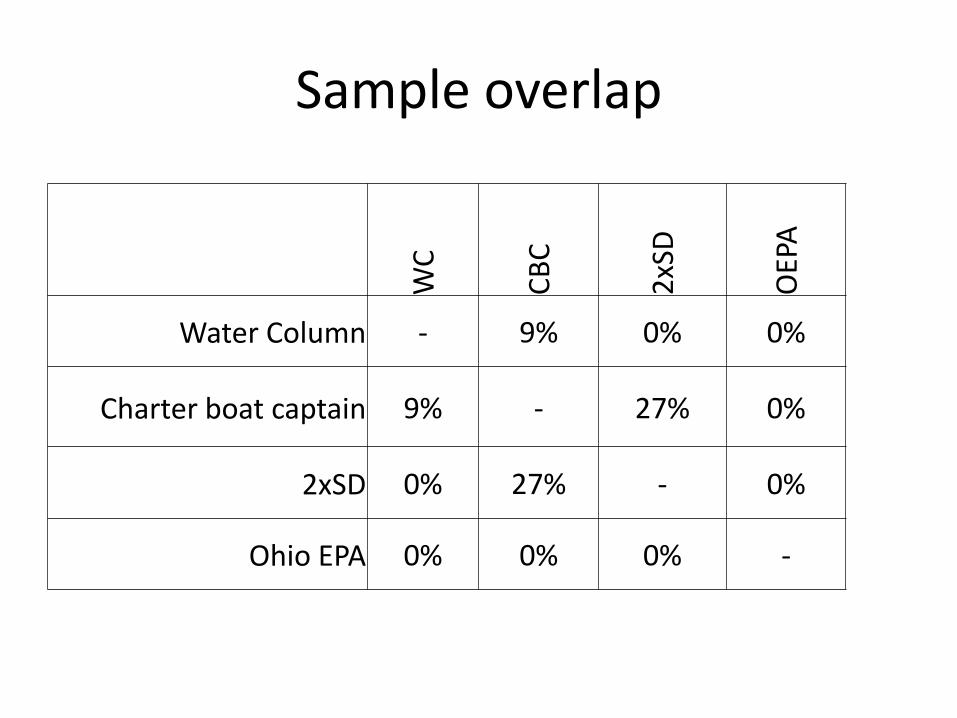
Sample overlap
WC
CB
C
2xS
D
OEP
A
Water Column - 9% 0% 0%
Charter boat captain 9% - 27% 0%
2xSD 0% 27% - 0%
Ohio EPA 0% 0% 0% -

Looking for a conversion factor
• The water column sample (surface to sediments) is “main sample” because this method is more likely to capture a stratified algal bloom.
• The other 3 methods are comparison samples.
– Data normalized to the water column sample.
– Normalized value can be a conversion factor.
– Example: Chl a ug/L Chl a normalized WC 10 1.00 CBC 20 2.00 2xSD 5 0.50 OEPA 15 1.50

Average normalized values are near 1.0, but the range is wide.
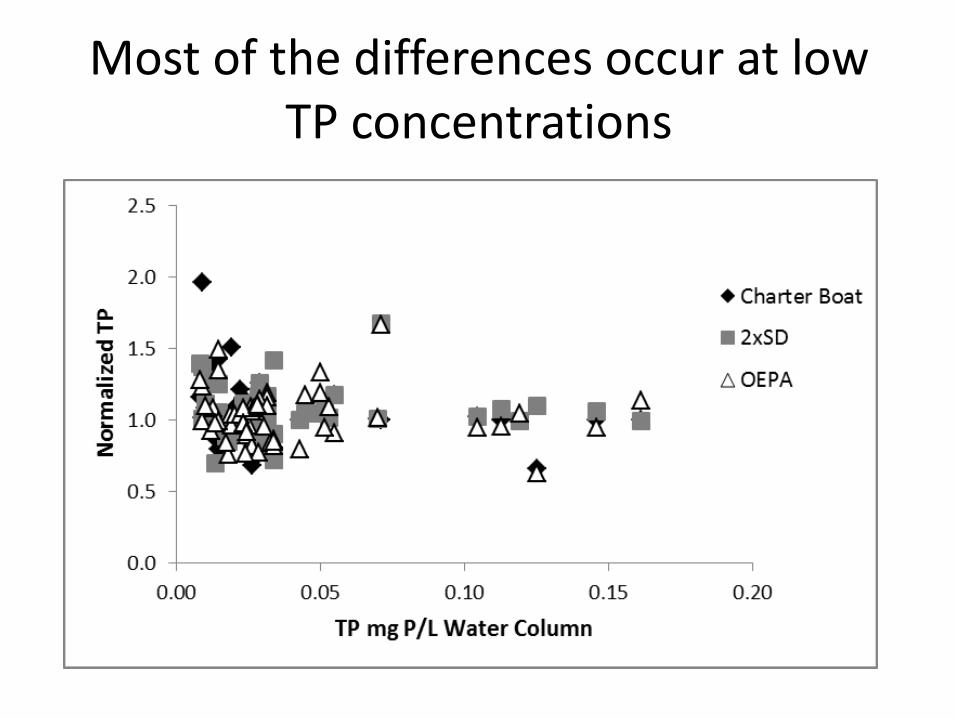
Most of the differences occur at low TP concentrations

Most of the differences occur at chl a concentration below 50 ug/L

Regression between WC data and comparison samples.

Regression between WC data and comparison samples.

Scum sample: July 15 2013 Central Basin

Conclusions
• The different water collection methods give similar data at high concentrations. – For example: chl a 100 ug/L compared to 115 ug/L
– Both considered “high chl a and eutrophic”
• Differences in data increases at low concentrations. – For example: chl a 3 ug/L compared to 6 ug/L
– Both considered “low chl a and oligotrophic”
– But the difference between samples is 2X.
• Scum samples results in differences in chl a.

In progress, next steps
• Building models to compare data collected from institutions in recent years
• Continued sampling in 2014.

Acknowledgements
• Funding: Ohio EPA, Univ. Michigan
• Data sources: Ohio EPA, ODNR, USGS
• Field assistance: Sam McCoy and Stone Lab seasonal staff 2013