lake effect and lake enhanced snow in the … · lake effect and lake enhanced snow in the...
TRANSCRIPT

1
EASTERN REGION TECHNICAL ATTACHMENTNO. 2000-05
DECEMBER, 2000
LAKE EFFECT AND LAKE ENHANCED SNOW IN THE CHAMPLAIN VALLEY OF VERMONT
Alexander TardyNOAA/National Weather Service
Burlington, Vermont
Editor's Note: The author's current affiliation is WFO Sacramento, California
1. INTRODUCTION
The weather phenomena known as lake effectsnow has long been documented for the GreatLakes Region (Peace and Sykes 1966;Holroyd 1971; Lavoie 1972; Niziol et al.1995). The snowfall associated with theselarge bodies of water usually has a significantimpact on people and aviation several timeseach winter. Recent software such has theBuffalo Toolkit ,called BUFKIT (Mahoneyand Niziol 1997) has enabled forecasters topredict the magnitude, areal coverage, andduration of these mesoscale events. Also, lakeeffect forecasting has improved with thedevelopment of high resolution models thatrecognize local terrain features and theexistence of large lakes. Less literature existsabout snow produced by smaller bodies ofwater (Carpenter 1993; Cosgrove et al. 1996),mainly because it does not fall at establishedobserving sites, affects few people, and occursinfrequently. However, since the recentinstallation of a Weather Surveillance Radar-1988 Doppler (WSR-88D) near Burlington,Vermont, several events have occurred thatexhibit similar characteristics and effects asthose associated with Great Lakes snows.
The purpose of this study is to analyzesnowfalls associated with Lake Champlainwith the use of Doppler radar data,Geostationary Operational EnvironmentalSatellite (GOES-8) data, and high resolutionnumerical output from the Meso-Eta (Black1994) model. The impact of these snowfallscan be as great as synoptic scale storms. Themost common result of arctic air crossing therelatively warmer Lake Champlain is lowclouds and flurries. However, on rareoccasions snow squalls with visibilities lessthan a 1/4-mile and up to 33-cm (13 inches) ofpure lake effect snow in a 12-h period havebeen observed. This paper will explore eventswhich fit the category of lake effect or lakeenhanced, and develop criteria for forecastingthem.
2. BACKGROUND
Lake Champlain straddles the border ofNorthern Vermont and Northern New York(Fig. 1). This narrow body of water isoriented north to south and is approximately200-km long with a maximum width of 19-km. The great length of the lake makes it oneof the largest bodies of fresh water in theUnited States covering 1127 km2. Several

2
large islands are located in the northernportion of the lake. The lake averages 20-mdeep, but the greatest depth is 122-m. Thelake level is normally between 29 and 30-mabove mean sea level (MSL).
A gradual upward-sloping valley extends tothe east of the lake with more rugged terrainalong the western side in New York. Thecommunities of Burlington and St. Albans,Vermont, and Plattsburgh, New York, have acombined population of more than 110,000.Their proximity to the water allows variouslake influences on local weather with direct orindirect effects.
3. DATA and METHODOLOGY
Events were selected by using 1996-1998archived Doppler radar data from the WSR-88D located in Colchester, Vermont (KCXX),which is 3 miles north of the BurlingtonInternational Airport (Fig. 1). The radar’sproximity to the lake makes it ideal forstudying lake effect snow since the radar beamwill intersect the lowest levels of anyprecipitation and clouds. The elevation ofKCXX is 131-m (431-ft) above MSL. Todefine an event, composite reflectivity dataand velocity azimuth display (VAD) windprofiles (VWPs) were examined to identifyechoes downwind of the lake. An event wasclassified as lake effect if it had an elongatedband of precipitation downwind of the lake,and was not associated with any obvioussurface boundary or wind shifts. A lakeenhanced event was determined to be thosecases when radar showed a convective cellularshaped area of precipitation that originated orenhanced over the open waters, while therewas other convective activity upwind of thelake. The lake enhanced events wereassociated with moving or stationary surfaceboundaries. The events associated with anobvious synoptic scale system were not used
(e.g., widespread snow on the western side ofa low). The period of an event was based onheaviest snowfall estimated from compositereflectivity products.
Lake Champlain water temperatures wereobtained from the Lake ChamplainTransportation Company at the Kings StreetFerry Dock in Burlington. The instrument is1.8 meters under the water. Lake Champlainusually freezes over by January or February,but the open waters did not freeze from 1996to 1998. Surface wind speeds, wind directionsand air temperatures over the lake werecollected from instrument sites at the SandbarState Park (SAN), operated by VermontElectric Company, and the Colchester Reef(CRF), operated by Vermont MonitoringCooperative. Data were not available forSAN after November 1996. Figure 1 showsthat both locations, especially CRF, representconditions over the open water. Land airtemperatures and wind data were taken fromthe Automated Surface Observing System(ASOS) at the Burlington InternationalAirport (KBTV). The average wind velocityduring the period of heaviest snowfall,determined by radar data, was used in thisstudy. Snowfall reports came from variousweather spotters and from the WFO inBurlington.
Numerical model output from the Meso-Eta inthe form of hourly soundings was evaluatedusing BUFKIT software. During the study,the Meso-Eta had a horizontal resolution of29-km and vertical resolution of 50 levels, butit was not sufficient to resolve a 19-km wideLake Champlain. Wind data for these modelsoundings were compared with those depictedon the VWP. Using BUFKIT, the wind andtemperature from the Meso-Eta were takenfrom the nearest data level of the native gridfor the specified height. BUFKIT allows theoperator to enter the lake surface temperaturewhich is used to calculate forecast instability
3
over the open water. The instability iscategorized as none, conditional, moderate, orextreme and is based on differences betweensurface to 850-mb and surface to 700-mbtemperatures (Niziol 1987; Niziol et al. 1995).In addition, model sounding parameters suchas mean layer wind shear and heights ofinversion level were analyzed against theVWP during the event. The critical over-the-water fetch was determined by using the mean1,000 to 5,000-ft level wind from the VWP.
Upper air, surface, and satellite data wereexamined with the use of the GeneralMeteorological Package Analysis andRendering Program (GARP; Jesuroga et al.1997). Upper air analyses were restricted toobserved data at 1200 and 0000 UTC, whilethe surface plots were available each hour.GARP was used to analyze the surface plots.Satellite data were obtained from GOES-8infrared [10.7 microns (µm)] and visible (0.65µm) imagery.
4. EVENTS
Eight events from 1996 through 1998 wereselected to study. It was determined thatcertain synoptic scale patterns wereresponsible for producing lake effect versuslake enhanced snow events. All eight eventsare defined in Table 1. Five of the eight caseswere considered the lake effect type.
4.1 Lake effect bands
In the five lake effect events, a strong area ofhigh pressure (1028-mb to 1045-mb) extendedfrom the Midwest states north across the GreatLakes and Ontario. The surface pressuregradient associated with this pattern produceda northerly wind over Lake Champlain. Thiswind direction allows for the greatest fetch.
To generate vertical velocities sufficient todevelop clouds and precipitation, sufficientatmospheric instability must be present overthe open water. The average surface to 700-mb lapse rate was found to be 24C° for thefive cases. This magnitude would becategorized as bordering between“conditional” and “moderate” instability fromthe surface to 700-mb (Mahoney 2000). CRFand SAN observations showed that the airover the water warmed by 0.7°C to 2.5°Cduring each snow event. The average winddirection at KBTV was observed to back by10 to 20 degrees compared with CRF winds inthree cases. A recent study by Cosgrove et al.(1996) determined that the most importantfactors for lake effect snow from the similarsized Finger Lakes in New York (orientednorth to south) were; fetch, wind direction,and 850-mb to water temperature differential.
A description of each of the five lake effectevents follows.
Lake effect case 1
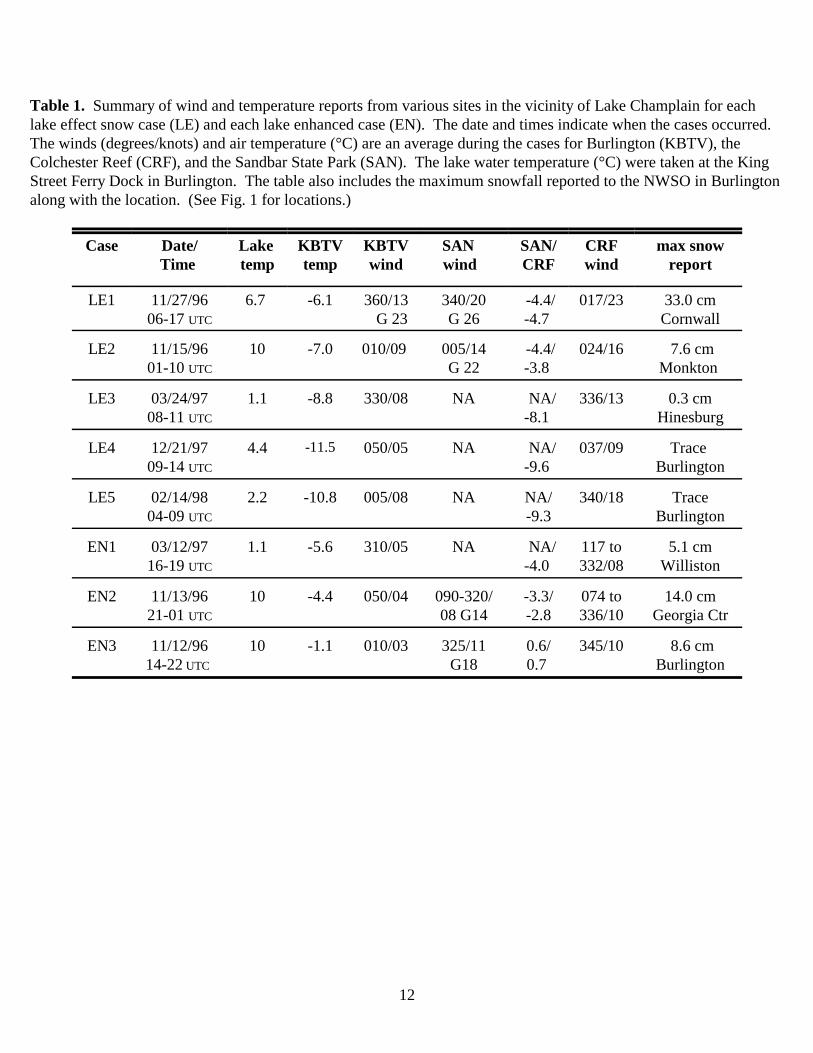
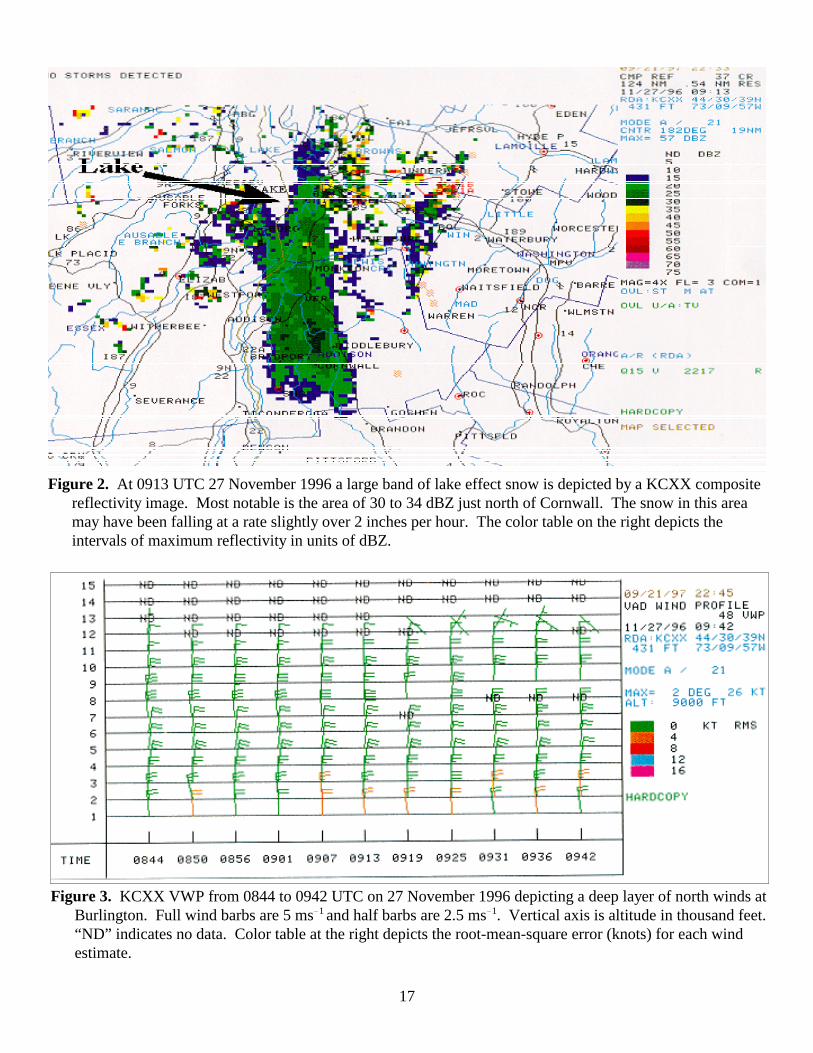
On 27 November 1996, an extraordinary andextended lake effect event unfolded. Twodistinct and large bands of snow were depictedby Doppler radar with reflectivity intensitiesranging from 20 to 34 dBZ at 0913 UTC (Fig.2). These persistent bands channeled downthe Champlain Valley and merged over thesouthern end of the lake for more than 12hours. The heaviest snow occurred between0600 and 1700 UTC 27 November. A total of33-cm (13 inches) of snow fell in the town ofCornwall (see Fig. 1). Based on this report itwas estimated that the snow was falling at arate of 2.5 to 5.1-cm (1 to 2 inches) per hourwithin the nearly stationary band. The VWPdata in Fig. 3 and Table 2 show unidirectionalnorth winds from the surface to 11,000-ft.This resulted in winds parallel to the long axisof the lake, approximately an 85-km over-lake

4
fetch. In addition, Table 1 shows surfacewinds at KBTV, SAN, and CRF were fromthe north at 13 to 26 knots. The Meso-Etaforecast sounding at 0900 UTC indicatedminimal shear in a surface to 7,000-ft layer(Table 3 and Fig. 4) with relative humiditiesgreater than 90 percent. Using the laketemperature of 7°C (Table 1) as the surfacetemperature, the Meso-Eta indicatedconditional instability with a surface to 700-mb lapse rate of 22C°. Conditional instabilityis sufficient to produce lake effect snow if it isaccompanied by cyclonic vorticity advectionat 500-mb and the airmass trajectories arealong the longest fetch of the lake (Niziol1987). It is interesting to note that the surfaceto 850-mb lapse rate was 24C°, which isconsiderably more unstable than the surface to700-mb. For this case, the instability below850-mb was more crucial than the surface to700-mb lapse rate. This more than satisfiesprevious studies by Niziol (1987) and Holroyd(1971) which stated that pure lake effectrequires a lake surface to 850-mb temperaturedifference of at least 13C° (dry-adiabatic lapserate).
The 1000 UTC 27 November 1996 surfaceanalysis has a 1040-mb high pressure areabuilding into the Great Lakes with a northeastgeostrophic flow over Vermont (Fig. 5).Upper air data at 1200 UTC depicted an open500-mb trough over eastern New Englandwith a cold pool of air (-33°C) over southernVermont (Fig. 6A). Figure 6B shows anortherly 850-mb flow with the -16°Cisotherm advecting into the Champlain Valley.Visible satellite images during the morninghours showed two distinct bands of cloudsmerging over the southern end of the lake (notshown). The 27 November 1996 case met theimportant factors in the study by Cosgrove etal. (1996), as northerly winds set up over thelongest fetch of Lake Champlain, and steeplapse rates existed from the lake through 850-mb.
Lake effect case 2
Another lake effect event occurred on 15November 1996 from 0100 to 1000 UTC.The lake water temperature was 10°C and anarctic blast produced 850-mb temperatures of-16°C. The Meso-Eta run from 1500 UTC 14November (Fig. 7) forecast “extreme” lakeinduced instability (Table 4). A 1045-mb highpressure area was centered over OntarioCanada allowing for a northeast pressuregradient over Lake Champlain (Fig. 8). The500-mb trough heights were near 552-dm(Fig. 9). The Meso-Eta forecast of an 8,000-ftdeep boundary layer was verified by theKCXX VWP (Tables 2 and 4). However,unlike the lake effect case 1, there was 30 to40 degrees of wind shear (Fig. 10), but themean 1,000-ft to 5,000-ft winds were 360degrees at 20-kt providing a nearly idealtrajectory. But the degree of directional windshear is detrimental to well-organized activityaccording to Niziol et al. (1995). Thecomposite reflectivity at 0459 UTC 15November showed a well-defined band of 15to 25 dBZ snow extending from the southernend of Lake Champlain and the fetch appearedto be 37 to 46-km (Fig. 11). GOES-8 10.7 µmsatellite images at 0915 UTC showed anenhanced (-18°C) area of cold cloud topssoutheast of Lake Champlain (Fig. 12). Theauthor during this event observed visibilitiesof 1 statue mile or less near Monkton at 0530UTC (Fig. 1). In addition, orographicenhancement was evident as snowfall ratesincreased in the higher terrain away from thelake shore.
Lake effect case 3
The importance of the fetch length over anarrow lake was evident with the lake effectevent on 24 March 1997. Compositereflectivity images showed very lightprecipitation from 0800 to 1100 UTC (not

5
shown). The Meso-Eta forecasted a surface to700-mb instability in the “moderate” category,with a surface to 850-mb lapse rate of 22C°(Table 4). Air temperature at KBTV droppedto -9°C which was colder compared with thelake surface temperature at 1°C. The meanwind observed and forecast for the 1,000-ft to5,000-ft level was 320 degrees which alloweda short fetch of 19 to 24-km. This fetch isonly 12 percent of the possible length of LakeChamplain, which is not sufficient fororganized lake effect despite moderateinstability, minimal directional shear andcyclonic vorticity advection (Niziol 1987).Another limiting factor, not seen in lake effectcases 1 and 2, was that the subsidenceinversion lowered to 5,000-ft as an arctic1032-mb high moved into western New York.This capping of the boundary layer has beenfound more significant to controlling lakeeffect than how much instability because indecreases the depth of the unstable layer (Byrd1992). The inversion height was also found tobe a significant limiting factor in a study oflake effect snow from the Great Salt Lake(Carpenter 1993). A light covering of snowwas reported in Hinesburg (Fig. 1) on 24March. KBTV reported a visibility of 6 statuemiles with light snow and Marginal VisualFlight Rules (MVFR) from a low cloudceiling.
Lake effect case 4
A weak north-south oriented band of lakeeffect snow developed on 21 December 1997and lasted from 0900 to 1400 UTC. Thesynoptic scale pattern showed an area of highpressure building across Ontario producing aweak northerly flow over Lake Champlain and“conditional” instability (Table 4). Upper airanalyses depicted a 500-mb trough axis overhead with 534-dm heights (not shown).Meso-Eta forecasts indicated that an inversionwould lower to 2,000-ft above the model
terrain (Table 4). This strong inversion diddevelop as the KCXX radar observed verylight winds in the shallow boundary layer(Table 2). The subsidence inversion and lightwinds were the primary limiting factor in thiscase. Note that the Meso-Eta hourlysoundings from BUFKIT over-forecast thewind speed (Table 3). Radar showed only aweak return of reflectivity (0 to 16 dBZ) on 21December extending southeast of the lowerend of Lake Champlain (not shown). KBTVwas affected by low stratocumulus cloudswith MVFR conditions and flurries.
Lake effect case 5
A similar synoptic pattern to lake effect case4 was seen on 14 February 1998. Figure 13shows a band of -4 to 11 dBZ returnsextending downwind from the southern end ofthe lake and extending inland at 0756 UTC 14February 1998. The heaviest precipitation fellbetween 0400 and 0900 UTC. The VWP at0845 UTC suggests that the winds were froma favorable northerly direction (Fig. 14).However, a strong subsidence inversion mostlikely limited the vertical development ofclouds. Similar to lake effect case 4, Meso-Eta forecasts indicated that an inversion wouldlower to 2,000-ft above the model terrain(Table 4) suggesting that organized lake effectwould not materialize. However, model winddirection and speed did not verify well withdata obtained from the VWP (Table 2 and 3).The surface to 700-mb instability was forecastto be “conditional,” while the lake surface to850-mb temperature differential was noted tobe 16C°. It was interesting that the reflectivityimage in Fig. 13 appears to show a bend in theband of snow. This turning may be atopographic effect caused by precipitationbanking into the higher terrain. However, italso could be a reflection of more northerlyflow aloft as the precipitation is carried intohigher levels of the atmosphere with time.

6
4.2 Lake enhanced snow squalls
Mamrosh (1990) documented lake enhancedsnow squall activity from Lake Champlain.This documentation stated that LakeChamplain contributes sufficient warmth andmoisture to intensify the snow showers thataccompany a cold front or trough. In the threelake enhanced cases included in this study a500-mb long wave trough was present withheights ranging from 522 to 534 dm (notshown). A strong high pressure center of1040-mb or greater was present over centralCanada extending south into the MidwesternUnited States. The snow squalls occurredwith the passage of a cold front and continuedseveral hours afterwards. The events didshow characteristics similar to lake effect, butbased on the data could not be classified asthis type. In two cases, 13 November 1996and 12 March 1997, east winds at CRF didnot shift to a northwest flow until severalhours after the passage of the main surfacecold front. In the 13 November 1996 case thewind at Burlington remained out of the east(Table 1). These events suggest a low levelcirculation or convergence zone interactedwith lake moisture to produce intense snowsqualls (30 dBZ or greater).
A description of each of the three lakeenhanced cases follows.
Lake enhanced case 1
On 12 March 1997, an intense snow squalldeveloped over Lake Champlain shortly afterthe passage of an arctic surface trough. Mostof the snow shower activity occurred between1600 and 1900 UTC and was not confined todownwind of the lake. At 1714 UTC a lightsouth wind (8 knots or less) was observed atKBTV prior to the snow squalls. The surfacewind and the 1,000-ft VAD wind veered to thenorthwest by 1739 UTC at similar speeds
(Fig. 15). At this time heavy snow (30-39dBZ) began at KBTV resulting in 2.5 to 5.1-cm (1 to 2 inches) in about 30 minutes. At1809 UTC visibilities of less than a 1/4-milewere reported at KBTV.
Over the lake, the site at CRF showed an eastwind shifting to the northwest during a 15-mininterval from 1715 to 1730 UTC. It wasinteresting to note that simultaneously airtemperatures at CRF rose a bit more than 2°C.The warming could be a result of sensibleheating due to the advection of warmer airfrom the lake or latent heat release with theconvective snow band. The Meso-Etaindicated “moderate” to “extreme” instabilitywith a surface to 700-mb lapse rate of 31C°(Table 4). VWP data and Meso-Eta modelforecast soundings showed unidirectionalnorthwest winds (Table 2 and 3). The limitingfactor here was the short fetch over water (25-km). However, as Fig. 16 indicates, at 1745UTC a well-developed cell was identified bythe WSR-88D Storm Cell Identification andTracking algorithm (Operational SupportFacility 1996) originating over the open lake.This intense low level squall was formedbecause three important factors for convectionwere met; additional moisture from the lake,extreme instability from the water surface to850-mb temperature difference, and verticallift from low level circulation andconvergence associated with a secondarysurface trough (not shown), plus frictionalconvergence with water-land interactions(Niziol et al. 1995).
Lake enhanced case 2
A similar event occurred on 13 November1996, but the snow squalls that developedover Lake Champlain were more persistent(2100 to 0100 UTC). Surface observations atCRF showed an east wind abruptly shifting tothe northwest at 2230 UTC. At 2300 UTC the

7
wind at SAN also shifted from the east to thenorthwest at speeds around 10 knots. Airtemperatures at both sites were observed torise 1°C during the event. The VWP, in Fig.17, shows northerly winds in the lowest2,000-ft which is an ideal trajectory along thelake. Figure 18 depicts intense snow squallscontaining a few pixels of 40 dBZ with muchweaker reflectivity returns on the windwardside of the lake. The heaviest snow occurringat this time was estimated at a rate of 2.5 to5.1-cm (1 to 2 inches) per hour. The Dopplerradar image at 2230 UTC (Fig. 18)corresponds closely with a 2245 UTC 10.7 µmsatellite image (Fig. 19) indicating a southwestto northeast enhanced area of cold cloud tops(-21°C). The low level convergence zoneover the lake combined with “extreme” lake-induced airmass instability (surface to 850-mblapse rate of 26C°) resulted in boundary layerconvection (Table 2). Despite severedirectional wind shear seen on the VWP (Fig.17), the 1,000-ft to 2,000-ft wind trajectoriesallowed for a long over-water fetch (Table 2).Above this altitude the winds were backingwith increasing height associated with cold airadvection.
Surface observations at KBTV did not suggestthe passage of any surface trough consideringthat east winds prevailed with an airtemperature increase of 0.6C°. The 2300UTC surface analysis shows a 1036-mb highpressure center in the St. Lawrence Valleyproviding the gradient for north winds acrossLake Champlain (not shown), but there wasno indication of a surface trough. Consideringthe proximity of the high pressure allowing fora weak geostrophic flow, Burlington may havebeen experiencing a land breeze. In addition,Meso-Eta soundings indicated “extreme”instability with a subsidence inversion at7,000-ft (Table 3). The limiting factor in thiscase was the severe wind shear in the lowest5,000-ft observed on the VWP (Fig. 17) andsimulated in the Meso-Eta forecast (Table 2
and 3). The Meso-Eta soundings forecast forthe height of the inversion and the winddirections within this layer were near thoseobserved (Table 2 and 4). This convectiveevent was accompanied by extreme instability(26C° surface to 850-mb differential),convective latent heat release, and a persistentland breeze boundary providing the focusingmechanism (convergence zone) for lift (Byrdand Penc 1992; Peace and Sykes 1966). Peaceand Sykes (1966) also found that there areoften thermally and frictionally inducedconvergence zones over the lake when bandsof snow are aligned along the long fetch ofnarrow lakes. Furthermore, winds backingfrom 1,000 to 5,000-ft (Fig. 17) oriented thisband of convection so it was orographicallyenhanced over terrain as high as 1400-ft aboveMSL. Orographic lift combined with localflux of heat and moisture from the lake canraise the cap promoting further convectivegrowth (Niziol et al. 1995; Lavoie 1972).Niziol et al. (1995) also wrote that the heightand strength of the inversion determine thevertical extent of convective cloud growth onthe lee side of the Great Lakes.
Lake enhanced case 3
On 12 November 1996, numerous snowsqualls produced 8.6-cm (3.4 inches) inBurlington with occasional visibilities at 1/4-mile creating aviation and travel difficulties.Radar showed the intensity of the snow at1939 UTC on the east side of the lake (Fig.20). The precipitation occurred between 1400and 2200 UTC. The snow squalls occurredseveral hours after the passage of the mainsurface trough at 1100 UTC 12 November1996 (not shown). At this time surface windsat KBTV shifted to the north and prevailedthroughout the event. Average winddirections at SAN and CRF were between 320and 340 degrees at speeds of 10 knots (Table1). VWP data shows a persistent northerly

8
wind at 1,000-ft (Fig. 21) allowing for themaximum fetch over Lake Champlain. Abovethis layer directional shear was observed.Table 3 shows that the Meso-Eta did notforecast this wind profile, but insteadpredicted unidirectional winds at 300 degreesthroughout the 5,000-ft layer. The Meso-Etaindicated “extreme” instability at 2000 UTCwith surface to 700-mb lapse rates of 33C°.The GOES-8 10.7!m images (Fig. 22) showan enhanced area of cold cloud tops (-20°C to-25°C) that regenerated on the lee side of LakeChamplain during the event. The VWPdepicted backing winds with height suggestingstrong cold air advection (Table 2). A 1200UTC analysis at 850-mb supported this,showing cold air (-12°C to -16°C) advectingwith the northwest flow while a broad 500-mbtrough lay over the region (not shown). Thedepth of the boundary layer was adequate topromote convective cloud growth, but thedirectional wind shear might have been themain limiting factor. This case was similar tothe squalls that occurred on 13 November(lake enhanced case 2). However, this timethe land breeze or convergence zone was notevident. Radar confirmed that this was a lakeenhanced event since the more intenseconvective cells were over the open watersand downwind, while weaker activity wasseen upwind (Fig. 20). Local reports fromvarious NWS spotters showed 2.5-cm (1 inch)or less of accumulation outside the ChamplainValley of Vermont.
5. RESULTS AND FORECASTINGAPPLICATIONS
In five of the eight cases WSR-88Dreflectivity products indicated a band of snowdownwind from the lake, and it originatedover the open water with no other snowshowers in the Champlain Valley. The otherthree cases depicted intense snow squalls(cells with 30 dBZ or greater) on the lee side
of the lake with much weaker activity upwind.In every event, the mean 1,000-ft to 5,000-ftVAD winds were between 300 to 030 degrees,and the wind fetch across the open water was25-km or greater.
The eight cases presented in this paper clearlydemonstrate that Lake Champlain can affectthe local weather downwind of the lake,several hours after the arrival of arctic air.Cases similar to the 14 February 1998 event,lake effect case 5, (Fig. 13) have beenwitnessed to occur a few times during atypical winter. The installation of the WSR-88D has enabled these phenomena to beidentified and the data used to enhance shortterm weather forecasting. These situationsoften have a significant influence on publicand aviation forecasting. At times, skies willbe clear in much of the Champlain Valleywhile stubborn low clouds and flurries lingernear the lake in Burlington. In other situationsseveral inches of snow will accumulate.
This study indicates that the temperaturedifferential between the lake surface and 850-mb needs to be at least 15C° for thegeneration of lake effect snow. The 700-mbair temperature does not appear significantlyto affect the production of lake effect or lakeenhanced snow from Lake Champlain. Infact, the most significant lake event in thisstudy (lake effect case 1) had 700-mbtemperatures that were warmer than those at850-mb (Table 4). Wind direction fordetermining fetch length, surface to 850-mbinstability, depth of the mixed layer or heightof the subsidence inversion, and the winddirections within this defined boundary layerwere considered the most important forecastparameters. A numerical mesoscale modelrun for the Finger Lakes also found this to bethe case (Cosgrove et al. 1996). The heaviestsnow from lake effect will occur withsufficient instability, and a mean 1,000-ft to5,000-ft layer wind direction from the north

9
with speeds of 10 to 25 knots with minimalshear. This allows for the longest trajectoryover the open waters of Lake Champlain (Fig.1). Lake effect case 1, on 27 November 1996(Fig. 2), suggests that the ideal lake effectsituation would be to have a unidirectionalnorth wind with little wind shear within adeep boundary layer. However, this is a rareatmospheric occurrence and most cases haveseveral variables that limit the lake’s effectand present the forecaster with a challenge. Acritical limiting factor to the formation of lakeeffect snow may be subsidence (downwardvertical velocities) from the approaching areaof high pressure. The presence of a strongarctic high pressure system of at least 1025-mb is necessary to establish a northerly wind.However, this high pressure center will oftenresult in subsidence that lowers the boundarylayer with time (Pettersen 1956). Therefore,the window of opportunity is often limited toa few hours. For lake enhanced snow squalls,only a short time may be needed to rapidlyintensify the snow showers if it isaccompanied by other synoptic or mesoscaleforces.
The upper air synoptic scale pattern observedfor all the cases examined included a 500-mblong wave trough that provided neutral or coldair advection at this height. Once the troughaxis passes, cyclonic vorticity advectionbecomes negative or neutral and the snowfallbegan to decrease. However, sufficientinstability and north winds will promote weaklake effect that could be enhanced byadditional short waves within the northwestflow. At 850-mb, cold air advection isrequired in order to maintain adequateinstability for convective processes. Mostimportant, at least one surface boundary or anarctic cold front was depicted to move acrossthe lake during or preceding each lakeenhanced event. Table 1 shows two dramaticwind shifts that occurred over the open waters.These wind shifts were observed by
equipment at SAN and CRF. The change inwind direction that occurred in lake enhancedcase 2 on 13 November 1996 (Table 1) wouldhave gone undetected if it were not for theselake sites. The ASOS at KBTV did not detectany appreciable change in the wind directionor speed.
Forecasting these lake events will continue tobe a challenge as with any mesoscaleconvective phenomenon. In addition, theapparent infrequent nature of Lake Champlaineffect and enhanced snow does not allow theforecaster to attain sufficient experience. Theresolution of the operational numerical modelsis not sufficient to resolve an extremelynarrow valley.
This paper has examined radar data andmesoscale model forecasts that can be used tohelp forecast lake effect and lake enhancedsnow from a narrow north to south orientedbody of water. The first approach toforecasting these events is to examine theoverall synoptic pattern looking for a west toeast pressure gradient from the approachingarctic high pressure center. Additionaldynamic, thermodynamic, and kinematicatmospheric structures that requireinvestigation include a long wave 500-mbtrough, cold air advection at 850-mbproviding at least a 15C° water surface to 850-mb temperature differential, and meanboundary layer winds 300-010 degrees. Tosupport heavy lake effect snow, the verticalwind shear below the inversion needs to beminimal (less than 40 degrees), and the meanwind direction should be 340-010 degrees.Identification of a surface trough, which couldfurther enhance and focus the snow squalls,may be achieved by reviewing modelforecasted surface winds and convergence.
Many of these model forecast hourlysoundings and thermodynamic parameters canbe viewed with BUFKIT (Mahoney and

10
Niziol 1997). Using the forecast soundingsnear Burlington, important parameters such asinstability, inversion height (boundary layerdepth), and wind profiles can quickly beanalyzed for diagnosing possible lake events.Upper level support, such as positive vorticityadvection and/or short waves, could helpenhance any convective activity. Finally, theWSR-88D can be used for real-time shortterm forecasting of lake effect snow squallsand bands (Carter et al. 1996). The localKCXX radar’s close proximity to LakeChamplain allows for superior VWPrepresentation and reflectivity depictions. Therecent availability of 15-minute digital GOESsatellite images allow additional support toidentifying lake effect situations and trackingintensity trends. Furthermore, Burlington’smesonet, specifically hourly CRF data, can becombined with the VWP to get a completedepiction of the boundary layer conditions.
6. CONCLUSIONS
Lake effect and lake enhanced snow events dooccur in the Champlain Valley. On rareoccasions the impact on the local weather canbe as significant as the traditional Great Lakessnows. The availability of high resolutionmodels, application software like BUFKIT,15-minute digital satellite data, WSR-88Ddata, and local mesonets make it possible toissue short and long term forecasts for suchlocalized weather events.
The events discussed were mesoscale,therefore investigation of thermodynamic andkinematic profiles is crucial to narrow downthe potential window for theses events. Arcticcold air passing over a warmer lake alone isnot enough to produce clouds andprecipitation. This study showed that thelimiting influence of short fetches, directionalwind shear, and strong subsidence inversionscan prevent or weaken organized lake effect
snow. Once the potential for a lake influencedevent has been identified, the use of real-timeWSR-88D products can be used to trackdeveloping snow bands and squalls. Thisinformation can be incorporated into terminalaerodrome forecasts and public products suchas the short term forecast. Persistence andtrends would be the main factor indetermining actual snowfall totals for aparticular event. This study did not describehow reflectivity can approximately becorrelated with snowfall amounts. However,on going studies, such as those being done atthe WFO in Albany, toward developing arelationship between reflectivity and snowfallwill further improve our ability to forecastspecific snowfall rates in the future.
ACKNOWLEDGMENTS
The author would like to thank Paul Sisson ofWFO BTV, for his help in gathering data andfor time spent reviewing several drafts. Hewould also like to thank Tom Niziol from theWFO in Buffalo for additional input andsuggestions.

11
REFERENCES
Black, T. L., 1994: The new NMCmesoscale Eta model: Description andforecast examples. Wea. Forecasting, 9,265-278.
Byrd, G. P., and R. S. Penc, 1992: The LakeOntario Snow Event of 11-14 January1990, Preprints, 5th Conference onMesoscale Processes, Atlanta, GA,Amer. Meteor. Soc., J59-66.
Carpenter, D. M., 1993: The lake effect ofthe Great Salt Lake: Overview andforecast problems. Wea. Forecasting, 8,181-193.
Carter G. M., T. L. Salem Jr., M. A.Wool,1996: The use of new technologyfor enhanced snow forecasts in thevicinity of Lake Erie and Ontario,Preprints, 15th Conference on WeatherAnalysis and Forecasting, Norfolk, VA,Amer. Meteor. Soc., 567-572.
Cosgrove, B. A., S. J. Colucci, R. J.
Ballentine, J. S. Waldstreicher, 1996:Lake Effect Snow in the Finger LakesRegion. Preprints, 15th Conference onWeather Analysis and Forecasting,Norfolk, VA, Amer. Meteor. Soc., 573-576.
Holroyd, E. W., III, 1971: Lake effect cloudbands as seen from weather satellites. J.Atmos. Sci., 28, 1165-1170
Jesuroga, S., J. Cowie, S. Drake, D. Himes,1997: GARP: A software tool to displayand manipulate meteorological data,Preprints, 13th Intl. Conf. on InteractiveInformation and Processing Systems forMeteorology, Oceanography, andHydrology, Long Beach ,CA, Amer.Meteor. Soc., 359-361.
Lavoie, R. L., 1972: A mesoscale model oflake effect snowstorms. J Atmos. Sci,29, 1025-1040.
Mahoney, E. A., cited 2000: BUFKITDocumentation. [Available on-linefrom http://www.nws.noaa.gov/er/buf/bufkit/bufkitdocs.html.]
Mahoney, E. A., and T. A. Niziol, 1997:BUFKIT: A software application toolkitfor predicting lake-effect snow. Preprints 13th Intl. Conf. on InteractiveInformation and Processing Systems forMeteorology, Oceanography, andHydrology, Long Beach, CA, Amer.Meteor. Soc., 388-391.
Mamrosh, R. D., 1990, The prediction oflake enhanced snow squalls in theChamplain Valley of Vermont, EasternRegion Technical Attachment, No. 90-8c, 5 pp.
Niziol, T. A., 1987: Operational forecastingof lake effect snow in western andcentral New York Wea. Forecasting, 2,310-321.
Niziol, T. A., W. R. Snyder, J. S.Waldstreicher, 1995: Winter weatherforecasting throughout the EasternUnited States. Part IV: Lake effectsnow. Wea. Forecasting, 10, 61-76.
Operational Support Facility, 1996: WSR-88D Build 9.0 Precursor Training, 1-7.
Peace, R. L. Jr., and R. B. Sykes, Jr., 1966:Mesoscale study of a lake effect snowstorm, Mon. Wea. Rev., 94, 495-507.
Petterssen, S., 1956: Weather Analysis andForecasting, Vol. II. McGraw Hill, NewYork, 266 pp.
12
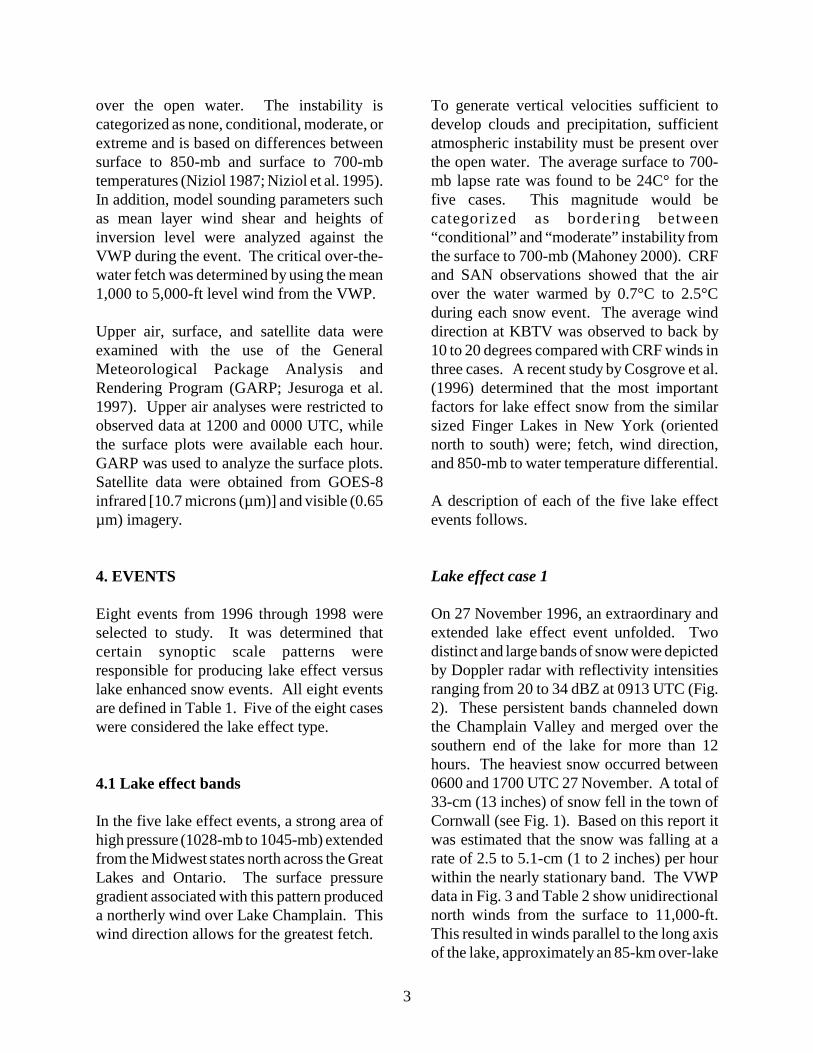
Table 1. Summary of wind and temperature reports from various sites in the vicinity of Lake Champlain for eachlake effect snow case (LE) and each lake enhanced case (EN). The date and times indicate when the cases occurred. The winds (degrees/knots) and air temperature (°C) are an average during the cases for Burlington (KBTV), theColchester Reef (CRF), and the Sandbar State Park (SAN). The lake water temperature (°C) were taken at the KingStreet Ferry Dock in Burlington. The table also includes the maximum snowfall reported to the NWSO in Burlingtonalong with the location. (See Fig. 1 for locations.)
Case Date/Time
Lake temp
KBTVtemp
KBTVwind
SAN wind
SAN/CRF
CRFwind
max snowreport
LE1 11/27/9606-17 UTC
6.7 -6.1 360/13 G 23
340/20 G 26
-4.4/-4.7
017/23 33.0 cmCornwall
LE2 11/15/9601-10 UTC
10 -7.0 010/09 005/14 G 22
-4.4/ -3.8
024/16 7.6 cmMonkton
LE3 03/24/9708-11 UTC
1.1 -8.8 330/08 NA NA/-8.1
336/13 0.3 cmHinesburg
LE4 12/21/9709-14 UTC
4.4 -11.5 050/05 NA NA/-9.6
037/09 Trace Burlington
LE5 02/14/9804-09 UTC
2.2 -10.8 005/08 NA NA/-9.3
340/18 TraceBurlington
EN1 03/12/9716-19 UTC
1.1 -5.6 310/05 NA NA/-4.0
117 to332/08
5.1 cm Williston
EN2 11/13/9621-01 UTC
10 -4.4 050/04 090-320/08 G14
-3.3/-2.8
074 to336/10
14.0 cmGeorgia Ctr
EN3 11/12/9614-22 UTC
10 -1.1 010/03 325/11G18
0.6/0.7
345/10 8.6 cmBurlington

13
Table 2. Observed wind direction (degrees) and speed (knots) from KCXX VWP for specified heights and timesduring each lake effect case (LE) and lake enhanced case (EN). The VAD depth was the level of the highest windavailable at the specified time. The mean fetch over open water was approximated using composite reflectivity dataand the mean wind direction from the 1000-ft to 5000-ft height above mean sea level (MSL).
Case Date/ Time ofVWP
1000 ft
2000 ft
3000 ft
4000 ft
5000 ft
Meanwind 1-5 kft
VAD depth (ft)
Shear 1-5 kft
(degrees)
Mean fetch (km)
1-5 kft
LE1 11/27/960907 UTC
360/20 360/25 360/25 010/25 360/20 360/23 11,000 0 to +10 85
LE2 11/15/960424 UTC
010/20 020/20 360/20 340/15 340/20 358/19 8,000 -30 to -40
37 to 45
LE3 03/24/970938 UTC
320/10 320/10 320/20 320/20 320/25 320/17 5,000 0 20 to 25
LE4 12/21/971112 UTC
050/05 360/05 350/05 050/05 NA 030/05 4,000 -10 to -50
37 to 45
LE5 02/14/980806 UTC
020/05 290/10 360/15 350/15 NA 345/11 4,000 -10 to -70
37
EN1 03/12/971739 UTC
300/05 290/20 300/20 300/20 300/25 298/18 11,000 0 to -10 25
EN2 11/13/960015 UTC
020/10 360/20 330/10 280/10 270/15 324/13 7,000 -110 30 to 37
EN3 11/12/962002 UTC
360/10 340/15 310/10 320/15 310/15 328/13 9,000 -50 30 to 37

14
Table 3. Meso-Eta forecast of wind direction (degrees) and speed (knots) from the KBTV hourly sounding forspecified heights and time during each lake effect case (LE) and lake enhanced case (EN). Also the mean winddirections and mean wind speeds are computed from the 5 heights listed in the table.
Case Time/Date run
SoundingHour/Date
1000 ft
2000 ft
3000 ft
4000 ft
5000 ft
Mean wind (1-5 kft)
LE1 1500Nov 26
0900Nov 27
350/25 355/28 005/30 010/30 010/30 362/29
LE2 1500Nov 14
0400Nov 15
355/11 360/12 360/10 340/11 325/13 348/11
LE3 1500Mar 23
1000 Mar 24
315/17 310/20 310/23 315/25 320/26 314/22
LE4 0300Dec 21
1100Dec 21
340/10 355/15 350/17 350/21 355/24 350/17
LE5 0300Feb 14
0800Feb 14
325/17 325/19 330/23 325/25 320/28 325/22
EN1 0300Mar 12
1900Mar 12
300/17 300/18 300/21 300/25 300/27 300/22
EN2 0300Nov 13
0000Nov 14
340/07 322/08 305/11 300/12 290/15 311/11
EN3 1500 Nov 12
2000 Dec 12
305/11 300/12 300/15 300/16 300/16 301/14

15
Table 4. Meso-Eta model forecast of temperatures at 850-mb and 700-mb from specified times during each lakeeffect case (LE) and each lake enhanced case (EN). Also included in the table are the observed lake watertemperatures (see Table 1), the temperature differentials between the lake and the respective level, the BUFKITinstability category (Mahoney 2000), and the base of the inversion layer.
Case Time/Date UTC
Laketemp °C
850 mbtemp °C
differ-ential C°
700 mbtemp °C
differ-ential C°
Instability Category
Inversion Base (ft)
LE1 0900 Nov 27 6.7 -17 24 -15 22 Conditional 7,000
LE2 0400 Nov 15 10.0 -16 26 -25 35 Extreme 8,000
LE3 1000 Mar 24 1.1 -21 22 -23 24 Moderate 7,000
LE4 1100 Dec 21 4.4 -12 16 -17 21 Conditional 2,000
LE5 0800 Feb 14 2.2 -16 18 -16 18 Conditional 2,000
EN1 1900 Mar 12 1.1 -17 18 -29 30 Moderate 10,000
EN2 0000 Nov 14 10.0 -16 26 -21 31 Extreme 7,000
EN3 2000 Nov 12 10.0 -11 21 -23 33 Extreme 16,000

16
Figure 1. Map of the Lake Champlain region with broken arrows showing mean wind trajectory (determinedby KCXX VWP and reflectivity products) during eight lake effect and lake enhanced events. Blue circlesindicate the location of snowfall observers. Red polygons mark the location of Colchester Reef and SandbarState Park.
17
Figure 3. KCXX VWP from 0844 to 0942 UTC on 27 November 1996 depicting a deep layer of north winds atBurlington. Full wind barbs are 5 ms!1 and half barbs are 2.5 ms!1. Vertical axis is altitude in thousand feet. “ND” indicates no data. Color table at the right depicts the root-mean-square error (knots) for each windestimate.
Figure 2. At 0913 UTC 27 November 1996 a large band of lake effect snow is depicted by a KCXX compositereflectivity image. Most notable is the area of 30 to 34 dBZ just north of Cornwall. The snow in this areamay have been falling at a rate slightly over 2 inches per hour. The color table on the right depicts theintervals of maximum reflectivity in units of dBZ.

18
Figure 4. Meso-Eta forecast sounding at KBTV (Burlington) for 0900 UTC 27 November 1996 from the 1500UTC 26 November run displayed with BUFKIT. The sounding depicts unidirectional north winds in a 7 kftlayer. The gray shaded area on the sounding shows the depth of the inversion. The left side of the displayshows were the lake temperature of 7°C was entered which resulted in “conditional” instability (Mahoney2000).
Figure 5. Surface analysis on 27 November 1996 at 1000 UTC. Solid lines are isobars contoured every 2-mb. Surface observations are shown on the map. Temperature and dew point temperature (°F) are on the leftside of each observation. Present weather, if applicable, is located between the two temperatures. Full windbarbs ar 5 ms-1 and half wind bards are 2.5 ms-1. Mean sea level pressure is located on the upper right of theobservations in units of tenths of a millibar. Sky condition, if available, is indicated by the shading of thecircle.

19
Figure 6. Upper air analyses from the Eta model on 27 November 1996 at 1200 UTC showing a 500-mb closedlow (A) and 850-mb cold air advection (B). Solid lines are geopotential heights drawn every 60-m (A) and30-m (B). Dashed lines are isotherms contoured every 2°C.

20
Figure 7. Meso-Eta forecast sounding for KBTV at 0400 UTC 15 November 1996 from the 1500 UTC 14November run displayed with BUFKIT. The sounding shows extreme instability over Lake Champlain. Gray shaded areas on the sounding indicates an inversion layer. The left side of the display shows that alake surface temperature of 10°C produced “extreme” instability.
Figure 8. Same as Fig. 5, except it is from 0500 UTC on 15 November 1996.

21
Figure 10. Same as Fig. 3, except it is from 5 November 1996 between 0401 and 0459 UTC. It depicts a trendtowards north winds in the lowest 3,000-ft layer. This coincides with the development of a moderate band(20-29 dBZ) of lake effect snow.
Figure 9. Eta model's 500-mb analysis at 1200 UTC 15 November 1996. Solid lines are geopotential heights(contoured every 60-m) and dash lines are isotherms (contoured every 2 °C). Upper air observations areshown.

22
Figure 11. KCXX composite reflectivity image at 0459 UTC 15 November 1996. A band of lake effect snowextending from the southern end of Lake Champlain produced a steady snowfall from 0100 to 1000 UTC on15 November 1996. The color table on the right depicts the intervals of maximum reflectivity in units ofdBZ.
Figure 12. GOES-8 10.7 µm satellite image at 0915 UTC on 15 November 1996 showing a band of lake effectenhanced cold cloud tops (-18°C is the dark blue) extending southeast of Lake Champlain.

23
Figure 13. KCXX composite reflectivity image at 0756 UTC 14 February 1998. A weak band of snow isdetected by radar on 14 February 1998. Reflectivity returns indicate that the band originates from the openwaters just southeast of Plattsburgh (PBG) and then curves south with the northerly flow. The color table onthe right depicts the intervals of maximum reflectivity in units of dBZ.
Figure 14. Same as Fig. 3, except it is for the period 0707 to 0845 UTC on 14 February 1998. It showsnortherly winds in a 3,000-ft layer with an occasional westerly component at 2,000-ft.
24
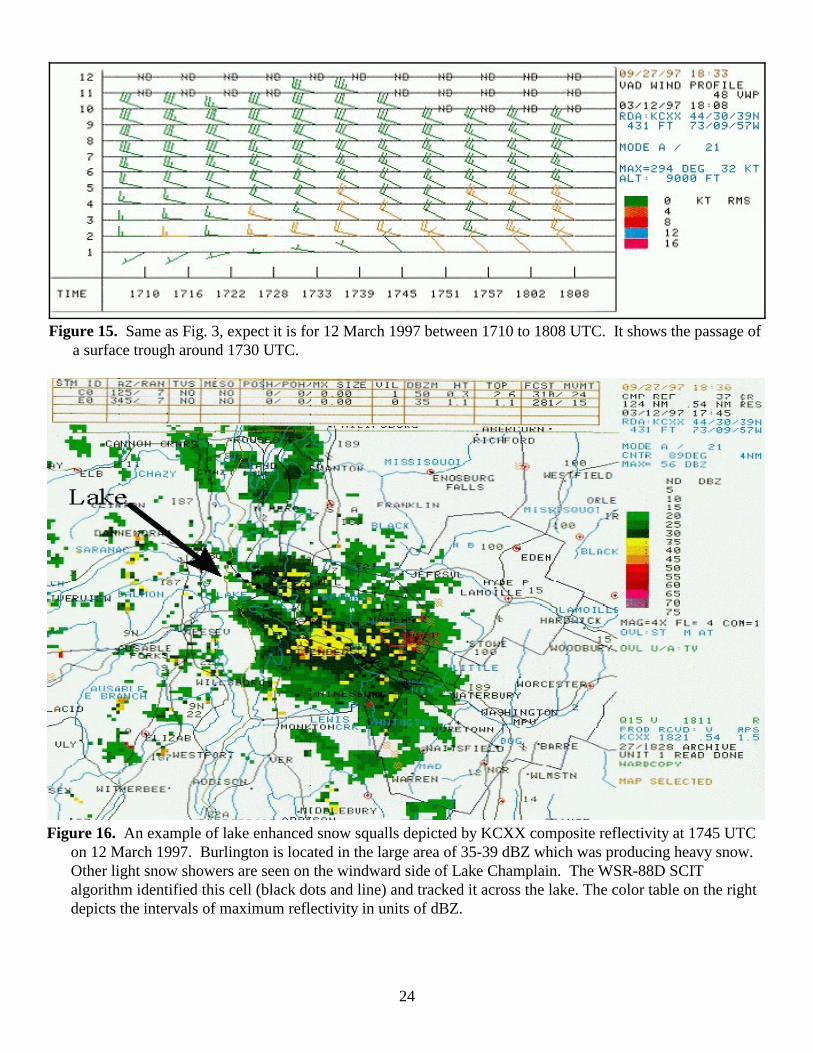
Figure 16. An example of lake enhanced snow squalls depicted by KCXX composite reflectivity at 1745 UTCon 12 March 1997. Burlington is located in the large area of 35-39 dBZ which was producing heavy snow. Other light snow showers are seen on the windward side of Lake Champlain. The WSR-88D SCITalgorithm identified this cell (black dots and line) and tracked it across the lake. The color table on the rightdepicts the intervals of maximum reflectivity in units of dBZ.
Figure 15. Same as Fig. 3, expect it is for 12 March 1997 between 1710 to 1808 UTC. It shows the passage ofa surface trough around 1730 UTC.

25
Figure 18. An intense lake enhanced snow squall depicted by the KCXX composite reflectivity image at 2230UTC 13 November 1996. An impressive area of 30-40 dBZ is visible near the shore line of LakeChamplain. Lesser developed cells are seen north and south of this area over the open waters. A few lightsnow showers are seen on the windward side of the lake. The color table on the right depicts the intervals ofmaximum reflectivity in units of dBZ.
Figure 17. Same as Fig. 3, except it is for 13 November 1996 between 2201 and 2259 UTC. The north windsat 1,000-ft allowed for a long trajectory over Lake Champlain.

26
Figure 20. Composite reflectivity image at 1939 UTC from KCXX displays intense snow squalls (35-39dBZ) that moved over Burlington on 12 November 1996. Numerous lighter snow showers are seen onthe west side of Lake Champlain. The color table on the right depicts the intervals of maximumreflectivity in units of dBZ.
Figure 19. GOES-8 10.7 µm satellite image depicting enhanced clouds (dark blue is -21°C) over LakeChamplain at 2245 UTC on 13 November 1996. Other enhanced cold cloud tops indicate snow showers inthe region.

27
Figure 21. Same as Fig. 3, except from 2 November 1996 between 1929 and 2019 UTC. It shows strongdirectional shear in a 9,000-ft layer. A north wind was observed at 1,000-ft, which provided a long over- water fetch.
Figure 22. GOES-8 10.7 µm satellite image taken at 1745 UTC on 12 November 1996 depicting one of theheavy snow squalls that affected Burlington. Cloud top temperatures over Lake Champlain were between-20 and -25 °C indicated by the greenish-yellow enhancement.