lactate removal ability and vo2 recovery kinetics in … of lactate (accusport, boeringer mannheim,...
TRANSCRIPT

The Open Sports Medicine Journal, 2009, 3, 49-54 49
1874-3870/09 2009 Bentham Open
Open Access
Lactate Removal Ability and VO2
. Recovery Kinetics in Sickle Cell Trait
Carriers Compared with Normal Haemoglobin Subjects: Preliminary Data
Philippe Connes*,1
, Stéphane Perrey2, Fagnété Sara
1,3, Marie-Dominique Hardy-Dessources
3,
Mona Hedreville1,4
and Olivier Hue1
1Laboratory ACTES, UPRES-EA 3596, Departement of Physiology, Faculty of Sports Sciences, University of the French
West Indies, Campus of Fouillole, BP 592, 97159 Pointe a Pitre Cedex, Guadeloupe (FWI), France
2Laboratory Motor Efficiency and Deficiency EA 2991, Faculty of Sports Sciences, University of Montpellier 1, 34090
Montpellier, France
3UMR Inserm U 763-University of the French West Indies, Academic Hospital of Pointe a Pitre, Guadeloupe, France
4Department of Cardiology, Academic Hospital of Pointe a Pitre, Guadeloupe, France
Abstract: Because of the reduced affinity of haemoglobin S to oxygen and the altered blood rheological profile of sickle
cell trait carriers (AS), it is often thought that exercise physiological responses should differ between AS and subjects with
normal haemoglobin (AA). The present study aimed to compare the ability to remove blood lactate and the characteristics
of oxygen uptake (VO2.
) recovery kinetics after supramaximal exercise in eight AS and eight matched AA. All subjects
performed a supramaximal exercise test consisting of pedalling for 1 min at 110% maximal VO2.
. Following exercise,
venous blood samples were obtained from AS and AA at different times to assess blood lactate concentrations. Mathematical modelling was applied during recovery to assess the blood lactate removal ability (time constant 2)
and the kinetics for VO2.
recovery (amplitude A2 and time constant 2). Lactate removal ability and the VO2.
recovery
kinetics were not significantly different between the two groups (P > 0.05). No significant relationship was observed
between 2 and A2 (r = 0.04; P > 0.05) or between 2 and 2 (r = -0.44; P > 0.05) in all groups. It seems that the ability to
recover or to remove lactate after a short supramaximal exercise does appear unaltered by sickle cell trait. It is possible that the elevated blood viscosity reported several times in AS could have promoted greater vasodilatation which in
turn may favour exercise recovery to a similar level observed in subjects with normal haemoglobin. Our findings may
suggest that AS and AA subjects need similar recovery after exhausting exercise. However, it is also known that AS may
be prone to medical complications in response to exercise. So, the presence of clinical sign should justify to prolong recovery or to stop exercise in AS.
Keywords: Haemoglobin S, EPOC, Exercise, Anaerobic metabolism.
INTRODUCTION
Sickle cell trait (SCT) is the heterozygous form of sickle cell disease (SCD), which is the most prevalent genetic abnormality in the world. SCT is marked by the presence of both normal and abnormal haemoglobin (i.e. HbA and HbS, respectively) in red blood cells (RBCs).
The presence of both HbA and HbS led previous investigators to hypothesize that SCT carriers (AS) would have different physiological responses to exercise than subjects with normal Hb (AA) [1-5]. Because the presence of HbS into RBCs might change the oxygen-carrying properties of these cells [6] and because the increased blood viscosity found in AS could disturb blood flow and oxygen delivery to
*Address correspondence to this author at the Laboratory ACTES UPRES-
EA 3596, Faculty of Sports Sciences – Department of Physiology,
University of the French West Indies, Campus of Fouillole, BP 592, 97159
Pointe a Pitre Cedex, Guadeloupe (FWI), France; Tel: + (590) 590 48 92 28;
Fax: + (590) 590 48 92 79; E-mail: [email protected]
tissues [7], one of the often discussed particularities of AS concerns lactate metabolism during exercise [5]. We tried to revisit the question of whether lactate metabolism regulation is different between AS and AA using bi-exponential modelling of lactate recovery curves [3, 8, 9] after a short strenuous exercise resulting in profound metabolic acidosis [10]. This mathematical model, instead of the isotope tracer method, has the advantage to be applied to non steady-state, supramaximal conditions.
Several studies have also focused on how lactate affects the recovery of oxygen consumption after exercise (i.e. on the excess postexercise oxygen consumption; EPOC). Using a radioactive tracer technique, Brooks et al. [11] demonstrated that a causal relationship between lactate and the slow component of EPOC is unlikely. On the other hand, several studies [12, 13] have shown results supporting the concept that lactate influences the slow component of EPOC time course. As lactate may be related to EPOC, we hypothesised that if lactate removal ability differs between
50 The Open Sports Medicine Journal, 2009, Volume 3 Connes et al.
AS and AA, EPOC (and particularly the slow component phase) will also differ between the two populations.
The dual purpose of the present study was to compare the ability to remove lactate and its temporal association to the EPOC slow component after supramaximal exercise in AS and AA subjects matched for ethnic origin and overall physical fitness level. To test these hypotheses, we used the same participants and exercise protocol as in a previous study [7].
METHODS
Subjects
Eight male SCT carriers (AS group; 24.1 ± 3.2 yrs, 181.3 ± 1.7 cm, 76.0 ± 3.4 kg) and eight male subjects with normal haemoglobin (AA group; 19.6 ± 0.5 yrs, 179.0 ± 1.7 cm, 68.9 ± 2.7 kg) participated in the present study. The haematological characteristics of the subjects are summarised in Table 1. All were students at the University of the French West Indies and Guyana and took part in the same training programme. They were moderately trained and practised athletic activities regularly (12 ± 2.1 h/week) but never at a high level. The subjects who did not have the required training status or who were unwilling to follow the study protocol were excluded.
Table 1. Haematological Parameters in the Two Groups
Hb
(g.dL-1
)
Hct
(%)
Ret
(%)
HbS
(%)
Group AS (n = 8) AA (n = 8)
14.7 ± 0.2 14.5 ± 0.3
45.8 ± 0.7 46.2 ± 0.4
0.96 ± 0.07 1.19 ± 0.15
38.0 ± 0.8 -
Values are means ± SEM. Hb (haemoglobin), Hct (haematocrit), HbS (haemoglobin S),
Ret (reticulocytes), (n) number of subjects. No significant difference between the two
groups.
Protocol
At the beginning of the university year, all new students
of the Faculty of Sports underwent haemoglobin screening.
Eight AS subjects were detected in this screening
programme and included in the study. Eight AA subjects
were then selected and matched for maximal oxygen uptake
(VO2.
max) and anthropometric and haematological data
(Table 1). Subjects with anaemia and/or alpha-thalassaemia
were excluded. The subjects were informed of the
procedures and purposes of the study, which was approved
by the local Ethics Committee, and gave written consent to
participate. The protocol was in accordance with the
guidelines set by Declaration of Helsinki.
On the first experimental day, all athletes performed a
progressive and maximal exercise test to determine the
maximal power output (MAP) and VO2.
max (data not shown
and already published in [7]). One week later, the same
subjects performed a supramaximal exercise test consisting
of pedalling for 1 min at 110% VO2.
max, during which
oxygen uptake (VO2.
) was measured breath-by-breath. This
type of supramaximal test is well-known to induce increased
blood lactate during the first moments of recovery before its
clearance and consequently is appropriate for mathematical
modelling of blood lactate recovery curves (see below).
Venous blood samples were obtained from AS and AA at
different times to assess the haematological parameters and
blood lactate concentrations. No additional drink was
allowed 3 hours before and during exercise and the
subsequent recovery.
SCT Diagnosis and Blood Analysis
Techniques used for SCT diagnosis were the same than those previously used [14, 15]. To test for the haemoglobin type, venous blood was drawn into tubes containing EDTA (i.e. ethylenediaminetetraacetate) and screened by isoelectric focusing. The results were confirmed by citrate agar electrophoresis. The various haemoglobins were isolated and quantified by high performance liquid chromatography (HPLC). A test of solubility confirmed the presence of HbS. Positive test results for SCT were confirmed by the presence of HbS (< 50%) and a normal percentage of HbA2 [16]. Haemoglobin concentration ([Hb]), haematocrit (Hct) and percentage of reticulocytes (% Ret) were also studied for the indirect diagnosis of anaemia and alpha-thalassaemia, which results in haematological modifications [17].
Incremental Exercise Test
The progressive and maximal exercise test began with a
3-min warm-up at 60 W. Pedalling frequency remained
constant (at 70 rpm) throughout testing, and the load was
increased by 30 W every minute until VO2.
max was reached.
Oxygen uptake was considered maximal if at least three of
the following criteria were met: 1) a respiratory exchange
ratio greater than 1.10; 2) attainment of age-predicted
maximal heart rate (HR max) [210 – (0.65 x age) ± 10%]; 3)
an increase in VO2.
lower than 100 ml with the last increase
in work rate; and 4) an inability to maintain the required
pedalling frequency (70 rpm) despite maximum effort and
verbal encouragement. A 5-min recovery period was then
implemented with 2 min of pedalling and 3 min at rest. VO2.
was continuously measured using a breath-by-breath
automated metabolic system (Vmax 229 D series,
Sensormedics Corp., Yorba Linda, CA, USA). A 10-leads
electrocardiogram (Hellige, Marquette Medical Systems,
Germany) was monitored continuously.
Supramaximal Exercise Test
During this session, a catheter was inserted into the
antecubital vein for blood sampling. Each subject warmed up
at moderate intensity (50% of VO2.
max) for 5 min on a cycle
ergometer and then rested for 5 min. The supramaximal
exercise test consisted of pedalling at 110% of VO2.
max for
1 min on the cycle ergometer [10]. Then, all subjects
recovered passively for 1 hour on the cycle ergometer and in
the same sitting position as during the exercise. During
recovery, VO2.
was measured breath-by-breath during the
first 10 min.
Blood Lactate Sampling and Analysis
Blood was sampled at rest, immediately at the end of exercise and at minutes 1, 2, 3, 4, 5, 6, 7, 8, 9, 10, 11, 12, 15,
EPOC and Lactate Removal Ability The Open Sports Medicine Journal, 2009, Volume 3 51
20, 30, 40, 50 and 60 of the subsequent recovery. Blood for lactate measurements was sampled in EDTA tubes. An aliquot of 50 l was rapidly analysed for blood lactate concentration using a testing strip (BM-Lactate, Roche Diagnostics, Mannheim, Germany) and an instrument for the resolution of lactate (Accusport, Boeringer Mannheim, Mannheim, Germany). This instrument has been demonstrated to be valid and reliable [18].
Mathematical Analyses
The individual lactate recovery curves were fitted using the following bi-exponential equation validated previously in the literature [8, 9, 19].
La(t) = La(0) + A1 (1 e 1.t
) + A2 (1 e 2.t
) (1)
where La(0) and La(t) (mmol.L-1
) are the lactate concentrations at the end of exercise and at any time t (min) of the recovery period, respectively; A1 and A2 (mmol.L
-1)
are the amplitudes of the two exponential components; and
1 and 2 (min1) are their respective velocity constants. The
individual parameters of the bi-exponential function were fitted by means of an iterative nonlinear regression technique. Note that La (0) was also adjusted to obtain the best fitting curves. The percentage of the variance explained by the use of the bi-exponential curve fit was determined by correlation of the observed and the predicted La (t) at each time and by squaring of the Pearson-product correlation coefficient. The intervening mechanisms can be assimilated into two main processes: one with a velocity constant ( 1) describing the blood lactate increase and the other with a velocity constant ( 2) describing its decrease [3]. The velocity constants of the fitted exponential functions supply information on the ability to exchange lactate between the previously worked muscle and the remainder of the lactate space represented by the arterial blood ( 1), and on the body’s overall ability to remove lactate during recovery ( 2) [8, 9]. Because lactate was analysed from venous blood samples, 2 has only a physiological meaning in this work, as in a previous work [19].
The VO2.
recovery kinetics were modelled using the
following equation validated previously in the literature [20,
21].
VO2
. (t) = EEVO2
. – A1 [1-e
(t-TD)/1]
phase 1 (primary component) (2)
– A2 [1-e-(t-TD)/
2] phase 2 (slow component)
where EE VO2.
is the end-exercise level of VO2.
, A1 and A2
are the amplitude terms, and 1 and 2 are the time constants
of phases 1 and 2, respectively. The primary and slow
components were constrained to begin at exercise offset, and
we assumed that the two components were logically both “in
operation” at the start of recovery. Thus, TD (value fixed to
0) is a common time delay for primary and slow components
after the offset of exercise and t is the time in seconds from
the downward transition.
As the initial “cardiodynamic” phase of the VO2.
response
does not directly represent active muscle O2 utilisation, the
first 20 s of the off-transient VO2.
kinetics were omitted from
the fitting field [22]. Although the duration of this initial
phase is likely to be less in recovery, as blood flow is higher
at the off- than the on-transient, little is known about this
duration and therefore omission of the first 20 s of the off-
transient was thought to be more than sufficient to obviate
any distorting influence on the subsequent kinetics.
Occasional errant data points caused by coughing, swallowing, sighing, etc., were deleted from the data set if they fell more than ± 4 SD outside the mean value for the 30-s interval that bracketed the breath in question [23]. The data were then smoothed using a rolling five-breath average procedure to reduce the noise and thus enhance the underlying characteristics [24].
The parameters of the mathematical model were
determined from an iterative method (by using the
Levenberg-Marquardt algorithm) by minimising the sum of
the mean squares of the differences between the fitted VO2.
and the experimental data (Solver from Excel 7.0, Microsoft
Corporation). Iteration continued until successive repetitions
reduced both the sum of residuals by < 10-8
and the
correlation coefficient of the relationship between residuals
and time by < 10-6
[25]. Plots of residuals were also
examined to help determine the appropriate fits. Linear and
non-linear regressions of the residuals against time were
used to check a random distribution of the residual over a 0
value and to test the adequacy of the used model.
Statistical Analysis
The results are presented as means ± SEM for all
variables. A Student t test was used to compare
anthropometric data, VO2
. max, HR max, MAP,
haematological parameters ([Hb], Hct and %Ret) and each
parameter of the lactate recovery kinetics and the VO2.
recovery kinetics. The time course of the blood lactate
concentrations was compared between the two groups at rest,
at the end of exercise and during recovery using a two-way
(group time) analysis of variance (ANOVA) for repeated
measures. Pair-wise contrasts were used when necessary to
determine where significant differences had occurred. The
relationship between lactate removal ability and the slow
phase of the VO2.
recovery kinetics was assessed using the
Pearson correlation test. Statistical significance was
established at = 0.05. Statistical analyses were conducted
using Statistica (v. 5.5. Statsoft, USA).
RESULTS
Subject Characteristics, Haematological Parameters and Maximal Exercise Data
The AS and AA groups were similar for anthropometric
data (age, height and weight) and haematological data (Table
1). As reported in previous publication [7], maximal exercise
responses (VO2.
max, HR max and MAP) did not differ
between the groups.
Blood Lactate Recovery and EPOC Parameters
The mean blood lactate concentration never differed
between the AS and AA (control) groups whatever the time
52 The Open Sports Medicine Journal, 2009, Volume 3 Connes et al.
of measurement. We noted a time effect (P < 0.05)
demonstrating higher adjusted blood lactate concentration
from the end of exercise (4.68 ± 0.88 mmol.L-1
and 3.83 ±
0.59 mmol.L-1
of [La] in AS and AA, respectively) until the
50th
min of recovery as compared with rest (1.51 ± 0.13
mmol.L-1
and 1.58 ± 0.13 mmol.L-1
of [La] in AS and AA,
respectively). No significant difference was observed
between rest and the 60th
min of recovery (1.61 ± 0.15
mmol.L-1
and 1.89 ± 0.15 mmol.L-1
of [La] in AS and AA,
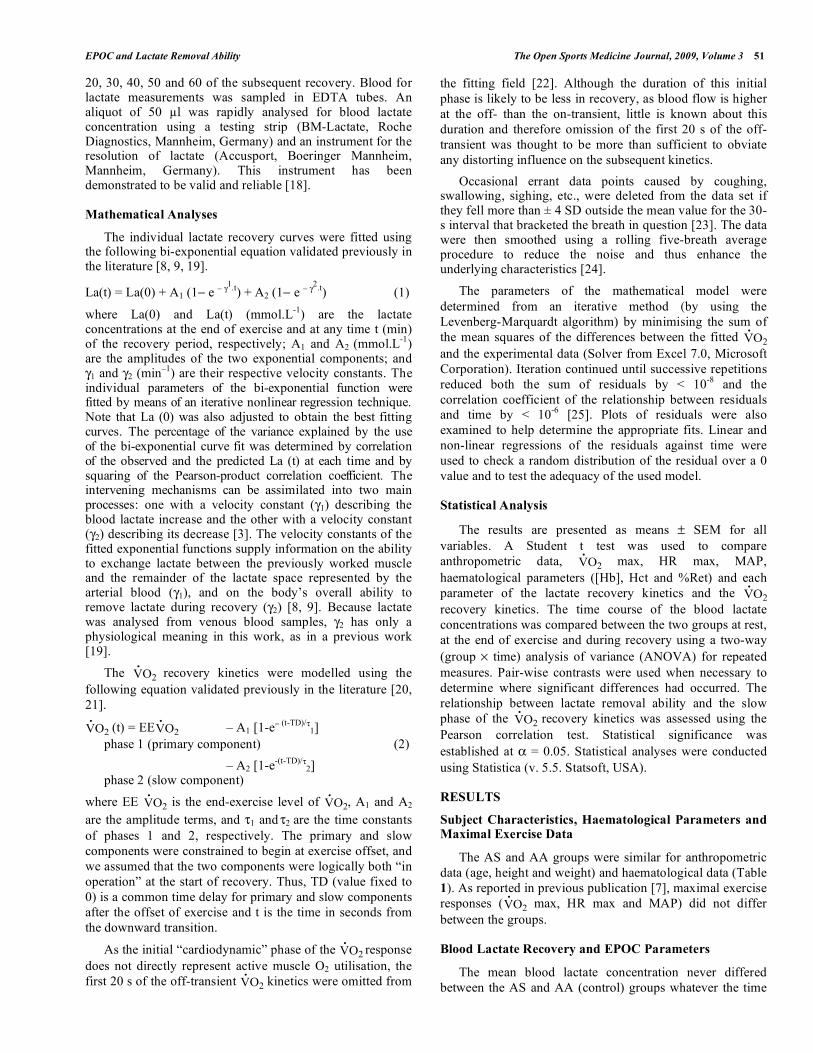
respectively). The mean blood lactate recovery curves of the
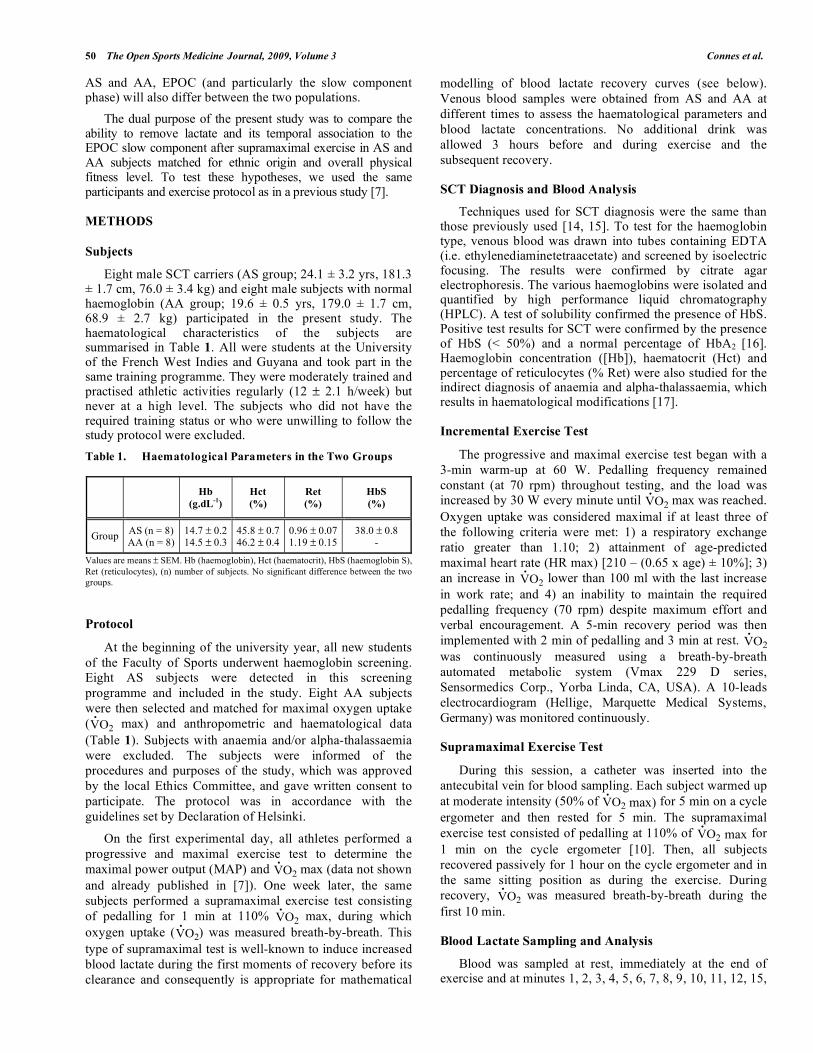
two groups are presented in Fig. (1). The Fig. (2) is a
representative blood lactate recovery curve in a SCT carrier.
The mean values of the parameters obtained with Eq.1 after
the 1-min 110% VO2.
max exercise are reported in Table 2.
The mean velocity constants 1 and 2, as well as the
concentration parameters A1, A2 and La (0), were not
different between the two groups.
Fig. (1). Mean blood lactate recovery curves in the two groups. The
two curves were not statistically different.
The parameters derived from the VO2.
recovery kinetics
are shown in Table 3. At this stage, because of a technical
problem with the breath-by-breath automated metabolic
system, modelling of four of the subjects (2 AS and 2 AA)
was not completed. Therefore, the study of the VO2.
recovery
kinetics was conducted on six AS and six AA subjects.
Neither the time constants nor amplitudes of the fast and
slow components of VO2
.
recovery kinetics were
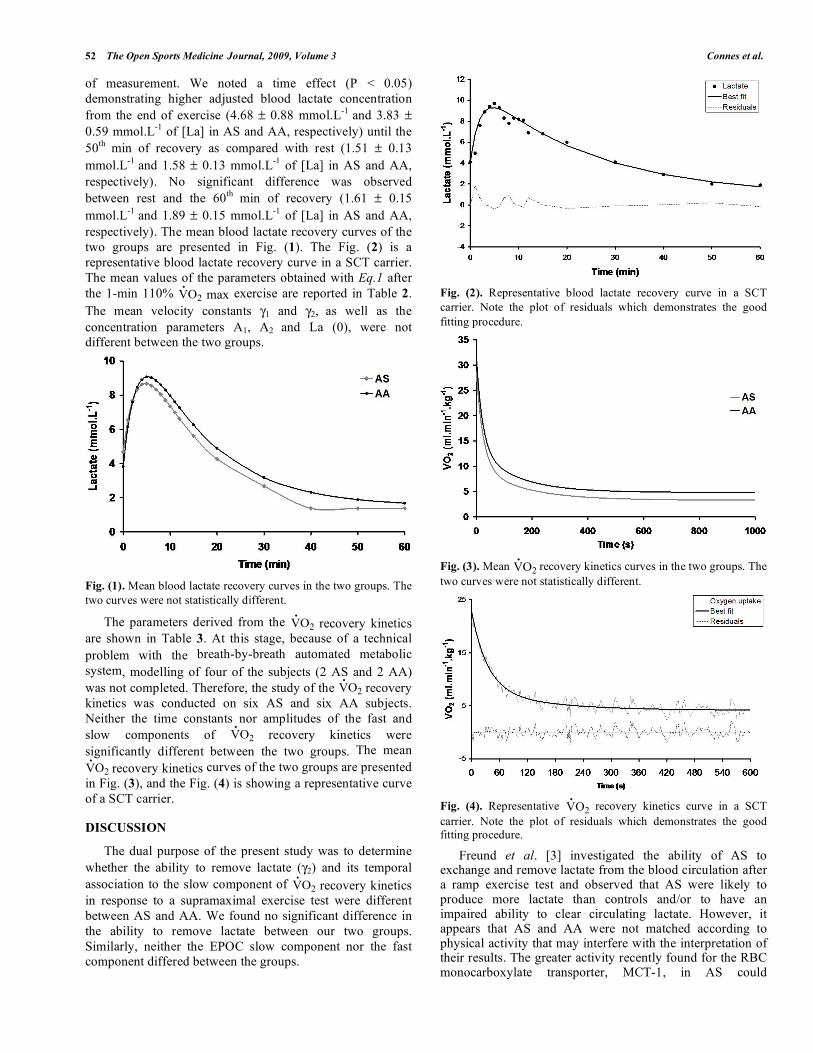
significantly different between the two groups. The mean
VO2
.
recovery kinetics curves of the two groups are presented
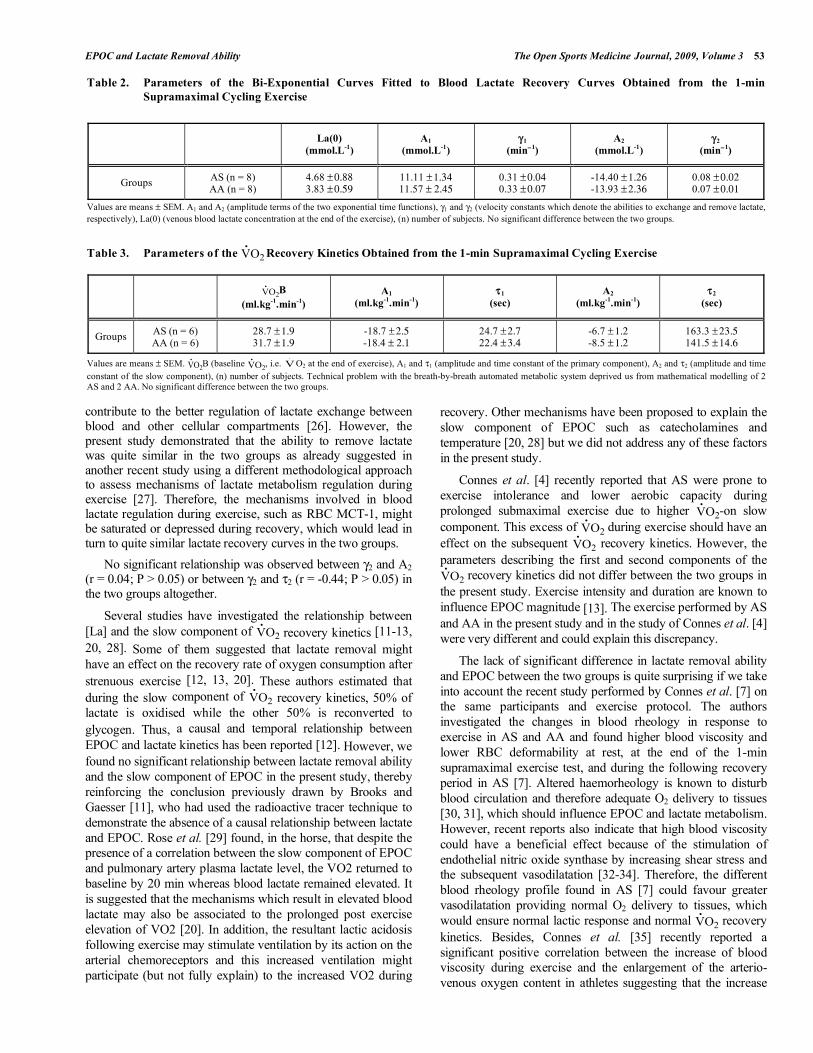
in Fig. (3), and the Fig. (4) is showing a representative curve
of a SCT carrier.
DISCUSSION
The dual purpose of the present study was to determine
whether the ability to remove lactate ( 2) and its temporal
association to the slow component of VO2.
recovery kinetics
in response to a supramaximal exercise test were different
between AS and AA. We found no significant difference in
the ability to remove lactate between our two groups.
Similarly, neither the EPOC slow component nor the fast
component differed between the groups.
Fig. (2). Representative blood lactate recovery curve in a SCT
carrier. Note the plot of residuals which demonstrates the good
fitting procedure.
Fig. (3). Mean VO2.
recovery kinetics curves in the two groups. The
two curves were not statistically different.
Fig. (4). Representative VO2.
recovery kinetics curve in a SCT
carrier. Note the plot of residuals which demonstrates the good fitting procedure.
Freund et al. [3] investigated the ability of AS to exchange and remove lactate from the blood circulation after a ramp exercise test and observed that AS were likely to produce more lactate than controls and/or to have an impaired ability to clear circulating lactate. However, it appears that AS and AA were not matched according to physical activity that may interfere with the interpretation of their results. The greater activity recently found for the RBC monocarboxylate transporter, MCT-1, in AS could
EPOC and Lactate Removal Ability The Open Sports Medicine Journal, 2009, Volume 3 53
contribute to the better regulation of lactate exchange between blood and other cellular compartments [26]. However, the present study demonstrated that the ability to remove lactate was quite similar in the two groups as already suggested in another recent study using a different methodological approach to assess mechanisms of lactate metabolism regulation during exercise [27]. Therefore, the mechanisms involved in blood lactate regulation during exercise, such as RBC MCT-1, might be saturated or depressed during recovery, which would lead in turn to quite similar lactate recovery curves in the two groups.
No significant relationship was observed between 2 and A2 (r = 0.04; P > 0.05) or between 2 and 2 (r = -0.44; P > 0.05) in the two groups altogether.
Several studies have investigated the relationship between
[La] and the slow component of VO2.
recovery kinetics [11-13,
20, 28]. Some of them suggested that lactate removal might
have an effect on the recovery rate of oxygen consumption after
strenuous exercise [12, 13, 20]. These authors estimated that
during the slow component of VO2.
recovery kinetics, 50% of
lactate is oxidised while the other 50% is reconverted to
glycogen. Thus, a causal and temporal relationship between
EPOC and lactate kinetics has been reported [12]. However, we
found no significant relationship between lactate removal ability
and the slow component of EPOC in the present study, thereby
reinforcing the conclusion previously drawn by Brooks and
Gaesser [11], who had used the radioactive tracer technique to
demonstrate the absence of a causal relationship between lactate
and EPOC. Rose et al. [29] found, in the horse, that despite the
presence of a correlation between the slow component of EPOC
and pulmonary artery plasma lactate level, the VO2 returned to
baseline by 20 min whereas blood lactate remained elevated. It
is suggested that the mechanisms which result in elevated blood
lactate may also be associated to the prolonged post exercise
elevation of VO2 [20]. In addition, the resultant lactic acidosis
following exercise may stimulate ventilation by its action on the
arterial chemoreceptors and this increased ventilation might
participate (but not fully explain) to the increased VO2 during
recovery. Other mechanisms have been proposed to explain the
slow component of EPOC such as catecholamines and
temperature [20, 28] but we did not address any of these factors
in the present study.
Connes et al. [4] recently reported that AS were prone to
exercise intolerance and lower aerobic capacity during
prolonged submaximal exercise due to higher VO2.
-on slow
component. This excess of VO2.
during exercise should have an
effect on the subsequent VO2.
recovery kinetics. However, the
parameters describing the first and second components of the
VO2
. recovery kinetics did not differ between the two groups in
the present study. Exercise intensity and duration are known to
influence EPOC magnitude [13]. The exercise performed by AS
and AA in the present study and in the study of Connes et al. [4]
were very different and could explain this discrepancy.
The lack of significant difference in lactate removal ability
and EPOC between the two groups is quite surprising if we take
into account the recent study performed by Connes et al. [7] on
the same participants and exercise protocol. The authors
investigated the changes in blood rheology in response to
exercise in AS and AA and found higher blood viscosity and
lower RBC deformability at rest, at the end of the 1-min
supramaximal exercise test, and during the following recovery
period in AS [7]. Altered haemorheology is known to disturb
blood circulation and therefore adequate O2 delivery to tissues
[30, 31], which should influence EPOC and lactate metabolism.
However, recent reports also indicate that high blood viscosity
could have a beneficial effect because of the stimulation of
endothelial nitric oxide synthase by increasing shear stress and
the subsequent vasodilatation [32-34]. Therefore, the different
blood rheology profile found in AS [7] could favour greater
vasodilatation providing normal O2 delivery to tissues, which
would ensure normal lactic response and normal VO2.
recovery
kinetics. Besides, Connes et al. [35] recently reported a
significant positive correlation between the increase of blood
viscosity during exercise and the enlargement of the arterio-
venous oxygen content in athletes suggesting that the increase
Table 2. Parameters of the Bi-Exponential Curves Fitted to Blood Lactate Recovery Curves Obtained from the 1-min
Supramaximal Cycling Exercise
La(0)
(mmol.L-1
)
A1
(mmol.L-1
) 1
(min1)
A2
(mmol.L-1
) 2
(min1)
Groups AS (n = 8) AA (n = 8)
4.68 ± 0.88
3.83 ± 0.59 11.11 ± 1.34
11.57 ± 2.45 0.31 ± 0.04
0.33 ± 0.07 -14.40 ± 1.26
-13.93 ± 2.36 0.08 ± 0.02
0.07 ± 0.01
Values are means ± SEM. A1 and A2 (amplitude terms of the two exponential time functions), 1 and 2 (velocity constants which denote the abilities to exchange and remove lactate,
respectively), La(0) (venous blood lactate concentration at the end of the exercise), (n) number of subjects. No significant difference between the two groups.
Table 3. Parameters of the VO2
.
Recovery Kinetics Obtained from the 1-min Supramaximal Cycling Exercise
VO2
.B
(ml.kg-1
.min-1
)
A1
(ml.kg-1
.min-1
) 1
(sec)
A2
(ml.kg-1
.min-1
) 2
(sec)
Groups AS (n = 6) AA (n = 6)
28.7 ± 1.9
31.7 ± 1.9 -18.7 ± 2.5
-18.4 ± 2.1 24.7 ± 2.7
22.4 ± 3.4 -6.7 ± 1.2
-8.5 ± 1.2 163.3 ± 23.5
141.5 ± 14.6
Values are means ± SEM. VO2.
B (baseline VO2.
, i.e. V.
O2 at the end of exercise), A1 and 1 (amplitude and time constant of the primary component), A2 and 2 (amplitude and time
constant of the slow component), (n) number of subjects. Technical problem with the breath-by-breath automated metabolic system deprived us from mathematical modelling of 2 AS and 2 AA. No significant difference between the two groups.
54 The Open Sports Medicine Journal, 2009, Volume 3 Connes et al.
of blood viscosity may contribute to the increase of oxygen
consumption. Further studies are needed to fully explain these
mechanisms.
The main limitation of the present study was the limited
number of participants and the present findings should be
considered as preliminary. Our results suggest that lactate
removal ability and VO2.
recovery kinetics were not different
between AS and AA in response to a short supramaximal
exercise test. The ability to recover after a short supramaximal
exercise seemed to be not altered by sickle cell trait.
Nevertheless, the presence of clinical sign should justify to
prolong recovery or to stop exercise in AS because it has been
reported that AS might be at greater risk for medical
complication in response to exercise than AA [36]. The
mechanisms responsible for these results are not fully
understood and require further studies in larger cohort. Also,
different short-term supramaximal exercise (longer duration, all-
out) need to be investigated to confirm these preliminary results.
ACKNOWLEDGEMENTS
We sincerely thank Dr. Maryse Etienne-Julan, Dr. Christian Saint-Martin and Laurent Marlin for their technical help. The authors also thank all the subjects who participated in the present study.
REFERENCES
[1] Thiriet P, Le Hesran JY, Wouassi D, et al. Sickle cell trait performance in a prolonged race at high altitude. Med Sci Sports Exerc 1994; 26:
914-8. [2] Le Gallais D, Prefaut C, Mercier J, et al. Sickle cell trait as a limiting
factor for high-level performance in a semi-marathon. Int J Sports Med 1994; 15: 399-402.
[3] Freund H, Lonsdorfer J, Oyono-Enguelle S, et al. Lactate exchange and removal abilities in sickle cell trait carriers during and after incremental
exercise. Int J Sports Med 1995; 16: 428-34. [4] Connes P, Monchanin G, Perrey S, et al. Oxygen uptake kinetics during
heavy submaximal exercise: effect of sickle cell trait with or without alpha-thalassemia. Int J Sports Med 2006; 27: 517-25.
[5] Connes P, Reid H, Hardy-Dessources MD, et al. Physiological responses of sickle cell trait carriers during exercise. Sports Med 2008;
38: 931-46. [6] Becklake MR, Griffiths SB, Mc GM, et al. Oxygen dissociation curves
in sickle cell anemia and in subjects with the sickle cell trait. J Clin Invest 1955; 34: 751-5.
[7] Connes P, Sara F, Hardy-Dessources MD, et al. Effects of short supramaximal exercise on hemorheology in sickle cell trait carriers. Eur
J Appl Physiol 2006; 97: 143-50. [8] Freund H, Gendry P. Lactate kinetics after short strenuous exercise in
man. Eur J Appl Physiol Occup Physiol 1978; 39: 123-35. [9] Freund H, Lonsdorfer J, Oyono-Enguelle S, et al. Lactate exchange and
removal abilities in sickle cell patients and in untrained and trained healthy humans. J Appl Physiol 1992; 73: 2580-7.
[10] Robergs R, Hutchinson K, Hendee S, et al. Influence of pre-exercise acidosis and alkalosis on the kinetics of acid-base recovery following
intense exercise. Int J Sport Nutr Exerc Metab 2005; 15: 59-74. [11] Brooks GA, Gaesser GA. End points of lactate and glucose metabolism
after exhausting exercise. J Appl Physiol 1980; 49: 1057-69. [12] Bahr R. Excess postexercise oxygen consumption--magnitude,
mechanisms and practical implications. Acta Physiol Scand Suppl 1992; 605: 1-70.
[13] Borsheim E, Bahr R. Effect of exercise intensity, duration and mode on
post-exercise oxygen consumption. Sports Med 2003; 33: 1037-60. [14] Connes P, Sara F, Hardy-Dessources MD, et al. Does higher red blood
cell (RBC) lactate transporter activity explain impaired RBC deformability in sickle cell trait? Jpn J Physiol 2005; 55: 385-7.
[15] Tripette J, Hardy-Dessources MD, Sara F, et al. Does repeated and heavy exercise impair blood rheology in carriers of sickle cell trait? Clin
J Sport Med 2007; 17: 465-70. [16] Serjeant G. Sickle cell disease. In: Publications OM, Ed. New York:
Oxford university Press 1992. [17] Embury SH, Dozy AM. The alpha-globin genotype as a determinant of
hematologic parameters in sickle cell trait. Sigler P, Ed. The molecular basis of mutant hemoglobin dysfunction. Amsterdam, The Netherlands:
Elsevier 1981; pp. 63-7. [18] Bishop D. Evaluation of the Accusport lactate analyser. Int J Sports
Med 2001; 22: 525-30. [19] Thomas C, Perrey S, Lambert K, et al. Monocarboxylate transporters,
blood lactate removal after supramaximal exercise, and fatigue indexes in humans. J Appl Physiol 2005; 98: 804-9.
[20] Langsetmo I, Poole DC. VO2 recovery kinetics in the horse following moderate, heavy, and severe exercise. J Appl Physiol 1999; 86: 1170-7.
[21] Ozyener F, Rossiter HB, Ward SA, et al. Influence of exercise intensity on the on- and off-transient kinetics of pulmonary oxygen uptake in
humans. J Physiol 2001; 533: 891-902. [22] Cleuziou C, Perrey S, Borrani F, et al. Dynamic responses of oxygen
uptake at the onset and end of moderate and heavy exercise in trained subjects. Can J Appl Physiol 2004; 29: 32-44.
[23] Lamarra N, Whipp BJ, Ward SA, et al. Effect of interbreath fluctuations on characterizing exercise gas exchange kinetics. J Appl
Physiol 1987; 62: 2003-12. [24] Bearden SE, Moffatt RJ. VO2 and heart rate kinetics in cycling:
transitions from an elevated baseline. J Appl Physiol 2001; 90: 2081-7. [25] Bearden SE, Moffatt RJ. VO2 kinetics and the O2 deficit in heavy
exercise. J Appl Physiol 2000; 88: 1407-12. [26] Sara F, Connes P, Hue O, et al. Faster lactate transport across red blood
cell membrane in sickle cell trait carriers. J Appl Physiol 2006; 100: 437-42.
[27] Sara F, Hardy-Dessources MD, Marlin L, et al. Lactate distribution in the blood compartments of sickle cell trait carriers during incremental
exercise and recovery. Int J Sports Med 2006; 27: 436-43. [28] Gaesser GA, Brooks GA. Metabolic bases of excess post-exercise
oxygen consumption: a review. Med Sci Sports Exerc 1984; 16: 29-43. [29] Rose RJ, Hodgson DR, Kelso TB, et al. Maximum O2 uptake, O2
EPOC, and deficit and muscle metabolites in Thoroughbred horses. J Appl Physiol 1988; 64: 781-8.
[30] Connes P, Yalcin O, Baskurt O, et al. In health and in a normoxic environment, VO2 max is/is not limited primarily by cardiac output and
locomotor muscle blood flow. J Appl Physiol 2006; 100: 2099. [31] Parthasarathi K, Lipowsky HH. Capillary recruitment in response to
tissue hypoxia and its dependence on red blood cell deformability. Am J Physiol 1999; 277: 2145-57.
[32] Martini J, Carpentier B, Negrete AC, et al. Paradoxical hypotension following increased hematocrit and blood viscosity. Am J Physiol Heart
Circ Physiol 2005; 289: 2136- 43. [33] Martini J, Carpentier B, Chavez NA, et al. Beneficial effects due to
increasing blood and plasma viscosity. Clin Hemorheol Microcirc 2006; 35: 51-7.
[34] Forconi S, Gori T. The evolution of the meaning of blood hyperviscosity in cardiovascular physiopathology: should we reinterpret
Poiseuille? Clin Hemorheol Microcirc 2009; 42: 1-6. [35] Connes P, Tripette J, Mukisi-Mukaza M, et al. Relationships between
hemodynamic, hemorheological and metabolic responses during exercise. Biorheology 2009; 46: 133-43.
[36] Kark JA, Posey DM, Schumacher HR, et al. Sickle-cell trait as a risk factor for sudden death in physical training. N Engl J Med 1987; 317:
781-7.
Received: January 5, 2009 Revised: May 5, 2009 Accepted: May 29, 2009
© Connes et al.; Licensee Bentham Open.
This is an open access article licensed under the terms of the Creative Commons Attribution Non-Commercial License (http://creativecommons.org/licenses/
by-nc/3.0/) which permits unrestricted, non-commercial use, distribution and reproduction in any medium, provided the work is properly cited.