labview experiements
DESCRIPTION
Signal ProcessingTRANSCRIPT
UNDERSTANDING MASTER UNIT
The Master Unit is a common base structure of the equipment ordered by you. It is an
electronic desk with ergonomically designed compartmental ABS enclosure with sleek
looking desk shape with central slotholding replaceable experiment panels (439 mm x 209
mm).Basically for the subject matter being experimented upon, you would like to have
following facilities available on your table viz; Toggle switches to apply high or low input
signals for the digital circuit that you want to build up,buffered LED’s to check output
status level for your circuit.Along with this youmay need pulser to provide clean clock
pulse to counter ,probe to detect one shot occurrence of narrow pulse during a carry over,
or a DPM to measure output or a function generator to provide some signals for an analog
circuit, or a 7 segment display to observe measured count etc.
The transformer used inside has many secondaries; some of these windings are used to
generate other DC power supplies. Of course one cannot forget the myriad range of various
stabilized DC power supplies that you will need to complete your lab experiments All of
these are gathered on a single PCB called as Power supply PCB, which is located just below
the Top board of Master unit. Of these, the variable power supplies are kept isolated from
eachother as well rest of the power supplies.This facilities you to make them function as
+/- DC power source, adjusting the settings as per your requirements e.g. +/-3V or +/-10V
DC etc.
Too provide variable power supplies (3 to 18 V DC -2 nos.) you have been provided with
two variables carbon potentiometers mounted on the Top board and are labeled
appropriately. The 5V,+12 V,-12VDC, power supplies have common ground. These power
supplies are made available to user at right – hand corner of Top board as mentioned
above. Also these +/-12V & +5V are used for working of op-amps & TTL circuits as power
supply , on CIA III , on TB pcbs inside the master unit.
COMPUTER INTERFACE: A PC parallel port or USB ( using optional USB IO module
refer appendix A)based pc interface is supported using VC++GUI (optionally Graph utility
based exe) It provides for 24 DIO& 4AI &1AO.This facilities on line data acquisition &
display; using appropriate programmes/exes (need to be purchased separately); for many
user experiments;This is specially more useful in biomedical electronics Lab thereby
combining routine hands-on approach with power of animated pc based tutorials thus
enhancing understanding manifold.
These common resources are made available in this base unit hence can be called as
MASTER UNIT.

GRAPH UTILITY SOFTWARE
Graph Utility .exe
1. Windows installer 3.1
In Software CD go into ‘BMI’ Folder, and double click on ‘Windows installer
3.1’icon and follow instructions as per Setup during installation .After successful
installation go to ‘Start-Setting Control Panel’ menu double click on add remove &
check Windows installer 3.1(KB893803).
2. Installation of Dotnetfx3.5 Software
In Software CD go into ‘BMI’ Folder, and double click on ‘Dotnetfx3.5 ‘icon and
follow instructions as per Setup during installation .After successful installation
goto ‘Start-Setting Control Panel’ menu double click on add remove & check
MICROSOFT .NET FRAMEWORK3.5.
3. Installation of Graph utility Software
In BMI CD go into ‘Graph utility’ Folder, and double click on ‘Setup Graph
utility’icon and follow instructions as per setup during installation .After
successful installation s shortcut will be created PC desktop & on CD Double click
on Redist& click on ‘DXSETUP.exe’ icon and follow instructions as per Setup
during installation.
4. Starting Graph utility software
On the desktop,double click on the “Graph Utility .exe” shortcut icon to start Graph
Utility .exe.
Step 1) Connect USB IO Module to 25 Pin D type connector (on Master Unit).
Step 2) Double click on your ‘Graph Utility.exe’ icon. Following window will open.
(Confirm USB Device is connected) shown following screen below.
Step 3)Connect Replaceable module to BM1 PCB depends upon which
Experiments you have Perform.
Step 4) Prepare wiring sequence as per you have perform experiments.
Step 5)Switch ‘ON’ Master Unit.
Step 6) Change setting click on ‘setting’ button following screen shall be seen on
your PC monitor.
Step 7)There are two types of graph-
i) Online Graph
ii) Burst Graph
Step 8) Click on ‘Save setting’.
Step 9) Click on ‘start graph’ button to start graph & click on ‘stop graph’ button to stop
graph.
Step 10) Click on ‘Save’ button’ to save graph
Step 11) Click on ‘Select parameter’ to select channel it should be ch0– Bipolar I/P1 on top
board.
Step 12) Observe waveform on PC as shown below.
Step 13) Click on ‘Measurement’ button.
Step 14) Click at any first peak and then click on second peak on the graph.
Step 15) Now you will be observe X-difference at the left hand button. Use this difference
for calculating Heart Rate.

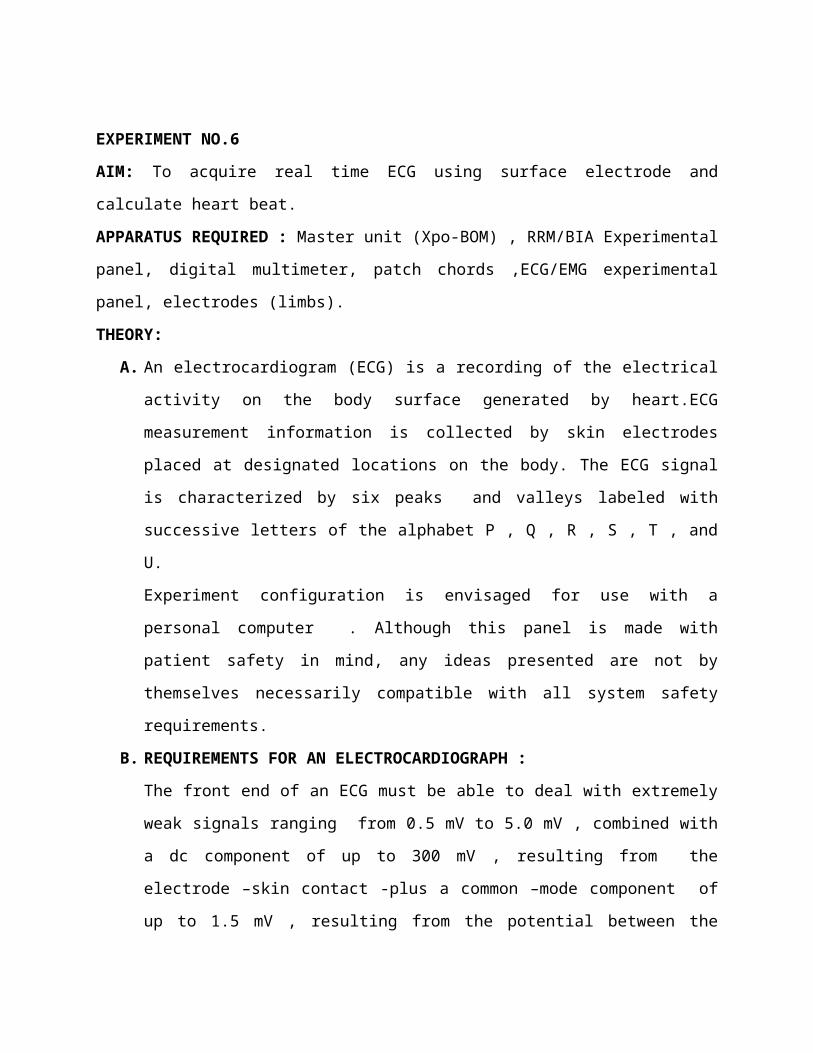
EXPERIMENT NO.6
AIM: To acquire real time ECG using surface electrode and calculate heart beat.
APPARATUS REQUIRED : Master unit (Xpo-BOM) , RRM/BIA Experimental panel, digital
multimeter, patch chords ,ECG/EMG experimental panel, electrodes (limbs).
THEORY:
A. An electrocardiogram (ECG) is a recording of the electrical activity on the body
surface generated by heart.ECG measurement information is collected by skin
electrodes placed at designated locations on the body. The ECG signal is
characterized by six peaks and valleys labeled with successive letters of the
alphabet P , Q , R , S , T , and U.
Experiment configuration is envisaged for use with a personal computer . Although
this panel is made with patient safety in mind, any ideas presented are not by
themselves necessarily compatible with all system safety requirements.
B. REQUIREMENTS FOR AN ELECTROCARDIOGRAPH :
The front end of an ECG must be able to deal with extremely weak signals ranging
from 0.5 mV to 5.0 mV , combined with a dc component of up to 300 mV , resulting
from the electrode –skin contact -plus a common –mode component of up to 1.5
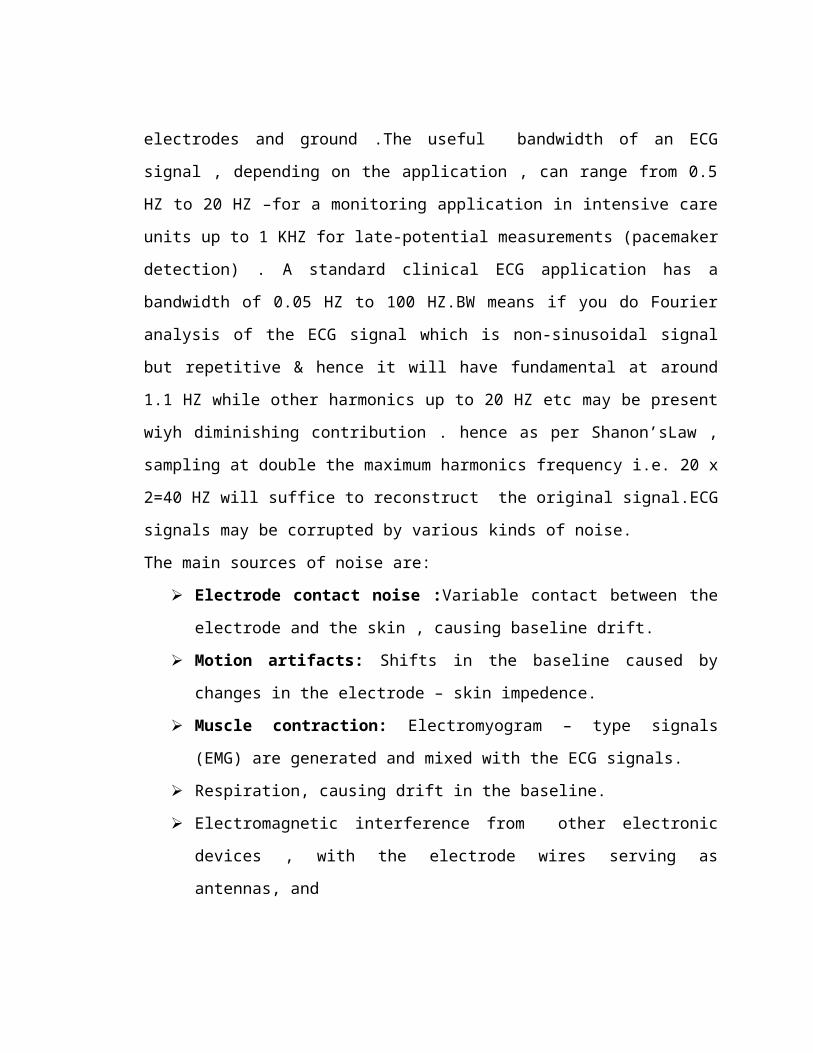
mV , resulting from the potential between the electrodes and ground .The useful
bandwidth of an ECG signal , depending on the application , can range from 0.5 HZ to
20 HZ –for a monitoring application in intensive care units up to 1 KHZ for late-
potential measurements (pacemaker detection) . A standard clinical ECG application
has a bandwidth of 0.05 HZ to 100 HZ.BW means if you do Fourier analysis of the
ECG signal which is non-sinusoidal signal but repetitive & hence it will have
fundamental at around 1.1 HZ while other harmonics up to 20 HZ etc may be
present wiyh diminishing contribution . hence as per Shanon’sLaw , sampling at
double the maximum harmonics frequency i.e. 20 x 2=40 HZ will suffice to
reconstruct the original signal.ECG signals may be corrupted by various kinds of
noise.
The main sources of noise are:
Electrode contact noise :Variable contact between the electrode and the
skin , causing baseline drift.
Motion artifacts: Shifts in the baseline caused by changes in the electrode –
skin impedence.
Muscle contraction: Electromyogram – type signals (EMG) are generated
and mixed with the ECG signals.
Respiration, causing drift in the baseline.
Electromagnetic interference from other electronic devices , with the
electrode wires serving as antennas, and
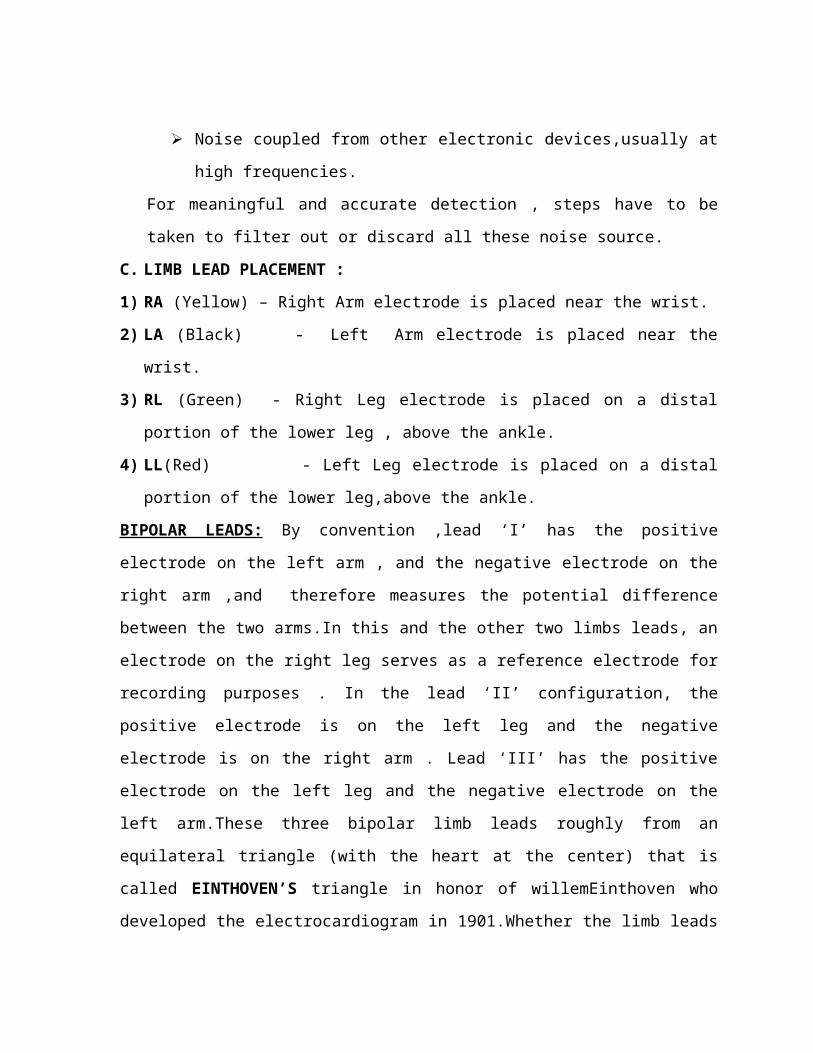
Noise coupled from other electronic devices,usually at high frequencies.
For meaningful and accurate detection , steps have to be taken to filter out or
discard all these noise source.
C. LIMB LEAD PLACEMENT :
1) RA (Yellow) – Right Arm electrode is placed near the wrist.
2) LA (Black) - Left Arm electrode is placed near the wrist.
3) RL (Green) - Right Leg electrode is placed on a distal portion of the lower leg ,
above the ankle.
4) LL(Red) - Left Leg electrode is placed on a distal portion of the lower leg,above
the ankle.
BIPOLAR LEADS: By convention ,lead ‘I’ has the positive electrode on the left arm , and
the negative electrode on the right arm ,and therefore measures the potential
difference between the two arms.In this and the other two limbs leads, an electrode on
the right leg serves as a reference electrode for recording purposes . In the lead ‘II’
configuration, the positive electrode is on the left leg and the negative electrode is on
the right arm . Lead ‘III’ has the positive electrode on the left leg and the negative
electrode on the left arm.These three bipolar limb leads roughly from an equilateral
triangle (with the heart at the center) that is called EINTHOVEN’S triangle in honor of
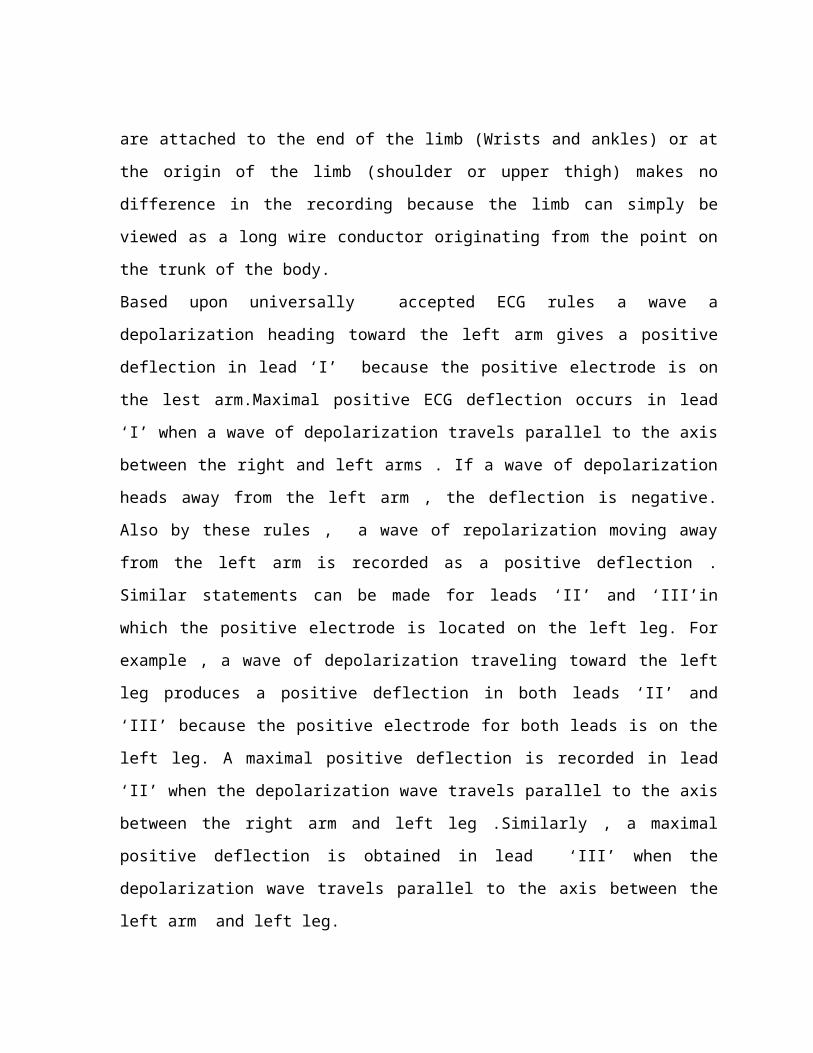
willemEinthoven who developed the electrocardiogram in 1901.Whether the limb leads
are attached to the end of the limb (Wrists and ankles) or at the origin of the limb
(shoulder or upper thigh) makes no difference in the recording because the limb can
simply be viewed as a long wire conductor originating from the point on the trunk of
the body.
Based upon universally accepted ECG rules a wave a depolarization heading toward the
left arm gives a positive deflection in lead ‘I’ because the positive electrode is on the
lest arm.Maximal positive ECG deflection occurs in lead ‘I’ when a wave of
depolarization travels parallel to the axis between the right and left arms . If a wave of
depolarization heads away from the left arm , the deflection is negative. Also by these
rules , a wave of repolarization moving away from the left arm is recorded as a positive
deflection . Similar statements can be made for leads ‘II’ and ‘III’in which the positive
electrode is located on the left leg. For example , a wave of depolarization traveling
toward the left leg produces a positive deflection in both leads ‘II’ and ‘III’ because the
positive electrode for both leads is on the left leg. A maximal positive deflection is
recorded in lead ‘II’ when the depolarization wave travels parallel to the axis between
the right arm and left leg .Similarly , a maximal positive deflection is obtained in lead
‘III’ when the depolarization wave travels parallel to the axis between the left arm and
left leg.
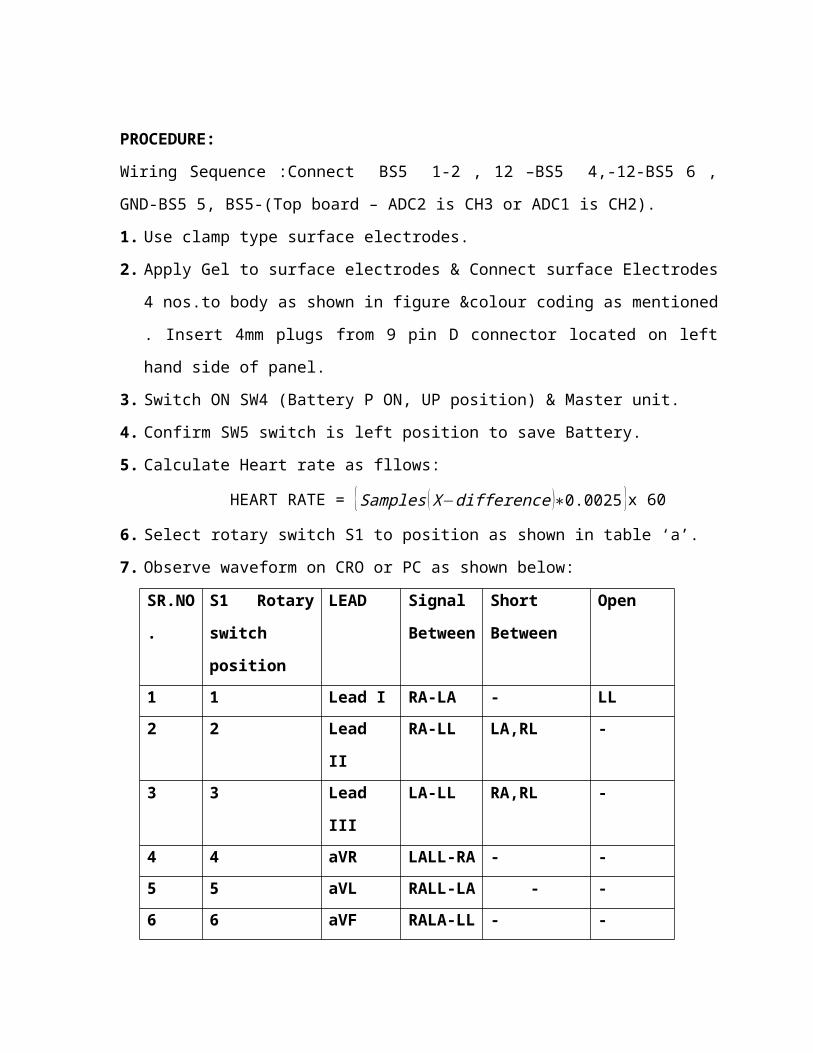
PROCEDURE:
Wiring Sequence :Connect BS5 1-2 , 12 –BS5 4,-12-BS5 6 , GND-BS5 5, BS5-(Top board
– ADC2 is CH3 or ADC1 is CH2).
1. Use clamp type surface electrodes.
2. Apply Gel to surface electrodes & Connect surface Electrodes 4 nos.to body as
shown in figure &colour coding as mentioned . Insert 4mm plugs from 9 pin D
connector located on left hand side of panel.
3. Switch ON SW4 (Battery P ON, UP position) & Master unit.
4. Confirm SW5 switch is left position to save Battery.
5. Calculate Heart rate as fllows:
HEART RATE = {Samples (X−difference )∗0.0025 }x 60
6. Select rotary switch S1 to position as shown in table ‘a’.
7. Observe waveform on CRO or PC as shown below:
SR.NO. S1 Rotary LEAD Signal Short Open
switch
position
Between Between
1 1 Lead I RA-LA - LL
2 2 Lead II RA-LL LA,RL -
3 3 Lead III LA-LL RA,RL -
4 4 aVR LALL-RA - -
5 5 aVL RALL-LA - -
6 6 aVF RALA-LL - -
CONCLUSION:
1) Shifting of the Baseline: A wandering baseline as seen in adjoining figure but
otherwise normal ECG trace is usually due to the movement of the patient or
electrodes. The baseline shift can be eliminated by ensuring that the patient lies
relaxed& the electrodes are properly attached.
2) Muscle Tremor: Irregular trembling of the ECG trace in figure A without wondering
of the baseline occurs when the patient is not relaxed or is cold. It is found in the
case of older patients.
3) Interface from the power line: Power line interference is easily recognizable since
the interfacing voltage in the ECG would have a frequency of 50 HZ. This can be
verified by bypassing notch filter & observe interference.
4) In all the bipolar lead positions ,QRS of a normal heart is such that the R wave is
positive & is generated in lead II.
EXPERIMENT NO. 7
AIM: To acquire real time EMG using surface electrode and study its characteristics.
MATERIAL REQUIRED :BPM , EMG experimental panel , patch chords , pc (graph utility
software), Limb electrodes.
THEORY: Typically externally measured action potential from a single muscle fibre
produces a characteristic biphasic waveform. Imagine what happens when a recording is
made externally to the muscle in a living subject. Instead of recording from a single muscle
fibre you are recording from thousands of muscle fibres and instead of recording just next
to the fibre you are recording some distance away through various layers of connective
tissue and skin. This means that instead of a nice clean signal of about 100 mV you get a
much more complex signal of about 5 mV.The actual size of the signal is highly variable and
depends on the thickness of the connective tissue, the quality of the contact between the
electrode and the skin ,the size of the action potentials .These will vary from experiment to
experiment so the size of an EMG is a largely qualitative measure although it does
increases in size with the activation level of a muscle.
When there is little muscle tension there is virtually zero electrical activity. As the EMG
increases after a short lag the tension increases. A surface electrode may be used to
monitor the general picture of muscle activation, as opposed to the activity of only a few
fibres as observed using a needle. This technique is used in a number of setting; for
example in the physiotherapy clinic , muscle activation is mentioned using EMG & patients
have an auditory or stimulus to help them know they are activating the muscle
(biofeedback). A motor unit is defined as on motor neuron and all of the muscle fibree in
innervates. When a motor unit fires , the impulse ( called an action potential ) is carried
down the motor neuron to the muscle. The area where the nerve contacts the muscle is
called the Neuromuscular junction or the motor end plate. After the action potential is
transmitted across the neuro muscular junction ,an action potential is elicited in all of the
innervated muscle fibers of that particular motor unit.
The sum of all this electrical activity is known as a motor unit action potential (MUAP). This
electro physiologic activity from multiple motor units is typically evaluated during an EMG.
PROCEDURE:
Wiring Sequence : Connect BS5 1-2 , 12 –BS5 4,-12-BS5 6 , GND-BS5 5, BS5-(Top
board – ADC1 is CH3 or ADC1 is CH2).
1. Use clamp type surface electrodes
2. Apply Gel to surface electrodes & Connect surface Electrodes 3 nos.to body as
shown in figure&colourcoding as mentioned. Insert 4mm plugs from 9 pin D
connector located on left handside of panel.To left forearm which should be kept
facing up on your lap in a relaxed fashion.
3. Switch ON SW4 (Battery P ON, UP position) & Master unit.
4. Confirm SW5 switch is left position to save Battery.
5. Keep Rotary switch (S1) at position one.
6. Now flex your wrist of left arm up & down.
7. Observe waveform on CRO or PC.
CONCLUSION:
a) EMG provides good semi – quantitative data on muscle use.
b) A 3 electrode system is necessary to cancle out background noise.
c) Linear envelope processing with a 50 (60) HZ Notch filter is a good processing
option.
d) There is a variable (-50 ms) time delay between the electrical activity and tension.
RESULT:
The EMG wavelength from armmuscle have been studied.
EXPERIMENT NO. 8
AIM: To acquire real time EOG using surface electrodes and study its characteristics.
APPARATUS REQUIRED: Ag/AgCl electrodes, Xp-BOM, EOG experimental panel, patch
chord, PC (graph utility software).
THEORY:
The electrooculogram signals or simply EOG represent the eye balls movements. The
waveform contains useful information about the movement of the eye balls and generally it
may also represent the overall condition of the human subject such as the state of
drowsiness of the subject. The EOG signal when extracted and analyzed using computers ,
are highly useful in detecting changes in the states of the subject and could be useful in
applications such as Wake – sleep detection and human-computer interface (HCL) [1,2 ]
.Such application can be further enhanced if some form of prediction is available.
EOG is the recording of the standing corneal retinal potential arising from
hyperpolarizations and depolarizations existing between the cornea and the retina.This
potential can be considered as a steady electrical dipole with a negative pole at the fundus
and a positive pole at the cornea. This standing potential in the eye can thus be estimated
by measuring the voltage induced across a system of electrodes placed around eyes as the
eye gaze changes. EOG signal varies from 50 to 3500 mV in magnitude with a frequency
range of about dc – 100 HZ . Its behavior is practically linear for gaze angles of + 300. It
should be pointed out that the variables measured in the human body (any bio-potential)
are rarely deterministic. Its magnitude varies with time even when all possible variables
are controlled. Most of these bio-potentials vary widely even under similar measuring
conditions which means that the EOG readings variability are due to other biopotentials
such as EEG , electromyogram (EMG) and those of the acquisition system devices.
Additional causes include positioning of electrodes ,skin-electrode contacts, lighting
conditions ,head movements, blinking etc.
PLACEMENT OF EOG ELECTRODES
The reference Surface electrode is placed on a distal portion of the lower leg,above the
ankle (RL Green).
PROCEDURE
Wiring Sequence: Connect BS5 1-2 , 12 –BS5 4,-12-BS5 6 , GND-BS5 5, BS5-(Top board –
ADC1 is CH3 or ADC1 is CH2).
1. Apply Gel on your Right Leg electrode RL (Green) & is placed on a distal portion of
the lower leg, above the ankle.
2. Connect Disposal sticker type electrodes Ag/Agcl 2 nos. to both sides of your
forehead (temples) near eyebrows but in the line of your upper ears as shown in
figure 7.1.
3. Switch ON SW4 (Battery P ON,Up position) &Master Unit.
4. Confirm SW5 switch is left position to save Battery.
5. Keep rotary switch (S1) at position one.
6. Now flex your eye lid or eye balls sidewise.
7. Observe waveform on CRO or PC.
CONCLUSION:
Evoked potentials elicited by electrical stimulation of the oculomotor nerves and obtained
from the surface electrodes originate in the extraocular muscles. They do not derive from
the eye and thus EOG doesnot provide an appropriate representation.
EXPERIMENT NO.9
AIM: To measure blood pressure of a subject using automatic BPM.
APPARATUS REQUIRED: Automatic blood pressure machine.
THEORY:
A) DIFFERENCE BETWEEN SYSTOLIC AND DIASTOLIC BLOOD PRESSURE: Blood
pressure is always recorded as 2 numbers, such as 120/80, where the top number is
the systolic pressure and the bottom number is the diastolic pressure. Systolic
pressure is the pressure on the arteries as the heart contracts and pumps blood. The
diastolic pressure is the pressure in the arteries when the heart is at rest in between
heart beats.
B) HOW IS BLOOD PRESSURE MEASURED? When a pressure pad is wrapped around
a patient’s upper arm and inflated using hand pump, the brachial artery is occluded
(i.e. blood flow through the artery has been stopped).As the pressure pad is
gradually deflated, blood flow is re-established and accompanied by sounds of
“tapping” (thumping) that can be detected with a stethoscope held over the brachial
artery just below the pressure pad at the concavity.When the first sound of
“tapping” is heard, that signifies the systolic pressure and when the “tapping”
ceases, that signifies the diastolic pressure.
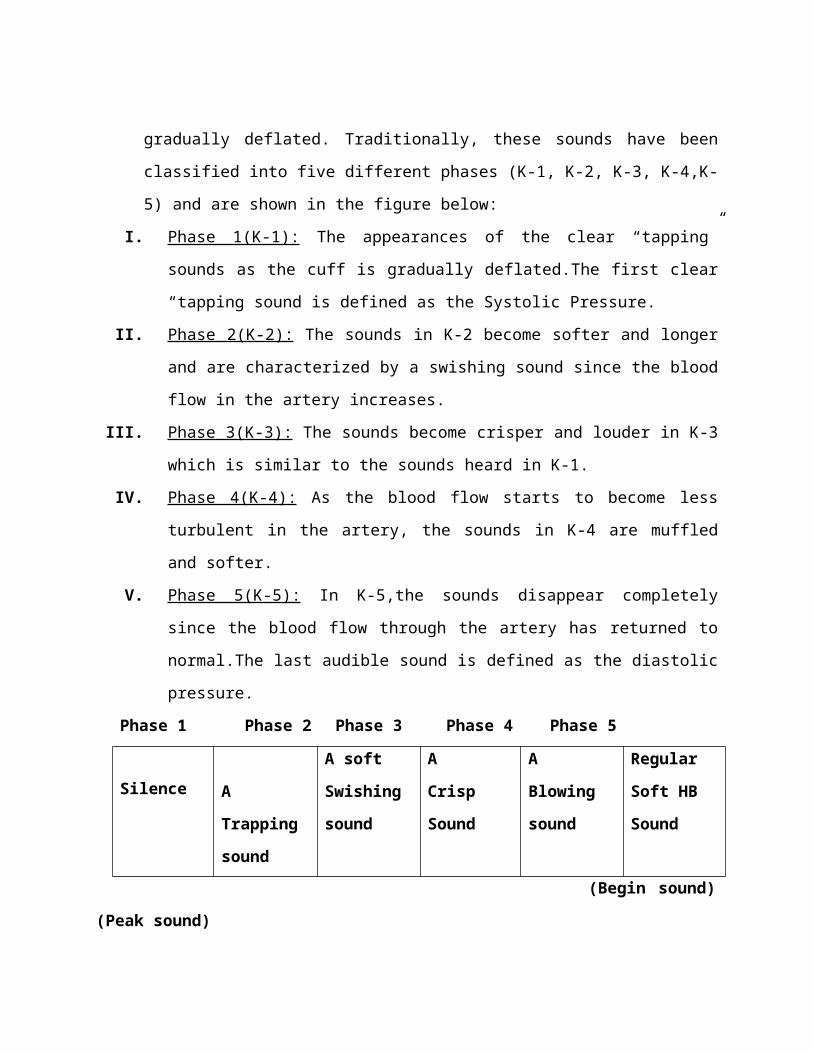
C) KOROTKOFF SOUNDS: Korotkoff sounds (or K-Sounds) are the “tapping” sounds
heard through a stethoscope as the cuff is gradually deflated. Traditionally, these
sounds have been classified into five different phases (K-1, K-2, K-3, K-4,K-5) and
are shown in the figure below:
I. Phase 1(K-1): The appearances of the clear “tapping” sounds as the cuff is
gradually deflated.The first clear “tapping sound is defined as the Systolic
Pressure.
II. Phase 2(K-2): The sounds in K-2 become softer and longer and are characterized
by a swishing sound since the blood flow in the artery increases.
III. Phase 3(K-3): The sounds become crisper and louder in K-3 which is similar to
the sounds heard in K-1.
IV. Phase 4(K-4): As the blood flow starts to become less turbulent in the artery, the
sounds in K-4 are muffled and softer.
V. Phase 5(K-5): In K-5,the sounds disappear completely since the blood flow
through the artery has returned to normal.The last audible sound is defined as
the diastolic pressure.
Phase 1 Phase 2 Phase 3 Phase 4 Phase 5
Silence
A
Trapping
sound
A soft
Swishing
sound
A
Crisp
Sound
A
Blowing
sound
Regular
Soft HB
Sound
(Begin sound) (Peak sound)
180 120 110 100 90 80 mmHg
Peak pressure Systolic cuff pressure mmHg Diastolic pressure
Drop
Pressure pressure
Fig.9.1: Blood Pressure levels
D) CATEGORIES FOR BLOOD PRESSURE LEVELS IN ADULTS: (IN mmHg ,
millimeters of mercury)
TABLE 4.1: BLOOD PRESSURE LEVELS
S.NO. CATEGORY SYSTOLIC
( TOP NUMBER)
DIASTOLIC
(BOTTOM
NUMBER)
1 Normal Less than 120 Less than 80
2 Prehypertension 120-139 80-89
3a High Blood
Pressure
Stage 1
140-159 90-99
3b High Blood 160 or higher 100 or higher
Pressure Stage 2
PROCEDURE:
A) CALIBRATION OF ELECTRONIC PRESSURESENSOR USING
SPHYGMAMANOMETER
Wiring Sequence: Connect BS5 +12-1,-12-3, GND-2, 11-9, 12-10, 13-
DMM.
1. One end of Sphygmomanometer is connected to T Socket while one of the other two
ends is connected to pressure sensor located on the underside of BMI panel
&second goes to wrappable pressure pad.
2. Keep SW3 lower position (down) for low gain of instrumentation OP-Amp.
3. Switch ON power supply of master unit.
4. Connect DMM to BS5 no.13.
5. Set 0V by using zero pot(P5) at BS5-13 when no pressure is applied to pressure pad.
6. Create 100 mmHg pressure by using Sphygmamomanometer/Blood Pressure
module. (Need not wrap)
7. Set 100mV on DMM at BS5 13 & GND.
8. Repeat this procedure two times & observe reading by applying different pressure
in between.
B) BLOOD PRESSURE MEASUREMENT USING KOROTKOFF’S
Wiring Sequence: Connect BS5 +12-1,-12-3,GND-2,14-I/P Preamplifier (on
Hind plate of MU), O/P of amplifier (on Hind plate of MU)-15.16-I/P L/S (on Hind plate
of MU), CH1 or CH2 on TB-O/P L/S (on Hind plate of MU)
1. One end of Sphygmomanometer is connected o T- socket while one of the other two
ends is connected to pressure sensor located on the underside of BM 1 panel &
other two goes to wrap able pressure pad.
2. Keep SW3 lower position for low gain of instrumentation OP-Amp.
3. Connect Electronic stethoscope probe / module using electret MIC to J3 KBD
connecter on PCB.
4. Electronic stethoscope probe are placed vein of left hand as shown in figure.
5. Switch ON power supply of master unit.

6. Connect headphone on hind plate of headphone socket.
7. Headphone placed on the ear.
8. Increase the pressure by using hand pump nearly equal to 210 mmHg & slowly
decrease the pressure by using hand pump knob.
9. Hear the first sound of pulses ( i.e. Korotkcoff sound K-1) at that time press hold
button on DMM &Note down that reading as systolic pressure (systolic pressure for
normal person is 120 mmHg)
SYSTOLIC PRESSURE = ---------------------mmHg.
10.Hear the last peak sound of pulses (i.e. Korotkcoff sound K-5) at that time press Hold
button on DMM & note down that reading as Diastolic pressure (Diastolic pressure
foe normal person is 80 mmHg.
DIASTOLIC PRESSURE = ------------------------mmHg.
CONCLUSION: You need to do some practice to pick up sound of heart beat using electret
MIC as in the din of various noises around you:the faint sound of heart is difficult to hear.
Correct placement of ear is important.
EXPERIMENT NO. 10
AIM:To measure the blood glucose level using electronic glucometer.
APPARATUS REQUIRED: ACCU-Check.
THEORY:
ACCU-check active blood glucose meter is used foe quantitative determination of blood
glucose valves in fresh capillary blood by using ACCU-check active test strips.
FEATURES:
1) FAST TESTING: The meter needs only approximate 5 seconds for each testing.
2) EASY TESTING: The person need not to press a single for testing just insert a test
strip into meter, which switches it as apply blood to test strip , read the valve and
then pull test strip out of the meter.
3) BLOOD VOLUME CHECKING: To preform test, the meter requires 1-2 l blood. Theμ
meter requires 1-2 l blood is sufficient or not.μ
4) FLAGGING RESULT: We can flag results with different symbols, which indicate
particular situation during the test.
5) MEMORY: The meter automatically saves upto 350 results with time and data of the
test and any other information i.e. important for the test.
6) INTEGRATED DATA ANALYSIS: From the stored test results our neter can calculate
over average values for the last 7,14 or 30 days.
7) DATA TRANSFER: The meter has an infrared part enabling us to download stored
test result to a computer.
8) APPLYING BLOOD OUTSIDE THE METER: When the meter prompts us to apply
blood, we can remove the test strip from the meter, apply the blood and insert it
back into the meter.
PROCEDURE:
1) Preparing to test blood glucose.
TO CARRY OUT THE TEST
a) Meter with code strip inserted.
b) The parts of ACCU – check active test strips that belong to code chop.
c) A laming device to collect blood.
TESTING BLOOD GLUCOSE
i) TURNING THE METER ON:
a)Take a test strip from the container and close the container again gently.
b) Hold the test strip so the arrows pointed on this and the orange face
( square) upwards.
c) Without bending it,gently push the test strip into the test strip guide in the
direction of arrows.
ii) APPLY BLOOD WITH TEST STRIP OUTSIDE THE METER:
a) Remove the test strip from the meter.
b) Prick the slide of a finger tip with a lancing device.
c) Encourage a drop of blood to form by gently managing your fingertips.
d) Apply the drop of bloodat the centre of orange field.
e) Push the test strip back into the test strip guide in the direction of arrow.
f) After test, the meter turns itself OFF by removing the test strip from the
meter.
PRECAUTIONS:
A) Always use a new lanut each time when taking blood.
B) Wash hands with warm water and soap and dry well before taking blood.
C) Donot prick the ------------- device until the person is ready to take blood.
D) Dispose of used lanuts so they cannot cause injury.

RESULT:
The level of blood glucose measured for subject id 85.

EXPERIMENT NO.11
AIM:To generate breathing speed waveform using surface electrode.
APPARATUS REQUIRED: Temperature module with T3 connector cord,DSO.
THEORY: