labour supply and inequality trends in the u.s.a. & elsewhere lars osberg department of...
TRANSCRIPT

Labour Supply and Inequality Trends in the U.S.A. & elsewhere
Lars OsbergDepartment of Economics
Dalhousie University

Average hours of paid work per working age adult - 1980 about same BUT 1997
– Germany 981.9 – France 980.6, – USA 1428.5
1997 Differential = 8.6 hours of work per adult per week
Adding actual & unemployment differential = 7.6 hours per adult weekly

Figure 1
Annual Number of Hours Worked per Person Aged 15-64 1
600
800
1000
1200
1400
1600
1800
1980 1981 1982 1983 1984 1985 1986 1987 1988 1989 1990 1991 1992 1993 1994 1995 1996 1997
year
annual hours
Canada
France
Germany
Sweden
United Kingdom
United States
1 = Average hours worked per employed person *(Employment / pop. age 15-64) Source: OECD Health Data 98 CDROM, "A Comparative Analysis of 29 Countries".

Figure 2
Annual Number of Hours Worked per Person Aged 15-64 1
- Adjusted for Unemployment
600
800
1000
1200
1400
1600
1800
1980 1981 1982 1983 1984 1985 1986 1987 1988 1989 1990 1991 1992 1993 1994 1995 1996 1997
year
an
nu
al
ho
urs
Canada
France
Germany
Sweden
United Kingdom
United States
1= Average hours worked per employed person * (Employment / pop age 15-64) + (Average Annual Hours of Unemployment for Persons Aged 16-64)Source: OECD Health Data 98 CDROM, "A Comparative Analysis of 29 Countries".

Figure 1b
Annual Number of Hours Worked per Person Aged 15-64 1
600
800
1000
1200
1400
1600
1800
1980 1981 1982 1983 1984 1985 1986 1987 1988 1989 1990 1991 1992 1993 1994 1995 1996 1997
year
an
nu
al
ho
urs
Canada
Finland
France
Germany
Norway
Spain
Sweden
United Kingdom
United States
1 = Average hours worked per employed person *(Employment / pop. age 15-64) Source: OECD Health Data 98 CDROM, "A Comparative Analysis of 29 Countries".

Figure 2b
Annual Number of Hours Worked per Person Aged 15-64 1
- Adjusted for Unemployment
600
800
1000
1200
1400
1600
1800
1980 1981 1982 1983 1984 1985 1986 1987 1988 1989 1990 1991 1992 1993 1994 1995 1996 1997
year
an
nu
al
ho
urs
Canada
Finland
France
Germany
Norway
Spain
Sweden
United Kingdom
United States
1= Average hours worked per employed person * (Employment / pop age 15-64) + (Average Annual Hours of Unemployment for Persons Aged 16-64)Source: OECD Health Data 98 CDROM, "A Comparative Analysis of 29 Countries".

Inequality and Growth - Why do working hours matter ? Interpretation of “Inequality” and “Growth”
– $ income ignores utility value of non working time
– if $ income trends reflect working hour changes, utility interpretation is more problematic
Causal:– Is greater inequality the incentive that drives
greater labour supply ?

Average paid working hours per household adult
At all points in income distribution, Americans work more hours
differences in hours of work significantly smaller at top of income distribution, despite greater US incentives
In USA, relatively poor work harder for their relative poverty than elsewhere– inequality in $ understates inequality utility

Figure 3
Average Working Hours per Adult in Household *
Head of Household Aged 18-64
600
800
1000
1200
1400
1600
1800
1980 1981 1982 1983 1984 1985 1986 1987 1988 1989 1990 1991 1992 1993 1994 1995 1996 1997
year
ho
urs
pe
r a
du
lt
Canada
France
Germany
Sweden
United Kingdom
United States
* Average of head and spouse (if present) only.Source: Author's calculations using The Luxembourg Income Study

F ig u r e 4
A v e r a g e W o r k in g H o u r s p e r H o u s e h o ld A d u lt ( H e a d A g e d 1 8 -6 4 * )
a n d M e a n R a t io s to t h e U S b y D e c i le 1 9 9 4 /9 5
0
0 .2
0 .4
0 .6
0 .8
1
1 .2
1 2 3 4 5 6 7 8 9 1 0
d e c i le
ratio
C a n a d a 9 4
F r a n c e 9 4
G e r m a n y 9 4
S w e d e n 9 5
U n ite d K in g d o m 9 5
U n ite d S ta te s 9 4
0
5 0 0
1 0 0 0
1 5 0 0
2 0 0 0
2 5 0 0
1 2 3 4 5 6 7 8 9 1 0
d e c i le
ho
urs

“Big Picture” - Bell & Freeman (1994, 2000) to explain: “American workaholicism and
German love of leisure” difference in wage inequality between the
US and Germany is major reason return to work hours = current wage +
change in probability of future promotion or higher wage
Greater inequality is incentive driving greater labour supply
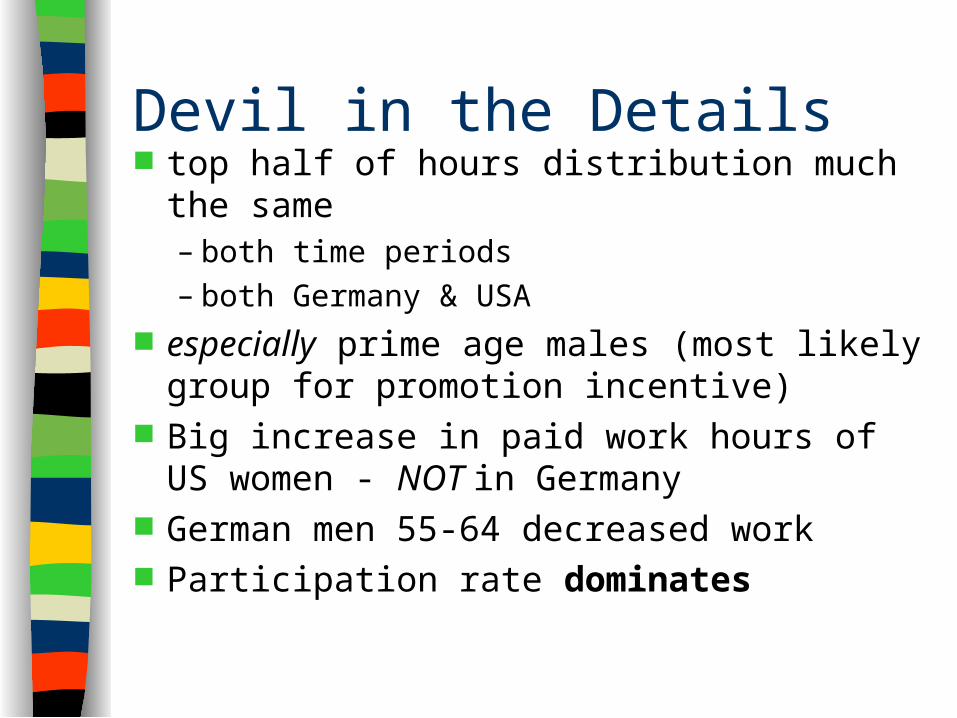
Devil in the Details top half of hours distribution much the same
– both time periods – both Germany & USA
especially prime age males (most likely group for promotion incentive)
Big increase in paid work hours of US women - NOT in Germany
German men 55-64 decreased work Participation rate dominates

F ig u r e 5
A v e r a g e W o r k H o u r s p e r H o u s e h o ld A d u lt b y D e c i le o f E q u iv a le n t In c o m e in t h e U S A
0
5 0 0
1 0 0 0
1 5 0 0
2 0 0 0
2 5 0 0
1 2 3 4 5 6 7 8 9 1 0
d e c i le
hours
1 9 7 4
1 9 8 6
1 9 9 1
1 9 9 4
1 9 9 7
0
0 . 2
0 . 4
0 . 6
0 . 8
1
1 . 2
1 2 3 4 5 6 7 8 9 1 0
d e c i le
ratio to 1
997
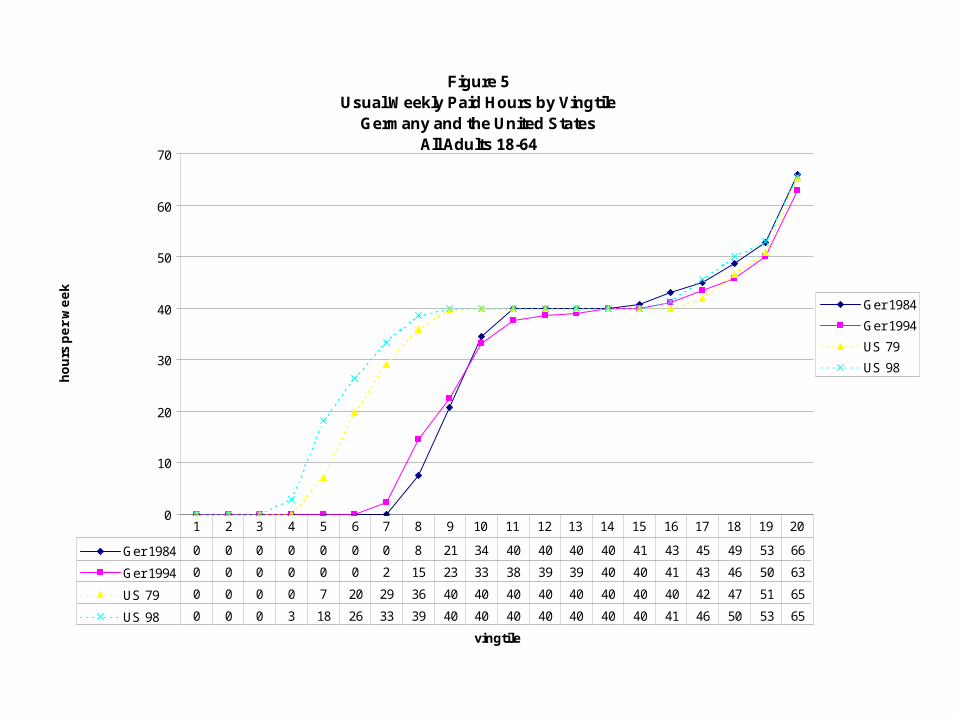
Figure 5Usual Weekly Paid Hours by Vingtile
Germany and the United StatesAll Adults 18-64
0
10
20
30
40
50
60
70
vingtile
ho
urs
pe
r w
ee
k
Ger 1984
Ger 1994
US 79
US 98
Ger 1984 0 0 0 0 0 0 0 8 21 34 40 40 40 40 41 43 45 49 53 66
Ger 1994 0 0 0 0 0 0 2 15 23 33 38 39 39 40 40 41 43 46 50 63
US 79 0 0 0 0 7 20 29 36 40 40 40 40 40 40 40 40 42 47 51 65
US 98 0 0 0 3 18 26 33 39 40 40 40 40 40 40 40 41 46 50 53 65
1 2 3 4 5 6 7 8 9 10 11 12 13 14 15 16 17 18 19 20

Figure 6Usual Annual Paid Hours by Vingtile
Germany and the United States All Adults 18-64
0
500
1000
1500
2000
2500
3000
3500
4000
vingtile
an
nu
al
ho
urs
Ger 1984
Ger 1994
US 79
US 98
Ger 1984 0 0 0 0 0 0 0 205 819 1285 2080 2080 2080 2088 2192 2329 2483 2701 3409
Ger 1994 0 0 0 0 0 0 0 193 715 1109 1912 1995 2031 2080 2094 2207 2350 2577 3223
US 79 0 0 0 0 88 396 716 1046 1389 1683 2052 2080 2080 2080 2080 2082 2320 2575 3275
US 98 0 0 0 36 398 826 1158 1538 1816 2034 2080 2080 2080 2080 2080 2303 2548 2696 3351
1 2 3 4 5 6 7 8 9 10 12 13 14 15 16 17 18 19 20

Figure 7Usual Annual Paid Hours by Vingtile
Germany and the United States All Males 18-64
0
500
1000
1500
2000
2500
3000
3500
4000
vingtile
an
nu
al
ho
urs
Ger 1984
Ger 1994
US 79
US 98
Ger 1984 0 0 0 0 296 1294 2012 2080 2080 2080 2082 2171 2248 2340 2391 2584 2661 3063 3616
Ger 1994 0 0 0 0 0 470 1414 1882 1975 2017 2080 2082 2161 2236 2340 2424 2600 2819 3468
US 79 0 0 293 742 1168 1562 1831 2013 2080 2080 2080 2080 2080 2092 2305 2449 2600 2849 3535
US 98 0 0 136 707 1199 1662 1954 2080 2080 2080 2080 2080 2080 2256 2405 2600 2637 2995 3501
1 2 3 4 5 6 7 8 9 10 12 13 14 15 16 17 18 19 20

Figure 8Usual Annual Paid Hours by Vingtile
Germany and the United States All Females 18-64
0
500
1000
1500
2000
2500
3000
3500
vingtile
an
nu
al
ho
urs
Ger 1984
Ger 1994
US 79
US 98
Ger 1984 0 0 0 0 0 0 0 0 0 0 624 1019 1277 1756 2080 2080 2098 2292 2849
Ger 1994 0 0 0 0 0 0 0 0 0 95 852 1053 1313 1681 1965 2030 2080 2151 2683
US 79 0 0 0 0 0 0 38 242 482 751 1289 1584 1824 1993 2080 2080 2080 2083 2669
US 98 0 0 0 0 7 245 572 912 1159 1481 1918 2079 2080 2080 2080 2080 2109 2443 2979
1 2 3 4 5 6 7 8 9 10 12 13 14 15 16 17 18 19 20

Figure 9Usual Annual Paid Hours by Vingtile
Germany and the United States All Males 25-54
0
500
1000
1500
2000
2500
3000
3500
4000
vingtile
an
nu
al
ho
urs
Ger 1984
Ger 1994
US 1979
US 1998
Ger 1984 0 0 15 628 1630 2052 2080 2080 2080 2080 2151 2220 2328 2342 2504 2600 2691 3074 3604
Ger 1994 0 0 53 765 1576 1893 1976 2010 2028 2072 2099 2168 2234 2335 2370 2562 2610 2969 3515
US 1979 0 349 1153 1615 1868 2029 2080 2080 2080 2080 2080 2080 2101 2312 2420 2580 2635 2995 3623
US 1998 0 141 1041 1636 1941 2080 2080 2080 2080 2080 2080 2080 2261 2365 2572 2600 2730 3061 3560
1 2 3 4 5 6 7 8 9 10 12 13 14 15 16 17 18 19 20

Figure 10Usual Annual Paid Hours by Vingtile
Germany and the United States All Males 55-64
0
500
1000
1500
2000
2500
3000
3500
4000
vingtile
an
nu
al
ho
urs
Ger 1984
Ger 1994
US 1979
US 1998
Ger 1984 0 0 0 0 0 0 132 1775 2080 2080 2080 2115 2216 2340 2484 2600 2896 3228 3809
Ger 1994 0 0 0 0 0 0 0 0 0 1249 2007 2035 2080 2118 2220 2340 2489 2688 3456
US 1979 0 0 0 0 158 866 1452 1834 2041 2080 2080 2080 2080 2080 2140 2364 2561 2751 3481
US 1998 0 0 0 0 0 177 853 1372 1851 2073 2080 2080 2080 2080 2279 2530 2603 2942 3478
1 2 3 4 5 6 7 8 9 10 12 13 14 15 16 17 18 19 20


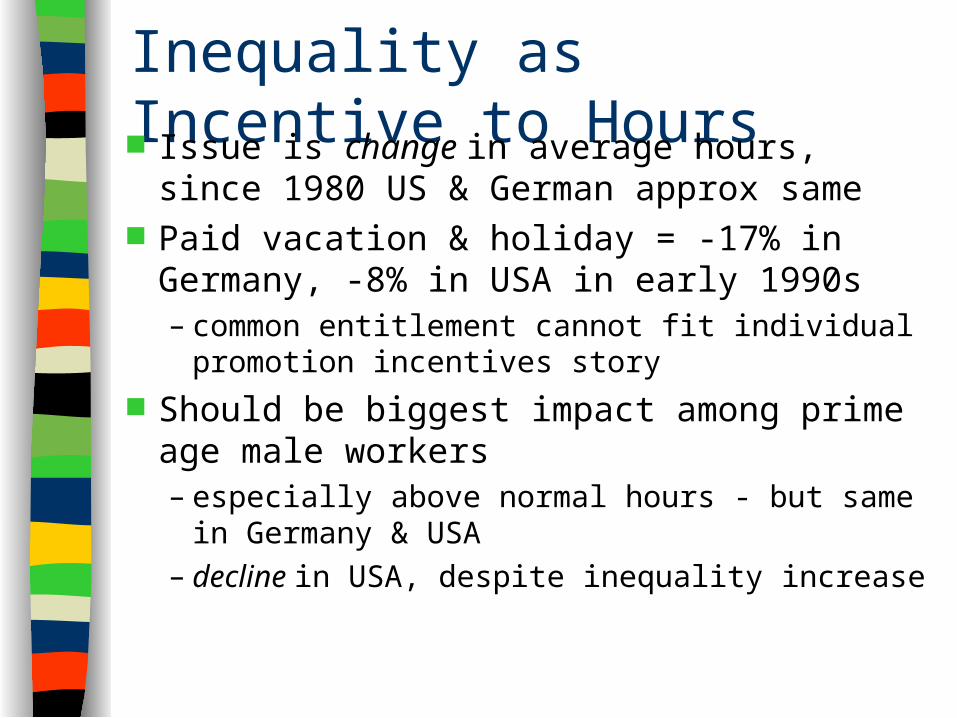
Inequality as Incentive to Hours Issue is change in average hours, since 1980
US & German approx same Paid vacation & holiday = -17% in Germany, -
8% in USA in early 1990s– common entitlement cannot fit individual promotion
incentives story Should be biggest impact among prime age
male workers– especially above normal hours - but same in
Germany & USA– decline in USA, despite inequality increase

Why differences in Hours ? 2/3 difference in 1990s due to women
– big increase work hours over time in USA– Nil increase by German women
• Social policy incentive - 2 year stay at home mother subsidy
approx 1/6 of 1990s difference due to prime age males– mainly a participation effect
earlier retirement by German men 55-64 has cut German work hours

So What ? Social policy may significantly affect
extensive margin of labour supply– support for stay-at-home parenting ?– Adequacy of general income support ?
BUT for working population– Greater Wage Inequality has remarkably
small impact on Hours Distribution Work Hours do affect interpretation of
“growth” & “inequality” in $ income
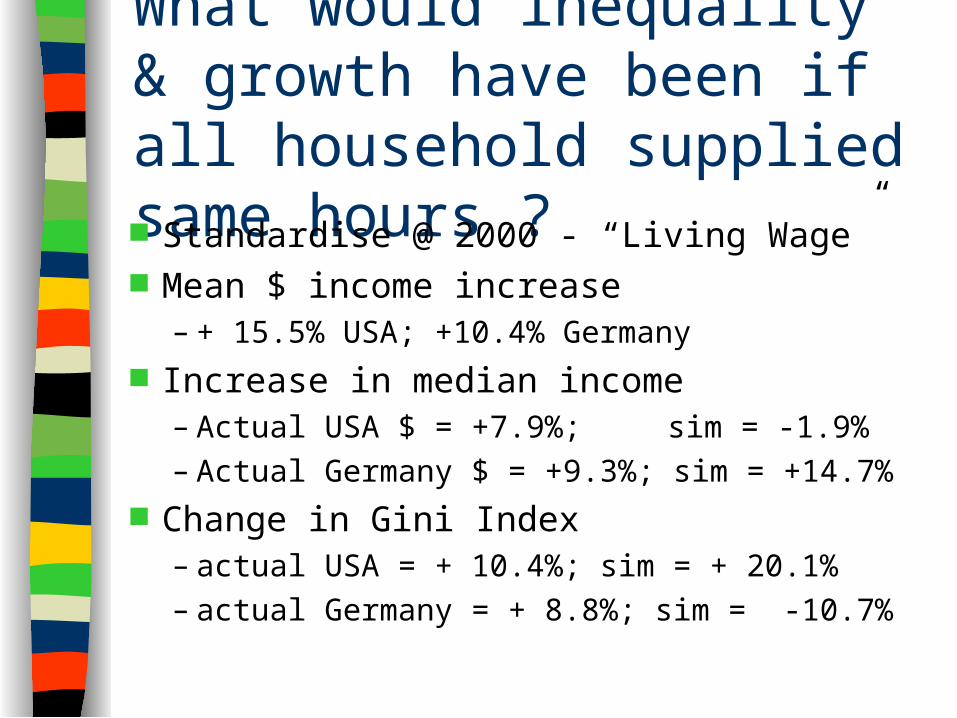
What would inequality & growth have been if all household supplied same hours ? Standardise @ 2000 - “Living Wage” Mean $ income increase
– + 15.5% USA; +10.4% Germany Increase in median income
– Actual USA $ = +7.9%; sim = -1.9%– Actual Germany $ = +9.3%; sim = +14.7%
Change in Gini Index– actual USA = + 10.4%; sim = + 20.1%– actual Germany = + 8.8%; sim = -10.7%

Low income Americans staved off part of their decline in living standards by increasing hours of work, which also lessened measured inequality in $
German performance in $ income understates performance in well being– for both median incomes and income
inequality Work hours matter for perception of
“growth” and “inequality”
Conclusion:

“Big Picture” - Osberg (2000) people typically (a) work in teams (b) enjoy
leisure time more in convivial company choice of working hours by individuals has
externalities, for both the marginal utility of leisure of other people and the marginal product of labour at firms
societies with stronger co-ordination mechanisms choose work hour norms which increase the returns to both leisure and work

Appendix A
“Nobody to Play With” An argument that, similar to Freeman &
Bell (2000) implicitly thinks of differences in average hours per person as reflecting differences between “typical” Germans & Americans
which is far from the case but it was / is a fun model

Both individuals & firms have search/matching problem Individuals - to enjoy fully leisure hours
– locate compatible playmates • HUGE VARIETY in leisure tastes
– find time to play together Firms - to maximize output & profit
– group people with complementary skills into production teams
• especially important for highly specialized
– synchronize work hours

Dual externalities to work hours the more time that other individuals work,
the harder it is for each person to find a leisure match– implication: lower marginal utility of leisure
the more time that other individuals work, the easier it is for firms to synchronize schedules– implication: higher marginal product labour
Uncoordinated Decisions + Externality– Multiple Equilibria ?? Optimality ??

$
01H1 H 2
Hi Li
A
B
MPMU1MU2
Leisure Externalities and Labour Supply

$
0 1
MU1SMU2
S
MP2S
MP1S
MPUMU1U MU2
U
A
B
C
H1
DE
Externalities at Work & Play - Skilled & Unskilled

Implications one possible equilibrium - working hours
relatively equal OR working hours diverge:
– rising average hours if work hours coordination breaks down
– greater increases in work time at top of income distribution
– + increasing hourly wage differentials• accentuates trend to rising earnings inequality
Ambiguous Social Welfare Effects of Growth in Money Income

MPQ H H
Hj S U i
MUU (c,L H )
L
H L H H
H ji j i
j
j i
j
j j
(, ; ,1 2
1 2 1