labour market information - durham workforce authority · •to understand and recognize trends in...
TRANSCRIPT

Labour Market Information

Presentation • Durham Region Labour
Market
o Indicators
o Durham Advantage
o Emerging Sectors
o Youth Employment Challenge
• Nuclear Sector Study • Tradeability • Construction Sector Study • Service Sector Study
BREAK

• Providing authoritative research
• Identifying employment trends
• Targeting workforce opportunities
• Initiating development projects
• Bringing people together
3
DWA – Innovative Labour Market Solutions

Labour Market Information (LMI)
LMI is accurate knowledge, facts and
statistics that tell a story about what is
happening in a particular place from the
perspective of the supply and demand of
labour.

LMI helps • To identify labour market supply / demand
• To get a profile of current labour market
conditions
• To understand and recognize trends in the labour market
• To predict outlooks for various occupational groups based on a variety of structural factors (economic, demographic, social, political)
• To provide input for and stimulate further research into informed employment and career decisions
5

LMI
Job seekers
Employment Support
Employers
Business Support

Sources of LMI Tradeability
Ontario economic development
Ministry of Finance –Ontario’s population & demographic information
Ministry of Finance –economic updates
MTCU–guide to using labour market information
Statistics Canada –census
Service Canada –Ontario job futures, employment prospects, wages/salaries, potential employers, occupational licensing & educational accreditation, apprenticeship and trades
Public libraries

Baseline Profile
• Characteristics of local employers
• Industrial trends in employment
• Population growth and age characteristics
• Migration patterns
• Educational attainment
• Occupation characteristics
• Other data– GTA analysis, KPI reports, apprenticeship, job generation & loss rates

The Bigger Picture
• More than half of the workforce of 2015 is
already in the labour market
• The next cohort of youth workers will be
smaller than in the past
• By 2011, immigration will account for all net
labour force growth in Canada
9

Shortfall of Workers to Rise
• And … it may rise to at least 200,000 to as high as 1.8 million by 2031
• Expected deficit of 40,000 workers 2011-2012
• By 2031 77% of the workforce will require a post secondary education
10
Labour Market Projections
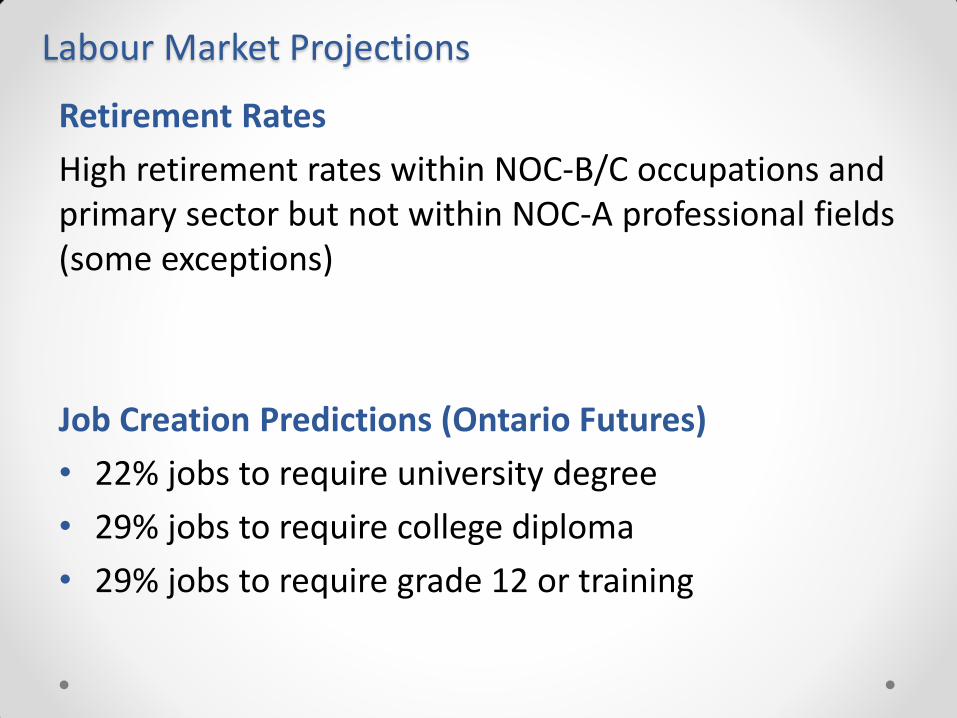
Retirement Rates
High retirement rates within NOC-B/C occupations and primary sector but not within NOC-A professional fields (some exceptions)
Job Creation Predictions (Ontario Futures)
• 22% jobs to require university degree
• 29% jobs to require college diploma
• 29% jobs to require grade 12 or training

Durham’s Competitive Advantage

We’re GRRRREAT!
Durham Region has a mix of urban and rural settings
We are the ‘Eastern Gateway’ to the GTA
Durham College’s new centre for food has 900 students

Durham’s Labour Market
The manufacturing sector has been a strong backbone of the Durham economies for more than 100 years. Superior knowledge and capabilities in several areas including: • Materials handling and logistics • Production processes • Robotics • Quality assurance • Research & development of advanced engineering, electrification, battery, fuel economy, green technologies • Health and safety.
2009 Community Adjustment and Sustainability Strategy

Increasing Industries
Highest numbers of firms by industry: Professional, Scientific & Technical Services
16% of all employers Construction
15% of all employers Highest number of firms by size and industry: Among large firms (100+ employees), Retail Trade, Manufacturing , Health Care and Social Assistance have by far the biggest numbers


Health and Wellness
• Detentak Laboratory
• Orthodent
• Holburn Biomedical Group
• Purdue Pharma
• Extendicare
• Thorton View
Bioscience and Agriculture
• Greenwood Mushroom Farm
• Hermann Laue Spice
• Dutchmaster Nurseries
• Ocala Orchards
• Pefferlaw Peat Products
Research, Development, Advance Manufacturing
• Mead Westvaco Packaging Systems
• McNairn Packaging
• Search Engine People
Automotive
• Custom Steel Fabrication
• Autodyne Machinery
• Global Emission Systems
• NAPA Auto Parts
• Volkswagan Canada
Sustainable Energy
• OPG
• Whitby Hydro
• Veridian
• Direct Energy
Information Technology
• Hubbell Canada
• Trench
CASS Employers

Total Employment &Sector Employment
Manufacturing and Wholesale Trade industries experienced losses in the number of employers across all size firms. Increases found in Construction, Retail Trade, and Health Care & Social Assistance (Finance & Insurance, Real Estate & Rental and Leasing, and Public Administration, also show either an increase or no change). The losses in Manufacturing and Wholesale Trade follow a trend evident across Ontario.
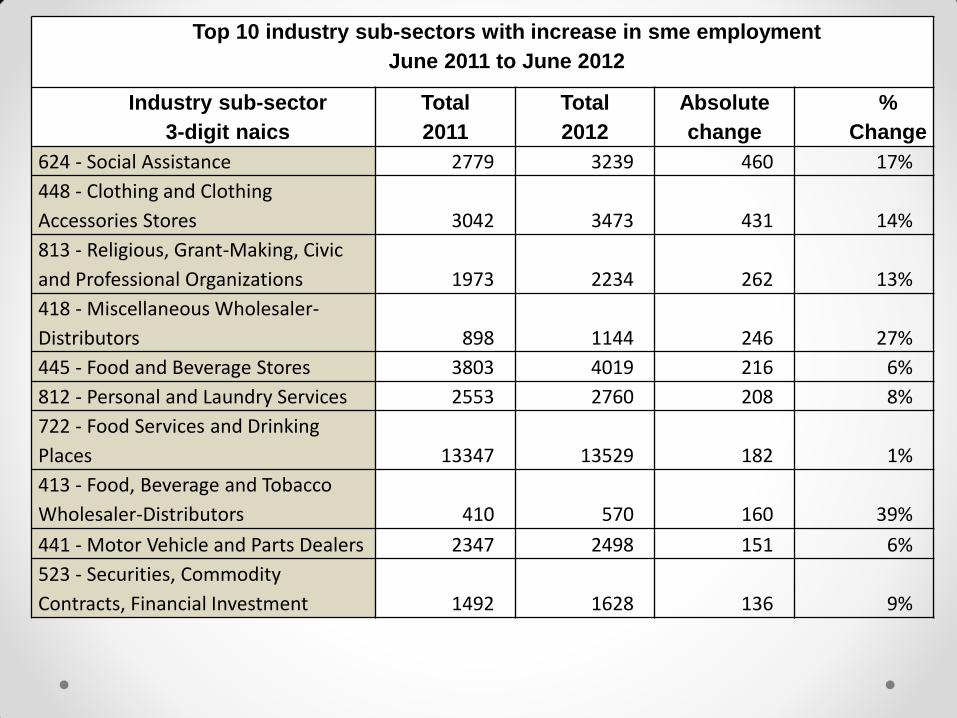
Top 10 industry sub-sectors with increase in sme employment
June 2011 to June 2012
Industry sub-sector
3-digit naics
Total
2011
Total
2012
Absolute
change
%
Change
624 - Social Assistance 2779 3239 460 17%
448 - Clothing and Clothing
Accessories Stores 3042 3473 431 14%
813 - Religious, Grant-Making, Civic
and Professional Organizations 1973 2234 262 13%
418 - Miscellaneous Wholesaler-
Distributors 898 1144 246 27%
445 - Food and Beverage Stores 3803 4019 216 6%
812 - Personal and Laundry Services 2553 2760 208 8%
722 - Food Services and Drinking
Places 13347 13529 182 1%
413 - Food, Beverage and Tobacco
Wholesaler-Distributors 410 570 160 39%
441 - Motor Vehicle and Parts Dealers 2347 2498 151 6%
523 - Securities, Commodity
Contracts, Financial Investment 1492 1628 136 9%

Durham Ontario
322 Paper manufacturing 1,685 27,685
323 Printing and related support activities 2,670 37,420
325 Chemical manufacturing 2,165 43,675
336 Transportation equipment manufacturing 13,655 169,350
415 Motor vehicle and parts wholesaler-distributors 1,790 24,010
416 Building material and supplies wholesaler-distributors 2,105 42,745
417 Machinery, equipment and supplies wholesaler-distributors 5,515 85,005
441 Motor vehicle and parts dealers 4,350 67,895
442 Furniture and home furnishings stores 1,585 30,100
Occupation
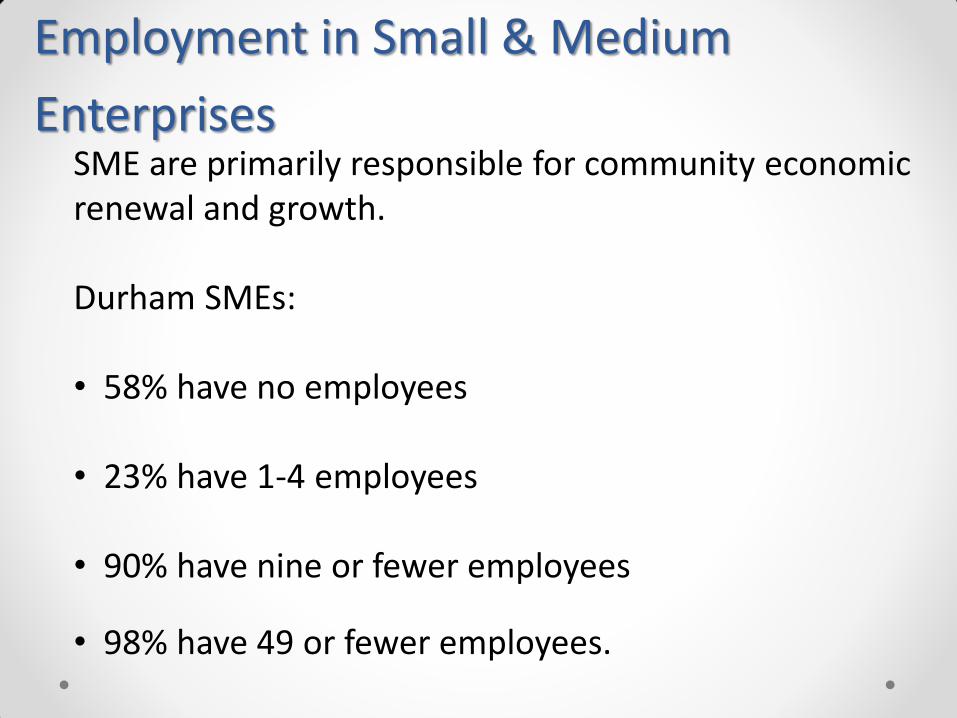
Employment in Small & Medium
Enterprises SME are primarily responsible for community economic renewal and growth. Durham SMEs: • 58% have no employees
• 23% have 1-4 employees
• 90% have nine or fewer employees
• 98% have 49 or fewer employees.

Durham
Change In Sme Employment By Industry Sector
June 2011 To June 2012
Industry Sector
2-digit Naics
Total
Employment
2011
Total
Employment
2012
Absolute
Change
Percent
Change
11 Agriculture 2,044 2,132 88 4%
21 Mining 246 210 -36 -17%
22 Utilities 287 316 30 9%
23 Construction 12,679 12,505 -174 -1%
31-33 Manufacturing 8,707 8,872 165 2%
41 Wholesale Trade 6,057 6,565 508 8%
44-45 Retail Trade 20,520 20,882 362 2%
48-49 Transportation/Warehousing 3,498 3,677 179 5%
51 Information And Cultural 1,162 1,178 16 1%
52 Finance And Insurance 5,736 5,964 228 4%
53 Real Estate And Rental And Leasing 4,391 4,404 12 0%
54 Professional Scientific Technical 8,865 8,989 124 1%
55 Management Of Companies 1,977 1,894 -83 -4%
56 Administrative Support 5,982 6,028 46 1%
61 Educational Services 1,781 1,820 39 2%
62 Health Care & Social Assistance 10,099 10,593 493 5%
71 Arts, Entertainment & Recreation 2,552 2,644 92 4%
72 Accommodation & Food 13,742 13,997 255 2%
Total 118,299 121,065 2,765 2%

Number of Employers
The number of employers, size of employers and changes in the number and size of employers over time affect employment levels and employment opportunities in a labour market.
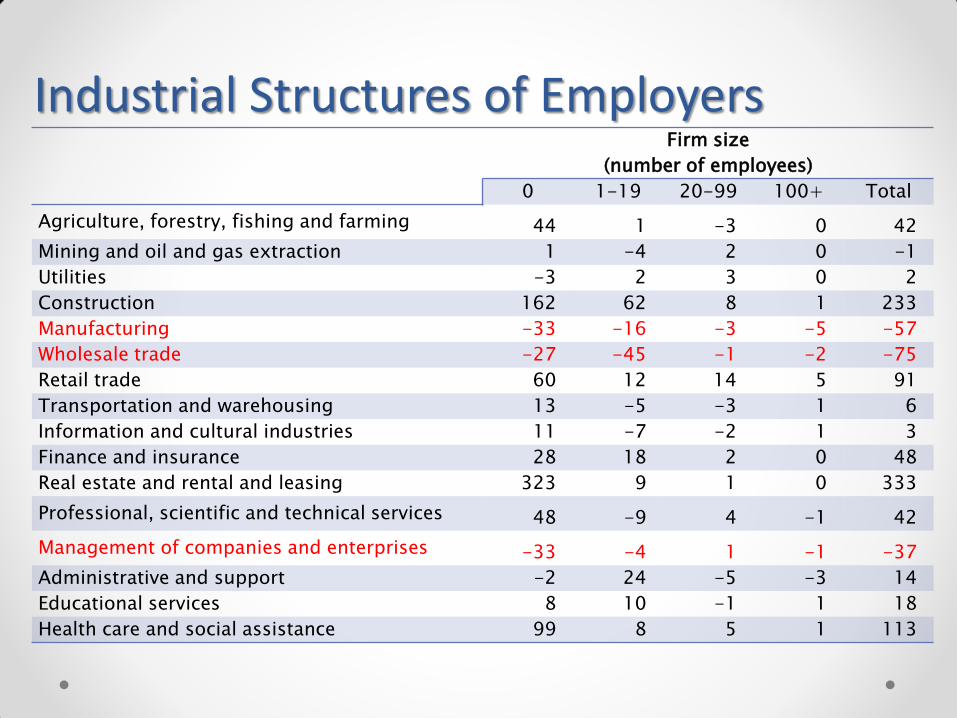
Industrial Structures of Employers Firm size
(number of employees)
0 1-19 20-99 100+ Total
Agriculture, forestry, fishing and farming 44 1 -3 0 42
Mining and oil and gas extraction 1 -4 2 0 -1
Utilities -3 2 3 0 2
Construction 162 62 8 1 233
Manufacturing -33 -16 -3 -5 -57
Wholesale trade -27 -45 -1 -2 -75
Retail trade 60 12 14 5 91
Transportation and warehousing 13 -5 -3 1 6
Information and cultural industries 11 -7 -2 1 3
Finance and insurance 28 18 2 0 48
Real estate and rental and leasing 323 9 1 0 333
Professional, scientific and technical services 48 -9 4 -1 42
Management of companies and enterprises -33 -4 1 -1 -37
Administrative and support -2 24 -5 -3 14
Educational services 8 10 -1 1 18
Health care and social assistance 99 8 5 1 113
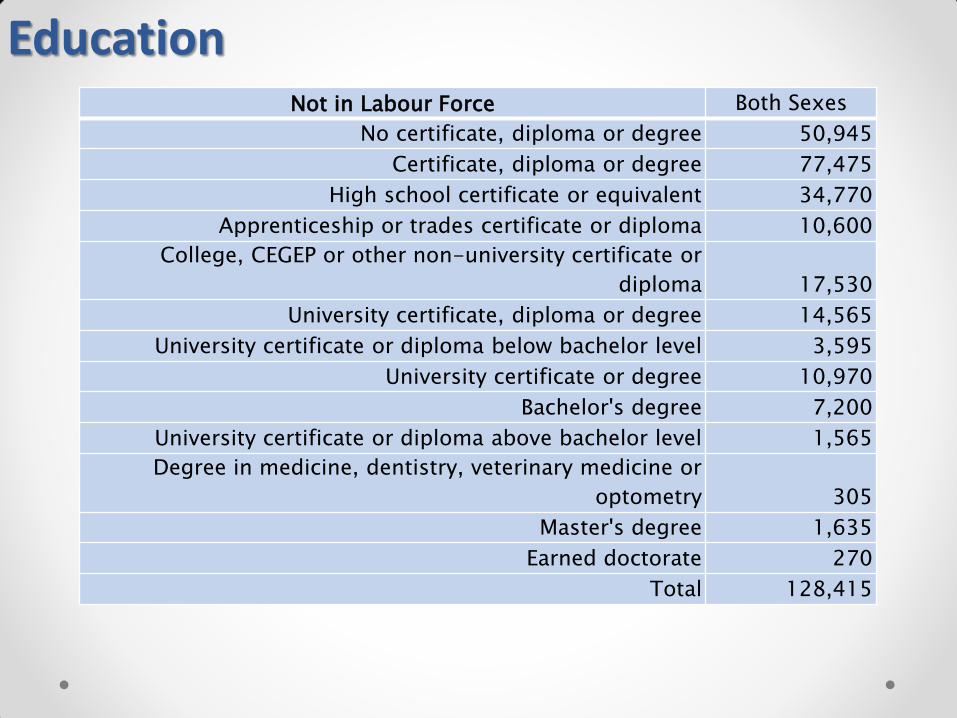
Not in Labour Force Both Sexes
No certificate, diploma or degree 50,945
Certificate, diploma or degree 77,475
High school certificate or equivalent 34,770
Apprenticeship or trades certificate or diploma 10,600
College, CEGEP or other non-university certificate or
diploma 17,530
University certificate, diploma or degree 14,565
University certificate or diploma below bachelor level 3,595
University certificate or degree 10,970
Bachelor's degree 7,200
University certificate or diploma above bachelor level 1,565
Degree in medicine, dentistry, veterinary medicine or
optometry 305
Master's degree 1,635
Earned doctorate 270
Total 128,415
Education
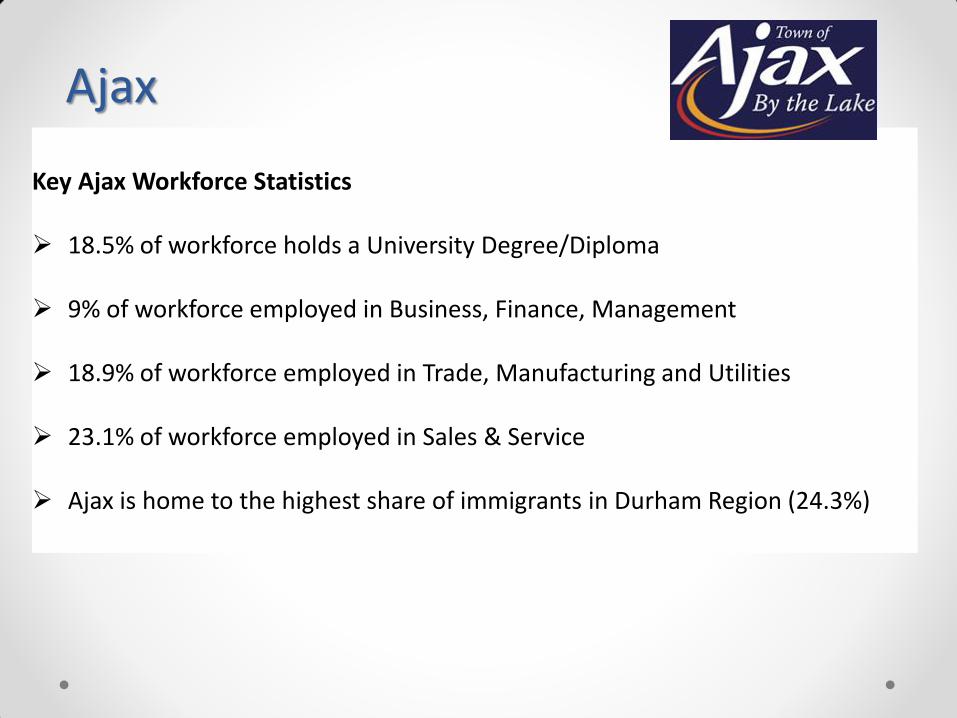
Key Ajax Workforce Statistics 18.5% of workforce holds a University Degree/Diploma 9% of workforce employed in Business, Finance, Management 18.9% of workforce employed in Trade, Manufacturing and Utilities 23.1% of workforce employed in Sales & Service Ajax is home to the highest share of immigrants in Durham Region (24.3%)
Ajax

Pickering Labour Force by Industry
Utilities 806
Construction 3,253
Manufacturing 5,132
Wholesale trade 2,982
Retail trade 5,804
Transportation and warehousing 1,984
Information and cultural industries 1,973
Finance and insurance 4,431
Real estate and rental and leasing 1,032
Professional, scientific and technical services 4,274
Administrative and support, waste management and
remediation services
2,240
Educational services 2,867
Health care and social assistance 4,151
Accommodation and food services 2,148

Careers in Nuclear - National • The Canadian nuclear industry provides Canadians with long-
term, sustainable employment opportunities.
• The Canadian nuclear industry employs over 60,000 Canadians both directly and indirectly. o 30,000+ direct nuclear industry jobs
• Uranium mining
• Power generation
• Nuclear Medicine
• Research
o 30,000+ indirect jobs
• Manufacturing
• Hospitality
• Human resources
• Housing

Type of Occupation Number of Jobs Projected Length of Employment
Reasoning, comments, assumptions
Mining 10,000+ (growth likely due to demand)
Indefinitely Uranium is high quality
resource with large amounts
present in Canada. It is
projected to remain a
competitive resource for
decades to come.
Nuclear Power Generation (Operators)
19,000 Until 2050 Assuming full refurbishment in
Ontario as well as new build at
Darlington. Does not account
for other potential new build
nor foreign operation
Nuclear Power Plant Refurbishment
10,000+ 11 years Assuming ten refurbishment as
per the Ontario Long Term
Energy Plan. Does not include
refurbishment of Gentilly 2.
New Build 21,000+ Five years Assuming two full-sized
reactors at Darlington with
majority Canadian content (as
is likely to be required by the
scope and procurement
processes)

0 2000 4000 6000 8000 10000 12000 14000 16000 18000
Agriculture
Business Sevices
Coal
Construction
Crude Oil
Education
Electricity Utility
Finance, Insurance & Real Estate
Food and Accommodation Service
Forestry
Gas Utility
Heath
Manufacturing
Natural Gas
Other Mining
Other Services
Retail
Transportation & Communication
Wholesale
868
11128
0
507
62
3895
16137
3645
3827
189
60
5011
4816
100
1871
3124
7313
2543
1596
Jobs
Sect
or
Employment impact of production of electricity from 17 nuclear power generation units in Canada, 2005 (Jobs)
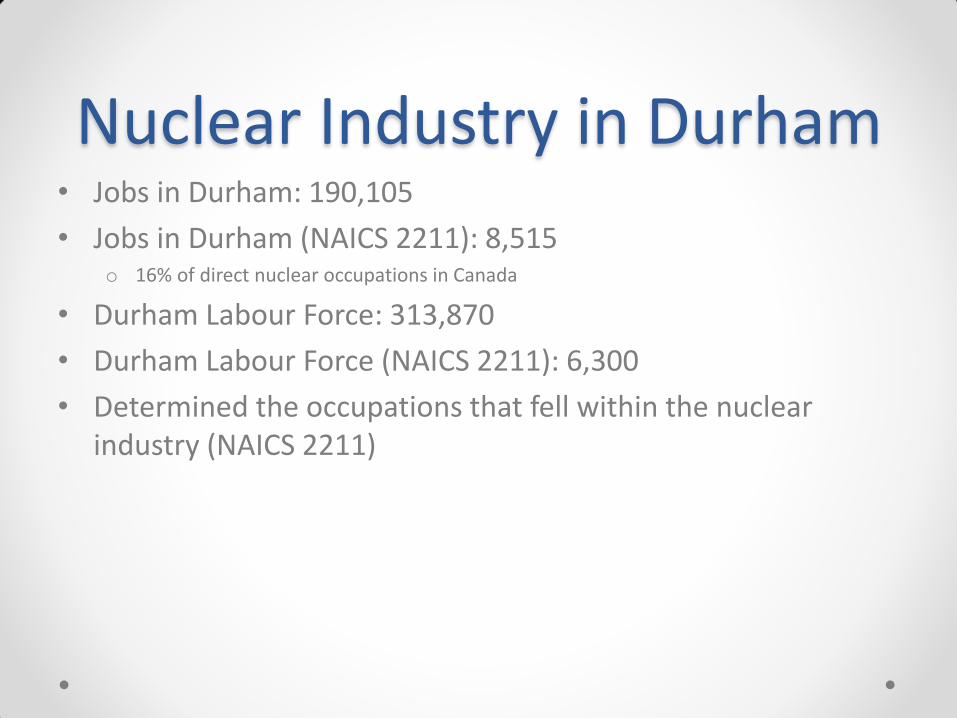
Nuclear Industry in Durham • Jobs in Durham: 190,105
• Jobs in Durham (NAICS 2211): 8,515 o 16% of direct nuclear occupations in Canada
• Durham Labour Force: 313,870
• Durham Labour Force (NAICS 2211): 6,300
• Determined the occupations that fell within the nuclear industry (NAICS 2211)
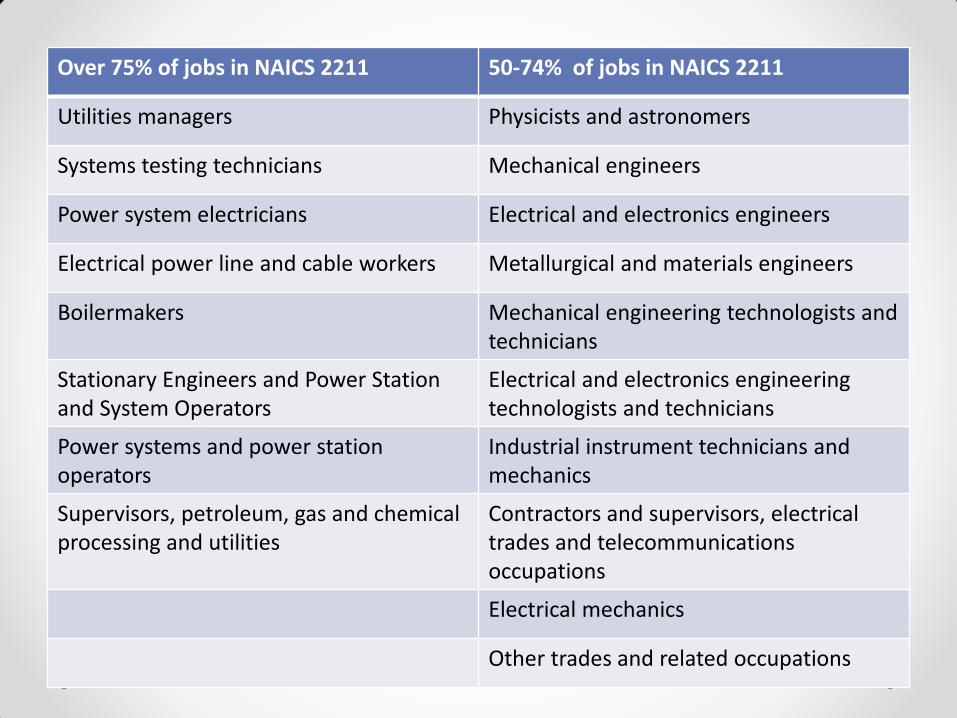
Over 75% of jobs in NAICS 2211 50-74% of jobs in NAICS 2211
Utilities managers Physicists and astronomers
Systems testing technicians Mechanical engineers
Power system electricians Electrical and electronics engineers
Electrical power line and cable workers Metallurgical and materials engineers
Boilermakers Mechanical engineering technologists and technicians
Stationary Engineers and Power Station and System Operators
Electrical and electronics engineering technologists and technicians
Power systems and power station operators
Industrial instrument technicians and mechanics
Supervisors, petroleum, gas and chemical processing and utilities
Contractors and supervisors, electrical trades and telecommunications occupations
Electrical mechanics
Other trades and related occupations
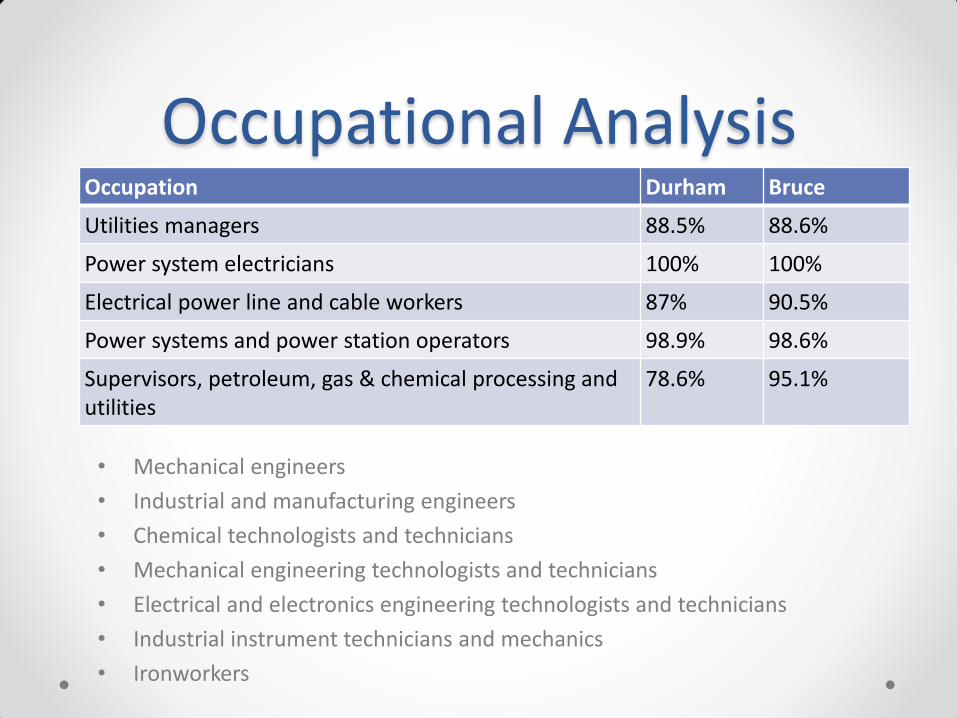
Occupational Analysis Occupation Durham Bruce
Utilities managers 88.5% 88.6%
Power system electricians 100% 100%
Electrical power line and cable workers 87% 90.5%
Power systems and power station operators 98.9% 98.6%
Supervisors, petroleum, gas & chemical processing and utilities
78.6% 95.1%
• Mechanical engineers
• Industrial and manufacturing engineers
• Chemical technologists and technicians
• Mechanical engineering technologists and technicians
• Electrical and electronics engineering technologists and technicians
• Industrial instrument technicians and mechanics
• Ironworkers

Educational Attainment NAICS 2211
Total labour force by highest certificate, diploma or degree 6300 100.0%
No certificate, diploma or degree 120 1.9%
Certificate, diploma or degree 6180 98.1%
High school certificate or equivalent 1205 19.1%
Apprenticeship or trades certificate or diploma 880 14.0%
College, CEGEP or other non-university certificate or diploma 2610 41.4%
University certificate or diploma below bachelor level 180 2.9% University certificate, diploma or degree at bachelor's level or above 1300 20.6%
Bachelor's degree 930 14.8%
University certificate or diploma above bachelor level 130 2.1% Degree in medicine, dentistry, veterinary medicine or optometry 0 0.0%
Master's degree 200 3.2%
Earned doctorate 45 0.7%

Field of Study NAICS 2211 No postsecondary certificate, diploma or degree 1325 21.0%
Education 45 0.7%
Visual and performing arts, and communications technologies 75 1.2%
Humanities 40 0.6%
Social and behavioural sciences and law 265 4.2%
Business, management and public administration 600 9.5%
Physical and life sciences and technologies 275 4.4%
Mathematics, computer and information sciences 85 1.4%
Architecture, engineering, and related technologies 3200 50.8%
Agriculture, natural resources and conservation 85 1.4%
Health, parks, recreation and fitness 110 1.8%
Personal, protective and transportation services 200 3.2%
Other fields of study 0 0.0%

Occupational Profiles • 16 occupational profiles
o Power system electricians
o Electrical power line and cable workers
o Boilermakers
o Welders and related machine operators
o Construction millwrights and industrial mechanics (except textile)
o Power systems and power station operators
o Supervisors, petroleum, gas and chemical processing and utilities
o Engineering managers
o Utilities managers
o Professional occupations in business services to management
o Mechanical engineers
o Electrical and electronics engineers
o Mechanical engineering technologists and technicians
o Electrical and electronics engineering technologists and technicians
o Medical radiation technologists
o Security guards and related occupations

Power Systems Electricians Age Range Number of
Employees
15- 24 30
25-44 175
45+ 145
Total Employees 350
Percent over 45 years 41.43%
Average Salary Median Salary
$ 94,248.00 $94,544.00
Industry of Employment
Number of Employees
Percentage of Total
22 Utilities 340 97.14%
54 Professional, scientific and technical services
10 2.86%
Labour Force 305
Labour Force (NAICS 2211) 300
Employed Labour Force 280
Employed Labour Force (NAICS 2211) 280

Security Guards and Related
Occupations Age Range Number of
Employees
15- 24 205
25-44 420
45+ 460
Total Employees 1085
Percent over 45 years 42.40%
Average Salary Median Salary
$40,089 $33,001
Industry of Employment
Number of Employees
Percentage of Total
56 Administrative and support, waste management and remediation services
450 41.47%
22 Utilities 175 16.13%
91 Public administration
120 11.06%
Labour Force 1690
Labour Force (NAICS 2211) 135
Employed Labour Force 1605
Employed Labour Force (NAICS 2211) 135

Welders and Related Machine Operators
Age Range Number of Employees
15- 24 75
25-44 315
45+ 375
Total Employees 765
Percent over 45 years 49.02%
Average Salary Median Salary
$54,294 $48,047
Industry of Employment
Number of Employees
Percentage of Total
31-33 Manufacturing
525 68.63%
81 Other services (except public administration)
130 16.99%
23 Construction 40 5.23%
22 Utilities 35 4.56%
Labour Force 1190
Labour Force (NAICS 2211) 30
Employed Labour Force 1110
Employed Labour Force (NAICS 2211) 25
In 2006, there were an estimated 20,760 residents in the labour force & 6,290 jobs in
Durham’s core construction sector.
Support industries there were an estimated 27,215 residents in the labour force and
16,795 jobs in Durham Region.
For the core construction sector, over ½ labour force has attained a high school diploma
(26.9%) or apprenticeship training (26.5%)
Contrast these attainment rates with support industries, and the highest educational
attainment is a college diploma (31.9%) followed by a high school diploma (27.3%)
university degrees (23.1%).
Construction Report 2012

Construction Skill Requirements
Job requirements range from the completion of secondary school and WHMIS training to advanced university degrees and experience.
In June 2011, there were an estimated 4,469 businesses in Durham Region in the core construction sector.
Nearly 3,000 (66% of the total) of these businesses were specialty trade contractors. Over 7,500 businesses are engaged in support industries in Durham Region.
The largest component of the support industries is classified under professional, scientific and technical services (4,690 businesses or 62% of the total).

The Service Trades
There are over 150 apprenticeable trades in the Province of Ontario. Forty of them—over 25%—fall into the service sector. Though the trades in this sector are diverse, one common denominator unites them – they all deliver a service
Apprenticeable trades are defined as those with a formal on-the-
job training program set by industry and the Ministry of Training,
Colleges and Universities.
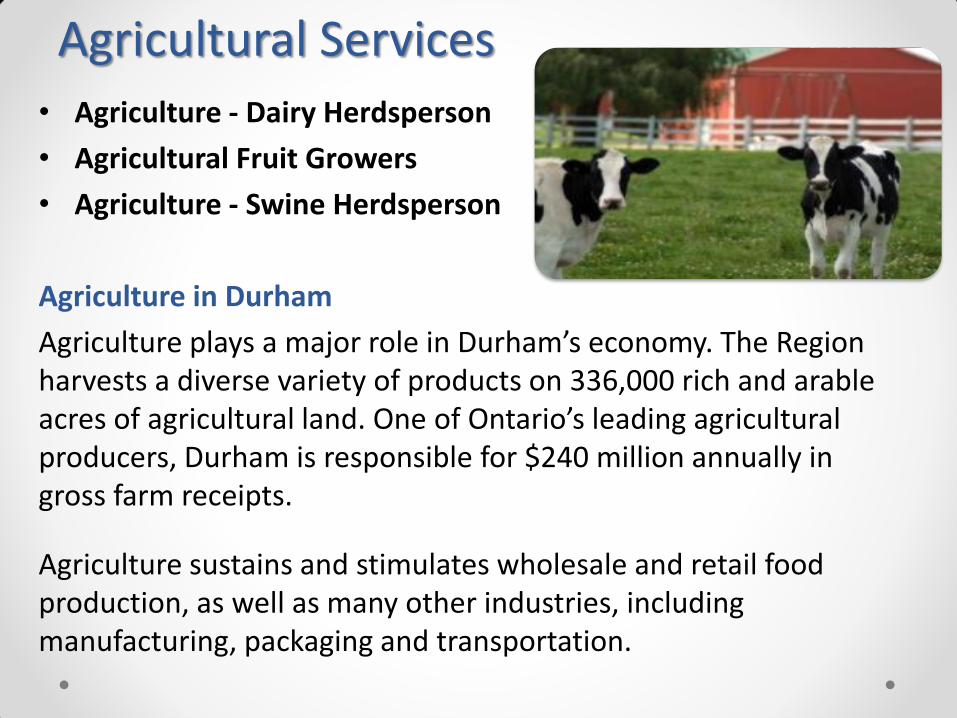
Agricultural Services
• Agriculture - Dairy Herdsperson
• Agricultural Fruit Growers
• Agriculture - Swine Herdsperson
Agriculture in Durham
Agriculture plays a major role in Durham’s economy. The Region harvests a diverse variety of products on 336,000 rich and arable acres of agricultural land. One of Ontario’s leading agricultural producers, Durham is responsible for $240 million annually in gross farm receipts.
Agriculture sustains and stimulates wholesale and retail food production, as well as many other industries, including manufacturing, packaging and transportation.

Skill Shortages & Wages Skilled tradespeople are in short supply in Durham, according to the Agriculture Labour Market Survey. Employers find that many candidates don’t have a general knowledge of farm regulations, or the commodity-specific knowledge or experience they need. Farmers also find that fewer employees are interested in time-intensive farmwork. However, many farmers cannot pay skilled workers competitive wages. Hardest-hit by these related problems are fruit and vegetable farmers, with 87% of operators reporting a shortage of workers.

Culinary Services
• Institutional Cooks • Bakers • Chef
Employers Ajax Convention Centre, Deer Creek and the General Motors Centre Lakeridge Health, Ontario Shores Centre, childcare centres & long-term care facilities Culinary opportunities also exist throughout Durham in the region’s many and varied restaurants.
Employment prospects Organizations surveyed hope that the Institutional Cook trade will soon become the standard for long-term care facilities, hospitals, correctional institutions, etc., a goal shared by the Ontario and Canadian Societies of Nutritional Managers.
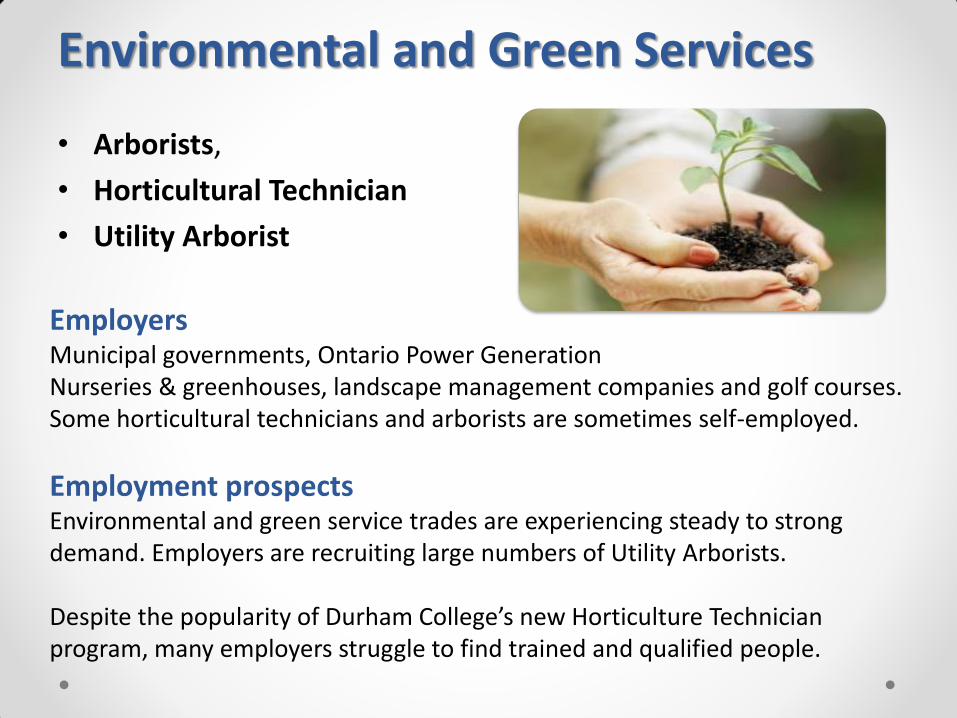
Environmental and Green Services
• Arborists,
• Horticultural Technician
• Utility Arborist
Employers Municipal governments, Ontario Power Generation Nurseries & greenhouses, landscape management companies and golf courses. Some horticultural technicians and arborists are sometimes self-employed.
Employment prospects Environmental and green service trades are experiencing steady to strong demand. Employers are recruiting large numbers of Utility Arborists. Despite the popularity of Durham College’s new Horticulture Technician program, many employers struggle to find trained and qualified people.

Human Services
• Child and Youth Workers
• Child Development Practitioners
• Developmental Services Workers
• Educational Assistants
Employers School boards, group homes or in private homes, or for government, community agencies, hospitals, and correctional facilities.
Employment prospects Even though Human Services are apprenticeable trades, the successful completion of an apprenticeship will not secure a position. (Ontario’s College of Early Childhood Educators (CECE), for example, does not recognize the Child Development Practitioner apprenticeship.) Most employers require their employees to be members of the professional association governing their industry provincial governing body, and apprenticeship alone will not qualify a worker to join. Apprenticeship is still worth pursuing.

Sources of LMI • Tradeability, DRLTB, Local economic development offices
• Region of Durham Planning Department • Ministry of Finance –Ontario’s population & demographic
information • Ministry of Finance –economic updates • MTCU • Statistics Canada –census • Service Canada –Ontario job futures, employment prospects,
wages/salaries, potential employers, occupational licensing & educational accreditation, apprenticeship and trades

References
• City of Toronto, “Agenda for Prosperity”, January 2008
• Miner, Ph.D., Rick, “People Without Jobs “Jobs Without People”, February 2010
• Region of Durham, Local Diversity and Immigration Partnership Council, “Diversity and Immigration Community Plan”. March 2011
• ILLMP 2011 DRLTB, 2011
• DRLTB, Labour Market Strategies for Durham Construction Sector, 2012
• City of Oshawa Community Profile, 2011
• Conference Board of Canada; RBC Poll 2009
• Ontario Futures; Statistics Canada, Census 2006