labour in indian agriculture
TRANSCRIPT

1
LABOUR IN INDIAN AGRICULTURE: A GROWING CHALLENGE

2
3
ContentsForeword
Introduction
Explaining the Shift Away from Agriculture
Way Forward
Annexure
pg4
pg9
pg19
pg51
pg60
Executive Summarypg7
Agricultural Workforce: An Overviewpg11
Strategic Options to Address Labour Shortagepg33
Conclusionpg58

4Foreword
The agricultural division in
FICCI has been undertaking
several field level studies
and surveys to analyze
the ground level concerns
plaguing Indian agriculture.
During interaction with the
farmers the challenge of
shortage in availability of
agricultural labour came
to the fore. Although several anecdotal evidences
were available, we from FICCI decided to analyze
the magnitude of the challenge and subsequently
commissioned a research study to KPMG.
We have now come up with a comprehensive report
based on published secondary data. Employment data
generated from National Sample Survey Organization’s
(NSSO) Rounds on employment and unemployment
shows that the percentage of people employed in
agriculture has been consistently declining, from around
60% in 1999-00 to 49% in 2011-12. In absolute terms,
between 2004-05 and 2011-12, there has been a net
reduction of 30.57 million of labour from the agricultural
sector.
This reduction in supply along with the support by a
number of Government schemes, including MGNREGA
has led to an escalation in farm wages which is
adversely impacting the profitability of the farmer. Rural
wages have been growing by 17% on average since
2006-07 outstripping urban wages. At the same time, the
increase in wages, without an increase in productivity, is
fuelling inflation.
This reduction needs to be compensated by adequate
measures to reduce the overall labour intensity of the
sector. Improved seed varieties, widespread extension
services and farm mechanization remain three critical
areas of intervention and focus.
The study shows that close to 79% of this reduction
has been contributed by the five states - Uttar Pradesh,
Karnataka, West Bengal, Bihar and Rajasthan.
The impact is more pronounced in case of certain
crops which are labour intensive and are also widely
grown in the country. A combination of these two factors
highlights that Paddy, Wheat, Cotton Sugarcane and
Groundnut are among the most likely crops to be
affected by labour scarcity.
I am sure the book will be of interest to policy makers,
industry players as well as the academia.
Dr. A Didar Singh
Secretary General
Federation of Indian Chambers of
Commerce & Industry (FICCI)

5
As a country becomes
affluent, the workforce
tends to move away from
low productivity agriculture
sector to other high
productivity sectors. In
India a similar trend has
been observed over the
last decade with the share
of workforce as well as the
number of people employed in agriculture sector have
reduced. This has led to a need to reorient our strategies
to meet the needs of the farmers as well as to rejuvenate
the sector.
The report aims to understand the impact of the shifting
labour pattern and suggests ways to overcome the
same. A two pronged approach, tackling both the input
and output factors, is required that reduces the need for
human labour, increases returns from agriculture and
improves farm to retail linkages.
Indian Agriculture Labour Shortage – A growing problem,
a study jointly prepared by KPMG in India and FICCI,
provides a perspective on the shortage of labour in
Indian agriculture which may act as a road map to
changes in the agriculture landscape. We hope that you
find this study insightful.
Rajat Wahi
Partner KPMG
Management Consulting Head
Consumer, Retail and Agri Sector
Foreword

6

7
The importance of agriculture in the context of the
Indian economy is paramount. Not only is it a
pivotal component in achieving several of India’s
goals- attaining food security, an 8% GDP growth rate
and enhancing rural income but it is also the sector with
highest share of workers in the country. The average
growth rate in the agriculture sector in the last five years
has been 4.1%.
It is an established trend that as an economy matures,
there is a movement of agricultural workers from low
productivity agriculture to higher productivity sectors.
However in India, the trend has not been limited to
just declining share of agriculture in total employment
but also has led to a significant decline in absolute
number of people employed in the agricultural sector. A
comparison across two time periods, 2004-05 and 2011-
12, indicates that while there was an increase in the
size of the total workforce in the country, the size of the
agricultural workforce reduced by 30.57 million people.
The share of agricultural workforce in total workforce
declined from 56.7% to 48.8% in the same period. This
brings to the fore that fewer people are being added
to the workforce in agriculture and highlights the net
migration to other sectors.
Factors such as higher remuneration and growth of
opportunities in alternate sectors coupled with the
relatively lower rise in wages in agricultural occupations
as compared to other sectors have led to the migration
of workforce away from agriculture which has resulted
in labour shortage and consequent escalation of cost
of cultivation. Furthermore, government schemes like
MGNREGA which have facilitated migration of labour to
other segments need to be reformed.
Adequate measures are required to reduce labour
requirement to avoid productivity from getting affected,
which can have a detrimental effect on the eventual
output and price. Other nations facing this issue have
responded by widespread use of technology on farms
to replace many traditional farming occupations. The
factors to be considered by key stakeholders such as
farmers, industry and government to reduce agriculture
labour requirement are:
Input factorsv Immediate Effect: Adopt productivity enhancing
techniques such as enhanced extension services,
mechanization, promoting use of labour reducing
seed technology and use of herbicides
vLong Term Effect: Increase returns from
agriculture through research driven improvements
in seed technology, intensive farming technique
and sequential cropping technique
Output factorsvStrengthening linkages to agri-businesses through
contract farming, agriculture cooperatives and
farmer equity model
The state governments and the central government can
undertake a number of initiatives to make agriculture
more productive and remunerative. Freeing up the land
lease market, encouraging the adoption of custom hiring
and facilitating private trade through provisions in the
APMC Reform, retargeting of MNREGA. and increasing
investment in agricultural investments though greater
coordination between various stakeholders will go a long
way in this regard.
Executive Summary

8
LABOUR IN INDIAN AGRICULTURE: A GROWING CHALLENGE
9
IntroductIon
Agriculture and Its Importance in the Indian EconomyThe importance of agriculture can never be over-stated. Although the share of agriculture in India’s GDP has been
declining, yet agriculture and its allied sectors like forestry and fishing (but not including mining and quarrying)
contributes nearly 14% to India’s GDP, accounts for about 11% of our exports, and supports half of our population’s
livelihood, besides also being the source of raw material for a large number of industries.
Accelerating to a higher agriculture growth rate is critical for a variety of reasons – attaining food security, achieving
an overall 8% growth rate in GDP as envisaged in the 12th Five year plan and enhancing rural income, which
presently is abysmally low.
Irrespective of the relative contribution, the average growth rate in the agriculture sector in the last five years till 2013-
14 (taking into account the advance estimates for 2013-14) has been 4.1%. The Twelfth Five Year Plan also envisages
a similar growth rate.
Indian agriculture has marked its presence at the global level. India is world’s largest producer of milk, pulses and
second largest producer of rice, wheat, fruits, vegetables, sugarcane. India’s food grain production crossed 250 million
tonnes during the year 2011-12. Rice production crossed 100 million tonnes and wheat production crossed 90 million
tonnes.
As of 2011,India’s arable land area of 159.7 million hectares (394.6 million acres) is the second largest in the world,
after the United States. Its gross irrigated crop area of 82.6 million hectares (215.6 million acres) is the largest in the
world.
Despite its declining relative share in GDP, several innovative steps and measures are being undertaken and the
sector has done reasonably in the last few years. However, one of the major bottlenecks that has emerged and can
become an insurmountable problem in the foreseeable future is the issue of shortage of agricultural labour.
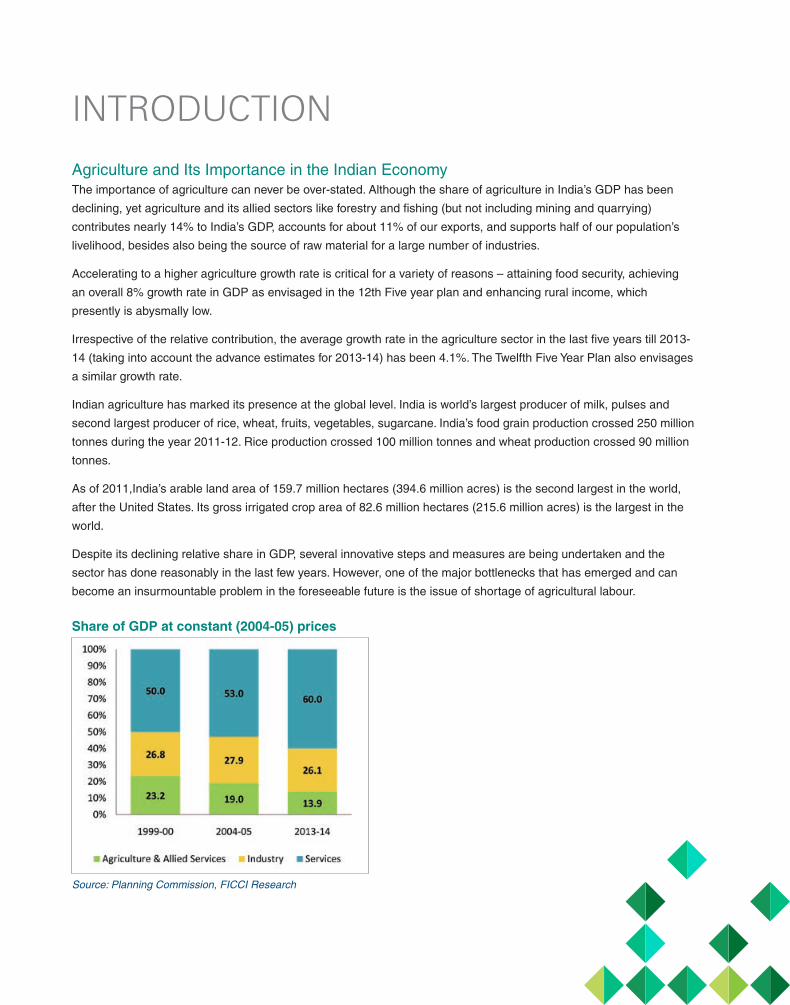
Source: Planning Commission, FICCI Research
Share of GDP at constant (2004-05) prices

10
Total workforce vs. Agricultural Workforce (2011-12)
Agriculture provides employment to not only the adult males of a households but also to women on the households .
Women work extensively in production of major grains and millets, in land preparation, seed selection and seedling
production, sowing, applying manure, weeding, transplanting, threshing, winnowing and harvesting.
Agriculture plays a significant role in overall socio-economic development. Therefore, fostering rapid, sustained and
broad-based growth in agriculture remains key priority for the country. With the decreasing labour force in agriculture,
increasing yield or productivity is the key to growth, which has to be accelerated. Shortage of labour and finding
solutions thereof should become a major focus. India’s crop yields are yet only 30% to 60% of the best crop yields
achievable in the farms of developed as well as other developing countries. Improved seed varieties, widespread
extension services and farm mechanization remain three critical areas of intervention and focus.
Total Population 1.2 Billion
Total Workforce 467 Million
Secondary Sector110.7 Million
Tertiary Sector127.8 Million
Agriculture sector228.3 Million
Rest of Population 743 Million
11
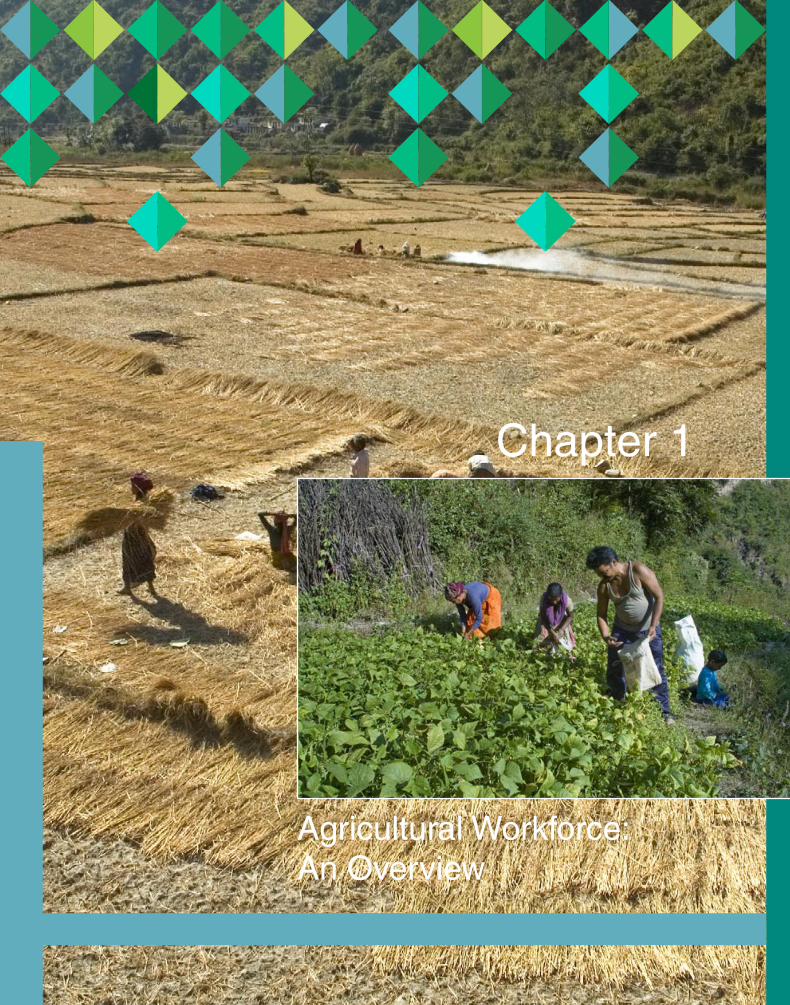
Chapter 1
Agricultural Workforce: An Overview

12
Agricultural Workforce: An OverviewEmployment data is generated from the National Sample Survey Organization’s (NSSO) Rounds on employment and
unemployment. Data used pertains to the 55th Round (1999-2000), 61st Round (2004-05), 66th Round (2009-10),
and the 68th Round (2011-12).
Data shows that India’s overall employment growth since 2004-05 has been anemic. At an average, only around 2
million people were added to the workforce since 2004-05 compared to around 12 million people that were added to
the workforce every year as an average between 1999-00 and 2004-05.
However, the addition to non-agricultural employment has actually been around 6 million people every year since
2004-05, as the workforce employed in agriculture had started declining in absolute numbers and consistently so,
since then. The size of the workforce in agriculture declined by around 30.57 million between 2004-05 and 2011-12,
although the size of the total workforce increased. This is the first such period when a reduction in absolute numbers
has been reported in agriculture.
It has been observed that over time that as economies progress and move towards development, workforce tends to
move away from primary sectors of the economy. Consistent with this empirical evidence observed worldwide, even in
India, the percentage of people employed in agriculture has been consistently declining, from around 60% in 1999-00
to 49% in 2011-12.
Source: NSSO, FICCI Research
People Employed in Agriculture and Overall Employment

13
Agricultural W
orkforce: An O
verview
Usually, as an economy matures, there is a movement
of excess agricultural workers from low productivity
agriculture to higher productivity sectors like
manufacturing and services, and thus from rural to urban
areas, and form lower wages to higher wages. The pace
of this movement accelerates with higher economic
growth, which gives rise to greater job opportunities in
the non-agricultural sectors. Goldman Sachs (2014)
calculated that labour is 4 times more productive in
industry and 6 times more productive in services
compared to agriculture. Higher productivity usually
implies higher wages. Thus the natural movement away
from agriculture. Such shifts are also coupled with
technological advancement of the primary sector leading
to lower labour intensity and higher capital investment in
several instances.
India has also been experiencing a similar trend in its
workforce movement. But the trend has not been limited
to just declining share of agriculture in total employment
but also has led to a significant decline in absolute
number of people employed in the agricultural sector. A
comparison across two time periods, 2004-05 and 2011-
12, indicates that while the size of the total workforce
in the country increased by roughly around10 million,
the size of the agricultural workforce reduced by 30.57
million people. In the process the share of agricultural
workforce in total workforce declined from 56.7% to
48.8% in the same period (considering principal and
subsidiary activities). It not only indicates that fewer
people are being added to the workforce in agriculture
but also highlights the net migration to other sectors.
Between 2001 and 2011, India added 181.5 million
to its population, half of which was in the rural areas.
With agriculture being the mainstay in rural areas,
what it signified was that enough labour should be
available for agriculture. Moreover, agriculture in India
has been characterized by a high degree of disguised
unemployment. In other words even if some amount
of labour was taken out from agriculture there would
be no difference to output and productivity. Both these
put together would suggest that labour availability for
agriculture should not be a problem. This has been the
popular perception.
Moreover, yields, especially for food grains have been
increasing in the last several years. As per data from the
Ministry of Agriculture, Directorate of Economics and
Statistics, the Compound Annual Growth Rate (CAGR)
of food grains yield between 1999-2004 was 0.1% but
increased to 2.5% between 2004-2009. Increase in yield,
it is argued could not have been possible if there was a
shortage in agricultural labour.
However in reality, the magnitude and pace of the shift
away from agriculture has been substantial as has been
evidenced here. It also has began to make an impact
as the shortage in agricultural labour is currently not
being compensated by adequate measures to reduce
the overall labour intensity of the sector. As a result, the
primary sector in many Indian states is experiencing
severe labour shortage and escalation in farm wages
which are adversely impacting the profitability of the
farmer.
State Wise and Crop Wise effect of Agriculture Labour AvailabilityThis reduction is a cumulative effect of similar reductions
across all major states. Close to 79% of this reduction
has been contributed by the five states only - Uttar
Pradesh, Karnataka, West Bengal, Bihar and Rajasthan
while the remaining states constitute the rest 21%.

14
Source: NSSO Reports 61st and 68th Rounds, Census of India, KPMG Analysis
Source: NSSO Reports, Census of India, KPMG Analysis
State Agricultural labour(Million)
Reduction(Million)
2004-05 2011-12
Uttar Pradesh
43.30 34.83 8.47
Karnataka 17.60 12.91 4.69
West Bengal
15.50 11.79 3.71
Bihar 21.30 17.67 3.63
Rajasthan 17.40 13.83 3.56
Others 143.83 137.31 6.52
Total 258.93 228.36 30.57
Contribution of States to Agriculture Labour Force Reduction: 2004-05 to 2011-12
An analysis across states (graph below) shows that for Kerala, Uttarakhand, Karnataka etc, even though the absolute
magnitude of reduction is not large, it forms a substantial share of the agricultural workforce these states had in
2004-05. The analysis clearly highlights that between 2004-05 and 2011-12, a large percentage of the agricultural
workforce across states moved away from agriculture.
Change of Agricultural Workforce Between 2004-05 and 2011-12 (Base Year 2004-05)

15
Total Area Under Paddy, Wheat, Groundnut, Cotton, Sugarcane
Source: Department of Agriculture and Cooperation, KPMG Analysis
Labour Intensity Across CropsAlthough labour scarcity affects the agriculture sector, the impact is more pronounced in case of certain crops
which require significant amount of labour hours per unit area cultivated and are also widely grown in the country. A
combination of these two factors (illustrated in the graph below) highlights that Paddy, Wheat, Cotton Sugarcane and
Groundnut are among the most likely crops to be affected by labour scarcity.
Source: Department of Agriculture and Co operation, KPMG AnalysisNote: Man hours for crops are an average across states, data pertains for 2011
The spread and coverage of the five key crops has
been analyzed across states.
v Andhra Pradesh, Maharashtra, Madhya
Pradesh and Uttar Pradesh have the highest
area under cultivation of these five major crops,
with a higher share of Paddy in all these cases.
Maharashtra also has high cotton coverage
while Andhra has both groundnut and cotton
v Bihar, Chhattisgarh, Gujarat, Orissa, Punjab and
West Bengal fall in the next category. Of these
states Punjab has a high coverage of wheat,
while Gujarat has large coverage of cotton and
groundnut
In these states labour shortage is likely to affect
production and adequate steps are required to
reduce the labour intensity associated with their
cultivation.
Agricultural W
orkforce: An O
verview
> 7 Mn Ha
> 4 Mn Ha
> 1 Mn Ha
< 1 Mn Ha

16
In the graph below, the share of agricultural labour which shifted between 2004-05 and 2011-12 in various states
was mapped with the area covered under agricultural crops like Paddy, Wheat, Sugarcane, Groundnut and Cotton.
The map highlights Uttar Pradesh, Maharashtra, Andhra Pradesh, Punjab, Madhya Pradesh and West Bengal as
states which have substantial coverage under labour intensive crops and have also faced a considerable decline in
labour availability. These states have a high propensity to face labour challenges going ahead and requires immediate
attention.
Coverage of labour Intensive Crops Vs Shift of labour from Agriculture
Various news reports and anecdotal evidences highlight the impact of labour shortage on some of these major
crops across various states. For example, Andhra Pradesh which saw ~5% of its agricultural workforce in rural areas
migrate to other sectors between 2004-05 and 2011-12 has reportedly witnessed significant labour shortage in rice
cultivation. The state has over ~4.5 Mn Ha under rice and over ~1.5 Mn Ha under cotton and groundnut cultivation.
Owing to the shortage in agriculture labour, farmers have adopted intensive rice farming and mechanization. The
following news reports highlight the same.
Average labour Requirement in Various Stages of the Crop Cycle
Source: Labour Scarcity – Its Immensity and Impact on Agriculture By C. Prabakar, K. Sita Devia and S. Selvamb

17
Labour Shortage Affecting Rice Production in West Godavari, Andhra Pradesh
The West Godavari district has 0.25 Mn Ha under paddy which is the principal crop grown in the district along
with some other cash crops and horticultural crops like oil palm, mango, sugarcane, tobacco and chili. The
district had been facing the problem of labour shortage and the administration responded to this crisis by
promoting mechanization to reduce the labour requirement.
The district administration took assistance from the National Bank for Agriculture and Rural Development
(NABARD) to distribute power tillers, combined harvesters, transplanters and other implements to farmers with
subsidy under a special scheme aimed at promoting mechanization in the district. The use of these machines
are expected to reduce labour requirement significantly and provide much-needed support to farmers troubled
by shortage of farmhands.
The Andhra Pradesh government in its 2013-14 budget allocated INR 2,500 Crores towards farm
mechanization in the state.
Similar experiences have impacted other labour intensive crops also. In Gujarat, for example, due to lack of labour to
harvest sugarcane, a number of farms had to destroy their produce in 2011.
Labour Shortage Affecting Sugarcane Harvest in Gujarat
Close to 0.14 Mn tonnes of standing crops of sugarcane in Surat district of Gujarat were destroyed by farmers
for lack of field hands to harvest it. Sugarcane harvesting, which requires special skills, is traditionally carried
out by farm-hands who migrate from neighboring Maharashtra’s Dhulia and Jalgaon regions each year to
south and central Gujarat. Owing to the shortage of this migrant labour, many farmers either used tractors or
set afire the crop to clear the fields for fresh sowing and to avoid rotting of standing crops. Both farmers and
factories had to bear huge losses as a consequence.
Source: The Hindu – December 2011
Source: Indian Express – June 2011
Agricultural W
orkforce: An O
verview

18

19
Explaining the Shift Away from Agriculture
Chapter 2
20
The Pull and Push factors affecting Employment in Indian AgricultureAs an economy matures, there is a natural movement of excess workers from low productivity agriculture to higher
productivity manufacturing and services, where both productivity and therefore wages are relatively higher. This rural
urban shift and away from agriculture steadily gathers pace as the economy develops. Elabourating this phenomenon
in greater details is crucial, as it is also supplemented by a wide variety of factors.
There are two critical factors that affect the movement of labour away from the agriculture sector. The first is the “Pull”
factor. With accelerated economic growth, job opportunities in non-agricultural sector are created much faster and
this leads to a pull on labour away from agriculture to higher productive and higher paying manufacturing or services
sector.
However India’s economic growth has lost its momentum signifying a low pull factor on labour away from agriculture.
Moreover in the non-agricultural sector, demand for labour has largely been informal in nature and mainly from small
scale enterprises. The proportion of informal labour and the small scale of employment (firm size) has also meant that
productivity is relatively lower in India’s non-agricultural sectors. In other words the pull factor has not been strong. It
can be much stronger if India embarks on a period of sustained high growth and reform its labour laws.
Again, the shift from rural agriculture to urban manufacturing and services in India, has been happening at a slow
pace. The urbanization rate in India is around 30% compared to 50% in China. While the trend of rural to urban
migration is visible in India, the pace of migration has been quite slow, signifying slow and low pull factors at work.
On the other hand, the supply of labour from agriculture to other sectors is also affected by wages in the rural areas.
Social welfare programs such as MGNREGA (the National Rural Employment Guarantee Act), has in effect been
boosting rural incomes and incentives, thereby reducing the ‘Push” factor of movement away from agriculture. As rural
wages rise, the urban labour market gets distorted and the ‘Push’ factor gets weakened.
The effect of these factors has not been identical on both genders. There has been less diversification in the
occupations of rural women and their movement away from agriculture when compared to their male counter parts.
Supported by a number of Government schemes, including MGNREGA, Rural wages have been growing by 17% on
average since 2006-07 and have outstripped urban wages (Goldman Sachs, 2014). The study found that the share
of households enrolled in MGNREGA was indeed a significant explanatory factor for rural wage growth . The study
also found evidence to support the hypothesis that inflation has been higher in states where MGNREGA has been
implemented to a greater degree. It concluded that not only were agricultural workers not moving to urban areas, the
increase in wages, without an increase in productivity, was fuelling inflation.
In a nutshell, availability of labour in agriculture crucially depends upon job creation in the non-farm sector, the pace
of urbanization, social schemes and incentives in the rural sector and wages in the agriculture sector, besides certain
social factors like children’s education and status.

21
According to a survey conducted in 2011 to assess the key reasons behind labour scarcity, ‘higher wages in other
locally available jobs’ was ranked ‘first’ among various reasons identified. The survey reported that this was because
higher wage rates prevailing in non-agricultural works like masonry, carpentry, electrical and plumbing, which were
locally available, attracted agricultural labourers. As the skill set required in agriculture is negligible, labour tend to
adapt other skill sets if they get higher wages.
Agricultural jobs being seasonal, labourers remain unemployed during lean season. This makes them seek a regular
/ permanent job that could provide them income throughout the year. This reason was ranked ‘second’. Working as an
agricultural labourer was considered as a low-esteem job in the rural areas and this reason was ranked ‘third’. Out-
migration due to improvement in educational status, migration to nearby town / city for higher wages and migration
to foreign countries were ranked the fourth, fifth and sixth respectively. A report in the “Economist” outlined how
agriculture labourers were increasingly seeking jobs as “Security Guards” in cities and towns, which besides giving
them a higher wage also reduced their drudgery.
Reasons for labour Scarcity in Agriculture (In Order of Importance)
Source: Labour Scarcity – Its Immensity and Impact on Agriculture By C. Prabakar, K. Sita Devia and S. Selvamb
In the following sections, we have attempted to analyze the causes of labour scarcity and assess the plausibility and
importance of some of the reasons listed above.
Explaining the S
hift Aw
ay from A
griculture
1 Higher wages in other jobs available locally
2 Shifting to a regular / permanent job since agricultural job is seasonal
3 Agriculture labour is presumed to be a low esteemed job
4 Migration to nearby city for higher wages
5 Migration due to improvement in educational status
6 Migration to foreign countries

22
As returns from agriculture reduces owing to increasing input costs and the benefits of price rise often not trickling
down to farmers, returns from agriculture are getting impacted. This is affecting the ability of the farmer to pay
competitive wages to workers. On the other hand, opportunities are being created in alternate industries which are
growing at a faster rate. These sectors also offer year round employment and are attracting agri-workers.
These factors are leading to a shortage of labour in farms leading to a huge demand supply gap. As a result,
agricultural wages are increasing every year at a rather high rate and in turn increasing the overall cost of farming
with no significant increase in returns.
While labour shortages faced in various parts of the country are an outcome of multiple other factors, the causes
listed above seem to have a marked influence on this phenomenon and have been analyzed in greater detail in the
following sections.
Solving the Conundrum of Labour ShortageIndian agriculture needs to look forward to a boost in productivity as the cheap, surplus labour it has relied on
traditionally moves out of the sector. If adequate measures are not taken to replace the labour requirement,
productivity of farms may get affected and this may have repercussions on output prices.
3
2
4
Inflation Higher Prices
Pressure on food security, import
dependence
Lesser Remuneration in agriculture
compared to other professions
Alternate professions offering ample opportunities
Increased cost of cultivation
Fewer people in agriculture, reduced
farming, can even lead to a fall in production
and productivity
Shift towards non farm occupations in
rural areas
Increase in agricultural wages
1

23
Evidencing Lower Remuneration in AgricultureVarious reasons have led to lower remuneration from agriculture. The average land holding size has decreased to
1.16 Ha per farmer in 2011 from 2.3 Ha in 1971. Increasing cost of inputs like fertilizers and labour have increased
the cost of cultivation and thus reduced returns from each farm. For small and marginal farmers who have limited
bargaining power, the price obtained for their produce is often not commensurate with market rates affecting
realizations further. A comparison of remunerations for farmers across crops shows that a farmer only earns ~INR
2,400 per month for each hectare of paddy and ~INR 2,600 per month for a hectare of wheat. Farm labourers on the
other hand earn less than ~INR 5,000 per month. A KPMG study done in 2012 in Andhra Pradesh covering 3 districts
stated that a small farmer earned INR 1,100-3,000 per month, large farmers between INR 3,000 – 6,000 per month
while landless labourers earned between INR 1,300 – 3,000 per month.
Farm Realization By Crop Average Remuneration By Profession (INR per day)
For women, the agricultural daily
wages are between 15% to 30% lower
than those of men depending on the
agricultural activity.
An average industrial worker on the
other hand earns close to INR 7,000 per
month while a construction worker earns
over INR 8,000 per month. Additionally,
jobs in the non farm sector are available
round the year unlike agriculture jobs
which are seasonal in nature.
Source: Department of Agricultural Co operation, Indiastat, KPMG AnalysisNote: Realization pertains to 2010-11
Source: Indiastat, KPMG Analysis
Crop Realization Per Ha Per Month
Paddy 2,402
Wheat 2,263
Sugarcane 15,464
Cotton 7,260
Groundnut 2,332
Soyabean 1,675
Explaining the S
hift Aw
ay from A
griculture
INR
per
day

24
Comparison of wages in farm and non farm employment reveals that many simple jobs in non-farm sectors offer
higher wages. Daily wage of a mason in construction is more than double the average wage for weeding and close to
double that of ploughing. Wages for non farm professions like carpentry, drivers, blacksmith etc are at least 15-20%
higher than agricultural wages. Industrial wages when compared to agricultural professions are more than 1.5 times
which clearly explains the preference for these sectors.
It can be seen that across states non agricultural wages for various professions are consistently higher than
agricultural wages including states like Kerala, Punjab and Tamil Nadu which have high agricultural wage rates.
Although agricultural wages have grown at a higher rate in most states compared to non farm occupations like
masonry & carpentry, in absolute terms it still offers lower compensation.
2005-06 2011-12 CAGRCarpentry Masonry Agriculture2 Carpentry Masonry Agriculture Carpentry Masonry Agriculture
Kerala 215 214 218 489 477 381 15% 14% 10%
Punjab 174 173 95 375 376 286 14% 14% 20%
Tamil Nadu 130 138 77 374 398 275 19% 19% 24%
Himachal Pradesh 194 196 83 341 340 273 10% 10% 22%
Andhra Pradesh 86 109 62 226 278 265 17% 17% 27%
Haryana 152 186 116 322 351 256 13% 11% 14%
Rajasthan 142 156 67 324 369 213 15% 15% 21%
West Bengal 99 102 79 200 219 213 13% 14% 18%
Karnataka 98 109 68 227 234 203 15% 14% 20%
Maharashtra 108 122 51 230 273 195 13% 14% 25%
Uttar Pradesh 126 139 79 266 306 163 13% 14% 13%
Gujarat 137 149 98 230 293 156 9% 12% 8%
Assam 117 126 66 221 242 152 11% 11% 15%
Bihar 104 118 63 235 262 146 15% 14% 15%
Orissa 117 119 50 238 254 134 13% 13% 18%
Madhya Pradesh 88 104 55 162 209 125 11% 12% 15%
Comparison of Wages - Industries, Agriculture and Other Non Farm Occupations
Source: Bureau of labour and Employment, Indiastat, KPMG AnalysisNote: Wages for ploughing used as representative, wages for male agricultural workers considered as indicative
Industrial Wages Other Non Farm Occupation Agricultural Occupation

25
Shift towards Non Farm Sectors in Rural AreasThe shift towards the secondary sectors like construction and manufacturing in rural areas is evident between 2005-
06 and 2011-12. While the share of primary sector in rural employment reduced from 71% to 64%, the secondary
sector gained more from this shift and its share went up from 15% to 20%, while a small increase was witnessed in
the tertiary sector as well. At an all India level, construction constitutes ~42% of secondary sector employment in rural
areas and movement away from agriculture has been a result of growing opportunities in this space.
A similar phenomenon is observed at a state level where majority of the movement has happened from agriculture to
secondary sectors with some movement to the tertiary sector (except West Bengal, Punjab, Haryana and Jharkhand
where share of both primary and tertiary sector has reduced with a large increase in secondary sector employment).
In Punjab for example, the share of primary sector in employment reduced by 8%, tertiary sector reduced by 3% while
secondary sector gained 11%.
Employment Pattern Shift between 2007-06 to 2011-12 in Rural Areas
Explaining the S
hift Aw
ay from A
griculture
Source: NSSO, KPMG Analysis
v Primary: Agriculture, fisheries, forestry
v Secondary: Mining, Manufacturing,
Construction, Electricity- gas
-steam and air conditioning supply,
Water supply – sewerage - waste
management and remediation activities
v Tertiary: Wholesale and retail
trade, Repair of motor vehicles and
motorcycles, Transportation and
storage, Financial and insurance
activities etc
Source: NSSO, KPMG Analysis
26
The preceding pages in this chapter successfully establishes the “Pull” factors from the
non-farm sectors which has led to migration of labour from agriculture to non-agricultural
sectors.
Lower remuneration in the agriculture sector has been the primary reason why this
migration has taken place. This was established by comparing wages in other non-farm
occupations and across the various states.
This fact was seen to be prevalent both in the urban sector and even in the rural sector
which led to the migration. However, it is also important to see the movement of wages
in the agricultural sector per se over a period of time.
Gulati (2013) estimates that, while the nominal farm wages grew at an average annual
rate of 8.9 % during the 2000s (2001-02 to 2011-12), they grew at only 1.8 % per annum
from 2001-02 to 2006-07 and at a high 17.5 % per annum during 2007-08 to 2011-12.
A similar pattern emerges for real farm wages - real wages, which noticeably, fell by (-)
1.8 % per annum from 2001-02 to 2006-07 and then grew at 6.8 % per annum during
2007-08 to 2011-12. Over an extended period of 1990-91 to 2011-12, real farm wages
have grown at an average annual rate of growth of 2.9 %, which is quite low. In fact, if
the wages had followed the trend of the growth of 1990s, the real farm wage rate would
have exceeded the wage level in 2011-12.
Put together, the period 2001-02 to 2006-07 was a specially difficult period for farm
workers as farm wages actually declined during the period. Cumulatively this also
perhaps explains why the additional labour force was still getting absorbed in the 1990s
and early 2000s, but beyond 2004-05 there has been a net reduction in agriculture
labour force.
As for the various states with respect to real farm wages, disaggregated data at the
state level show that major states like Kerala, Rajasthan, Karnataka, Tamil Nadu,
Maharashtra, Assam and Madhya Pradesh have observed a wage growth higher during
the 1990s than the 2000s. On the other hand Gujarat and Haryana stand out with low
growth of real farm wages throughout the entire period (Gulati, 2013). Overall, within the
2000s, most of the states experienced negative growth of real farm wages during 2001-
02 to 2006-07.
An explanation of the higher wages in agriculture seen after 2006-07 is due to the
“Pull” factors of GDP growth that has helped pull the real farm wages. This is broadly in
line with what has happened in several other developing economies like Thailand and
China (Yusuf & Saich, 2008). This was coupled with the “Push” factor of Government
intervention in the rural labour market through MGNREGA since 2006, which has
empowered the rural labour to negotiate higher wages for their farm work.
We next analyze the “Push” factors like MGNREGA.

27
Impact of MGNREGA
The Mahatma Gandhi national rural employment guarantee act (MGNREGA) is the largest right-based social
protection initiative in the world. It was implemented in a phased manner starting with the 200 most backward districts
in Phase 1 in February 2006. The importance of NREGA lies in the fact that it creates a right based framework for
wage employment programs and makes the Government legally accountable for providing employment to those
who ask for it. In this way, the legislation goes beyond providing a social safety net towards guaranteeing the right to
employment.
Daily Wages Under MGNREGA in Key States - INR2007-08 2009-10 2011-12 2012-13 Agriculture 2012-13 CAGR
Andhra Pradesh 71 100 121 137 265 10%
Bihar 81 100 120 122 146 8%
Gujarat 100 100 124 134 156 10%
Haryana 135 141 179 191 256 11%
Karnataka 74 100 125 155 203 15%
Madhya Pradesh 88 100 122 132 125 10%
Maharastra 69 69 127 145 195 24%
Punjab 98 100 153 166 286 16%
Rajasthan 100 100 119 133 213 10%
Tamil Nadu 80 100 119 132 275 10%
Uttar Pradesh 100 100 120 125 163 9%
West Bengal 75 100 130 136 213 11%
Source: Indiastat, KPMG AnalysisNote: Ploughing wages used as proxy for agriculture
It aims at providing at least 100 days of guaranteed employment in a financial year to every household whose adult
members volunteer to do unskilled manual work with 6 Km of residence. Most of the activities are reported to be less
tedious and over lesser time compared to agricultural field work. As a result, this scheme is often reported to have a
significant role to play in the labour shortage and agricultural wage rise.
Number of Households Provided Employment under MGNREGA- Mn2007-08 2009-10 2011-12 2012-12 Average (2008-13)
Andhra Pradesh 4.8 6.2 4.9 5.3 5.0Uttar Pradesh 4.1 5.5 7.3 4.4 4.9Rajasthan 2.2 6.5 4.5 4.0 4.4West Bengal 3.8 3.5 5.4 4.7 4.1Madhya Pradesh 4.3 4.7 3.7 2.5 4.0Tamil Nadu 1.2 4.4 6.3 6.5 3.9Bihar 3.9 4.1 1.7 1.5 3.1Karnataka 0.5 3.5 1.7 0.8 1.5Kerala 0.2 1.0 1.4 1.6 0.9Gujarat 0.3 1.6 0.8 0.6 0.8Maharashtra 0.5 0.5 1.4 1.3 0.8Punjab 0.0 0.3 0.2 0.2 0.2Haryana 0.1 0.2 0.3 0.2 0.2Total 33.9 52.5 49.9 41.6 42.7
Source: MGNREGA Website, KPMG Analysis
Explaining the S
hift Aw
ay from A
griculture

28
MGNREGA wage rates in most states, however, is lower than prevailing agricultural wage rates, except states like
Bihar and Madhya Pradesh where it is comparable to agricultural wages. However, MGNREGA coverage data shows
that states like Uttar Pradesh, Madhya Pradesh, Rajasthan, Tamil Nadu etc which have lost maximum labour from
agriculture reported the highest employment under MGNREGA indicating a linkage between MGNREGA and the
issue of labour shortage.
A KPMG study conducted in Andhra Pradesh brought to light the impact of the MGNREGA scheme on the availability
of farm labour and rising agricultural wages. It was noted that in a number cases Panchayats took the initiative to
maintain calendars for MGNREGA work and agricultural requirement in order to avoid overlaps which suggests that
MGNREGA is likely to have a role in the agricultural labour shortage experienced across states.
Case Study
A recent study done by KPMG to study the Impact of MGNREGA wage employment program on the
agricultural farmers in Andhra Pradesh highlights the following key observations
v The agriculture productivity over all has done well in the state however the farmers feel that the rising
inputs costs (including a higher demand of wages by the labourers) is due to the implementation of
MGNREGA jobs which has helped labourers bargain for better prices from them
v The input costs in the three surveyed Districts (Mahabubnagar, Kurnool and East Godavari) have
shown a significant increase in the investment cost per acre of cultivation. Among the districts covered
in the study, East Godavari has the highest cost in input for labour which has led to farmers opt for
crop holidays and stop production. Seasonal calendars are being drawn out in the district to ensure
accessibility of labour for farm lands by stopping MGNREGA works during peak farming seasons
v The scheme has created a platform for wage labourers in the state to be in a better bargaining position
for wage rates. MGNREGA is providing alternative employment opportunities for wage labourers,
which is enabling them to demand higher wage rates from farmers and in places, shorter working
hours.
v In a number of villages, Panchayats played an active role in deciding the scheduling shelf of MGNREGA
works so that it does not overlap with the cropping season and there was labour available for work on the
fields
As mentioned previously, “Push” factors like MGNREGA also played an important role in determining availability
of agricultural labour. One it has been instrumental in pushing up the wage rate in agriculture; and two it has also
played a role in labour availability in the rural areas. Nominal farm wages had increased by 17.5 % per annum during
2007-08 to 2011-12; while real farm wages grew at 6.8 % per annum during 2007-08 to 2011-12. This has affected
the affordability factor in the agricultural sector, besides impacting availability at all times. Reduction of labour force in
agriculture has been a country wide phenomenon in the last few years, affecting almost all regions to varying degrees.
Unavailability of labour during peak seasons for operations like sowing, harvesting etc is a common complaints
among farmers.

29
Steep Rise in Agricultural Wages since 2006-07 and its EffectAs a result of “Push” factors like MGNREGA coupled with a net decline in labour available for agriculture, there has
been a steep rise in wages of various agricultural professions since 2006-07. Owing to the shortage, farmers end up
paying higher wages in order to attract labour to their farm. Availability of other non farm options and employment
guarantee from the government has arrested migration of casual labourers for employment. Moreover, various studies
report that casual labour on farms is more tedious compared to alternate options available and is considered a last
resort by the rural workforce.
It can be further observed that input costs like labour and fertilizers have increased at a higher pace in the recent
years (2009-10 to 2012-13). labour costs alone increased by ~18% while cost of fertilizers increased by ~11%
resulting in increase in overall cost of cultivation.
Explaining the S
hift Aw
ay from A
griculture
Source: Bureau of labour and Employment, Indiastat, KPMG Analysis
Source: Office of Economic Advisor, Indiastat

30
The illustration on the left shows
that agricultural wages across
states have been growing at varying
rates. Kerala, Tamil Nadu, Andhra
Pradesh, Punjab and Haryana have
the highest wages in agriculture and
have been growing at robust pace. It
is interesting to note that in Kerala,
Tamil Nadu and Haryana more than
15% of the workforce moved out of
agriculture between 2004-05 and
2011-12 and this may have resulted
in the sharp increase in wages. On
the other extreme, Madhya Pradesh,
Chhattisgarh, Orissa and Bihar have
very low wages growing at an annual
rate of just over 10%.
Source: Bureau of labour and Employment, Indiastat, KPMG Analysis
As a consequence of wage rate escalation, cost of cultivation has risen significantly in the last few years. This trend is
witnessed across all major crops, especially the ones which are labour intensive. The above analysis of the average
cost of cultivation (as published by the Department of Agriculture and Co-operation till 2010-11) reveals that the cost
of cultivation of these crops have been growing at over 10% each year. The higher cost is passed on by the farmer,
which has partly resulted in increasing wholesale prices of principal food commodities like rice and wheat at ~10% as
opposed to overall inflation of ~7%.
Source: Department of Agriculture and CooperationNote: Average cost of cultivation is a simple average of costs available across various states growing the crop
Cost of Cultivation

31
Share of Labour Cost in Overall Cost of Cultivation
The figure above illustrates how labour costs in agriculture have risen at a faster pace compared to other inputs which
are part of the overall operational cost of cultivation and thus across crops.
While on one hand, higher wages are beneficial in reducing poverty and improve conditions of one of the lower paid
segments of the rural workforce, it can bear fruit only if the farmer is able to reduce his labour requirement and not let
higher wages affect the cost of his output.
However, in the last few years, this has not been the scenario. This rise in wages and increase in overall input costs
may have partly affected the inflation of food prices. Between 2005-06 to 2011-12, food prices have increased at close
to 10% CAGR while overall inflation was in the range of 7% CAGR.
This leads us to believe that beyond a point, the farmers will either pass the increasing costs of cultivation to
consumers leading to a price inflation or they may relinquish the profession as earnings become even less lucrative
compared to other sectors. This will have a cascading impact on food production and consequently affect prices of
food commodities.
Source: Department of Agriculture and Co-operation, KPMG Analysis
Source: Bureau of labour and Employment, Indiastat, KPMG Analysis
Wholesale Price Indices and Food Inflation
Explaining the S
hift Aw
ay from A
griculture

32
Estimation of Labour Force Reduction in Agriculture by 2019-20
In the period 2004-05 to 2011-12, robust growth in the secondary and tertiary sectors led to significant job creation
in these sectors. As a result, a large share of the agricultural labour force moved to these professions which offered
better remuneration. Although 10 million people got added to the workforce, there was a net outflow of 30.5 million
people from agriculture. Employment in secondary and tertiary sector grew by 4.5% and 3.3% a year in the same
period (CAGR) supported by a GDP growth of 8% and 9.8% in these two sectors respectively in the same time
period.
The GDP growth rate in the subsequent two years since 2011-12 has slowed down and is expected to grow only at
around 5.3% in the long term till 2019-20. Job creation in the primary and secondary sector is likely to slow down as
a result of lower growth expectations in the sectors. As a result, the exodus from agricultural workforce is expected
to slow down in the coming years till 2019-20 compared to the earlier six year period in consideration. Nevertheless,
the size of the workforce in this sector is expected to shrink by another 23 million in the next eight years till 2019-20
and form only 41% of the total workforce and this trend calls for immediate steps to improve labour productivity in the
sector.
Employment in Agriculture (Million)
Source: Planning Commission, Economic Intelligence Unit, KPMG Analysis

33
Strategic Options to Address Labour Shortage
Chapter 3

34
Improving Agricultural Productivity On a PPP basis, overall labour productivity in India is quite low compared to most South East Asian countries.
Nevertheless, in India labour is 4 times more productive in industry and 6 times more productive in services
compared to agriculture.
If we compare productivity per person in agriculture to productivity per person in all other sectors combined, them as
the table below illustrates, the latter was 6.2 times more productive in 2005-06, which declined to 5.8 times in 2011-
12. India lags behind other BRIC nations where for the period of 2011-12 Brazil had a gap factor of 3.35, Russia had
2.67 and China 4.85. This implies that agriculture in India is unattractive compared to other BRIC nations.
Unit 2005-06 2011-12 CAGR
Share of Employment of Agriculture % 58% 49%
Employment in Agriculture Mn 263 228 -2.3%
Employment in All Other Sectors Mn 190 239 3.8%
Agri GDP (constant prices) INR Mn 5,944,870 7,394,950 3.7%
Total GDP (constant prices) INR Mn 32,530,730 52,435,820 8.3%
GDP per capita in Agriculture INR 22,614 32,373 6.2%
GDP per capita in All Other Sectors Com-bined
INR 139,660 188,688 5.1%
Agricultural Productivity Gap Factor 6.2 5.8
Source: Planning Commission, Economic Intelligence Unit, KPMG Analysis
While this analysis justifies better returns in non agriculture occupations and explains the trend of labour shifting away
from agriculture, the problem needs to be addressed by taking adequate measures to reduce labour requirement
and increase productivity in the sector. Most nations have responded with widespread use of technology on farms to
replace many traditional farming occupations, a trend India will soon have to follow.
Moreover, the requirement of labour for agriculture is not fixed and changes throughout the year based on the season
and crop activity. It is also dependent on the crop being cultivated, for example, rice requires more labour during
sowing that other crops. labour scarcity at any point of the crop lifecycle leads to reduction in crop yield, reduction in
cropping intensity and changes in traditional cropping pattern.
Again, India is a vast country with 16 agro-climatic zones. Technological interventions for Black cotton soil will be
vastly different from alluvial soil. Therefore technological and other solutions need to crop specific and also geography
specific.

35
Crop Productivity Productivity difference
labour-scarcity-unaffected farms
labour-scarcity-affected farms
(kg/ha) (kg/ha) (kg/ha) (%)
Paddy 5,090 4,487 603 11.8%
Sugarcane 153,292 144,165 9,127 6.0%
Groundnut 3,767 3,592 175 4.6%
Pulses 850 780 70 8.2%
Cotton 1,410 1,205 205 14.5%
Empirical studies have evaluated the effect of shortage of labour on various crops. A comparison of labour sufficient
and labour insufficient farms shows a marked difference in yield due to labour shortage (the table below illustrates
the same). Among the crops considered for the study, paddy and cotton are the worst affected. The impact of labour
scarcity is felt lesser in pulses as compared to the other crops since their cultivation requires relatively less labour.
Moreover, the labour intensive operations such as weeding and harvesting of pulse crops fall in the months of March
and April which are virtually considered off-season months in agriculture.
Productivity levels of labour scarcity affected and unaffected farms:
Source: labour Scarcity – Its Immensity and impact on Agriculture by C. Prabhakar, K. Sita Devi and S. Selvam
The problem of labour scarcity in agriculture has repercussions across states and needs to be addressed in order
to contain its impact on the overall sector and the nation. A two pronged approach with respect to input factors and
output factors has to be considered:
Input factors:v Immediate Effect: Adopt techniques that can replace and/or reduce the requirement of human labour
v Long Term Effect: Increase returns from agriculture and arrest the migration of workforce from agriculture to
other sectors
Output factorsv Agri-linkages factor
Strategic O
ptions to Address Labour S
hortage

36
Input factors:
Labour Substitution in Indian AgricultureVarious technologies can be practiced which either replace labour or reduce the requirement of labour and the
variability in labour requirement throughout the year. Some of these technologies are already being implemented in
various parts of the country yielding beneficial results, while considerable amount of support is required to develop
other technologies which can effectively address the issue.
The empirical study on labour Scarcity – Its Immensity and impact, clearly highlights the fact that adoption of labour
saving techniques in fields can not only address the issue of labour shortage but also boosts yields.
Productivity levels of farms which have adopted technology vs. farms which haven’t:
Note: Crop labour-saving technology / implement considered were: Paddy - Transplanter, Harvester, Cono weeder Sugarcane – Planter, Mini tractor, Harvester Cotton - Drip irrigation, Harvester, ULD Pesticides, Groundnut - Seed cum fertilizer drill, Micro irrigation,
Source: labour Scarcity – Its Immensity and impact on Agriculture by C. Prabhakar, K. Sita Devi and S. Selvam
Crop Technology Technology difference
adopted non adopted
(kg/ha) (kg/ha) (kg/ha) (%)
Paddy 5,142 4,492 650 12.6%
Sugarcane 153,675 144,680 8,995 5.9%
Groundnut 3,777 3,205 572 15.1%
Cotton 1,437 1,172 265 18.4%
There are three key initiatives which can be adopted to help farms reduce their labour
requirement in the near term, as illustrated below:
Mechanization of farms
1Promoting technology for
Seeds which reduce labour requirement
2
Increasing use of herbicides
3
Initiatives to improve agricultural efficiency
Mechanization of activities like sowing and harvesting can significantly reduce labour intensity
For example seeds supporting direct sowing in rice which can save the labour required for transplanting
Use of herbicides can cut down on the labour required for weeding fields substantially

37
Farm MechanizationThe growth in farm mechanization follows a certain pattern worldwide. Farm operations requiring high power inputs
and low control are mechanized first while operations requiring high degree of control and low power inputs are
mechanized last. This is because any power intensive work, can be done faster mechanically and at a lower cost
whereas converting human knowledge into machine knowledge is difficult and costly. It can be noted from the
illustration below that most developed nations with low share of employment in agriculture and high mechanization
have much higher GDP from agriculture compared to developing nations like India where employment is agriculture
has a higher share while mechanization is much lower.
Population engaged in Agriculture, Share of Agriculture in GDP vis-à-vis level of farm mechanization
Note: For India, the year considered in 2009-10
Source: World Bank Indicators, CIA Fact book, Mechanization and Farm Technology Division of Department of Agriculture and Cooperation, Trading Economics, FAO Yearbook 2013
Strategic O
ptions to Address Labour S
hortage

38
Mechanization in IndiaCurrent level of farm mechanization in India is not only lower compared to other developed countries but is also the
lowest among the BRIC nations. Higher cost of mechanization compared to manual labour, lack of skill required
to operate farm machinery and smaller landholdings have so far prevented India from enjoying the benefits of
mechanization. However, a closer look at regions reveals varying degrees of penetration of machines in farms and
clearly highlights the fact that regions with high agricultural output have already implemented various mechanical
farming techniques to address the labour shortage.
Levels of farm mechanization in India:
v Punjab, Haryana and western Uttaranchal are the major states where farm mechanization is concentrated which
increases their productivity.
vFarm mechanization in south India has increased considerably over the decade but still has a long way to go
before adapting to a higher level.
vUttar Pradesh and Bihar are the future potential states which have started using farm implements with support
extended by the Government.
vWest Bengal, Orissa and the North eastern states are in the process of adopting farm mechanization.

39
While tractors, tractor driven devices and tillers are the most common form mechanization in India, a variety of tools
and machines are available which can reduce the labour requirement across the lifecycle of a crop.
Land development, tillage, seed bed
preparation
Weeding, inter cultivation, plant
protection
Post harvest and agro processing
Harvesting and threshing
Sowing and planting
vTractors
vLevelers
vPloughs
vDozers
vScrapers
vDrill
vSeeder
vPlanter
vDibbler
vTransplanter
vHarrow
vTiller
vSprayer
vDuster
vHarvester
vThresher
vDigger
vReaper
vSheller
vSeed extractor
vDehusker
vHuller/Dehuller
vCleaner
vGrader
However, various studies have revealed that mechanization in other processes like seeding and planting, plant
protection, harvesting and threshing can have significant impact on labour requirement.
Extent of mechanization by farm operations:
Operation Extent of Mechanization in India
Soil working and seed bed preparation 40%
Seeding and planting 29%
Plant protection 34%
Irrigation 37%
Harvesting and threshing 60-70% for wheat and rice and <5% for others
Source: Farm Mechanization in India, Dept. of Agriculture and Cooperation – Ministry of Agriculture 2013
A closer look at two simple machines used for seeding and harvesting respectively brings to light the applicability of
such devises across crops as well as the benefits accrued to the farmer in terms of reduced labour requirement.
Motorized single-axle mowers and reapers for harvesting cerealsSingle-axle mowers and reapers generally range in power from around 1.5 - 10 kW. Crops suitable for harvesting by
these machines include rice, wheat and barley. Hay or grass mowers are available with cutter bars or rotary cutters.
Reapers also have cutter bars and are generally designed for row crops and usually have mechanisms for stacking
the crop. The work rates of mowers and reapers are substantially higher than hand reaping. For example a 2.2 kW
reaper harvests rice at the rate of 2.4 hectare per day.
Strategic O
ptions to Address Labour S
hortage

40
Combine Harvesters
The combine harvester is a machine that harvests grain crops such as wheat, oats, rye, barley, maize soybean and
flax. The name derives from its combining three separate operations comprising harvesting - reaping, threshing, and
winnowing - into a single process.
During the 1980s the use of combine harvesters increased manifold in Punjab. In the table below the effect of this
increase on man-hours has been tabulated. The impact of the combine harvesters is visible in the over all reduction in
manual labour by 22.9% in spite of increasing yield.
Effect of combine harvesters on human labour in Punjab:
During the period 1985-86 to 20006-07, baring transplantation of paddy, almost all other operations for wheat and
paddy have been completely mechanized in Punjab. The increase in the use of combine harvester in wheat and
paddy during the same period was about 1,189% and 355%, respectively.
Support Required to Enable Mechanization of FarmsFragmented land holdings and high cost of machinery have traditionally been the impediments to the growth of
mechanization in India. Besides, typical crop architectures in India prevent the efficient use of machinery designed
for other countries. In order to support adoption of mechanical farming in India, innovative techniques have to be
implemented to address each of these issues.
1985-86 2006-07 Absolute change Change %
Human labour (man-hours)
Family 511 319 -192 -37.57
Permanent 193 153 -40 -20.73
Casual 385 368 -17 -4.42
Total labour 1,089 840 -249 -22.87
Source: Dynamics of labour Demand and its Determinants in Punjab Agriculture, Punjab Agricultural University 2013
41
Increase Efficiency of MechanizationEfficiency of mechanization and reduction in wastage can be addressed by the following ways, depending on the
situation and crop
a. Improving the architecture and suitability of crops through Seed Technology
b. Improving the suitability of equipment being used through indigenization
Seed technologyThe crop architecture of Indian crops differs from that of crops grown in other countries. Imported machinery is
not always suited for Indian crop architecture and hence the efficiency of mechanization are lower than expected.
Designer crop architecture needs to be developed to increase a crop’s suitability to mechanization. An example of this
is the high yielding medium maturing Narma variety HS 6 in cotton. Being synchronous in flowering and boll opening,
less number of pickings are needed. This makes it suitable for mechanized picking. Boll opening is fluffy and clean
cotton is picked up with low trash content. Its average yield is 20 qt./ha and it has field resistance against insect-pests
and diseases.
Indigenization of EquipmentMechanization of Indian farms often fall short of the expected benefits, primarily owing to wastages resulting in the
process. This happens as the equipment imported from other countries are not aligned to the needs of Indian farms
and crop types. This raises the need to develop machines which are suitable for Indian conditions. Various farm
equipment manufacturers in India are already customizing their offerings.
Mahindra came up with a modern multi-utility tractor called the Shaan with a 23.5 HP engine. Most imported tractors
have a 25+ HP engine and are more suited for large holdings. Shaan on the other hand is a sub 25 HP engine with a
750 kg payload trolley and can be used for a range of activities. With a top speed of 40 kmph and a 23.5 HP engine,
the Shaan is especially suited to small and medium sized farms. In 2007, the Shaan was recognized by the American
Society for Agricultural & Biological Engineers Award as one of the 50 Outstanding Innovations of the Year.
Increase Affordability of Mechanization
It is extremely difficult for small farmers to afford machines to be used on their fields, especially given the
difficulty of availing credit. However, a co-operative based Custom Hiring Model can be put in place whereby a
single machine can be used by multiple farmers on a pay per use basis. The government in various states has
started such a model where government owned machines such as ploughs, cultivators, paddy transplanters,
inclined plate planters, reapers, threshers, power tillers etc. are made available to farmers at rates prescribed by
the Government for completion of different farm operations in a short duration. A group of farmers belonging to
adjacent small farms which are individually not suitable for mechanization can make use of such models to use
equipment collectively at affordable costs.
Strategic O
ptions to Address Labour S
hortage

42
Promoting Technology for Seeds which Reduce Labour RequirementWith improved varieties of seeds, labour is saved in terms of work input per kg produced due to improved germination
and higher yield. On the other hand, technology is enabling development of seeds with special features that can
directly replace or reduce the labour intensity of the cultivation process. For example, in rice the most labour intensive
activity is transplanting of seedlings from the nursery into the field. Seeds have been developed which support direct
seeding in rice and thus eliminates the labourious transplanting process.
Direct Seeded Rice (DSR)Direct seeded rice is a cost effective rice establishment method where dry seed is drilled into the non-puddled soil.
The need for a nursery and tasks such as pulling transporting and transplanting of seedlings are avoided as pre-
germinated seeds are directly sown.
Benefits of Direct Seeded Rice
v By using DSR farmers can avoids repeated puddling, soil degradation and plow-pan formation
vAs the DSR crop matures 10-15 days earlier than normal rice, this facilitates timely establishment of rice and
succeeding crops
vUse of this seed helps save water by 35-40% and increase yields by 10%
vAs sowing is the most labour intensive portion of rice cultivation, using DSR solves labour scarcity problem
and reduces drudgery of labourers

43
HerbicideWeeding in India is usually done by manual labour. The efficiency of the work is often lowered by hot, and humid
weather conditions during the rainy season. In case of rice, over 20% of the total labour requirement is for weeding.
Globally, the process of weeding is done away with by using herbicides which prevent the growth of unwanted
weeds or plants. India, however, ranks far behind other peer nations in terms of overall pesticide usage currently.
While herbicides are a large component of the global pesticide usage, in India it forms only 20% of the total market.
This trend is often noted among labour surplus nations. However, as labour availability becomes an issue, farmers
gradually adopt herbicide usage and do away with manual weeding. Such trends have been noted in other Asian
countries like South Korea, Taiwan and Philippines.
Worldwide pesticide usage in 2011:
Source: Philip Capital Report
Strategic O
ptions to Address Labour S
hortage

44
Multiple studies have shown that using weedicide is an effective way to reduce dependency on labour. It also has
a positive impact on the yield of crops as it gives the farm more resources to focus on other steps of cultivation. An
empirical study illustrates the reduction in labour requirement for rice, sugarcane and maize when herbicides were
used. In the course of this experiment, the requirement of labour for weeding reduced by ~22% and as a result the
overall labour requirement also reduced by ~8%.
Labour requirement of farms which use herbicicde vs. farms which don’t:
Activity Herbicide Herbicide difference
adopted Non adopted
(man hours) (man hours) (man hours) (%)
Preparatory cultivation 102 87 (15) -14.5%
Manuring 28 41 13 48.4%
Sowing & Planting 201 213 12 6.2%
Weeding 194 237 43 22.3%
Irrigation 158 144 (14) -8.7%
Plant Protection 17 10 (7) -41.6%
Harvesting 215 257 42 19.6%
Total labour hours 914 989 75 8.2%
Case StudyThe Directorate of Weed Research has demonstrated the effect of herbicide usage specifically for grassy
weeds and broad leaved weeds in wheat (using clodinafop (60g/ha) at 25-30 DAS followed by 2,4-D (500 g/
ha) at 30 DAS) as compared to when the weeding was done manually.
The price per quintal was
lower for wheat produced
without the use of herbicide.
This is due to the presence of
impurities like weed seeds.
Source: Directorate of Weed Research
With herbicide usuage Without herbicide usuage
Productivity per hectare 38-40q/ha 25-30 q/ha
Cost of production per hectare
INR 9,000-10,000 INR 9,000-9,500
Gross Income per hectare INR 40,000 (40q at INR 1,000 per quintal
INR 28,500 (30q at INR 950 per quintal

45
Making Agriculture More ProfitableFocusing on the productivity of the agricultural sector to lift the incomes of farmers is one of the most direct ways to
make agriculture viable.
Yield of select food grains in 2012 (Indexed to world average):
Note: (a) Asia include China
Source: Food and Agriculture Organization of the United Nations, FAOSTAT
Indian agriculture currently lags behind in productivity when compared to other South East Asian nations. India’s
yield per hectare is half the average level for China, Vietnam, Indonesia, Malaysia, and Thailand. Consequently, farm
incomes are low and climbing slowly. The farm worker productivity in India grew at 3.2 % per year between 2000 and
2010, as compared to manufacturing and services, where labour productivity over this period grew by ~5.6% per year,
respectively. The agricultural sector also suffers from under-employment of about 20 %.
In this section we discuss a range of technical levers that can help improve the yield and productivity of Indian farms.
Raising productivity benefits the entire rural ecosystem associated with agriculture, including smallholders, wage-
earning labourers, and related businesses.
Strategic O
ptions to Address Labour S
hortage

46 Research driven improvements in seeds
Increase in Yield through Seed Technology:
Note: OPV: Open Pollinated Variety, GM: Genetically Modified, SCH: Single Cross Hybrid, DCH: Double Cross Hybrid
Source: National Seed Plan, Department of Agriculture and Co operation
It is estimated that all factors remaining constant, use of quality seeds alone can increase crop yield by 15-20%.
Difference in yields across various regions of the world can thus be partially attributed to the quality of seed used.
Seed technology coupled with agronomic innovations (plant spacing, tillage etc) can have significant impact on crop
yields.

47
Intensive FarmingIntensive farming is an agricultural production system characterized by high use of inputs such as capital, labour, or
heavy use of pesticides and chemical fertilizers relative to land area to obtain higher output per unit land. It involves
innovation in agricultural machinery, farming methods and techniques for achieving economies of scale in production
and creation of new markets for consumption. Such farming techniques can increase productivity of farms drastically.
One such productivity enhancing technique is SRI (Systematic Rice Intensification) which is being practiced in various
parts of the country to improve yields.
Case Study
Systematic Rice Intensification (SRI) is a methodology aimed at increasing the yield of rice using the
following principles:
v rice field soils are kept moist rather than saturated as this improves root growth and supports the growth
and diversity of aerobic soil organisms. This reduces the water requirement by half.
v rice plants are planted singly and spaced optimally widely to permit more growth of roots and canopy and
to keep all leaves photo synthetically active; and
v rice seedlings are transplanted when young, less than 15 days old with just two leaves, quickly, shallow
and carefully, to avoid trauma to roots and to minimize transplant shock.
v When SRI is combined with other techniques like use of fertilizers and mechanization the impact on yield
is increased.
Andhra Pradesh:
SRI was introduced in Andhra Pradesh in kharif 2003 in all 22 districts of the state. The state gained many
advantages by using this system
v Number of grains increased by 38-66%, with an overall average increase of 48% when compared with
conventional flooding
v Grain yield increased between 21 – 30% with overall increase of 25%
v SRI cultivation practice was cheaper by 6-19% for farmers as compared to conventional cultivation
methods
v Gross income grew by an average of 28% and net income by 65%
Strategic O
ptions to Address Labour S
hortage

48Sequential-cropping
Sequential-cropping is the practice of growing two or more crops in the same space during a single growing season
where the succeeding crop is planted after the preceding crop has been harvested.
This allows for more efficient use of growth resources including light, nutrients, soil and water. The increasing
population puts pressure on land to increase productivity per unit area, unit time and for unit resource used.
There are various cropping systems which can be followed:
Sequential cropping
Double cropping
Treble cropping
Quadruple cropping
Ratoon cropping

49
Output Factors:
Better Farm to Agribusiness LinkagesInnovative farm to agribusiness linkages will drive disintermediation and enable hassle free procurement of produce.
These linkages help in increasing the bargaining power of small farmers and improves their income from the
marketplace hence increasing agricultural viability.
There are three different models to strengthen the link from farms to agribusinesses:-
Contract Farming
Farmer
Buyer
The buyer and farmer form an agreement with conditions on
quantity, quality, delivery schedule in lieu of pre determined
price and production support
v This is primarily a buyer driven model with large corporate companies such as Pepsi Co and
ITC. initiating it.
v In this way farmers can bypass the intermediaries and sell directly to large corporate companies.
v The farmers get pre determined price for their produce and technology support whereas the
companies get a secure supply.
Co Operative
Buyer
Agricultural Cooperatives
Produce from multiple farmers
v This is primarily a producer driven model with farmers coming together to form a co-operative
v It allows the buyers to deal with aggregators rather than individual farmers
v The co-operative performs the role of an intermediary while providing support for overhead tasks
to farmers
v In India, currently most of the farm co-operatives are state controlled with limited success in
sectors other than dairy
The co-operative acts as an interface between the small farmers
and buyers. It provides order taking, shipment and logistics,
billing, collection and remittance services for farmers.
Strategic O
ptions to Address Labour S
hortage
50
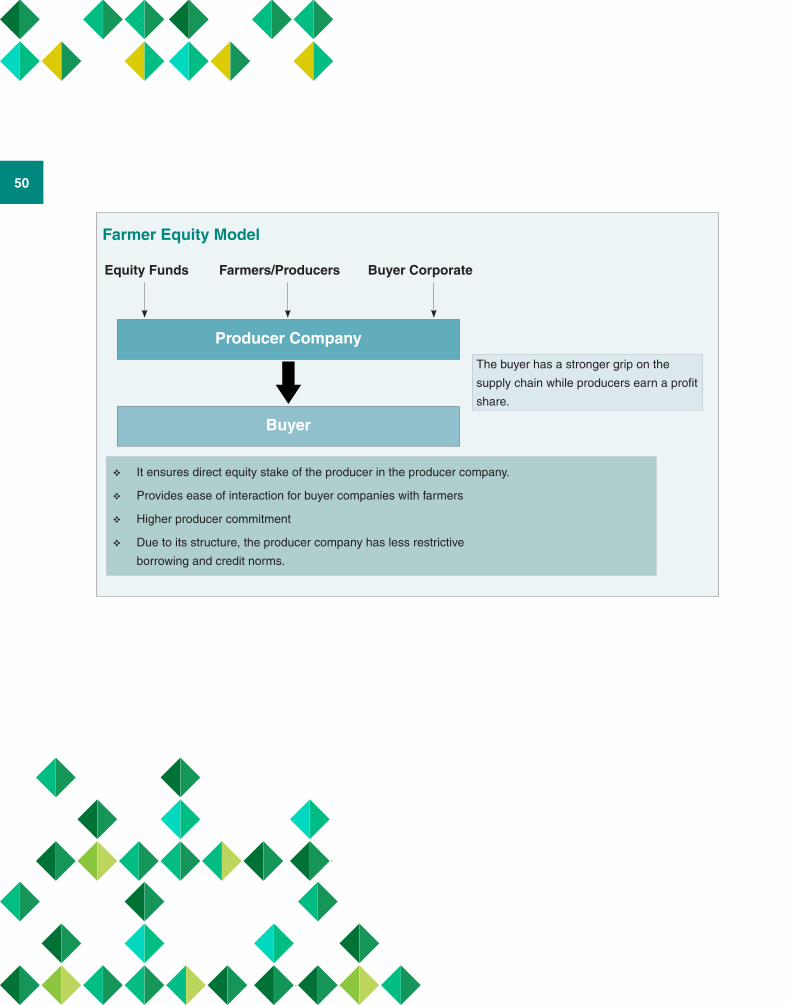
Farmer Equity Model
The buyer has a stronger grip on the
supply chain while producers earn a profit
share.
v It ensures direct equity stake of the producer in the producer company.
v Provides ease of interaction for buyer companies with farmers
v Higher producer commitment
v Due to its structure, the producer company has less restrictive
borrowing and credit norms.
Equity Funds Farmers/Producers Buyer Corporate
Producer Company
Buyer

51
Way Forward
Chapter 4

52
Although agriculture is a state subject, even policies implemented by centre have an impact on it, for example, centre
enacted MNREGA which has impacted agriculture. Going forward, the state government and central government can
undertake a number of initiatives to make agriculture from productive and attractive:-
State Government:v Free up land lease market
v Custom hiring model
v APMC Reform
Central Government:v MNREGA reforms
v Invest in Research
State Government Initiatives
Free up Land Lease MarketLandholding sizes in India have been reducing over the years from 1.33 Ha in 2001 to 1.13 Ha in 2011 owing to
fragmentation of holdings. Various tenancy regulations in India have restricted the consolidation of holdings which is
an essential step in this sector. Increase in landholding sizes can, above all,
1. Improve viability of mechanization
2. Improve farmers access to credit
3. Improve returns per farmer
The extent and nature of agricultural tenancy regulation and restriction varies from state to state. The states, however,
do fall into four general categories:
v Virtual ban on all agricultural tenancies: Kerala, Jammu and Kashmir.
v General prohibition on agricultural tenancies, but exempt certain categories of persons such as widows, minors,
marginal holders and/or members of the armed forces: Karnataka, Himachal Pradesh, Madhya Pradesh, Uttar
Pradesh, Orissa and Telangana area of Andhra Pradesh.
v No explicit prohibition on tenancy, but discourage tenancies by empowering tenants with protected rights on the
tenanted land, either as perpetual tenants or through rights to purchase within a specific period: West Bengal,
Punjab, Haryana, Gujarat, Maharashtra, Bihar, and Assam.
v Few restrictions on tenancies, although establishment of minimum lengths of tenancies and/or maximum rent
levels: Rajasthan, Tamil Nadu and non-Telangana areas of Andhra Pradesh.

53
As opportunities in the non-farm economy increase, tenancy markets can facilitate a broader choice of livelihood
opportunities such as migration, specialization, and investment. Households better suited to pursue non-farm
livelihoods will be benefited if they are able to rent out their land for others to cultivate. In order to ensure that capital
is used rationally on small farms, it would be advisable to free up the land lease market so that a market guided
optimal holding size evolves, ensuring rational utilization of land, labour and capital.
Suggested reforms include:
v Ensure that the landowner is not dispossessed of his land in the process of leasing and that the lessee has no
tenancy rights.
v Prolonging the lease period to 10-15 years and removing any ceiling on size of lease to enable corporate to
invest in technology to make the farms more productive.
v Ensure that the land automatically reverts back to the farmers/landowners at the expiry of the lease period.
v These steps would help farmers and private sector companies to aggregate agricultural land and invest in farm
technology, drip irrigation and best practices to enhance productivity and quality of agricultural produce.
Custom HiringCustom hiring models can be put in place more actively by state governments whereby farm machinery is available to
farmers on a pay per use basis. This reduces the capital requirement of farmers while giving them the opportunity to
mechanize farming. It will be especially beneficial for small and marginal farmers who have small landholdings which
make the fixed cost of buying farm machinery prohibitive.
Farm mechanization is essential for sustaining agricultural growth especially in the context of diminishing agricultural
labour. However, large communities of small and marginal farmers are still not in a position to take full benefit of farm
mechanization because of adverse “economies of scale’ especially in operations like land preparation and harvesting.
For instance, severe labour shortages in crops such as sugarcane necessitates for the use of machines such as
sugarcane harvesters and planters. However, the cost of these equipments makes them unviable even for large
farmers in India.
With continued shrinkage in average farm size, more and more farms will fall into the adverse category thereby
making Individual ownership of agricultural machinery progressively more uneconomical. In such a situation, custom
hiring is believed to be best suited model for accelerating farm mechanization in India. This model attempts to
unbundle farm mechanization from ownership by ‘farmers only’ approach to creation of services.
While custom hiring is prevalent in India for some of the agriculture machinery, it is highly unorganized and sporadic in
present situation. The reasons behind this boils down to few facts. Firstly, the custom hiring centres need a minimum
scale for efficient operation as the activity is capital intensive.
Way F
orward

54
They also have a longer gestation period due to lower asset utilization on account of the seasonal nature of
agriculture demand. Secondly, there is a significant entry barrier for small entrepreneurs to establish these centres.
Small entrepreneurs are neither credit worthy nor are there special policy incentives for promoting them. The third
major factor that would determine the success of organized custom hiring in the country would be the credit policy of
the banks. Generally, the banks insist on heavy collateral guarantees apart from hypothecation of farm equipments for
giving loans and as a result, the response from entrepreneurs is decreasing.
So far, policy interventions have been focusing on creating individual ownership of agricultural equipments, which by
far has failed to achieve desired level of farm mechanization in country. It is important to intensify custom hiring model
in the country which works on value driven approach and does not end with one time service to the customers. There
is an emergent need to explore options for creating congenial policy framework that would incentivize establishment
of custom hiring centers on a business model in country.
Case Study
The Department of Agriculture under government of Madhya Pradesh has taken various steps to promote
agriculture, one of them being custom hiring services. Machines are hired to the farmers, and other institutions for
deep ploughing, land levelling, light cultivation etc.
v There are 37 chain type tractors with heavy duty Mold Board ploughs available for hire to farmers. These
machines carry out deep ploughing.
v The Directorate owns a fleet of 76 bulldozers, which are used for leveling, bunding terracing of agricultural
lands and construction of water harvesting structures.
v A fleet of 135 wheel tractors with equipments for light cultivation and other agricultural operations is available
These machine are hired to the farmers on custom basis at the rates prescribed by the Government for
completion of different farm operations in a short duration.

55
APMC ReformState governments had introduced agricultural produce market committee (APMC) acts to created a network of
mandis (markets) where prices would be determined through auctions. The primary reason was to shield farmers
from moneylenders and traders. Traders in these mandis needed a government license to operate and generated
revenue through commissions paid by farmers and retailers. All sales and purchase could occur only at these mandis.
However, the APMC system become a breeding ground for abuse. The market power exerted by the middlemen or
arhatiyas often resulted in collusion and exploitation of farmers. Auctions were not held and the tax on transactions
was diverted elsewhere. This led to calls for reevaluation of the government’s role in the agricultural market,
culminating in the Model APMC Act in 2003. It has several provisions to increase private trade, but the state
government still has a large role to play in facilitating the provisions.
In Punjab’s Apni Mandis, for instance, farmers sell directly to buyers or consumers. Basic infrastructure like market
yard, lighting etc. are provided by the APMCs. Farm level extension services of the relevant departments are also
pooled in, securing the benefit of on-going Government scheme to “Apni Mandi” farmers. The benefits include
input subsides, better quality seeds and loans at reasonable rates of interest from the Bank. Apni Mandis are being
organized at about 26 cities and towns of the State including Chandigarh.
Such innovations do not always pan out. In Karnataka’s Raitha Santhe, farmers were to sell directly to consumers
under the management of gram panchayats or local authorities. However the project never took off due to the santhe
being too far away from the city and poor connectivity.
Case Study
Gujarat suffered a drought in 1999-2000 but was able to bounce back and registered 8.2% growth annually in
agriculture and allied sectors (includes forestry and fishery).
Since 2005, the state government has held the annual krishi mahotsav (agricultural conclave) where together
farmers, scientists, officials, and ministers come together to discuss the way ahead. This is followed by a month-
long mass contact program, in which krishi raths (agricultural department vehicles touring the state) visit every
village to share knowledge and distribute kits to select farmers to promote new technology adoption through
demonstration. Functionaries from different departments visit the villages at the same time providing farmers with
extension services.
The canal irrigation potential was created through the Sardar Sarovar Project as well as a focus on community-
based decentralized sources. Micro irrigation has been promoted through subsidies, and as a result, the area
under micro-irrigation increased from nearly 20,000 hectares in 2003–04 to 140,000 hectares in 2009–10. Efforts
were made to create the necessary agricultural infrastructure, including feeder lines to deliver electricity to farms
and roads to connect almost all villages. To revive R&D, the Gujarat Agricultural University was divided into four
smaller institutions, with focus on sharing knowledge with farmers. Gujarat has also enacted agricultural produce
market committee reforms.
Way F
orward

56
Central Government Initiatives
MGNREGA ReformsRecommendation for Gram Panchayats: At present, the Gram Panchayats have a limited role in the selection
of the works to be carried out in their villages. The introduction of seasonal calendars by the Gram Panchayats
will ensure that the landless labourers get adequate time under the MGNREGA as well as on farms. This will lead
to implementation of those activities which are relevant to increasing agriculture productivity such as weeding,
identifying irrigation facilities in appropriate catchment areas where agriculture will be impacted, rain fed and drought
prone areas. This will ensure the direct impact on agriculture projects for the benefit the community.
Recommendations on modifying current structure of MGNREGA to improve convergence with Agriculture:
The inclusion of agricultural activities under the auspices of the MGNREGA is a demand of the farming community. It
is suggested that the Government of India include of some agricultural activities (such as weeding, irrigating, sowing
and cutting for harvesting) into the MGNREGA shelf of works and provide labour for specific crop interventions.
This would ease some of the pressure on the farmers due to increasing wage rates and at the same time provide
employment to the landless labourers.
To ensure that the big farmers do not take advantage of the potential merger of agriculture activities into MGNREGA,
the following can be initiated:
v Identify the farms of small and marginalized farmers in the region and allocate labour requirement for activities
that would help ease the burden of hiring expensive labour.
v Ensure that large farmers pay a percentage of the wages paid to the labourers for work done on agriculture
activities.
Invest in ResearchIndia’s spending on agricultural research was about 0.4% of agricultural GDP in 2009. This is low when compared to
the spend by Brazil (1.8%) and sub-Saharan Africa (0.6%). This is a sign of lack of focus on research and translates
into relatively little knowledge being created. Along with this, the existing knowledge base has not been effectively
made available to farmers.
The Department of Agriculture has 751 extension workers per million farmers, fewer than the 926 available from
private farmer associations and the 1,078 employed by producer cooperatives. There are numoureous way the
government can boost agricultural research and its avilability-
1. Improve coordination among individual research institutions
2. Increase the engagement of farmers in extension services
3. Enhancing private-sector participation
57
Public extension will need to play an important role for poor farmers and in remote geographies. The Indian
government has historically used television and radio (such as the Krishi Darshan TV show) as the medium to get
information to farmers but that has to move to mobile innovations. Weather forecasts, new seed information, minimum
support price information and tips on improved farming practices can be sent to farmers through mobile phones.
Case Study
In 2014, Arcadia Biosciences, Inc. and Maharashtra Hybrid Seeds Co. Ltd. (Mahyco) announced the achievement
of development of Salt Tolerant technology for rice. Arcadia’s Salt Tolerance (ST) technology enables plants to
produce increased yields under saline water and soil conditions. Mahyco has demonstrated that rice varieties
incorporating ST technology showed substantial increases in key plant performance measures such as
plant growth and yield. This development will be beneficial in expanding the range of usable acreage for crop
production and reducing requirements for fresh water.
Way F
orward

58 ConclusionIndia’s goals of attaining food security, an 8% GDP growth rate and enhancing rural income cannot be achieved
without higher agriculture growth rate which has been 4.1% in the last five years.
Between 2004-05 and 2011-12 was the first instance of workforce reduction in agriculture declined by around 30.57
million in spite of the total size of workforce continued to increase. Higher remuneration and growth of opportunities in
alternate sectors is leading to the migration of workforce away from agriculture. This has resulted in labour shortage,
increase in wages and consequent escalation of cost of cultivation. Government schemes like MGNREGA are
affecting labour adversely and need immediate policy interventions
If adequate measures are not taken to reduce labour requirement, productivity of farms may get affected and this
may have spiraling effects on output prices. Most nations facing this issue have responded by widespread use of
technology on farms to replace many traditional farming occupations, a trend India will soon have to follow.
Key stakeholders like farmers, industry and government need to take adequate steps to tackle the problem of labour
shortage. Indian labourers are 4 times more productive in industry and 6 times more productive in services as
compared to agriculture. The factors to be considered to reduce agriculture labour requirement are:
Input factors:- Immediate Effect: Adopt techniques that can replace and/or reduce the requirement of human labour such as
mechanization, promoting use of labour reducing seed technology and use of herbicides
- Long Term Effect: Increase returns from agriculture through research driven improvements in seed
technology, intensive farming technique and sequential cropping technique
Output factors- Strengthening linkages to agri-businesses via contract farming, agriculture cooperatives and farmer equity model
The state government and central government can undertake a number of initiatives to make agriculture from
productive and remunerative:-
State Government:- Free up land lease market: The land lease market is encumbered by tenancy regulations restricting the
consolidation of holdings. A few suggested reforms are to ensure that the landowner is not dispossessed of his
land in the process of leasing and that the lessee has no tenancy rights, prolong the lease period to 10-15 years
and remove any ceiling on size of lease and ensure that the land automatically reverts back to the farmers/
landowners at the expiry of the lease period.

59
- Custom hiring model: While the model is prevalent in India for some of the agriculture machinery, it is highly
unorganized and sporadic in present situation. Custom hiring models can be put in place more actively by state
governments whereby farm machinery is available to farmers on a pay per use basis. This reduces the capital
requirement of farmers while giving them the opportunity to mechanize farming.
- APMC Reform: The Model APMC Act in 2003 has several provisions to increase private trade, but state
governments still has a large role to play in facilitating the provisions. State government may facilitate sale of
agriculture produce directly from farmers to consumers, reducing the role of middlemen.
Central Government:- MNREGA reforms: It is suggested that seasonal calendars be introduced by the Gram Panchayats to ensure
that the landless labourers get adequate time under the MGNREGA as well as on farms. Also some agricultural
activities (such as weeding, irrigating, sowing and cutting for harvesting) should be included into the MGNREGA
shelf of works. This can ease some of the pressure on the farmers due to increasing wage rates and provide
employment to the landless labourers.
- Invest in Research: India’s spends on agricultural research is lower than of Sub-Saharan Africa. The central
government can boost agricultural research and its availability by improving coordination among individual
research institutions, increasing the engagement of farmers in extension services and enhancing private-sector
participation.
Conclusion

60 Annexure
2005-06 2011-12 CAGR 2019-20 Expected CAGR
Population 1098 1210 1.6% 1345 1.2%
Workforce Size 453 467 0.5% 498 0.8%
Workforce Population Ration 41% 38.6% 37%
Employment in Agriculture 263 228 -2.3% 205 -1.3%
Employment in Secondary Sector 85 111 4.5% 138 2.8%
Employment in Teritary Sector 105 128 3.3% 155 2.4%
Growth in GDP 8.3% 5.3% projected
Growth in Agri GDP 3.8% 3% projected
Growth in Industrial (Secondary) GDP 8.0% 4.9% projected
Growth in ServicesGDP 9.8 7.1% projected
Reduction in Agricultural Workforce by 2020 23
Estimation of Labour Force Reduction in Agriculture by 2019-20
Source: Planning Commission, Economic Intelligence Unit, KPMG Analysis