laboratory study of landfill leachate effect on resistivity in unsaturated soil using cone...
TRANSCRIPT

Laboratory study of landfill leachateeffect on resistivity in unsaturatedsoil using cone penetrometerG.L. Yoon Æ M.H. Oh Æ J.B. Park
Abstract Electrical resistivity of soils is dependentupon various factors, including soil type, watercontent, saturation and pore fluid property. Exper-imental works have been performed to investigatethe relationship between electrical resistivity andunsaturated subsurface conditions with varyingphysical property and landfill leachate contamina-tion. The moisture density can be the most effectiveindicator for describing the relationship betweenelectrical resistivity and physical property of unsat-urated subsurface. For three different tested soils,the electrical resistivity of soil exponentially de-creased as moisture density increased. The adding ofleachate having various ions decreased the electricalresistivity. Also, the formation factor can be de-scribed by the term of moisture density in unsatu-rated sand. The formation factor was higher whensoil and pore water were contaminated by higherconcentration of leachate than when soil and porewater are uncontaminated, since ionic movement isrestrained by electro-chemical interactions betweensoil particles and leachate constituents.
Keywords Electrical resistivity Æ Landfillleachate Æ Moisture density Æ Formation factor
Introduction
The evaluation of groundwater and soil properties hasbecome increasingly important for site characterizationwhen more industrial wastes and domestic solid refusecome into contact with groundwater and soils and causesubsurface contamination. One of the emerging techniquesto assess the contaminated media is the electricalresistivity method, which can be performed rapidly andnondestructively in situ. Every soil possesses a naturalresistivity within certain limits; deviations may suggestpossible pollutions as the contaminants may influence thebulk resistivity of soil (Abu-Hassanein and others 1996).Alternatively, a resistivity cone penetration test (RCPT),which is a modification of the cone penetration test (CPT)equipment as shown in Fig. 1, can be employed at arelatively low cost for delineation of subsurface contami-nation in situ, and then be supplemented with a minimumconfirmatory sampling and laboratory testing program.The use of the resistivity cone is particularly appealingbecause the cone can measure resistivity to a higherresolution and at the same time note change in lithology(Campanella and Weemees 1990). At first, the measure-ment of electrical resistivity (or conductivity) was devel-oped to evaluate in situ density or porosity of sands.Previous efforts in geoenvironmental site investigationusing RCPT, as reported in the literature, have shownsome applicability of the resistivity measurement method(Campanella and Weemees 1990; Piccoli and Benoit 1995).Kokan (1990) and Strutynsky and others (1991) reportedreasonable success in delineating light non-aqueous phaseliquid (LNAPL) hydrocarbon. Additionally, Okoye andothers (1995) confirmed the applicability of the RCPTmethod in delineating creosote contamination in saturatedsoil. Although the electrical resistivity measurement cangive a good indication of a contaminant plume, quantita-tive correlation between electrical resistivity and the con-centration of contaminant in the subsurface has not beenfully established. Only a few studies have been conductedon the electrical resistivity characteristics of soil with thechange of the subsurface condition in unsaturated soil(McCarter 1984; Abu-Hassanein and others 1996).As the factors affecting electrical resistivity of soils arevery important for the characterization of contaminatedsubsurface, parametric studies based on laboratory testshave been performed in this paper. The objectives ofthis paper are twofold: first, to examine the relationship
Received: 18 March 2002 / Accepted: 10 June 2002Published online: 22 August 2002ª Springer-Verlag 2002
G.L. YoonCoastal and Harbor Engineering Research Laboratory,Korea Ocean Research and Development Institute,Sa-dong, Ansan-si, Kyunggi-do 425–744, Korea
M.H. Oh Æ J.B. Park (&)School of Civil, Urban and Geosystem Engineering,Seoul National University, Shinlim-dong,Gwanak-gu, Seoul 151–742, KoreaE-mail: [email protected]
Original article
18 Environmental Geology (2002) 43:18–28 DOI 10.1007/s00254-002-0649-1

between electrical resistivity and the unsaturated subsur-face condition; and second, to investigate the variation ofelectrical resistivity and formation factor of unsaturatedsoils due to landfill leachate based on the laboratory-scaledexperiments using the resistivity cone penetrometer.
Background
Fundamentals of electrical resistivityElectric current can be conducted in three different ways,i.e. ohmic conduction, electrolytic conduction, and di-electric conduction. The electrons flow through the crys-talline structure of some materials in ohmic conduction.Ohmic conduction occurs most readily in metals. Elec-trolytic conduction is carried out by ions dissolved ingroundwater, through the interconnected pores of soil,unconsolidated sediment, or rock. In dielectric conduc-tion, an alternating electrical field causes ions in a crys-talline structure to shift cyclically. Even though there is noactual flow of charged particles, the cyclic change in thepositions of ions is a movement that can be viewed as analternating current. Dielectric conduction can occur inelectric insulators, which are materials that otherwise donot carry electric current (Robinson and Coruh 1988).In RCPT, conduction takes place in two modes: (1)ohmic conduction across the metallic electrodes and (2)electrolytic conduction through the pore fluid (Campa-
nella and Weemees 1990). Electrical conduction inelectrolytic solutions, moist soils, and water-bearingrocks occurs as a result of the movement of ions. Thecapability to transmit ions governs the electrical resis-tivity, which is a basic property of all materials(Abu-Hassanein and others 1996).The electrical resistivity method works on the principlethat the measured voltage drop across a pair of electrodesat a certain current is proportional to the electrical resis-tivity of the soil. All materials, including soil and rock,have an intrinsic property of resistivity, which governs therelationship between the current density and the gradientof the electrical potential. Typical measurement systemsinclude the Wenner type and the Schlumberger type.Details on electrode array systems are described in theliterature (Kearey and Brooks 1991; Kalinski and Kelly1994; Yoon and Park 2001).
Factors affecting electrical resistivity of soilElectrical resistivity of soil is known to depend on the soiltype and the electrical resistivity and temperature of porefluid. Soil properties affecting the resistivity of the soil alsoinclude porosity, degree of saturation, water content, grainsize distribution, particle shape and orientation, and porestructure(Abu-Hassanein and others 1996; Yoon and Park2001).A pioneering work was carried out by Archie (1942) whoderived the first general relationship of the electrical re-sistivity of saturated soil (qsat) to the electrical resistivityof its pore fluid (qw). Archie’s formula assumes that bulkresistivity is directly related to pore fluid resistivity and thegeometry of the pore structures in the subsurface (Archie1942; Campanella and Weemees 1990). A term commonlyused to relate bulk resistivity to pore fluid resistivity is theformation factor. Archie’s formula is as follows:
FF ¼ qsat
qw
¼ an�m ð1Þ
where FF is the formation factor, n is porosity, and a andm are constants depending on the type of soils. Theconstants a and m are parameters whose values are as-signed arbitrarily to make the equation fit a particulargroup of measurements. Keller and Frischknecht (1966)suggest that a is less than unity for rocks with inter-granular porosity and greater than unity for those withjoint porosity. The constant m is referred to as thecementation factor, and it varies between 1.4 for quartzsand and over 3.0 for sodium montmorillonite (Archie1942; Atkins and Smith 1961; Jackson 1975). m is de-pendent on the shape of the particles, increasing as theybecame less spherical, while variations in size and spreadof sizes appeared to have little effect. Thus, m is ameasure of pore tortuosity (Jackson and others 1978).Equation (1) shows that the electrical resistivity of satu-rated soils is sensitive to the porosity, electrical resistivityof the pore fluid and the structure of the pores (Abu-Hassanein and others 1996). Archie’s formula has beenused extensively for determination of porosity in sedi-ments and is valid under the condition that the pore fluid
Fig. 1Schematic diagram of RCPT (Shinn and others 1998)
Original article
Environmental Geology (2002) 43:18–28 19

resistivity is relatively low and there is small content ofclay minerals present in saturated soil (Campanella andWeemees 1990).The electrical resistivity also depends on the degree ofsaturation. The electrical resistivity of unsaturated soils(q) can be related to that of saturated soils (qsat) as follows(Keller and Frischknecht 1966; McNeill 1990):
q ¼ qsatS�B ð2Þ
where S is degree of saturation and B is an empiricalparameter. This equation was developed for porous mediahaving fixed pore structure and variable degree of satu-ration. Abu-Hassanein and others (1996) reported thatparameter B falls between 0.64 and 2.29 for ten clays, all ofwhich have been used to successfully construct compactedclay liners having field-scale hydraulic conductivity ofless than 1·10–7 cm/s. Equation (2) demonstrates thatincreasing the degree of saturation results in loweringelectrical resistivity. However, the degree of saturation inthe field may not be directly obtained by measuring theelectrical resistivity using RCPT, because the resistivity ofsaturated soil in Eq. (2) needs to be determined throughon extra experiment. The extra experiment for evaluatingthe resistivity of saturated soil is time-consuming anddifficult. Therefore, to rapidly obtain the properties of theunsaturated subsurface in situ, the direct relationshipbetween the resistivity in the unsaturated soil and the soilproperty of unsaturated subsurface, which is more prac-tical for field application, needs to be developed.
Materials and methods
Test materialsThree different local soils – sandy soil, weathered granitesoil, and silty sand – commonly distributed around theKorean peninsula were used to investigate the relationshipbetween electrical resistivity and unsaturated soil proper-ties. Soil index tests and standard proctor compaction testswere performed as preliminary tests. The grain size dis-tribution curves of the test soils are shown in Fig. 2 andthe physical properties for the test soils are summarized inTable 1. Note that only the silty sand contains about 7.5%of silty clay particles among the three sampled soils. Also,the heavy metal concentrations of the test soils are shownin Table 2. The effect of heavy metal ions on electricalresistivity in the soil sample could be negligible since the
concentration of the heavy metal ion constituents in thesample was extremely low as listed in Table 2. Tap waterwas used as the pore fluid for the uncontaminated soils.The conductivity of tap water was measured at 25 �C by aconductivity meter (ORION 550A, K=0.475; ASTM 1991),and then converted into the electrical resistivity, whichwas measured as 67 Wm (=0.15 mS/cm).To simulate contaminated soil conditions, landfill leachatecollected from the industrial landfill site called the GreaterCity of Inchon Landfill in Korea was added in the exper-iments. Leachate is the complex mixture of fluids con-taining both conductive and insulating constituents.Normally, such mixtures will produce highly conductiveplumes as the influence of the conductive contaminants isgreater than that of the non-conducting contaminants(Campanella and Weemees 1990). Major heavy metalconcentrations, such as Cr, As, Cd, Pb, Cu, Hg and ionicconstituent concentrations, were analyzed before per-forming experiments because the concentrations of heavymetal and ion constituents are the main factors in theresistivity measurements. The constituent concentrationsof the Inchon landfill leachate are shown in Table 3. Theconductivity of the leachate measured by the conductivitymeter was 23.51 mS/cm (0.425 Wm) and measured valuesof biochemical oxygen demand (BOD) and chemical oxy-gen demand (COD) for the leachate were 820 and 285 mg/L,respectively. Also, the pH value was 8.76. Inchon landfillleachate used here could be considered as representativefor the typical landfill leachate in its constituents andconcentration because the constituents and concentrationof the Inchon landfill leachate fall into the general range of
Fig. 2Grain size distribution of the test soils
Table 1Physical characteristics of the test soils. NP Non-plastic; USCS Unified Soil Classification System; SP poorly graded sand; SP-SM poorly gradedsilty sand
Soils Index properties Compaction characteristics
Specific gravity Passing #200 Plasticity index USCS Maximum dry unit weight Optimum water content(%) (g/cm3) (%)
Sandy soil 2.64 1.5 NP SP 1.67 17.7Weathered granite soil 2.68 0.7 NP SP 1.91 12.6Silty sand 2.66 7.5 NP SP-SM 1.89 15.9
Original article
20 Environmental Geology (2002) 43:18–28

the reported leachate data in the literature. In the labora-tory experiment, 5, 10 and 30% (by volume) of the leachatewas mixed with deionized water and used as contaminatedpore fluid to analyze the sensitivity of the leachate con-centration in the soil phase to electrical resistivity. Theconductivity of the diluted leachate solutions were mea-sured at 25 �C.
Test equipment and methodsLaboratory test methods for measuring the resistivity ofsoils include the use of a manufactured resistivity dummycone as shown in Fig. 3. The dummy cone consists of afour-electrode array, which minimizes the effect of polar-ization, as the current drawn through the measurementelectrodes is very small, thus, there is no appreciablebuildup of ions at the electrodes (Campanella andWeemees 1990). Current is passed between the two outerelectrodes and the potential or voltage drop is measuredbetween the two inner electrodes. The Wenner array,comprised of four evenly spaced electrodes, was used withthe dummy cone having electrode spacing of 50 mm. TheSTING R1/SWIFT resistivity measuring system ‘MemoryEarth Resistivity Meter’ (Advanced Geosciences, Inc.) wasused to induce the current and measure the voltage drop.Laboratory experiments were performed using a circularchamber made of polyvinylchloride (PVC), which is anelectrical insulator (electrical resistivity �1014 Wm), with adiameter of 500 mm and height of 700 mm, as shown inFig. 4. To convert from resistance to resistivity, a labora-tory calibration was made for the dummy cone. Thechamber was filled with potassium chloride solution. Thenthe resistivity of solution was noted with a conductivitymeter (ORION 550A), and the values were compared withthe resistance measured by the dummy cone used in thisstudy. A linear relationship between the measured resis-tance and the resistivity was obtained from the calibration.To investigate the electrical resistivity under the sameconditions for the test soils and consider water contentmore or less than the optimum water content, four
different dry unit weights with three different water con-tents on the basis of the standard proctor compaction testswere used (Table 4) because the variation in soil resistivitywith increasing water content is very different before andafter the optimum water content (Abu-Hassanein andothers 1996). The water contents decreased slightly duringthe tests due to evaporation. In this study, the water
Table 2Heavy metal concentrations (ppb) in soils
Heavy metals Sandy soil Weatheredgranite soil
Silty sand
Cr 0.8 0.8 1.0As 5.0 5.0 5.0Cd 0 0 0Pb 17.0 14.8 12.0Cu 0 0 0Hg 0 0.3 0
Table 3Constituent concentrations in Inchon landfill leachate
Heavy metals Ions
Cr As Cd Pb Cu Hg K+ Na+ NH4+ Mg2+ Ca2+ Fe2+ Cl) SO4
2)
Concentration(mg/L)
1.015 0.215 0.030 0.440 0.030 0.005 1,400 1,716 935 238 243 26 4,214 152
Fig. 3The dummy cone
Fig. 4Laboratory experimental setup with dummy cone and cylinderchamber
Original article
Environmental Geology (2002) 43:18–28 21

contents at the end of the experiments were used to ana-lyze the experimental results. To analyze the sensitivity ofleachate concentration in soil, 5, 10 and 30% (by volume)of leachate mixed with fresh water was added to each soil.All measurements were conducted for less than a fewminutes because the applied current causes overheating ofthe specimen (Shang and others 1995; Kaya and Fang1997).
Boundary effect of the test set upThe electrical resistivity of natural lake water was mea-sured by dummy cones for investigating the boundaryeffect due to the PVC cylinder chamber, assuming thenatural lake water is a homogeneous material. The elec-trical resistivity of natural water was measured usingdummy cones in the lake, which is in Seoul, Korea, whereit can be regarded as in a semi-infinite condition. Thenatural water, which was sampled at the same point in thelake, filled the cylinder chamber used in this experiment.The electrical resistivity of the lake water was measured bythe dummy cone in the same way.Table 5 shows that, in the case of measuring in a semi-infinite condition, the measured electrical resistivity ofthe lake water was about 17.7 Wm. In the case of mea-suring at the cylinder chamber, the electrical resistivityof the lake water is about 18.7 Wm. The electrical resis-tivity measured using a dummy cone having 50-mmelectrode spacing showed a small difference between thesemi-infinite condition and the circular chamber; how-ever, this difference can be negligible. The electrodespacing can be practically assumed to be the distance ofobservation in the electrical resistivity measurementsystem. This assumption is supported by previousresearch output such that 70–90% of the injected currentflows through depths at less than the electrode spacing.Moreover, that distance can be practically assumed to bethe depth of current intrusion (Keller and Frischknecht1966; Van Nostrand and Cook 1966; Kalinski and Kelly1994). It is evident that the electrical resistivity measured
by the cone with 50-mm electrode spacing is not affectedby the PVC cylinder chamber with 500-mm diameter,because the radius of the cylinder chamber (250 mm)is larger than the effective distance of the resistivitymeasurement.
Results and analysis
Effects of moisture density on resistivityIt has been recognized that water is the dominant factorin the electrical resistivity of soil, except in the case ofhigh specific surface minerals in high resistivity fluids(Curtis and Narayanan 1998; Saarenketo 1998; Oh andPark 2000). Figure 5 shows that the electrical resistivityof soils decreases with increasing gravimetric watercontent. However, the electrical resistivity varies with thechange of porosity (or dry unit weight) at a particularwater content. The decrease of porosity (i.e. the increasein dry unit weight) enhances the connectivity of porefluid and soil particles, which results in increasing elec-tric current path and, consequently, resistivity decreases.Therefore, gravimetric water content alone cannot beused as a criterion on which to base the resistivity of soilbecause soil samples may have identical water contentsbut different porosity (i.e. different dry unit weight).McCarter (1984) reported that the decrease in the air–void ratio would reduce resistivity at a particular watercontent.The electrical resistivity is primarily influenced by theweight of water per unit volume of soil mass rather thanthe gravimetric water content defined as the ratio of weightof water to weight of dry soil. The former is termedmoisture density in grams per cubic centimeter. Themoisture density, md, is calculated as follows (Selig andMansukhani 1975):
md ¼Ww
Vt¼ Ww
Ws
Ws
Vt¼ xcd ð3Þ
where Ww is the weight of pore water, Vt is the volume ofsoil sample, Ws is the weight of solid phase, cd is the dryunit weight of soil in grams per cubic centimeter, and x isthe conventional gravimetric water content. The moisturedensity reflects the changes of gravimetric water contentand dry unit weight.If the unit weight of fluid is 1 g/cm3, moisture densityhas the same value as volumetric water content, and canbe expressed by times of porosity(n) and degree ofsaturation(S):
Table 4Summary of experimental conditions for test soils
Sandy soil Weathered granite soil Silty sand
Dry unit weight (g/cm3) 1.55 1.50 1.45 1.40 1.75 1.70 1.65 1.55 1.70 1.60 1.50 1.40Porosity 0.41 0.43 0.45 0.47 0.35 0.37 0.39 0.42 0.36 0.40 0.44 0.47Water content (%) 19 19 19 19 19 19 19 19 18 18 18 18
14 14 14 14 14 14 14 14 14 14 14 1410 10 10 10 11 11 11 11 10 10 10 10
Table 5Comparison of resistivity measurement (Wm) under semi-infinitecondition and cylinder chamber condition
Measured resistivity Average
Test no. 1 Test no. 2 Test no. 3
Semi-infinite condition 17.7 17.7 17.6 17.7Cylinder chamber
condition18.7 19.3 18.1 18.7
Original article
22 Environmental Geology (2002) 43:18–28

md ¼Ww
Vt¼ Vwcw
Vt¼ Vv
Vt
Vw
Vv¼ nS ð4Þ
where cw is the unit weight of fluid, Vv is the volume of thepores and Vw is the volume of pore water.
The results are shown in Fig. 6. Good correlation wasobserved between moisture density and measured electri-cal resistivity of soils. Although three types of tested soilshave different ranges of electrical resistivity with moisturedensity, it is shown that the electrical resistivity of soilsdecreases and gradually converges as the moisture densityincreases for all soils. The increase of moisture densitymeans the increase of dry unit weight at a particular watercontent or the increase of water content at a certain dryunit weight. It is evident that the increase of water contentresulted in the decrease of electrical resistivity of bulk soil.Also, the increase of dry unit weight means the increase ofthe degree of saturation at a certain water content and theincrease of connectivity of pore fluid. Consequently, theseeffects cause decreasing electrical resistivity.
Effects of soil type on resistivityIn Fig. 6, sandy soil and weathered granite soil showedrelatively higher resistivity values than silty soil. This canbe explained by applying the fact that sandy soil andweathered granite soil contain more coarse-grained soilparticles than silty soil (Table 1). The coarse-grainedparticles are primarily quartz and feldspars that have highelectrical resistivity (Keller and Frischknecht 1966). Also,the decreasing rate in resistivity with increasing moisturedensity in sandy soil and weathered granite soil was higherthan that of silty sand, which means there was not muchvariation in resistivity values with increasing moisturedensity in silty soil. As moisture density increased from 0.1to 0.45 g/cm3, the electrical resistivity decreased from 459to 87 Wm for sandy soil, from 371 to 45 Wm for weatheredgranite soil, and from 111 to 27 Wm for silty sand, re-spectively.The electrical resistivity of silty sand is lower than that ofthe others due to the presence of 7.5% fine particles in siltysand (Fig. 2; Table 1). Soils with more fines often contain ahigher percentage of conductive particles, and have higherspecific surface which improves surface conduction(Kwader 1985). The presence of fine particles in silty sand
Fig. 5Effect of water content and porosity (dry unit weight) in resistivitymeasurements
Fig. 6Relationship between electrical resistivity and moisture density ofreconstituted soil
Original article
Environmental Geology (2002) 43:18–28 23

would affect the resistivity in two ways: (1) increased finescontent will decrease porosity, which has the effect ofincreasing the resistivity; and (2) the presence of fines inthe soil may indicate the presence of conducting clayminerals, which would result in a decrease in the resistivity.In clayey soil, electrical conduction occurs in the pores andon the surfaces of electrically charged clay particles, knownas surface conduction (Rhodes and others 1976; Urish1981). For clays in high resistivity fluids, surface conduc-tion can be a significant factor affecting the bulk electricalresistivity of the soil (Mitchell 1993; Sadek 1993). Also, thehigher the cation exchange capacity, the lower the resis-tivity of the soil. In general, the movement of ions withinthe pore fluid is related to the cation exchange capacity ofthe soil. For a given pore fluid, the cation exchange capacityis generally highest for clayey soils, lower for silty soils,and lowest for granular soils because of mineralogicalfactors. The electrical resistivity is low in clayey soil andhigh in granular soils for the same pore fluid (Okoye andothers 1995). Therefore, the electrical resistivity of siltysand, which contains 7.5% fine particles, is lower than thatof sandy soil and weathered granite soil because of theeffects of the surface conduction of fine particles.
Effects of landfill leachate contaminationon resistivity
The electrical resistivity of soil is also affected by theelectrical resistivity of pore fluid (Abu-Hassanein andothers 1996; Kaya and Fang 1997; Saarenketo 1998). Toinvestigate the effects of the electrical resistivity of porefluid due to landfill leachate contamination by adding 5, 10and 30% (by volume) of leachate mixed with deionizedwater to three sampled soils, the variations of electricalresistivity measured in the three soils were observed withchanging moisture density. Also, the electrical resistivity ofsoils was measured for four different dry unit weights withthree different water contents on the basis of Table 4. Theconductivity of leachate dilute solutions was measured bythe conductivity meter, and then the resistivity was cal-culated as shown in Fig. 7. The electrical resistivity of
leachate dilute solution ranges from 7.9 Wm for 5% leac-hate solution to 1.4 Wm for 30% leachate solution, and theelectrical resistivity of dilute solution decreases withincreasing volumetric leachate proportion of solution.The conductivity of the leachate diluted solution linearlyincreases with the concentration of the leachate, as shown
Fig. 7Electrical conductivity and resistivity of leachate dilute solution (at25 �C)
Fig. 8Relationship between electrical resistivity of soils mixed with Inchonlandfill leachate dilute solution and moisture density
Original article
24 Environmental Geology (2002) 43:18–28
in Fig. 7. As the solution is relatively homogeneous andthus the movement of ions is free, the conductivity of thesolution is proportional to the ionic concentration, whichgives the electrical resistivity or conductivity method greatpotential for detecting contaminants, quantitatively. Theconductivity or resistivity measurement method is fre-quently applied to water analysis to obtain a rapid estimateof the dissolved solids content of a water sample (Sawyerand others 1994). However, the ground is not homoge-neous and the electrical resistivity of bulk soil is affectedby many factors, for example, shape and orientation of soilparticles and pore structure. Nevertheless, the experi-mental results show that the electrical resistivity of bulksoil decreases as the proportion of leachate increases(Fig. 8).The values of electrical resistivity of soils are plotted as afunction of moisture density in Fig. 8. At all moisturedensities, there were significant drops in resistivity for thethree sampled soils after adding leachate compared withthose values in Fig. 6. More electrical conduction occurredas a result of the movement of ions in the leachate. As theleachate contains various ions (Table 3), the electrical re-sistivity was affected and dropped more significantly thanthat of the uncontaminated (leachate-free) condition.
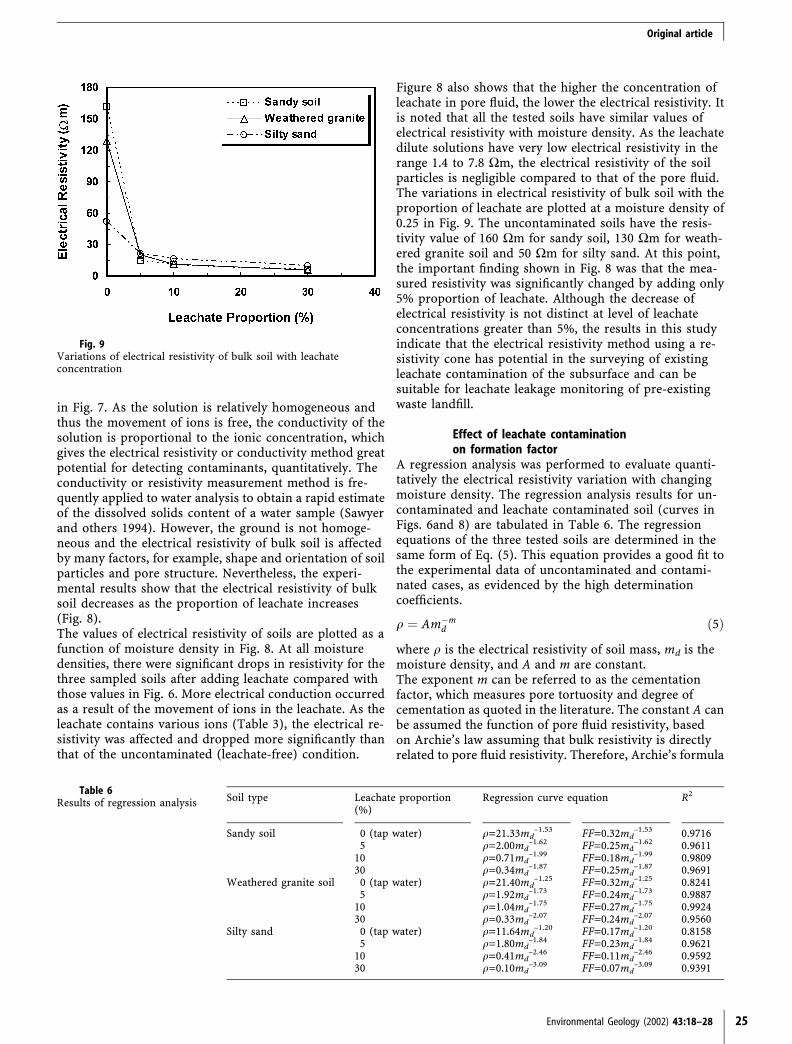
Figure 8 also shows that the higher the concentration ofleachate in pore fluid, the lower the electrical resistivity. Itis noted that all the tested soils have similar values ofelectrical resistivity with moisture density. As the leachatedilute solutions have very low electrical resistivity in therange 1.4 to 7.8 Wm, the electrical resistivity of the soilparticles is negligible compared to that of the pore fluid.The variations in electrical resistivity of bulk soil with theproportion of leachate are plotted at a moisture density of0.25 in Fig. 9. The uncontaminated soils have the resis-tivity value of 160 Wm for sandy soil, 130 Wm for weath-ered granite soil and 50 Wm for silty sand. At this point,the important finding shown in Fig. 8 was that the mea-sured resistivity was significantly changed by adding only5% proportion of leachate. Although the decrease ofelectrical resistivity is not distinct at level of leachateconcentrations greater than 5%, the results in this studyindicate that the electrical resistivity method using a re-sistivity cone has potential in the surveying of existingleachate contamination of the subsurface and can besuitable for leachate leakage monitoring of pre-existingwaste landfill.
Effect of leachate contaminationon formation factor
A regression analysis was performed to evaluate quanti-tatively the electrical resistivity variation with changingmoisture density. The regression analysis results for un-contaminated and leachate contaminated soil (curves inFigs. 6and 8) are tabulated in Table 6. The regressionequations of the three tested soils are determined in thesame form of Eq. (5). This equation provides a good fit tothe experimental data of uncontaminated and contami-nated cases, as evidenced by the high determinationcoefficients.
q ¼ Am�md ð5Þ
where q is the electrical resistivity of soil mass, md is themoisture density, and A and m are constant.The exponent m can be referred to as the cementationfactor, which measures pore tortuosity and degree ofcementation as quoted in the literature. The constant A canbe assumed the function of pore fluid resistivity, basedon Archie’s law assuming that bulk resistivity is directlyrelated to pore fluid resistivity. Therefore, Archie’s formula
Fig. 9Variations of electrical resistivity of bulk soil with leachateconcentration
Table 6Results of regression analysis Soil type Leachate proportion Regression curve equation R2
(%)
Sandy soil 0 (tap water) q=21.33md–1.53 FF=0.32md
–1.53 0.97165 q=2.00md
–1.62 FF=0.25md–1.62 0.9611
10 q=0.71md–1.99 FF=0.18md
–1.99 0.980930 q=0.34md
–1.87 FF=0.25md–1.87 0.9691
Weathered granite soil 0 (tap water) q=21.40md–1.25 FF=0.32md
–1.25 0.82415 q=1.92md
–1.73 FF=0.24md–1.73 0.9887
10 q=1.04md–1.75 FF=0.27md
–1.75 0.992430 q=0.33md
–2.07 FF=0.24md–2.07 0.9560
Silty sand 0 (tap water) q=11.64md–1.20 FF=0.17md
–1.20 0.81585 q=1.80md
–1.84 FF=0.23md–1.84 0.9621
10 q=0.41md–2.46 FF=0.11md
–2.46 0.959230 q=0.10md
–3.09 FF=0.07md–3.09 0.9391
Original article
Environmental Geology (2002) 43:18–28 25

can be modified to Eq. (6) including the term of moisturedensity, and thus the formation factor can be derived byfollowing Eq. (6):
FF ¼ qb
qw
¼ am�md ð6Þ
where qb is the bulk resistivity of soil mass and a is constant.
The formation factor is dependent on the intricate geom-etry of the pore channel, and therefore describes themanner in which the particles are arranged, if soil particlesare assumed insulators (Jackson and others 1978). Theformation factor in an unsaturated condition was de-scribed by moisture density as shown in Fig. 10 and theregression analysis results for the formation factor aretabulated in Table 6.In Fig. 10, the formation factor did not show the uniquecurve for a given soil. The formation factor tends to in-crease as the leachate concentration of pore fluid increases(i.e. the electrical resistivity of pore fluid decreases). Theseresults could be explained by the restraint in the charge-carrying ionic movement due to electro–chemical inter-actions, such as cation exchange reactions and chemi-sorption on aluminosilicates and oxides between soilparticles and leachate constituents. However, it would beconsidered that completion time of these reactions mightbe usually significantly longer than that of laboratory ex-perimental duration. To establish the effects of electro–chemical interactions on electrical resistivity or formationfactor, more specific research is needed. The resultsshowing the higher value of the formation factor in higherleachate concentration is more significant in silty sandthan any other soil. The result comes from a higher
Fig. 11Variations of constant a and cementation factor m in Eq. (5) withelectrical resistivity of pore fluid
Fig. 10Variation of formation factor–moisture density relationship due toleachate contamination in unsaturated sand
Original article
26 Environmental Geology (2002) 43:18–28

content of fine grain soils with the capacity of electro–chemical binding in silty sand.To investigate the effects of the electrical resistivity of porefluid on the constant a and the cementation factor m ofEq. (6), the relationships between the constants a and mvalues and the electrical resistivity of pore fluid are plottedin Fig. 11. This shows that the electrical resistivity of porefluid affects the constant a and cementation factor m ofEq. (6). In Fig. 11a, the variation of a value in sandy soiland weathered granite soil shows similar tendency exceptin the case of leachate at 10%, but silty sand shows a quitedifferent tendency from the other soils. However, a specifictendency cannot be described as shown in Fig. 11a. InFig. 11b, the cementation factor m tends to slightly de-crease as the electrical resistivity of pore fluid increases forall tested soils. However, the variations of cementationfactor m values were not significant in both sandy soil andweathered granite soil, but were remarkable in silty sand.The decrease of cementation factor means that the elec-trical resistivity of the unsaturated soil at low electricalresistivity of pore fluid is less sensitive to moisture densitythan at higher electrical resistivity of pore fluid. Thesefacts suggest that low electrical resistivity pore fluids re-duce the effect of moisture density on electrical resistivityof bulk soil because the influence of the conductive fluid isdominant in resistivity or conductivity measurements(Campanella and Weemees 1990). Although the electricalresistivity of pore fluid is known to affect constants a andm, more experimental data to derive the quantitativeequations are needed.
Conclusions
The following conclusions are drawn from the analysis ofelectrical resistivity variation for unsaturated soils basedon experimental laboratory works:
1. For three different sands tested, a unique relationshipexists between the electrical resistivity of soils andmoisture density, although individual soils have dif-ferent resistivity values. The electrical resistivity of soilsexponentially decreases as moisture density increases.Moisture density is the most effective indicator fordescribing the relationship between electrical resistivityand unsaturated subsurface condition.
2. Silty sand has relatively lower resistivity values thansandy soil or weathered granite soil. The electrical re-sistivity of silty sand was in the range of 27 to 111 Wm,while the electrical resistivity of sandy soil varied be-tween 87 and 459 Wm and the values for weatheredgranite soil were between 45 and 371 Wm. This can beexplained by surface conduction through 7.5% fineparticles in silty sand. Soils with more fines contain ahigher percentage of conductive particles. In contrast,electrical conductions in sandy soil and weatheredgranite soil occur primarily in liquid contained in thepores.
3. The adding of landfill leachate having various ionsresults in decreasing the electrical resistivity. Themeasured resistivity was significantly changed byadding only 5% proportion of leachate. It is concludedthat the resistivity measurement method using RCPTcan be used for detecting leachate in an unsaturatedsubsurface.
4. It is known that the formation factor in unsaturatedsand which is dependent on leachate concentration canbe described in terms of moisture density. The forma-tion factor is also dependent on leachate concentration.The formation factor was higher when soil and porewater are contaminated by high concentration of leac-hate than when soil and pore water are uncontami-nated. This could be explained by the restraint in thecharge-carrying ionic movement due to electro–chem-ical interactions between soil and leachate constituents.To establish the quantitative relationship between for-mation factor and leachate concentration, more workunder field conditions is required.
5. Further research will be fruitful on the resistivity andthe formation factor variations of soil depending on theinteraction between soil particles and various individ-ual contaminants.
References
Abu-Hassanein ZS, Benson CH, Blotz LR (1996) Electrical resis-tivity of compacted clays. J Geotech Eng 122(5):397–406
Archie GE (1942) The electrical resistivity log as an aid in de-termining some reservoir characteristics. Trans AIME 146:54–62
ASTM (1991) Standard test methods for electrical conductivityand resistivity of water. D 1125–91. American Society forTesting and Materials, Philadelphia, Pennsylvania
Atkins ER, Smith GH (1961) The significance of particle shape information factor–porosity relationship. J Petrol Technol 13:285–291
Campanella RG, Weemees I (1990) Development and use of anelectrical resistivity cone for groundwater contamination stud-ies. Can Geotech J 27:557–567
Curtis J, Narayanan R (1998) Effects of laboratory procedures onsoil electrical property measurements. IEEE Trans InstrumentMeas 47(6):1474–1480
Jackson PD (1975) An electrical resistivity method for evaluatingthe in-situ porosity of clean marine sands. Mar Geotechnol1(2):91–115
Jackson PD, Taylor Smith D, Stanford PN (1978) Resistivity–porosity–particle shape relationships for marine sands. Geo-physics 43(6):1250–1268
Kalinski RJ, Kelly WE (1994) Electrical-resistivity measurementsfor evaluating compacted-soil liners. J Geotech Eng 120(2):451–457
Kaya A, Fang HY (1997) Identification of contaminated soils bydielectric constant and electrical conductivity. J Environ Eng123(2):169–177
Kearey P, Brooks M (1991) An introduction to geophysicalexploration, 2nd edn. Blackwell, Oxford, 176 pp
Keller GK, Frischknecht FC (1966) Electrical methods ingeophysical prospecting. Pergamon Press, London
Original article
Environmental Geology (2002) 43:18–28 27

Kokan MJ (1990) Evaluation of resistivity cone penetrometer instudying groundwater quality. BA Sc Thesis, Department ofCivil Engineering, University of British Columbia, Vancouver
Kwader T (1985) Estimating aquifer permeability from forma-tion-resistivity factors. Groundwater 23(6):762–766
McCarter WJ (1984) The electrical resistivity characteristics ofcompacted clays. Geotechnique 34(2):263–267
McNeill J (1990) Use of electromagnetic methods for groundwaterstudies. Geotech Environ Geophys 1:191–218
Mitchell J (1993) Fundamentals of soil behavior, 2nd edn. Wiley,New York, 249 pp
Oh MH, Park JB (2000) Laboratory tests for the development ofthe contaminant leakage detection system in soil. In: ProcGeoEng 2000, Int Conf on Geotechnical and Geological Engi-neering, Melbourne, Australia, Publ 2, p 286
Okoye CN, Cotton TR, O’Meara D (1995) Application of resis-tivity cone penetration testing for qualitative delineation ofcreosote contamination in saturated soils. In: Proc Conf Geo-environment 2000, Geotechnical Spec Publ 46, ASCE, New York,pp 151–166
Piccoli S, Benoit J (1995) Geo-environmental testing using theenvirocone. In: Proc Conf Geoenvironment 2000, GeotechnicalSpec Publ 46, ASCE, New York, pp 93–104
Rhodes J, Raats P, Prather R (1976) Effect of liquid-phase elec-trical conductivity, water content and surface conductivity onbulk soil electrical conductivity. Soil Sci Soc Am J 40:651–655
Robinson ES, Coruh C (1988) Basic exploration geophysics. Wi-ley, New York, 446 pp
Saarenketo T (1998) Electrical properties of water in clay and siltysoils. J Appl Geophys 40:73–88
Sadek M (1993) A comparative study of the electrical and hy-draulic conductivities of compacted clays. PhD Diss, Depart-ment of Civil Engineering, University of California at Berkeley,Berkeley, California
Sawyer CN, McCarty PL, Parkin GF (1994) Chemistry for envi-ronmental engineering, 4th edn. McGraw-Hill, New York, 75 pp
Selig ET, Mansukhani S (1975) Relationship of soil moisture tothe dielectric property. J Geotech Eng Div 101(GT8):755–770
Shang JQ, Lo KY, Inculet II (1995) Polarization and conduction ofclay–water–electrolyte systems. J Geotech Eng 121(3):243–248
Shinn JD, Timian DA, Morey RM, Mitchell G, Antle CL, Hull R(1998) Development of a CPT deployed probe for in situ mea-surement of volumetric soil moisture content and electricalresistivity. Field Anal Chem Technol 2(2):103–109
Strutynsky AI, Sandiford RE, Cavalier D (1991) Use of piezo-metric cone penetration testing with electrical conductivitymeasurements (CPTU-EC) for detection of hydrocarbon con-tamination in saturated granular soils. Current practices ingroundwater and vadose zone investigations. American Societyfor Testing and Materials, Philadelphia, Pennsylvania, pp 72–79
Urish D (1981) Electrical resistivity–hydraulic conductivity rela-tionships in glacial outwash aquifers. Water Resour Res17(5):1401–1408
Van Nostrand RG, Cook KL (1966) Interpretation of resistivitydata. US Geological Survey, Professional Paper 499. USGS,Washington, DC
Yoon GL, Park J (2001) Sensitivity of leachate and fine contentson electrical resistivity variation of sandy soils. J Hazard Ma-terials 84(2–3):147–161
Original article
28 Environmental Geology (2002) 43:18–28