laboratory characterization of a compacted–unsaturated
TRANSCRIPT

applied sciences
Article
Laboratory Characterization of aCompacted–Unsaturated Silty Sand with SpecialAttention to Dynamic Behavior
Andrzej Głuchowski 1,* , Zdzisław Skutnik 2 , Marcin Biliniak 3, Wojciech Sas 1 andDiego Lo Presti 4
1 Water Centre-Laboratory, Warsaw University of Life Sciences-SGGW, 02-787 Warsaw, Poland;[email protected]
2 Institute of Civil Engineering, Warsaw University of Life Sciences-SGGW, 02-787 Warsaw, Poland;[email protected]
3 Menard Polska, 01-797 Warsaw, Poland; [email protected] Department of Civil and Industrial Engineering, University of Pisa, 56 122 Pisa, Italy; [email protected]* Correspondence: [email protected]; Tel.: +48-225-935405
Received: 31 January 2020; Accepted: 3 April 2020; Published: 8 April 2020�����������������
Featured Application: The test results reveal the response of compacted sandy silt soil to dynamicloading. The derived parameters based on the test results enrich the database of equation constantsand allow the designers to use them to model the engineered earth structure’s behavior.
Abstract: The dynamic properties of compacted non-cohesive soils are desired not only because ofthe risk of natural sources of dynamic excitations such as earthquakes, but mostly because of theanthropogenic impact of machines that are working on such soils. These soils are often unsaturated,which positively affects the soil’s mechanical properties. The information about the values of theseparameters is highly desirable for engineers. In this article, we performed a series of tests, includingoedometric tests, resonant column tests, bender element tests, and unsaturated triaxial tests, toevaluate those characteristic parameters. The results showed that sandy silt soil has a typicalreaction to dynamic loading in terms of shear modulus degradation and the damping ratio curves’characteristics, which can be modeled by using empirical equations. We found that the compactionprocedure caused an over-consolidation state dependent on the moisture content during compactioneffort. The article analyzed the soil properties that impact the maximum shear modulus G0 value.Those properties were suction s, confining pressure σ3, and compaction degree represented by thevoid ratio function f (e).
Keywords: dynamic properties; silty sand; resonant column; unsaturated soils; compacted soils
1. Introduction
The development of geotechnical constructions such as roads, railways, levees, and foundationsaround the globe forces engineers to build road constructions on so far unsuitable subgrades for suchpurposes [1–5]. One of the easiest ways to improve soil properties is compaction. The traffic or railwayloadings and industrial activities are connected to dynamic and cyclic excitations, which result inother soil responses in comparison to monotonic ones. The engineering constructions such as shallowfoundations usually settle at an average strain equal to 1% [6].
Recently, the scientific focus of dynamic soil properties has turned from earthquake events toanthropogenic ones, which are characterized by low amplitude and low strain ranges. Soils, whichare the subgrade of the foundation or road construction base, usually are compacted intentionally or
Appl. Sci. 2020, 10, 2559; doi:10.3390/app10072559 www.mdpi.com/journal/applsci

Appl. Sci. 2020, 10, 2559 2 of 19
unintentionally by machines such as heavy trucks. Therefore, the change in the original structure ofthe soil due to static and repeated loads impacts the subgrade soil parameters, which forces engineersto have proper information about the differences between natural and compacted soil. The repeatingloading and excitations due to cyclic and dynamic loads can be characterized by a small straincharacteristic to solve the boundary value problem [7].
The research conducted by Papakyriakopoulos et al. [8] was focused on silty soils’ laboratoryinvestigations into the main factors affecting the dynamic soil properties with the application of theresonant column technique. The materials in this study were the undisturbed specimens (from threeboreholes located in southern Greece), as well as two additional remolded ones for the resonant columnand cyclic simple shear tests. The soil was composed of sand and silt fractions. After a series of tests,the authors concluded that the low amplitude shear modulus (G0) increased with confining pressure(σ0), when material damping (D0) was slightly decreasing. The authors also observed that the highamplitude shear modulus (G) and material damping (D) could be normalized in terms of the G/G0
and D/D0 versus the γ/γ0 relationship. The empirical relationship was proposed for estimation of theG0 parameter, based on the proposition of Seed and Idriss [9] concerning the influence of the relativedensity described by coefficient K2,max, which is a function of the void ratio (K2,max = 0.345(1000-430e))at very low strains (γ ≤ 10−3%) (1):
G0 = 345(1− 0.43e)·(σ0)0.5. (1)
where G0 and σ0 are in MPa and e is the void ratio.Studies of the dynamic properties of Piedmont residual soils [10] were done by performing
resonant column and torsional shear tests. The residual soils tested in this research project weresaprolites, which are micaceous sandy silts and silty sands obtained from depths from 0.9 m to 5.3 m.The results of the resonant column tests showed that the low amplitude shear modulus increased withconfining pressure, which was also observed by Papakyriakopoulos et al. [8]. The maximum shearmodulus varied by a power of less than 0.5 to confining pressure. The authors also observed that theshear modulus decreased with an increase in shear strain in the range of 0.001% to 0.002%. Factorssuch as the frequency or number of cycles have no significant influence on the shear modulus anddamping ratio value.
Further studies on Piedmont residual silty soils extended the laboratory tests with an in situtest [11] with the conclusion that G0 increased with increasing confining pressure. The article reporteda general tendency of the normalized shear modulus G/G0 characteristics to increase with the increasein confining stress. The research also showed that the overconsolidation ratio did not affect theG/G0 relationship.
Another experimental study on sandy and silty soils showed that G0 was related to the meaneffective principal stress σ′m and void ratio [12–15]. This relationship is presented by Equation (2):
G0 = A·F(e)·(σ′m)n (2)
where A is an empirical constant reflecting the soil fabric formed through various stress and strainhistories, n is an empirically determined exponent, equal to 0.5, and F(e) is the void ratio functiondefined as (3):
F(e) =(B− e)2
1 + e, (3)
where the constant B is usually taken as 2.17 for round-grained sands [16–18].The tests performed by Salgado et al. [19] on silty sands revealed the impact of fines content on
the small strain stiffness and shear strength of silty sand. They performed triaxial and bender elementtests on the mix of Ottawa sand and silt with a known gradation component. The results showedthat the small strain shear modulus G0 was a function of the stress state and degree of compactnessof the silty sand. The authors also noted that, although small strain stiffness dropped with fines

Appl. Sci. 2020, 10, 2559 3 of 19
content, the critical-state strengths rose. The reason for that might be the freshly deposited silty sandfine particles that were not positioned in a way to provide optimum interlocking, so the small strainresponses of soil resulted in low stiffness characteristics. The greater stresses would result in fineparticles’ rearrangement and therefore increase interlocking, dilatancy, and shear strength.
The properties of soil differ even in the same layer, which is locally subjected to other stressconditions or the groundwater flow regime. Therefore, the response of soil is strongly influenced bywhat are generally termed local site conditions [20].
The topic of non-cohesive soil physical characteristics’ impact on the dynamic properties is stillunder development. Recently, an effort to understand the effect of mean grain size was conducted byUpereti and Leong [21] and by Wichtmann and Triantafyllidis [22]. The results of the tests showed thatthe increase of the coefficient of uniformity caused an increase in the non-linearity of the normalizedshear modulus and damping ratio with shear strain. The normalized shear modulus and dampingratio also increased with the decrease in mean grain size. The authors employed the results of thebender element, as well as cyclic triaxial tests to derive an empirical equation for the shear modulusdegradation curve based on the modified hyperbolic model [21].
The work of Lu and Kaya [23] aimed to study the elastic moduli change in unsaturated soils. Theytested a wide range of soil types in a uniaxial compression apparatus. The results of the tests showedthat the volumetric water content impacted the elastic moduli values. The results also indicated thatthe initial state of volumetric water content, as well as the drying and wetting path, would affect thevalues of elastic moduli.
A significant amount of knowledge concerning unsaturated non-cohesive soil response to cyclicloading was gathered recently [24–27]. The reason for that was the high demand for resilientmodulus characteristics. Resilient modulus Mr is one of the well-known parameters used in pavementengineering, which specifies the resilient strain during one cycle of loading. During cyclic loadingof the soil, hysteretic behavior is observed in the shearing strain range equal to 10−3%. The responseto such excitation in this strain range differs from this in the range 10−4% and 10−5%, where we canobserve that the elastic response and damping ratio are assumed to be equal to zero [28,29]. Theresilient strain is defined as the soil elastic response to cyclic loading during the unloading phase [30].Hence, we define the resilient modulus as the ratio of the repeated deviatoric stress to recoverablestrain [31–33] (4):
Mr =σdεr
, (4)
where σd is the applied repeated deviatoric stress and εr is the axial recoverable strain. In a smallstrain range, the resilient modulus is equivalent to Young’s modulus. Therefore, data obtained from atorsional shear test can be easily transformed from the shear modulus to Young’s modulus by applyingthe following relationship (5):
Mr = E = 2G(1 + υ) (5)
where υ is Poisson’s ratio; hence, the knowledge about the shear modulus value can be easily translatedto the resilient modulus value, and no additional cyclic loading tests are required.
To complement the existing literature, we performed tests on unsaturated silty soil in a smallstrain range to find the relationship between the unsaturated soil state parameters and the shearmodulus characteristics. The tests were conducted to extend the knowledge about the soil behaviorduring dynamic loading. Moreover, the tested soil was compacted to simulate the subgrade conditions.To present the silty soil behavior fully, we performed laboratory tests to identify the followingsoil properties:
• Determination of the impact of compaction on the consolidation properties of the tested soil toverify if compaction creates a soil preconsolidation state and to ensure the same consolidationconditions during the tests.

Appl. Sci. 2020, 10, 2559 4 of 19
• Characterization of the small strain behavior of the soil with the use of the resonant column testto obtain the initial shear modulus and shear modulus characteristics, as well as the dampingratio characteristics.
• Normalization of small strain data with respect to existing G0 and D0 empirical models.• Undrained triaxial tests to measure the soil suction of silty soil specimens and the initial shear
modulus value with the use of the bender element test.
Finally, we evaluated gathered data with existing empirical models, and we proposed the empiricalmodel for unsaturated silty soil for initial shear modulus calculation.
2. Materials and Methods
2.1. Physical Properties of the Soil
The non-cohesive soil, used for these tests, was the silty sand from a road construction site inPisa, Italy. The specific gravity (GS) of the soil was 2.73. Based on the sieve analysis, we did thesoil classification according to Eurocode 7, and we recognized the tested soil as sandy silt/silty sand(saSi/siSa). The results of the sieve analysis are shown in Figure 1. According to the value of CC andCU, the shape of the grading curve could be classified as medium-graded. The compaction test wasperformed with the application of Proctor’s method with modified effort (2700 kN-mm−3). The appliedmethod consisted of 25 blows of a hammer on each of the five soil layers in a 1 dm3 mold according toASTM D1557-12e1. We performed the tests for seven different moisture contents, which were equal to4.6%, 6.1%, 8.1%, 9.4%, 10.8%, 12.9%, and 14.8%.
Appl. Sci. 2020, 10, x FOR PEER REVIEW 4 of 20
• Normalization of small strain data with respect to existing G0 and D0 empirical models.
• Undrained triaxial tests to measure the soil suction of silty soil specimens and the initial shear
modulus value with the use of the bender element test.
Finally, we evaluated gathered data with existing empirical models, and we proposed the
empirical model for unsaturated silty soil for initial shear modulus calculation.
2. Materials and Methods
2.1. Physical Properties of the Soil
The non-cohesive soil, used for these tests, was the silty sand from a road construction site in
Pisa, Italy. The specific gravity (GS) of the soil was 2.73. Based on the sieve analysis, we did the soil
classification according to Eurocode 7, and we recognized the tested soil as sandy silt (saSi). The
results of the sieve analysis are shown in Figure 1. According to the value of CC and CU, the shape of
the grading curve could be classified as medium-graded. The compaction test was performed with
the application of Proctor’s method with modified effort (2700 kN-mm−3). The applied method
consisted of 25 blows of a hammer on each of the five soil layers in a 1 dm3 mold according to ASTM
D1557-12e1. We performed the tests for seven different moisture contents, which were equal to 4.6%,
6.1%, 8.1%, 9.4%, 10.8%, 12.9%, and 14.8%.
The results of the test showed maximal dry unit density ρds equal to 1.89 g·cm−3, in optimum
water content equal to 12.2%. Table 1 presents the results of the Proctor test with a corresponding
degree of saturation and void ratio data. Figure 2 presents the optimal moisture content curve. We
evaluated the bulk density with the use of the tapping fork test. The minimal bulk density ρd min was
equal to 1.19 g·cm−3, and the maximum bulk density ρd max was equal to 1.57 g·cm−3. The Proctor test
showed that the maximal bulk density was equal to 1.89 g·cm−3, and this value was taken for further
calculations. emax and emin were equal to 1.288 and 0.444, respectively.
Figure 1. Grain-size distribution curves of tested soil (blue dots, dry sieve analysis and sedimentation
analysis; orange dots, wet sieve analysis).
Figure 1. Grain-size distribution curves of tested soil (blue dots, dry sieve analysis and sedimentationanalysis; orange dots, wet sieve analysis).
The results of the test showed maximal dry unit density ρds equal to 1.89 g·cm−3, in optimumwater content equal to 12.2%. Table 1 presents the results of the Proctor test with a correspondingdegree of saturation and void ratio data. Figure 2 presents the optimal moisture content curve. Weevaluated the bulk density with the use of the tapping fork test. The minimal bulk density ρd min wasequal to 1.19 g·cm−3, and the maximum bulk density ρd max was equal to 1.57 g·cm−3. The Proctor testshowed that the maximal bulk density was equal to 1.89 g·cm−3, and this value was taken for furthercalculations. emax and emin were equal to 1.288 and 0.444, respectively.

Appl. Sci. 2020, 10, 2559 5 of 19
Table 1. Proctor’s compaction test data and physical properties of the compacted samples.
m (%) ρd (g·cm−3) e Sr ID
4.6 1.78 0.53 0.73 0.896.1 1.79 0.53 0.76 0.908.1 1.82 0.50 0.81 0.939.4 1.85 0.48 0.85 0.9610.8 1.89 0.44 0.9 1.0012.9 1.89 0.44 0.94 1.0014.8 1.83 0.49 0.95 0.94
Appl. Sci. 2020, 10, x FOR PEER REVIEW 5 of 20
Figure 2. Soil compaction curve of the tested soil.
Table 1. Proctor’s compaction test data and physical properties of the compacted samples.
m (%) ρd (g·cm−3) e Sr ID
4.6 1.78 0.53 0.73 0.89
6.1 1.79 0.53 0.76 0.90
8.1 1.82 0.50 0.81 0.93
9.4 1.85 0.48 0.85 0.96
10.8 1.89 0.44 0.9 1.00
12.9 1.89 0.44 0.94 1.00
14.8 1.83 0.49 0.95 0.94
2.2. Test Sample Preparation and Testing Methods
We performed the oedometer tests on compacted soil specimens prepared with the same
method. The oven-dry soil with a known mass was sprayed with water to the appropriate moisture
content. The compaction process was conducted with respect to the ASTM D1557-12e1 method.
Molded soil was subsequently confined to a cylindrical steel confining ring with a diameter of 75 mm
and 20 mm high and placed in a water bath. We subjected the soil samples to compressive stress by
applying a vertical load that uniformly acted over the area of the sample. Compressive stress was
equal to 12.5 kPa, 25.0 kPa, 50.0 kPa, 100.0 kPa, 200.0 kPa, 400.0 kPa, 800.0 kPa, 1600.0 kPa, and 3200.0
kPa.
We performed the resonant column tests on compacted soil samples (with respect to ASTM 4015-
15). The resonant column used for the test was Stokoe's fixed-free-type device. In this type of resonant
column, the torsional type of vibration is created. The samples were compacted in the Proctor mold,
and from the compacted sample, the resonant column sample was timed with the height h equal to
10 cm and diameter d equal to 5 cm. During the resonant column test, soil samples remained
unsaturated. The confining pressure σ3, applied in the resonant column cell on the sample was equal
to 30, 45, and 60 and on one sample to 150 kPa. After consolidation in each step, the torsional shear
and damping tests were performed.
The last test performed in the undrained triaxial apparatus aimed to establish the stress-
dependent soil-water characteristic curve. We prepared the sample for this test by compaction in
optimum moisture content. After the preparation of the sample, the soil was fully saturated and
consolidated to σ’3 equal to 100 kPa. After this phase, the unsaturated tests were conducted by using
the axis translation technique. We also measured the G0 moduli with the use of the bender elements
peak-to-peak technique.
1.7
1.75
1.8
1.85
1.9
1.95
2
2.05
2.1
0 5 10 15 20
dry
de
nsi
ty ρ
d(g
/cm
3)
soil moisture content m (%)
Sr = 1.00
Sr = 0.95
Sr = 0.90
Sr = 0.85
Sr = 0.80
Figure 2. Soil compaction curve of the tested soil.
2.2. Test Sample Preparation and Testing Methods
We performed the oedometer tests on compacted soil specimens prepared with the same method.The oven-dry soil with a known mass was sprayed with water to the appropriate moisture content.The compaction process was conducted with respect to the ASTM D1557-12e1 method. Molded soilwas subsequently confined to a cylindrical steel confining ring with a diameter of 75 mm and 20 mmhigh and placed in a water bath. We subjected the soil samples to compressive stress by applyinga vertical load that uniformly acted over the area of the sample. Compressive stress was equal to12.5 kPa, 25.0 kPa, 50.0 kPa, 100.0 kPa, 200.0 kPa, 400.0 kPa, 800.0 kPa, 1600.0 kPa, and 3200.0 kPa.
We performed the resonant column tests on compacted soil samples (with respect to ASTM4015-15). The resonant column used for the test was Stokoe’s fixed-free-type device. In this type ofresonant column, the torsional type of vibration is created. The samples were compacted in the Proctormold, and from the compacted sample, the resonant column sample was timed with the height hequal to 10 cm and diameter d equal to 5 cm. During the resonant column test, soil samples remainedunsaturated. The confining pressure σ3, applied in the resonant column cell on the sample was equalto 30, 45, and 60 and on one sample to 150 kPa. After consolidation in each step, the torsional shearand damping tests were performed.
The last test performed in the undrained triaxial apparatus aimed to establish the stress-dependentsoil-water characteristic curve. We prepared the sample for this test by compaction in optimum moisturecontent. After the preparation of the sample, the soil was fully saturated and consolidated to σ′3 equal to100 kPa. After this phase, the unsaturated tests were conducted by using the axis translation technique.We also measured the G0 moduli with the use of the bender elements peak-to-peak technique.
Appl. Sci. 2020, 10, 2559 6 of 19
3. Results
3.1. Oedometer Test Results
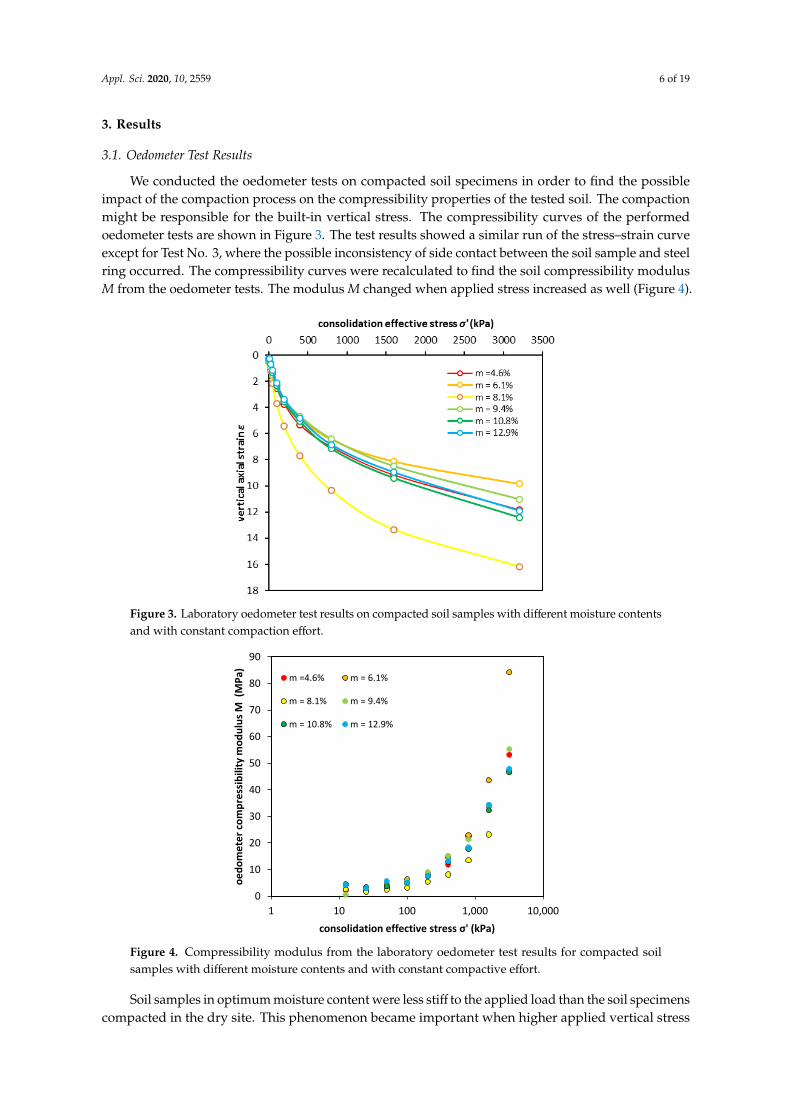
We conducted the oedometer tests on compacted soil specimens in order to find the possibleimpact of the compaction process on the compressibility properties of the tested soil. The compactionmight be responsible for the built-in vertical stress. The compressibility curves of the performedoedometer tests are shown in Figure 3. The test results showed a similar run of the stress–strain curveexcept for Test No. 3, where the possible inconsistency of side contact between the soil sample and steelring occurred. The compressibility curves were recalculated to find the soil compressibility modulusM from the oedometer tests. The modulus M changed when applied stress increased as well (Figure 4).
Appl. Sci. 2020, 10, x FOR PEER REVIEW 6 of 20
3. Results
3.1. Oedometer Test Results
We conducted the oedometer tests on compacted soil specimens in order to find the possible
impact of the compaction process on the compressibility properties of the tested soil. The compaction
might be responsible for the built-in vertical stress. The compressibility curves of the performed
oedometer tests are shown in Figure 3. The test results showed a similar run of the stress–strain curve
except for Test No. 3, where the possible inconsistency of side contact between the soil sample and
steel ring occurred. The compressibility curves were recalculated to find the soil compressibility
modulus M from the oedometer tests. The modulus M changed when applied stress increased as well
(Figure 4).
Figure 3. Laboratory oedometer test results on compacted soil samples with different moisture
contents and with constant compaction effort.
0
10
20
30
40
50
60
70
80
90
1 10 100 1,000 10,000
oe
do
me
ter
com
pre
ssib
ility
mo
du
lus
M (
MP
a)
consolidation effective stress σ' (kPa)
m =4.6% m = 6.1%
m = 8.1% m = 9.4%
m = 10.8% m = 12.9%
Figure 3. Laboratory oedometer test results on compacted soil samples with different moisture contentsand with constant compaction effort.
Appl. Sci. 2020, 10, x FOR PEER REVIEW 6 of 20
3. Results
3.1. Oedometer Test Results
We conducted the oedometer tests on compacted soil specimens in order to find the possible
impact of the compaction process on the compressibility properties of the tested soil. The compaction
might be responsible for the built-in vertical stress. The compressibility curves of the performed
oedometer tests are shown in Figure 3. The test results showed a similar run of the stress–strain curve
except for Test No. 3, where the possible inconsistency of side contact between the soil sample and
steel ring occurred. The compressibility curves were recalculated to find the soil compressibility
modulus M from the oedometer tests. The modulus M changed when applied stress increased as well
(Figure 4).
Figure 3. Laboratory oedometer test results on compacted soil samples with different moisture
contents and with constant compaction effort.
0
10
20
30
40
50
60
70
80
90
1 10 100 1,000 10,000
oe
do
me
ter
com
pre
ssib
ility
mo
du
lus
M (
MP
a)
consolidation effective stress σ' (kPa)
m =4.6% m = 6.1%
m = 8.1% m = 9.4%
m = 10.8% m = 12.9%
Figure 4. Compressibility modulus from the laboratory oedometer test results for compacted soilsamples with different moisture contents and with constant compactive effort.
Soil samples in optimum moisture content were less stiff to the applied load than the soil specimenscompacted in the dry site. This phenomenon became important when higher applied vertical stress

Appl. Sci. 2020, 10, 2559 7 of 19
was imposed on the compacted sandy subgrade (for example, shallow foundation, or embankment, orlevee construction).
The possible reason for such a response of soil specimens was the overconsolidation phenomenadue to compaction. For the investigation of the overconsolidation impact on soil response to verticalapplied stress, the determination of preconsolidation pressure was performed. In Figure 5, thecompressibility characteristics are presented. The method of work was employed to calculate thepreconsolidation pressure. The reason for that was the gentle curved e–σ′ characteristics where thegraphic methods like the Casagrande method could not be applied with much confidence. The methodof work proposed by Becker et al. [34] was based on the work input in the test. The sum of work (
∑W)
was the sum of finite work ∆Wi in the ith load step during the oedometric test. ∆Wi was the product ofaverage stress σ′avg on the sample (σ′avg = (σ′i + σ′i+1)/2) and the strain difference ∆ε (∆ε = (εi+1 − εi)).
Appl. Sci. 2020, 10, x FOR PEER REVIEW 7 of 20
Soil samples in optimum moisture content were less stiff to the applied load than the soil
specimens compacted in the dry site. This phenomenon became important when higher applied
vertical stress was imposed on the compacted sandy subgrade (for example, shallow foundation, or
embankment, or levee construction).
The possible reason for such a response of soil specimens was the overconsolidation phenomena
due to compaction. For the investigation of the overconsolidation impact on soil response to vertical
applied stress, the determination of preconsolidation pressure was performed. In Figure 5, the
compressibility characteristics are presented. The method of work was employed to calculate the
preconsolidation pressure. The reason for that was the gentle curved e–σ’ characteristics where the
graphic methods like the Casagrande method could not be applied with much confidence. The
method of work proposed by Becker et al. [34] was based on the work input in the test. The sum of
work (∑W) was the sum of finite work ΔWi in the ith load step during the oedometric test. ΔWi was
the product of average stress σ’avg on the sample (σ’avg = (σ’i + σ’i+1)/2) and the strain difference Δε (Δε
= (εi+1 − εi)).
The preconsolidation pressure σ’c differed when different moisture content test results were
compared. We estimated the highest preconsolidation pressure for peak moisture content (σ’c ~460
kPa). The lowest one was observed for samples where the moisture content was equal to 8.1%, which
was equal to 210 kPa. Other investigators also have concluded that compacted non-cohesive soils
behave as if they were overconsolidated [35–37]. Some of them stated that the observed
overconsolidation must be a function of remolding water content [38,39].
(a)
(b)
0
20
40
60
80
100
0
0.1
0.2
0.3
0.4
0.5
0.6
10 100 1,000 10,000
sum
of
wo
rk ∑
W (
kJ/m
3)
void
rat
io e
consolidation effective stress σ' (kPa)
e0 = 0.497m = 4.6%σ'c ≈ 405 kPa
0
10
20
30
40
50
60
70
80
0
0.1
0.2
0.3
0.4
0.5
0.6
10 100 1,000 10,000
sum
of
wo
rk ∑
W (
kJ/m
3)
void
rat
ioe
consolidation effective stress σ' [kPa]
e0 = 0.495m = 6.1%σ'c ≈ 280 kPa
Appl. Sci. 2020, 10, x FOR PEER REVIEW 8 of 20
(c)
(d)
(e)
(f)
Figure 5. Soil compressibility characteristics (red line, empty points) with the method of work for
preconsolidation pressure determination (red diamonds) in moisture content m equal to: (a) m = 4.6%,
(b) m = 6.1%, (c) m = 8.1%, (d) m = 9.4%, (e) m = 10.8%, and (f) m = 12.9%.
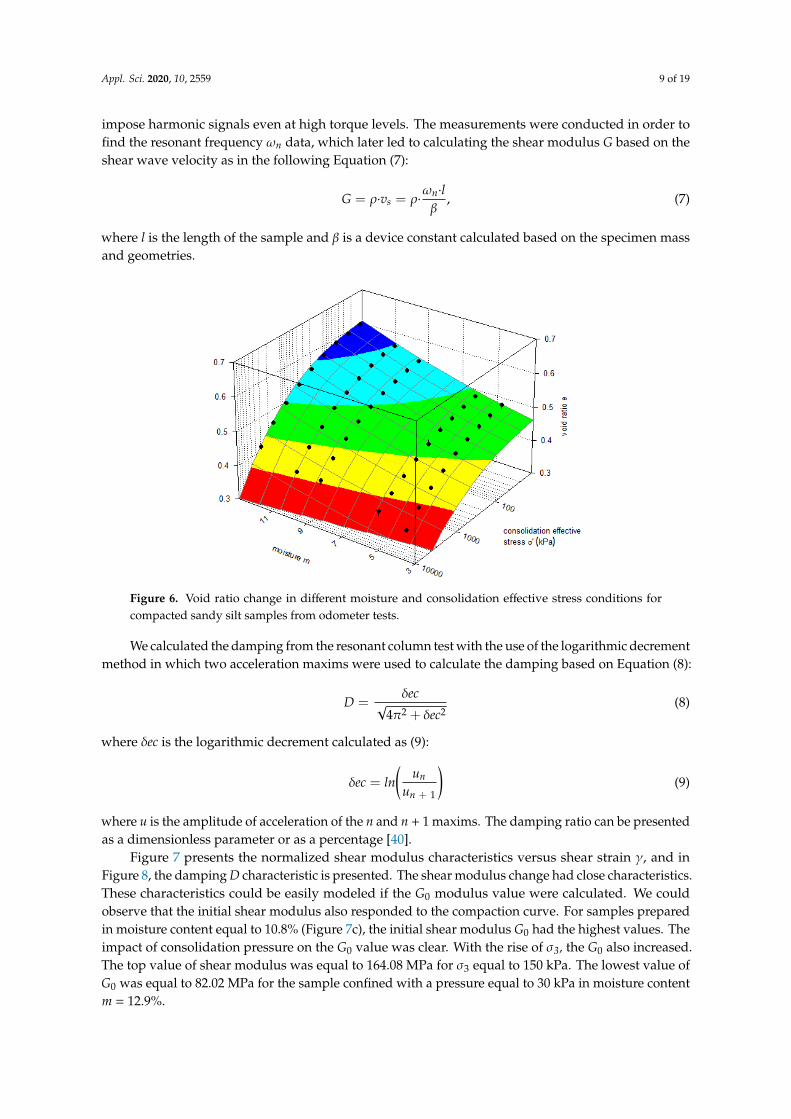
Figure 6 presents a three-dimensional view of consolidation from the oedometer test results
under constant moisture conditions during the sample compaction process equal to 4.6%, 6.1%, 9.4%,
10.8%, and 12.9%. The influence of moisture content on soil consolidation properties could be seen
by analyzing the fit to the mathematical data surface. The graph surface led to the derivation of the
mathematical model, which allowed calculating the void ratio in specified loading conditions and
moisture content. Equation (1) presents the formula as mentioned above for calculating the void ratio
e, as a function of effective consolidation stress σ’3 (kPa) and moisture content during the compaction
process m (%) (6):
0
20
40
60
80
100
120
140
0
0.1
0.2
0.3
0.4
0.5
0.6
0.7
0.8
10 100 1,000 10,000
sum
of
wo
rk ∑
W(k
J/m
3)
void
rat
ioe
consolidation effective stress σ' (kPa)
e0 = 0.697m = 8.1%σ'c ≈ 210 kPa
0
20
40
60
80
100
120
0
0.1
0.2
0.3
0.4
0.5
0.6
10 100 1,000 10,000
sum
of
wo
rk ∑
W(k
J/m
3)
void
rat
io e
consolidation effective stress σ' (kPa)
e0 = 0.576m = 9.4%σ'c ≈ 405 kPa
0
10
20
30
40
50
60
70
80
0
0.1
0.2
0.3
0.4
0.5
0.6
10 100 1,000 10,000
sum
of
wo
rk ∑
W (
kJ/m
3)
void
rat
io e
consolidation effective stress σ' (kPa)
e0 = 0.574m = 10.8%σ'c ≈ 450 kPa
0
10
20
30
40
50
60
70
80
0
0.1
0.2
0.3
0.4
0.5
0.6
0.7
10 100 1,000 10,000
sum
of
wo
rk ∑
W(k
J/m
3)
void
rat
io e
consolidation effective stress σ' (kPa)
e0 = 0.608m = 12.9%σ'c ≈ 450 kPa
Figure 5. Cont.

Appl. Sci. 2020, 10, 2559 8 of 19
Appl. Sci. 2020, 10, x FOR PEER REVIEW 8 of 20
(c)
(d)
(e)
(f)
Figure 5. Soil compressibility characteristics (red line, empty points) with the method of work for
preconsolidation pressure determination (red diamonds) in moisture content m equal to: (a) m = 4.6%,
(b) m = 6.1%, (c) m = 8.1%, (d) m = 9.4%, (e) m = 10.8%, and (f) m = 12.9%.
Figure 6 presents a three-dimensional view of consolidation from the oedometer test results
under constant moisture conditions during the sample compaction process equal to 4.6%, 6.1%, 9.4%,
10.8%, and 12.9%. The influence of moisture content on soil consolidation properties could be seen
by analyzing the fit to the mathematical data surface. The graph surface led to the derivation of the
mathematical model, which allowed calculating the void ratio in specified loading conditions and
moisture content. Equation (1) presents the formula as mentioned above for calculating the void ratio
e, as a function of effective consolidation stress σ’3 (kPa) and moisture content during the compaction
process m (%) (6):
0
20
40
60
80
100
120
140
0
0.1
0.2
0.3
0.4
0.5
0.6
0.7
0.8
10 100 1,000 10,000
sum
of
wo
rk ∑
W(k
J/m
3)
void
rat
ioe
consolidation effective stress σ' (kPa)
e0 = 0.697m = 8.1%σ'c ≈ 210 kPa
0
20
40
60
80
100
120
0
0.1
0.2
0.3
0.4
0.5
0.6
10 100 1,000 10,000
sum
of
wo
rk ∑
W(k
J/m
3)
void
rat
io e
consolidation effective stress σ' (kPa)
e0 = 0.576m = 9.4%σ'c ≈ 405 kPa
0
10
20
30
40
50
60
70
80
0
0.1
0.2
0.3
0.4
0.5
0.6
10 100 1,000 10,000su
m o
f w
ork
∑W
(kJ
/m3)
void
rat
io e
consolidation effective stress σ' (kPa)
e0 = 0.574m = 10.8%σ'c ≈ 450 kPa
0
10
20
30
40
50
60
70
80
0
0.1
0.2
0.3
0.4
0.5
0.6
0.7
10 100 1,000 10,000
sum
of
wo
rk ∑
W(k
J/m
3)
void
rat
io e
consolidation effective stress σ' (kPa)
e0 = 0.608m = 12.9%σ'c ≈ 450 kPa
Figure 5. Soil compressibility characteristics (red line, empty points) with the method of work forpreconsolidation pressure determination (red diamonds) in moisture content m equal to: (a) m = 4.6%,(b) m = 6.1%, (c) m = 8.1%, (d) m = 9.4%, (e) m = 10.8%, and (f) m = 12.9%.
The preconsolidation pressure σ′c differed when different moisture content test results werecompared. We estimated the highest preconsolidation pressure for peak moisture content (σ′c ~ 460kPa). The lowest one was observed for samples where the moisture content was equal to 8.1%, whichwas equal to 210 kPa. Other investigators also have concluded that compacted non-cohesive soils behaveas if they were overconsolidated [35–37]. Some of them stated that the observed overconsolidationmust be a function of remolding water content [38,39].
Figure 6 presents a three-dimensional view of consolidation from the oedometer test resultsunder constant moisture conditions during the sample compaction process equal to 4.6%, 6.1%, 9.4%,10.8%, and 12.9%. The influence of moisture content on soil consolidation properties could be seenby analyzing the fit to the mathematical data surface. The graph surface led to the derivation of themathematical model, which allowed calculating the void ratio in specified loading conditions andmoisture content. Equation (1) presents the formula as mentioned above for calculating the void ratioe, as a function of effective consolidation stress σ′3 (kPa) and moisture content during the compactionprocess m (%) (6):
e =1
2− 0.3·m2
100% + 2·σ′30.5
100 kPa
(6)
where R2 is equal to 0.956. Based on the oedometer tests, the conclusion was that the sandy silthad preconsolidation pressure, which rose with moisture content, and this relation was somewhatlogarithmic rather than linear, which meant in optimum moisture content, the preconsolidationpressure might be several dozen greater.
3.2. Resonant Column Test
The resonant column tests can measure rotational displacement and acceleration by the use ofproximitors, an accelerometer that registers coil current. The resonant column measures resonantfrequency and acceleration. Based on these measurements, we could calculate the modulus and strainlevels during the tests. This type of test was performed in a fixed-free device, and excitations wereimposed, as well as measurements were taken from a free end of the sample. The current that flowedthrough the coil provided the torque. The function generator and power amplifier devices were able to
Appl. Sci. 2020, 10, 2559 9 of 19
impose harmonic signals even at high torque levels. The measurements were conducted in order tofind the resonant frequency ωn data, which later led to calculating the shear modulus G based on theshear wave velocity as in the following Equation (7):
G = ρ·vs = ρ·ωn·lβ
, (7)
where l is the length of the sample and β is a device constant calculated based on the specimen massand geometries.
Appl. Sci. 2020, 10, x FOR PEER REVIEW 9 of 20
𝑒 =1
2 −0.3 ∙ 𝑚2
100%+2 ∙ 𝜎′3
0.5
100𝑘𝑃𝑎
(6)
where R2 is equal to 0.956. Based on the oedometer tests, the conclusion was that the sandy silt had
preconsolidation pressure, which rose with moisture content, and this relation was somewhat
logarithmic rather than linear, which meant in optimum moisture content, the preconsolidation
pressure might be several dozen greater.
Figure 6. Void ratio change in different moisture and consolidation effective stress conditions for
compacted sandy silt samples from odometer tests.
3.2. Resonant Column Test
The resonant column tests can measure rotational displacement and acceleration by the use of
proximitors, an accelerometer that registers coil current. The resonant column measures resonant
frequency and acceleration. Based on these measurements, we could calculate the modulus and strain
levels during the tests. This type of test was performed in a fixed-free device, and excitations were
imposed, as well as measurements were taken from a free end of the sample. The current that flowed
through the coil provided the torque. The function generator and power amplifier devices were able
to impose harmonic signals even at high torque levels. The measurements were conducted in order
to find the resonant frequency ωn data, which later led to calculating the shear modulus G based on
the shear wave velocity as in the following Equation (7):
𝐺 = 𝜌 ∙ 𝑣𝑠 = 𝜌 ∙𝜔𝑛 ∙ 𝑙
𝛽, (7)
where l is the length of the sample and β is a device constant calculated based on the specimen mass
and geometries.
We calculated the damping from the resonant column test with the use of the logarithmic
decrement method in which two acceleration maxims were used to calculate the damping based on
Equation (8):
𝐷 =𝛿𝑒𝑐
√4𝜋2 + 𝛿𝑒𝑐2 (8)
where δec is the logarithmic decrement calculated as (9):
Figure 6. Void ratio change in different moisture and consolidation effective stress conditions forcompacted sandy silt samples from odometer tests.
We calculated the damping from the resonant column test with the use of the logarithmic decrementmethod in which two acceleration maxims were used to calculate the damping based on Equation (8):
D =δec
√4π2 + δec2
(8)
where δec is the logarithmic decrement calculated as (9):
δec = ln(
un
un + 1
)(9)
where u is the amplitude of acceleration of the n and n + 1 maxims. The damping ratio can be presentedas a dimensionless parameter or as a percentage [40].
Figure 7 presents the normalized shear modulus characteristics versus shear strain γ, and inFigure 8, the damping D characteristic is presented. The shear modulus change had close characteristics.These characteristics could be easily modeled if the G0 modulus value were calculated. We couldobserve that the initial shear modulus also responded to the compaction curve. For samples preparedin moisture content equal to 10.8% (Figure 7c), the initial shear modulus G0 had the highest values. Theimpact of consolidation pressure on the G0 value was clear. With the rise of σ3, the G0 also increased.The top value of shear modulus was equal to 164.08 MPa for σ3 equal to 150 kPa. The lowest value ofG0 was equal to 82.02 MPa for the sample confined with a pressure equal to 30 kPa in moisture contentm = 12.9%.

Appl. Sci. 2020, 10, 2559 10 of 19
Appl. Sci. 2020, 10, x FOR PEER REVIEW 10 of 20
𝛿𝑒𝑐 = 𝑙𝑛 (𝑢𝑛𝑢𝑛+1
) (9)
where u is the amplitude of acceleration of the n and n+1 maxims. The damping ratio can be presented
as a dimensionless parameter or as a percentage [40].
Figure 7 presents the normalized shear modulus characteristics versus shear strain γ, and in
Figure 8, the damping D characteristic is presented. The shear modulus change had close
characteristics. These characteristics could be easily modeled if the G0 modulus value were calculated.
We could observe that the initial shear modulus also responded to the compaction curve. For samples
prepared in moisture content equal to 10.8% (Figure 7c), the initial shear modulus G0 had the highest
values. The impact of consolidation pressure on the G0 value was clear. With the rise of σ3, the G0 also
increased. The top value of shear modulus was equal to 164.08 MPa for σ3 equal to 150 kPa. The lowest
value of G0 was equal to 82.02 MPa for the sample confined with a pressure equal to 30 kPa in
moisture content m = 12.9%.
(a) (b)
Appl. Sci. 2020, 10, x FOR PEER REVIEW 11 of 20
(c) (d)
Figure 7. Modulus reduction curves with the normalized shear modulus G/G0 for different moisture
contents: (a) m = 8.1%, (b) m = 9.4%, (c) m = 10.8%, and (d) m = 12.9%.
The soil samples were prepared in moisture contents equal to 8.1%, 9.4%, 10.8%, and 12.9%,
which corresponded to the Proctor test results. Table 2 presents the soil parameters’ values during
the resonant column test. The compaction caused the preconsolidation state, and therefore, the
overconsolidation ratio (OCR) could be calculated for the resonant column samples. The modeling of
shear modulus degradation could be conducted with the application of the Stokoe et al. [41] modulus
reduction curve (10):
𝐺
𝐺0=
1
1 + (𝛾𝛾𝑡⁄ )
𝛼 (10)
where α is a curvature parameter (usually α ≈ 0.92) and γt is called the pseudo-reference strain
corresponding to G/G0 = 0.5.
Figure 7. Modulus reduction curves with the normalized shear modulus G/G0 for different moisturecontents: (a) m = 8.1%, (b) m = 9.4%, (c) m = 10.8%, and (d) m = 12.9%.
The soil samples were prepared in moisture contents equal to 8.1%, 9.4%, 10.8%, and 12.9%, whichcorresponded to the Proctor test results. Table 2 presents the soil parameters’ values during the resonantcolumn test. The compaction caused the preconsolidation state, and therefore, the overconsolidationratio (OCR) could be calculated for the resonant column samples. The modeling of shear modulusdegradation could be conducted with the application of the Stokoe et al. [41] modulus reductioncurve (10):
GG0
=1
1 +( γγt
)α (10)

Appl. Sci. 2020, 10, 2559 11 of 19
where α is a curvature parameter (usually α ≈ 0.92) and γt is called the pseudo-reference straincorresponding to G/G0 = 0.5.
Appl. Sci. 2020, 10, x FOR PEER REVIEW 12 of 20
(a)
(b)
(c)
(d)
Figure 8. Material damping curve for different moisture m contents: (a) m = 8.1%, (b) m = 9.4%,
(c) m = 10.8%, and (d) m = 12.9%.
Table 2. Physical properties, pressure in chamber, OCR and maximum shear modulus for tested
samples.
Sample
No. e0 Sr σ3 (kPa) OCR G0 (MPa)
1.1 0.53 0.76 30 16.7 87.6
1.2 0.53 0.76 45 11.1 104.9
Figure 8. Material damping curve for different moisture m contents: (a) m = 8.1%, (b) m = 9.4%,(c) m = 10.8%, and (d) m = 12.9%.

Appl. Sci. 2020, 10, 2559 12 of 19
Table 2. Physical properties, pressure in chamber, OCR and maximum shear modulus for tested samples.
Sample No. e0 Sr σ3 (kPa) OCR G0 (MPa)
1.1 0.53 0.76 30 16.7 87.61.2 0.53 0.76 45 11.1 104.91.3 0.53 0.76 60 8.3 122.62.1 0.5 0.81 30 19.0 91.62.2 0.5 0.81 45 9.5 102.72.3 0.5 0.81 60 9.5 112.82.4 0.5 0.81 150 3.8 163.13.1 0.46 0.87 30 20.0 102.03.2 0.46 0.87 45 13.3 113.33.3 0.46 0.87 60 10.0 123.94.1 0.44 0.93 30 20.3 82.04.2 0.44 0.93 45 13.6 98.94.3 0.44 0.93 60 10.2 105.5
For the test results, the modulus reduction curve was fit. For the purpose of accurately modelingthe soil stiffness degradation, the upper and lower limit curves were derived. The soil pseudoreferencestress was estimated from the test results, and based on this, and the curvature parameter was fit to thedata. The value of αwas equal to 1.15 for all test results. The results of the calculations are shown inFigure 9a. The pseudoreference stress could be estimated based on the empirical equation proposed byDarendeli [42] (11):
γt = (ϕ1 + ϕ2·IP·OCRϕ3)·σ′3ϕ4 , (11)
where ϕ1 = 0.0352, ϕ2 = 0.0010, ϕ3 = 0.3246, and ϕ4 = 0.3483. The pseudoreference stress fornon-cohesive soils reduced to the simpler Equation (12):
γt = ϕ1·σ′3ϕ4 , (12)
Appl. Sci. 2020, 10, x FOR PEER REVIEW 13 of 20
1.3 0.53 0.76 60 8.3 122.6
2.1 0.5 0.81 30 19.0 91.6
2.2 0.5 0.81 45 9.5 102.7
2.3 0.5 0.81 60 9.5 112.8
2.4 0.5 0.81 150 3.8 163.1
3.1 0.46 0.87 30 20.0 102.0
3.2 0.46 0.87 45 13.3 113.3
3.3 0.46 0.87 60 10.0 123.9
4.1 0.44 0.93 30 20.3 82.0
4.2 0.44 0.93 45 13.6 98.9
4.3 0.44 0.93 60 10.2 105.5
For the test results, the modulus reduction curve was fit. For the purpose of accurately modeling
the soil stiffness degradation, the upper and lower limit curves were derived. The soil
pseudoreference stress was estimated from the test results, and based on this, and the curvature
parameter was fit to the data. The value of α was equal to 1.15 for all test results. The results of the
calculations are shown in Figure 9a. The pseudoreference stress could be estimated based on the
empirical equation proposed by Darendeli [42] (11):
𝛾𝑡 = (𝜑1 + 𝜑2 ∙ 𝐼𝑃 ∙ 𝑂𝐶𝑅𝜑3) ∙ 𝜎′
3𝜑4 , (11)
where φ1 = 0.0352, φ2 = 0.0010, φ3 = 0.3246, and φ4 = 0.3483. The pseudoreference stress for non-
cohesive soils reduced to the simpler Equation (12):
𝛾𝑡 = 𝜑1 ∙ 𝜎′3𝜑4 , (12)
For the presented power function, we found the value of the constants by regression analysis,
which were equal to φ1 = 0.0565 and φ4 = −0.182 with the coefficient of determination R2 equal to 0.238,
which corresponded to low correlation, although the calculations with the constant curvature
parameter and calculated γt based on Equation (12) showed good correlation with test data (Figure
9b).
(a)
(b)
0
0.1
0.2
0.3
0.4
0.5
0.6
0.7
0.8
0.9
1
0.00001 0.001 0.1
no
rmal
ize
d s
he
ar m
od
ulu
s G
/G0
shear strain γ
α = 1.15γt,u = 0.0360γt,l = 0.0161
0
0.1
0.2
0.3
0.4
0.5
0.6
0.7
0.8
0.9
1
0 0.2 0.4 0.6 0.8 1
G/G
0ca
lcu
late
d
G/G0 test results
α =1.15φ1 = 0.0565φ4 = −0.182
Figure 9. Modeling of the modulus reduction curve: the limit curves for mathematical models (a);pseudoreference stress parameters for the tested sandy silt (b).

Appl. Sci. 2020, 10, 2559 13 of 19
For the presented power function, we found the value of the constants by regression analysis,which were equal to ϕ1 = 0.0565 and ϕ4 = −0.182 with the coefficient of determination R2 equal to0.238, which corresponded to low correlation, although the calculations with the constant curvatureparameter and calculated γt based on Equation (12) showed good correlation with test data (Figure 9b).
Modeling of the damping gave us information about energy dissipation, which could occur evenwhen the soil strain was at a low level. The soil damping could be related to the G/G0 relationship. Wemodified the proposition of Hardin and Drnevich [43] and we was able to approximate the shape ofthe damping characteristic (13):
DDnorm
= 1−GG0
, (13)
This simple relationship between the soil stiffness and damping characteristics was able to calculatethe damping without special effort to perform the damping tests. Dnorm is the normalization dampingparameter. We analyzed the damping characteristics, and based on the test data, we found that for thecompacted sandy silt soil tested in this article, Dnorm did not have a constant value, but changed withthe normalized shear modulus progress. This characteristic can be observed in Figure 10. Based onthese results, the relationship between Dnorm and G/G0 was established as follows (14):
Dnorm = δ1 −δ2
ln(
GG0
) , (14)
where δ1 and δ2 are constants equal to 0.094 and 0.0196, respectively, for this function’s coefficient ofdetermination, R2 was equal to 0.988.
Appl. Sci. 2020, 10, x FOR PEER REVIEW 14 of 20
Figure 9. Modeling of the modulus reduction curve: the limit curves for mathematical models (a);
pseudoreference stress parameters for the tested sandy silt (b).
Modeling of the damping gave us information about energy dissipation, which could occur even
when the soil strain was at a low level. The soil damping could be related to the G/G0 relationship.
We modified the proposition of Hardin and Drnevich [43] and we was able to approximate the shape
of the damping characteristic (13):
𝐷
𝐷𝑛𝑜𝑟𝑚= 1 −
𝐺
𝐺0, (13)
This simple relationship between the soil stiffness and damping characteristics was able to
calculate the damping without special effort to perform the damping tests. Dnorm is the normalization
damping parameter. We analyzed the damping characteristics, and based on the test data, we found
that for the compacted sandy silt soil tested in this article, Dnorm did not have a constant value, but
changed with the normalized shear modulus progress. This characteristic can be observed in Figure
10. Based on these results, the relationship between Dnorm and G/G0 was established as follows (14):
𝐷𝑛𝑜𝑟𝑚 = 𝛿1 −𝛿2
𝑙𝑛 (𝐺𝐺0), (14)
where δ1 and δ2 are constants equal to 0.094 and 0.0196, respectively, for this function’s coefficient of
determination, R2 was equal to 0.988.
Figure 10. Maximum damping ratio characteristics for the sandy silt soil in this study.
3.3. Testing in a Triaxial Apparatus Equipped with Bender Elements for Unsaturated Soils
The unsaturated state of soil usually does not impact the resonant column test since the tests are
shearing ones, so the pore water pressure is rarely measured during the resonant column test [44].
The tests performed in the triaxial apparatus for unsaturated soil led to determining a soil water
characteristic experimental curve (Figure11a). This characteristic experimental curve is presented in
Figure 10. With the use of the Van Genuchten model, it was fit to the test results Equation (1):
𝑆𝑟(𝑠) = (1
1 + (𝛽𝑆𝑟𝑠)𝑛)𝑚
, (15)
where s is the suction and βSr, n, m (m = 1 − 1/n) are constants. For silty sand, the value of βSr was
between 5.61 and 0.09 kPa-1, and the value of m was between 0.73 and 0.11 [45,46]. In this case, the
0
0.1
0.2
0.3
0.4
0.5
0.6
0.7
0.8
0.9
1
0.1 1
no
rmal
izat
ion
dam
pin
g p
aram
ete
r D
no
rm
normalized shear modulus G/G0
fitted curve R2 = 0.988
δ1 = 0.0940δ2 = 0.0196
Figure 10. Maximum damping ratio characteristics for the sandy silt soil in this study.
3.3. Testing in a Triaxial Apparatus Equipped with Bender Elements for Unsaturated Soils
The unsaturated state of soil usually does not impact the resonant column test since the tests areshearing ones, so the pore water pressure is rarely measured during the resonant column test [44].
The tests performed in the triaxial apparatus for unsaturated soil led to determining a soil watercharacteristic experimental curve (Figure 11a). This characteristic experimental curve is presented inFigure 10. With the use of the Van Genuchten model, it was fit to the test results Equation (1):
Sr(s) =(
11 + (βSrs)
n
)m
, (15)

Appl. Sci. 2020, 10, 2559 14 of 19
where s is the suction and βSr, n, m (m = 1 − 1/n) are constants. For silty sand, the value of βSr wasbetween 5.61 and 0.09 kPa−1, and the value of m was between 0.73 and 0.11 [45,46]. In this case,the model parameters were equal to βSr = 0.11, n = 1.29, and m = 0.225. Following the unsaturatedsoil mechanistic approach, the soil sample was consolidated to 100 kPa net stress (σ−uw), and then,to change the saturation degree, the axis-translation technique was used to control the soil suction.During the bender element tests to obtain reliable testing results, a considerably long period of time(a few days to weeks) was applied to achieve the equilibrium condition with respect to applied soilsuction for the tested soil prior to determining the shear modulus G0 values. We performed benderelement tests, which indicated the impact of soil suction on initial shear modulus G0, and therefore, itindicated that we should pay more attention to the degree of saturation when we perform the dynamicsoil response analysis. The results of the test are presented Figure 11b. The shear modulus G0 fromthe bender element tests for Sr equal to 1.0 was 125.3 MPa, while when the suction rose to 200 kPa(Sr = 0.4), G0 was equal to 222.7 MPa.
Appl. Sci. 2020, 10, x FOR PEER REVIEW 15 of 20
mechanistic approach, the soil sample was consolidated to 100 kPa net stress (−uw), and then, to
change the saturation degree, the axis-translation technique was used to control the soil suction.
During the bender element tests to obtain reliable testing results, a considerably long period of time
(a few days to weeks) was applied to achieve the equilibrium condition with respect to applied soil
suction for the tested soil prior to determining the shear modulus G0 values. We performed bender
element tests, which indicated the impact of soil suction on initial shear modulus G0, and therefore,
it indicated that we should pay more attention to the degree of saturation when we perform the
dynamic soil response analysis. The results of the test are presented Figure 11b. The shear modulus
G0 from the bender element tests for Sr equal to 1.0 was 125.3 MPa, while when the suction rose to
200 kPa (Sr = 0.4), G0 was equal to 222.7 MPa.
Since the G0 value would impact the soil stiffness degradation and damping characteristics, the
degree of saturation played an essential role in compacted silty soils. The optimum moisture content,
which corresponded to Sr equal to 0.93–0.94, would cause suction equal to 4 kPa. Higher soil suction
resulted in lower soil density. Soil compacted in optimum moisture content had very low soil suction
in comparison to soil suction at Sr = 0.41, where s was equal to 200 kPa. This suction effect impacted
the soil grain connection and therefore was the reason why soil was stiffer in small strain regimes.
(a)
(b)
Figure 11. Results of the bender element test in the unsaturated triaxial apparatus: post-compaction
suction in terms of the saturation ratio (a); maximum shear modulus in different suction conditions
(b).
3.4. G0 Mathematical Modeling
The presented test results showed that the sandy silt in this study would respond to dynamic
loadings in a manner that is well established in the literature. The mathematical modeling of dynamic
soil response relies on the estimation of G0 value. In this study, we found that the soil's initial shear
modulus was dependent on soil suction. Another factor that impacted the soil’s initial shear modulus
was the pressure in the triaxial cell σ3. In the literature, we can find numerous equations for the
calculation of the G0 modulus [12,13]. The most popular ones for the saturated soil in tests with
uniform stress (σ’m = σ’3) are Equations (16) and (17):
𝐺0 = 625 ∙ (𝑝𝑎 ∙ 𝜎′3)0.5 (0.3 + 0.7𝑒2)⁄ , (16)
0.4
0.5
0.6
0.7
0.8
0.9
1
0 25 50 75 100 125 150 175 200
satu
rati
on
de
gre
e S
r
suction s (kPa)
100
120
140
160
180
200
220
240
0 50 100 150 200
she
ar m
od
ulu
s G
0(M
Pa)
suction s (kPa)
Figure 11. Results of the bender element test in the unsaturated triaxial apparatus: post-compactionsuction in terms of the saturation ratio (a); maximum shear modulus in different suction conditions (b).
Since the G0 value would impact the soil stiffness degradation and damping characteristics, thedegree of saturation played an essential role in compacted silty soils. The optimum moisture content,which corresponded to Sr equal to 0.93–0.94, would cause suction equal to 4 kPa. Higher soil suctionresulted in lower soil density. Soil compacted in optimum moisture content had very low soil suctionin comparison to soil suction at Sr = 0.41, where s was equal to 200 kPa. This suction effect impactedthe soil grain connection and therefore was the reason why soil was stiffer in small strain regimes.
3.4. G0 Mathematical Modeling
The presented test results showed that the sandy silt in this study would respond to dynamicloadings in a manner that is well established in the literature. The mathematical modeling of dynamicsoil response relies on the estimation of G0 value. In this study, we found that the soil’s initial shearmodulus was dependent on soil suction. Another factor that impacted the soil’s initial shear moduluswas the pressure in the triaxial cell σ3. In the literature, we can find numerous equations for the

Appl. Sci. 2020, 10, 2559 15 of 19
calculation of the G0 modulus [12,13]. The most popular ones for the saturated soil in tests withuniform stress (σ′m = σ′3) are Equations (16) and (17):
G0 = 625·(paσ′3)
0.5/(0.3 + 0.7e2
), (16)
G0 = 22·K2, max·(paσ′3)
0.5, (17)
where pa is atmospheric pressure (pa = 100 kPa), e is the void ratio, and K2,max is the constant determinedby the void ratio (K2, max = −44.66· ln(e) + 28.79). The maximum shear modulus is calculated in bothcases in kPa.
The equations that account for the unsaturated state are more complex than the equations forthe saturated state. The equations have to consider the saturation ratio, as well as the soil suction;therefore, the equations are often limited to one or two types of soil. Examples of such equations are asfollows [46,47], Equations (18) and (19):
G0
Gr, sat= A· f (e)
[(p + Sr
κs)pa
]n
, (18)
G0(unsat) = G0(sat)
[1 + ζ
(s
pa/101.3
)(Srξ)]
, (19)
where p is net pressure, ζ and ξ are constants of Equation (19), which relies on the coefficient ofuniformity and soil classification, and κ and n (stiffness coefficient n = 0.2 for silty sand, n = 0.6 forsandy silt in this study) are constants of Equation (18) where κ is a parameter related to the plasticityindex (for silty sand soil κ = 1.75, κ = 5.0 for sandy silt in this study). The f (e) parameter is a void ratiofunction that can be an exponential function (f (e) = e−χ where χ is the exponent parameter, equal to 1.7for silty sand and sandy silt [48]). The Gr,sat parameter is the reference shear modulus, which for siltysand was equal to 7 MPa and 13 MPa for sandy silt in this study. The A parameter is associated withthe soil structure, which was further analyzed, and the correlation with the degree of saturation wasfound as follows (20):
A(Sr) = a(Smax
Sr− 1
)b, (20)
where Smax is the maximum saturation ratio that can be obtained from compaction tests and a, b areconstants (a = 4.55 and b = 0.25 for silty sand and a = 4.0 and b = 0.15 for sandy silt in this study).Additionally, we analyzed the resonant column and bender element tests, and we found that therelationship between the maximum shear modulus and stress state and the void ratio function can bedescribed as (21):
G0 = G0,u0 + 150· f (e)·(σ3 + s), (21)
where G0,u0 is the shear modulus value when Sr = 0 and σ3 = 0 kPa.For Equations (16)–(19) and (21), we evaluated the quality of G0 prognosis with the use of ex-post
methods. In order to do so, we used the test results as a reference. In Table 3, the data concerning thevalue of G0 are presented. We also conducted the ex-post analysis to answer the question of how wellthe models performed if they were used before the tests that evaluated the models’ reliability.
Based on the calculations performed in Table 3, the presented G0 models’ mean absolute percentageerror (MAPE) was between 7.43% and 46.73%, and the mean error (ME), mean percentage error (MPE),mean absolute error (MAE), mean absolute percentage error (MAPE), and Theil index values arepresented in Table 4.

Appl. Sci. 2020, 10, 2559 16 of 19
Table 3. Results of the maximal shear modulus value calculations for the mathematical models.
Sample No. Test Results Model (16) Model (17) Model (18) Model (19) Model (21)
Bender Element test 125.3 149.6 150.9 0.0 0.0 137.0132.2 149.6 150.9 0.0 0.0 143.1138.0 151.7 153.4 203.2 103.5 152.2145.3 151.7 153.4 222.7 97.9 152.2165.1 151.7 153.4 228.8 95.8 152.2184.3 153.8 155.9 251.2 171.1 167.3197.1 153.8 155.9 261.3 316.3 197.6213.1 153.8 155.9 263.8 312.0 197.6222.7 153.8 155.9 271.4 591.8 258.1
1.1 87.6 68.9 68.9 67.2 102.7 100.71.2 104.9 84.4 84.3 82.6 102.7 107.41.3 122.6 97.5 97.4 96.4 102.7 114.02.1 91.6 72.1 72.0 68.7 68.0 98.42.2 102.7 88.3 88.2 84.9 68.0 105.72.3 112.8 101.9 101.8 99.4 68.0 113.02.4 163.1 161.2 161.0 167.2 68.0 156.93.1 102.0 76.4 76.5 71.0 50.6 98.93.2 113.3 93.6 93.7 88.0 50.6 107.33.3 123.9 108.0 108.2 103.0 50.6 115.84.1 82.0 78.6 78.9 55.2 32.3 97.74.2 98.9 96.3 96.6 68.9 32.3 106.74.3 105.5 111.2 111.5 81.0 32.3 115.8
Table 4. Ex-post analysis result for maximum shear modulus models.
Index Model (16) Model (17) Model (18) Model (19) Model (21)
ME 14.83 MPa 14.07 MPa −7.97 MPa 7.95 MPa −2.80 MPaMPE 10.37% 9.92% −0.16% 14.27% 2.44%MAE 20.97 MPa 20.79 MPa 36.11 MPa 68.18 MPa 9.84 MPa
MAPE 14.89% 14.85% 26.60% 46.73% 7.43%I2 0.0371 0.0356 0.0883 0.5243 0.0078I1
2 30.51% 28.72% 3.66% 0.61% 5.18%I2
2 6.77% 5.69% 77.67% 79.24% 0.01%I3
2 62.72% 65.59% 18.67% 20.15% 94.81%
The ME and MPE showed how precise the model was in the modeling of the G0 value. ForModel (21), the lowest error value was obtained. The G0 models for saturated soils also had a lowpercentage of error. The MAE gave information about the absolute error for the calculated value ofthe maximum shear modulus. Finally, we calculated the Theil parameter I2 to estimate the relativeerror of the models’ results. The Theil parameter consists of three categories I1
2, I22, and I3
2. Thefirst parameter describes how close the model is to the empirical data. The second parameter showsinformation about how precise the prognosis is, and the last parameter shows if the direction of thechange was correctly calculated. Models (16), (17), and (21) had low Theil parameters. and in all threecases, the most significant amount of error came from the direction of change. For Models (18) and(19), the issue, in that case, was that the models were less precise and especially in the case of theModel (18), in which the Theil parameter had the same level as for the previous models. Model (19)performed poorly mostly because it did not consider the void ratio impact and relied too much on theempirical constants.
4. Conclusions
In this paper, the results of a wide range of tests were presented to evaluate the behavior ofcompacted sandy silt soil. Knowledge about soil response to dynamic loads is essential for road andearth construction designers. Based on these results, the following conclusions may be presented:

Appl. Sci. 2020, 10, 2559 17 of 19
1. The soil compacted with the Proctor method in this study was tested to find preconsolidationstress. The oedometric test results clearly showed that the preconsolidation stress increased withthe increase of moisture content during the compaction, and higher soil dry density resulted inhigher preconsolidation pressure, which was equal to 450 kPa in optimal moisture content. Thesoil suction in optimum moisture content was equal to 4–5 kPa, which was also favorable duringthe compaction process.
2. The resonant column test revealed a high correlation of shear modulus degradation and dampingcharacteristics with the maximum shear modulus value G0. As presented in this article, modelingof the soil’s reaction to dynamic loading showed that if the information about G0 were provided, thestiffness and damping characteristics could be modeled with the use of commonly known models.
3. The G0 values also rose with the increase of soil compaction. The lowest values of G0 werebetween 82 and 87 MPa (for samples compacted with moisture content other than optimum andin σ′3 equal to 30 kPa). The highest G0 was registered for the sample with optimum moisturecontent (equal to 123.9 MPa in σ′3 equal to 60 kPa), but we also noted the impact of σ′3 on themaximum shear modulus value where for σ′3 equal to 150 kPa, G0 was equal to 163.1 MPa.
4. The bender element suction-controlled unsaturated triaxial test showed the impact of the suctionon G0 where for Sr =0.41 (suction s equal to 200 kPa), G0 was equal to 222.7 MPa (the soil samplewas compacted in optimum moisture content, σ′3 = 100 kPa).
5. Finally, we made the effort in the mathematical modeling of G0 using known equations forsaturated and unsaturated soils. The results of the calculation were then evaluated with the use ofex post methods. W extended the analysis by the equation that was derived from the observationsof soil behavior in this article. We recognized such factors impacting the soil stiffness as suction s,consolidation pressure σ′3, and compaction, which was represented by the void ratio functionf (e). The results of the test showed that the commonly known equation quite closely modelled theG0 value (14.85% to 26.60% mean absolute percentage error) with one exception. The equationpresented by us showed the best performance, but at this stage of development, it was limitedonly to sandy silt-type soils.
On the subject of compacted soil response to dynamic load modeling, much scientific effort hasbeen conducted. The presented relationships proved that they could model the sandy silt soil’s reactionto dynamic excitations accurately (modulus reduction curve, material damping curve) or close enough(G0 equations). Nevertheless, those who use these relationships need the exact value of the parameters,which can only be obtained by the analysis of the test results. Our test results showed that the equationsin the literature had to be treated with respect to the input parameters.
Author Contributions: A.G. conceived of and designed the experiments, performed resonant column tests; Z.S.and M.B. performed the unsaturated triaxial tests; A.G. wrote the paper; W.S. and D.L.P. supervised the researchand edited and audited the content, Z.S. revised the final version. All authors have read and agreed to thepublished version of the manuscript.
Funding: Publication of the article has been financed by the Polish National Agency for Academic Exchangeunder the Foreign Promotion Programme.
Appl. Sci. 2020, 10, x FOR PEER REVIEW 18 of 20
1. The soil compacted with the Proctor method in this study was tested to find preconsolidation
stress. The oedometric test results clearly showed that the preconsolidation stress increased with
the increase of moisture content during the compaction, and higher soil dry density resulted in
higher preconsolidation pressure, which was equal to 450 kPa in optimal moisture content. The
soil suction in optimum moisture content was equal to 4–5 kPa, which was also favorable during
the compaction process.
2. The resonant column test revealed a high correlation of shear modulus degradation and
damping characteristics with the maximum shear modulus value G0. As presented in this article,
modeling of the soil’s reaction to dynamic loading showed that if the information about G0 were
provided, the stiffness and damping characteristics could be modeled with the use of commonly
known models.
3. The G0 values also rose with the increase of soil compaction. The lowest values of G0 were
between 82 and 87 MPa (for samples compacted with moisture content other than optimum and
in σ’3 equal to 30 kPa). The highest G0 was registered for the sample with optimum moisture
content (equal to 123.9 MPa in σ’3 equal to 60 kPa), but we also noted the impact of σ’3 on the
maximum shear modulus value where for σ’3 equal to 150 kPa, G0 was equal to 163.1 MPa.
4. The bender element suction-controlled unsaturated triaxial test showed the impact of the suction
on G0 where for Sr =0.41 (suction s equal to 200 kPa), G0 was equal to 222.7 MPa (the soil sample
was compacted in optimum moisture content, σ’3 = 100 kPa).
5. Finally, we made the effort in the mathematical modeling of G0 using known equations for
saturated and unsaturated soils. The results of the calculation were then evaluated with the use
of ex post methods. W extended the analysis by the equation that was derived from the
observations of soil behavior in this article. We recognized such factors impacting the soil
stiffness as suction s, consolidation pressure σ’3, and compaction, which was represented by the
void ratio function f(e). The results of the test showed that the commonly known equation quite
closely modelled the G0 value (14.85% to 26.60% mean absolute percentage error) with one
exception. The equation presented by us showed the best performance, but at this stage of
development, it was limited only to sandy silt-type soils.
On the subject of compacted soil response to dynamic load modeling, much scientific effort has
been conducted. The presented relationships proved that they could model the sandy silt soil’s
reaction to dynamic excitations accurately (modulus reduction curve, material damping curve) or
close enough (G0 equations). Nevertheless, those who use these relationships need the exact value of
the parameters, which can only be obtained by the analysis of the test results. Our test results showed
that the equations in the literature had to be treated with respect to the input parameters.
Author Contributions: A.G. conceived of and designed the experiments, performed resonant column tests; Z.S.
and M.B. performed the unsaturated triaxial tests; A.G. wrote the paper; W.S. and D.L.P. supervised the research
and edited and audited the content, Z.S. revised the final version.
Funding: The APC was funded by the Polish National Agency For Academic Exchange, SGGW-IDEA, Grant
Number PPI/PZA/2019/1/001235/DEC/01
Acknowledgments: The authors would like to thank Ing. Ph.D. Stefano Stacul from University of Pisa for his
help in execution of resonant column tests.
Conflicts of Interest: The authors declare no conflict of interest.
References
1. Clayton, C.R.I. Stiffness at small strain: Research and practice. Géotechnique 2011, 61, 5–37.
Acknowledgments: The authors would like to thank Ing. Ph.D. Stefano Stacul from University of Pisa for hishelp in execution of resonant column tests.
Conflicts of Interest: The authors declare no conflict of interest.

Appl. Sci. 2020, 10, 2559 18 of 19
References
1. Clayton, C.R.I. Stiffness at small strain: Research and practice. Géotechnique 2011, 61, 5–37. [CrossRef]2. Likitlersuang, S.; Teachavorasinskun, S.; Surarak, C.; Oh, E.; Balasubramaniam, A. Small strain stiffness and
stiffness degradation curve of Bangkok clays. Soils Found. 2013, 53, 498–509. [CrossRef]3. Yang, J.; Gu, X.Q. Shear stiffness of granular material at small strains: Does it depend on grain size?
Géotechnique 2013, 63, 165–179. [CrossRef]4. Squeglia, N.; Cosanti, B.; Presti, D.L. Importance of full scale tests for the design of levees. Ital. Geotech. J. Riv.
Ital. Geotec. 2016, 50, 43–54.5. Dong, Y.; Lu, N.; McCartney, J.S. Unified model for small-strain shear modulus of variably saturated soil. J.
Geotech. Geoenviron. Eng. 2016, 142, 04016039. [CrossRef]6. Burland, J.B.; Burbidge, M.C. Settlement of Foundations on Sand and Gravel; Glasgow and West of Scotland
Association Centenart Lecture; The Institution of Civil Engineers: Glasgow, Scotland, 1984.7. Lo Presti, D.C.; Pallara, O.; Lancellotta, R.; Armandi, A.; Maniscalco, R. Monotonic and Cyclic Loading
Behavior of Two Sands at Small Strains. Geotech. Test. J. 1993, 16, 409–424.8. Papakyriakopoulos, P.K.; Felekos, S.G.; Savidis, S.A. Dynamic soil properties of silt by the resonant column
and the cyclic simple shear method. In Proceedings of the International Conference on Earthquake ResistantConstruction and Design, Berlin, Germany, 13–16 June 1989; pp. 191–200.
9. Seed, H.B.; Idriss, I.M. Soil Moduli and Damping Factors for Dynamic Response Analyses; Report EERC 70-10;Earthquake Engineering Research Center, University of California: Berkeley, CA, USA, 1970.
10. Borden, R.H.; Shao, L.; Gupta, A. Dynamic properties of Piedmont residual soils. J. Geotech. Eng. 1996, 122,813–821. [CrossRef]
11. Schneider, J.A.; Hoyos, L., Jr.; Mayne, P.W.; Macari, E.J.; Rix, G.J. Field and Laboratory Measurements of Dynamicshear Modulus of Piedmont Residual soils, Behavioral Characteristics of Residual Soils, GSP 92; ASCE: Reston, VA,USA, 1999; pp. 12–25.
12. Drnevich, V.P.; Richart, F.E. Dynamic prestraining of dry sands. J. Soil Mech. Found. Div. Proc. Am. Soc. Civ.Eng. 1970, 96, 451–469.
13. Hardin, B.O.; Richart, F.E. Elastic wave velocities in granular soils. J. Soil Mech. Found. Div. 1963, 89, 33–65.14. Hardin, B.O.; Black, W.L. Vibration modulus of normally consolidated clay: Design equations and curves. J.
Soil Mech. Found. Eng. Div. 1968, 94, 353–369.15. Kokusho, T. Cyclic triaxial test on dynamic soil properties for wide strain range. Soils Found. JSSMFE 1980,
20, 45–60. [CrossRef]16. Hassanipour, A.; Shafiee, A.; Jafari, M.K. Low-amplitude dynamic properties for compacted sand-clay
mixtures. Int. J. Civ. Eng. 2011, 9, 255–264.17. Bobby, O.H.; Kalinski, M.E. Estimating the shear modulus of gravelly soils. J. Geotech. Geoenviron. Eng. 2005,
131, 867–875.18. Zhou, Y.G.; Chen, Y.M. Influence of seismic cyclic loading history on small strain shear modulus of saturated
sands. Soil Dyn. Earthq. Eng. 2005, 25, 341–353. [CrossRef]19. Salgado, R.; Bandini, P.; Karim, A. Shear Strength and Stiffness of Silty Sand. J. Geotech. Geoenviron. Eng.
2000, 126, 451–462. [CrossRef]20. Lo Presti, D.C.; Lai, C.G.; Puci, I. ONDA: Computer code for nonlinear seismic response analyses of soil
deposits. J. Geotech. Geoenviron. Eng. 2006, 132, 223–236. [CrossRef]21. Upreti, K.; Leong, E.C. Effect of mean grain size on shear modulus degradation and damping ratio curves of
sands. Géotechnique 2019, 1–11. [CrossRef]22. Wichtmann, T.; Triantafyllidis, T. Effect of uniformity coefficient on G/Gmax and damping ratio of uniform
to well-graded quartz sands. J. Geotech. Geoenviron. Eng. 2012, 139, 59–72. [CrossRef]23. Lu, N.; Kaya, M. Power law for elastic moduli of unsaturated soil. J. Geotech. Geoenviron. Eng. 2014, 140,
46–56. [CrossRef]24. Salour, F.; Erlingsson, S. Resilient modulus modelling of unsaturated subgrade soils: Laboratory investigation
of silty sand subgrade. Road Mater. Pavement Des. 2015, 16, 553–568. [CrossRef]25. Ng, C.W.W.; Zhou, C. Cyclic behaviour of an unsaturated silt at various suctions and temperatures.
Géotechnique 2014, 64, 709–720. [CrossRef]

Appl. Sci. 2020, 10, 2559 19 of 19
26. Han, Z.; Vanapalli, S.K. State-of-the-Art: Prediction of resilient modulus of unsaturated subgrade soils. Int. J.Geomech. 2016, 16, 04015104. [CrossRef]
27. Han, Z.; Vanapalli, S.K. Model for predicting resilient modulus of unsaturated subgrade soil using soil-watercharacteristic curve. Can. Geotech. J. 2015, 52, 1605–1619. [CrossRef]
28. Kim, D.S.; Stoke, K.H.; Hudson, W.R. Deformational Characteristics of Soils at Small to Intermediate Strains FromCyclic Tests; Research Report 1177-3; Texas Department of Transportation: Austin, TX, USA, 1991.
29. Dai, S.; Yan, Q. Pavement evaluation using ground penetrating radar. In Proceedings of the PavementMaterials, Structures, and Performance, Geo-Schanghai, Shanghai, China, 26–28 May 2014; pp. 222–230.
30. Adu–Osei, A.; Little, D.N.; Lytton, R.L. Cross-anisotropic characterisation of unbound granular materials.Transp. Res. Record J. Transp. Res. Board 2001, 1757, 82–91. [CrossRef]
31. Lekarp, F.; Isacsson, U.; Dawson, A. State of the Art. I: Resilient Response of Unbound Aggregates. J. Transp.Eng. 2000, 126, 66–75. [CrossRef]
32. Araya, A.A.; Huurman, M.; Molenaar, A.A.A.; Houben, L.J.M. Investigation of the resilient behaviour ofgranular base materials with simple test apparatus. Mater. Struct. 2012, 45, 695–705. [CrossRef]
33. Sas, W.; Głuchowski, A.; Gabrys, K.; Soból, E.; Szymanski, A. Deformation Behavior of Recycled ConcreteAggregate during Cyclic and Dynamic Loading Laboratory Tests. Materials 2016, 9, 780. [CrossRef] [PubMed]
34. Becker, D.E.; Crooks, J.H.A.; Been, K.; Jefferies, M.G. Work as a Criterion for Determining in Situ and YieldStresses in Clays. Can. Geotech. J. 1987, 24, 549–564. [CrossRef]
35. D'Appolonia, D.J.; D'Appolonia, E.E.; Brissette, R.F. Settlement of spread footings on sand. J. Soil Mech.Found. Div. 1968, 94, 735–760.
36. Lambrechts, J.R.; Leonards, G.A. Effects of stress history on deformation of sand. J. Geotech. Eng. Div. 1978,104, 1371–1387.
37. Leonards, G.A. Discussion of Theme Lecture 2: ‘New developments in field and laboratory testing of soils’,by Jamiolkowski et al. (In situ tests). Proc. Int. Conf. Soil Mech. Found. Eng. 1985, 5, 2659.
38. Carrier, D.W. Compressibility of a compacted sand. J. Geotech. Geoenviron. Eng. 2000, 126, 273–275. [CrossRef]39. Leonards, G.A.; Frost, J.D. Settlement of shallow foundations on granular soils. J. Geotech. Eng. 1988, 114,
791–809. [CrossRef]40. Jia, J. Soil Dynamics and Foundation Modeling; Springer: Berlin/Heidelberg, Germany, 2018.41. Stokoe, I.I.; Darendeli, K.H.; Andrus, M.B.; Brown, R.D. Dynamic soil properties: Laboratory, field and
correlation studies. In Proceedings of the 2nd International Conference on Earthquake GeotechnicalEngineering, Lisbon, Portugal, 21–25 June 1999; Volume 3, pp. 811–845.
42. Darendeli, M.B. Development of a New Family of Normalized Modulus Reduction and Material DampingCurves. Ph.D. Thesis, Department of Civil Engineering, University of Texas, Austin, TX, USA, 2001.
43. Hardin, B.O.; Drnevich, V.P. Shear modulus and damping in soils: Design equations and curves. J. Soil Mech.Found. Div. 1972, 98, 667–692.
44. Briaud, J.L. Geotechnical Engineering: Unsaturated and Saturated Soils; John Wiley & Sons: Hoboken, NJ,USA, 2013.
45. Van Genuchten, M.T. A closed-form equation for predicting the hydraulic conductivity of unsaturated soils.Soil Sci. Soc. Am. J. 1980, 44, 892–898. [CrossRef]
46. Ghanbarian-Alavijeh, B.; Liaghat, A.; Huang, G.H.; Van Genuchten, M.T. Estimation of the van Genuchtensoil water retention properties from soil textural data. Pedosphere 2010, 20, 456–465. [CrossRef]
47. Heitor, A.; Indraratna, B.; Rujikiatkamjorn, C. Laboratory study of small-strain behavior of a compacted siltysand. Can. Geotech. J. 2013, 50, 179–188. [CrossRef]
48. Lo Presti, D.C.F. Measurement of the Shear Deformation of Geomaterials Inlaboratory: General Report; Pre-failuredeformation of geomaterials; Shibuya, M.M., Ed.; Balkema: Rotterdam, The Netherlands, 1995; Volume 2,pp. 1067–1088.
© 2020 by the authors. Licensee MDPI, Basel, Switzerland. This article is an open accessarticle distributed under the terms and conditions of the Creative Commons Attribution(CC BY) license (http://creativecommons.org/licenses/by/4.0/).