labor union communication: effects of labor media …
TRANSCRIPT
LABOR UNION COMMUNICATION:
EFFECTS OF LABOR MEDIA ON LOCAL UNION VOTE CHOICE
A Dissertation
presented to
the Dissertation Faculty Committee of Anji L Phillips
at the University of Missouri
In Partial Fulfillment
Of the Requirements for the Degree
Doctor of Philosophy
by
ANJI L. PHILLIPS
DR. JENNIFER STEVENS AUBREY & DR. MITCHELL S. MCKINNEY,
CO-DISSERTATION ADVISORS
DECEMBER 18, 2015

© Copyright by Anji L. Phillips 2015
All Rights Reserved

The undersigned, appointed by the dean of the Graduate School, have examined the dissertation entitled
LABOR UNION COMMUNICATION: EFFECTS OF LABOR MEDIA ON LOCAL UNION VOTE CHOICE
presented by Anji L. Phillips,
a candidate for the degree doctor of philosophy,
and hereby certify that, in their opinion, it is worthy of acceptance.
Dr. Jennifer Stevens Aubrey
Dr. Mitchell S. McKinney
Dr. J. Brian Houston
Dr. Glenn Leshner

I dedicate this work to my late G-Ma Rita (Kearney) Rigg, and my late mother-in-law,
Ruth (Sanders) Phillips. The former, because of her unfailing belief in me to succeed,
and the latter, because of her unfailing belief in her son to succeed.

ii
ACKNOWLEDGEMENTS
There are many people who have made the completion of this journey possible. I
thank each and every one of you who encouraged and discouraged me along the way. I
am stubborn that way, and I am grateful for the motivation.
To begin, my committee, without whom, this dissertation would not have been
possible. In particular, I would like to thank Dr. Jennifer Stevens Aubrey, Dr. Mitchell S.
McKinney, Dr. J. Brian Houston, and Dr. Glenn Leshner. Each of you challenged me to
be a better researcher, and a better writer. Graduate students often lament the dysfunction
of their committee. I am not one of those people. Thank you for showing me collegiality
in action. In particular, thank you Dr. Aubrey and Dr. Leshner for sticking with me
beyond your time in Missouri. Your willingness to see this project to the end is
appreciated. It was great getting the band back together one last time.
I would also like to thank the many professors that have influenced me both as a
teacher and a researcher. In particular, thanks to Dr. Jennifer Stevens Aubrey, Dr.
William L. Benoit, and Dr. William R. Cupach for guiding me in my understanding of
and passion for quantitative research. Additionally, thanks to Dr. Aubrey for being a
great mentor, and providing a solid foundation for teaching and researching Mass
Communication; Dr. Benoit for the first-hand opportunities to conduct research with the
benefit of a grant; and Dr. Cupach for inspiring my love for research. Thanks to Dr.
Mitchell S. McKinney and Dr. John R. Petrocik for lively discussion in a well organized
classroom, research, and passion for politics. Also, thanks to the professors that have
influenced me greatly as a teacher: Dr. Joseph R. Blaney, Dr. Bob Jacobs, Dr. Edward L.
Lamoureux, Dr. Michael J. Porter, Dr. Cheri J. Simonds, and Dr. Paul F. Gullifor who

iii
has been a mentor and a cheerleader since the beginning. I have sincere gratitude for
each one of you who believed I had more to contribute to this world. Thank you is not
enough, but thank you.
Next, I need to thank Neal Bowling, Monique Gerard, my Aunt Jeanie Hanna, my
parents Tom Rigg and Darla Rigg, my brother-in-law Joe Shreve, Suzy Shirley, the entire
facilities department at Bradley University, and my husband Joel Phillips for helping me
convince people to take my survey. Your efforts made a huge difference. To every
person who participated, shared, and/or encouraged others to participate in my survey,
thank you. I am grateful for your time. Your generosity is a large part of why this
project was successful.
I would also like to extend special thanks to my fellow graduate students at
Missouri. Class discussion and the process of being a graduate student were better for
your contribution— Bekah, Corey, Emily, Jayne, Jeff, Jenny, Jess, Kathy, Lauren, Leslie,
Mark, Megan, Rebecca, Sacheen, Scott, Siobhan, and Wanjiru. Also, my Friday lunch
crew for moral support to the end—Jamie Glenzinski, Deb Perry, and Martha Schmitt.
Extra thanks to Dr. Bekah (Watson) Gaidis for taking care of Tristan so I could attend
class, Tanya Melendez for a quiet place to study, and to Martha, my friend, for every
single conversation and hug.
To my besties for all things good and wonderful about friendship. Ham-n-Cheese
(Jennifer Hammontree-Jones), my oldest friend; H (Heather Kusler, M.S.), my friend
from a friend; and Jess (Dr. Jessica Wilson Kratzer), my grad school friend who along
with Matt Kratzer took me in, and kept me off the streets. Seriously, the cards, the

iv
letters, the cake, the care packages, the tears, the laughter, your intelligence, and your
kindness make the world a better place.
I would also like to thank my family. I would not be where I am today without
you in this journey. To my parents, Tom Rigg and Darla Rigg, for providing the
wonderful opportunity to go to college in the first place, and to Mom for helping with the
kiddos so I could work on this project. My Aunt Susie (Rigg) Alexander for helping Joel
and I trade Tristan back and forth so I could finish coursework. My sister Christy (Rigg)
Nelson for every piece of advice and encouragement along the way. My sister-in-law,
Susan (Phillips) Shreve for food and shelter for Joel and the boys on numerous weekends.
My late G-Ma Rita (Kearney) Rigg, and my late mother-in-law, Ruth (Sanders) Phillips
for providing encouragement, love, and inspiration until the end. Thank you for always
believing in me.
Finally, to my boys: my stepson, Mitchell, for being an excellent big brother. To
Tristan Fox and Aedan Fionn who have had to sacrifice so much for Mama to finish
school. Everyone will tell you that having children in graduate school is difficult. Yes,
yes it is. However, I would not change a single part of this journey. The downside for
you boys is that you will never have an excuse to quit. Ever. I encourage you to live
your potential, and do your best despite the difficulty of the journey. Above all, be kind,
and never lose sight of your dreams. To my best friend, Joely, we did it…we finally
made it to the end. Thank you for believing in me every step of the way. I love you all.
Peace, Love, and Blessings, Anji (Mama)

v
TABLE OF CONTENTS
ACKNOWLEDGEMENTS ................................................................................................ ii!
LIST OF TABLES ............................................................................................................. ix!
LIST OF FIGURES .......................................................................................................... xii!
ABSTRACT ..................................................................................................................... xiii!
CHAPTER ONE: INTRODUCTION ................................................................................. 1!
Right-To-Work and Anti-Union Legislation .................................................................. 4!The Rise of Anti-Union Legislation ............................................................................... 7!The Impact of Right-to-Work Legislation .................................................................... 11!The Response of the National Labor Relations Board .................................................. 12!The Decline of Union Membership .............................................................................. 13!Labor Union Communication and Vote Choice ........................................................... 14!Theoretical Perspectives ............................................................................................... 16!
Framing Theory ........................................................................................................ 16!Current Gaps in Literature ............................................................................................ 18!
CHAPTER TWO: REVIEW OF LITERATURE ............................................................. 21!
Traditional Labor Union Influence in Elections ........................................................... 22!Vote Choice and Political Knowledge ...................................................................... 22!Presidential Elections ................................................................................................ 26!Voting Importance, Registration, and Turnout ......................................................... 28!Demographic Influence ............................................................................................. 31!
Modern Labor Union Influence in Elections ................................................................ 33!Theoretical Framework ................................................................................................. 34!
Framing ..................................................................................................................... 34!Channel Repertoire ................................................................................................... 40!Trust in News Media ................................................................................................. 42!
The Present Study ......................................................................................................... 44!Framing ..................................................................................................................... 44!Trust in News and Labor Media ............................................................................... 46!Labor Union Membership ......................................................................................... 47!

vi
Labor Union Communication ................................................................................... 49!CHAPTER THREE: METHOD ....................................................................................... 50!
Participants ................................................................................................................ 50!Design and Procedures .............................................................................................. 53!Measures ................................................................................................................... 55!
CHAPTER FOUR: RESULTS ......................................................................................... 73!
Framing ..................................................................................................................... 73!H1a: Union members’ exposure to labor union media will positively predict a favorable evaluation of the union-endorsed candidate. ............................................ 73!H1b: Union members’ exposure to labor union media will negatively predict a favorable evaluation of the non-union-endorsed Republican candidate. .................. 74!H2: Union members’ exposure to labor union media will negatively predict a favorable evaluation of right-to-work and anti-union laws. ..................................... 75!H3a: Exposure to labor union media will positively predict awareness of labor union’s endorsements. ............................................................................................... 76!H3b: Awareness of union’s endorsements will positively predict a favorable evaluation of the union-endorsed candidate. ............................................................ 77!H3c: Awareness of union’s endorsements will negatively predict a favorable evaluation of the non-union-endorsed Republican candidate. .................................. 78!H3d: Awareness of union’s endorsements will negatively predict a favorable evaluation of right-to-work and anti-union laws. ..................................................... 79!Channel Repertoire ................................................................................................... 80!RQ1: What is the most used medium of news for labor union members? ............... 80!RQ2: Will the relationship between labor union media exposure on candidate evaluation differ according to whether participants get their labor news mostly from traditional labor media (e.g., labor newspapers), or mostly from new labor media (e.g., social media labor channels on Facebook and Twitter) sources? .................... 81!Media Trust ............................................................................................................... 82!RQ3: What is the most trusted medium of news for labor union members? ........... 82!H4a: Trust in labor union media will positively predict a favorable evaluation of the union-endorsed candidate. ........................................................................................ 83!H4b: Trust in labor union media will negatively predict a favorable evaluation of the non-union-endorsed Republican candidate. .............................................................. 84!RQ4: The relationship between labor union media exposure and a positive evaluation of the labor-endorsed candidate will be moderated by trust in labor union media, such that the relationship will be strongest among those who are most trusting of labor union media. ................................................................................... 85!

vii
Labor Union Involvement ......................................................................................... 86!RQ5: Will the relationship between labor union media exposure and positive evaluations of union-endorsed candidates be strongest among those who are closely involved in their union (i.e., union members who participate in the labor union through a variety of labor-sponsored activities)? ...................................................... 86!
CHAPTER FIVE: DISCUSSION ..................................................................................... 88!
Framing ..................................................................................................................... 88!H1a: Union members’ exposure to labor union media will positively predict a favorable evaluation of the union-endorsed candidate. ............................................ 88!H1b: Union members’ exposure to labor union media will negatively predict a favorable evaluation of the non-union-endorsed Republican candidate. .................. 89!H2: Union members’ exposure to labor union media will negatively predict a favorable evaluation of right-to-work and anti-union laws. ..................................... 90!H3a: Exposure to labor union media will positively predict awareness of labor union’s endorsements. ............................................................................................... 91!H3b: Awareness of union’s endorsements will positively predict a favorable evaluation of the union-endorsed candidate. ............................................................ 92!H3c: Awareness of union’s endorsements will negatively predict a favorable evaluation of the non-union-endorsed Republican candidate. .................................. 92!H3d: Awareness of union’s endorsements will negatively predict a favorable evaluation of right-to-work and anti-union laws. ..................................................... 93!Channel Repertoire ................................................................................................... 93!RQ1: What is the most used medium of news for labor union members? ............... 93!RQ2: Will the relationship between labor union media exposure on candidate evaluation differ according to whether participants get their labor news mostly from traditional labor media (e.g., labor newspapers), or mostly from new labor media (e.g., social media labor channels on Facebook and Twitter) sources? .................... 98!Media Trust ............................................................................................................... 99!RQ3: What is the most trusted medium of news for labor union members? ........... 99!H4a: Trust in labor union media will positively predict a favorable evaluation of the union-endorsed candidate. ...................................................................................... 103!H4b: Trust in labor union media will negatively predict a favorable evaluation of the non-union-endorsed Republican candidate. ............................................................ 105!RQ4: The relationship between labor union media exposure and a positive evaluation of the labor-endorsed candidate will be moderated by trust in labor union media, such that the relationship will be strongest among those who are most trusting of labor union media. ................................................................................. 106!Labor Union Involvement ....................................................................................... 107!
viii
RQ5: Will the relationship between labor union media exposure and positive evaluations of union-endorsed candidates be strongest among those who are closely involved in their union (i.e., union members who participate in the labor union through a variety of labor-sponsored activities)? .................................................... 107!Theoretical Implications ......................................................................................... 108!Limitations .............................................................................................................. 111!Future Directions .................................................................................................... 112!Conclusion .............................................................................................................. 115!
REFERENCES ............................................................................................................... 119!
TABLES ......................................................................................................................... 139!
FIGURES ........................................................................................................................ 167!
APPENDIX ..................................................................................................................... 170!
VITA ............................................................................................................................... 190!

ix
LIST OF TABLES
Table Page
1.! Descriptive Statistics for Gender, Race, Education, and Individual Income ............ 139!
2.! Descriptive Statistics for Age and Length of Time in a Labor Union ...................... 140!
3.! Descriptive Statistics for Labor Union Membership Status ..................................... 140!
4.! Descriptive Statistics for Awareness of Union Endorsement, Awareness, and Vote
Choice ....................................................................................................................... 141!
5.! Descriptive Statistics for Party Identification and Political Ideology ....................... 142!
6.! Descriptive Statistics for Labor Union Membership ................................................ 143!
7.! Descriptive Statistics for Labor Union Job Titles ..................................................... 144!
8.! Descriptive Statistics for Labor Union City Located in Illinois ............................... 147!
9.! Descriptive Statistics for Key Independent Variables .............................................. 148!
10.!Descriptive Statistics for Channels including Newspaper, Radio, Television, and
Internet (N = 201) ..................................................................................................... 149!
11.!Descriptive Statistics for Channels including Newspaper Trust, Radio Trust,
Television Trust, and Internet Trust .......................................................................... 151!
12.!Descriptive Statistics for Variables Union Involvement and Religiosity ................. 153!
13.!H1a Correlation Coefficient for Evaluation of Union-Endorsed Candidate and
Predictor Variables .................................................................................................... 154!
14.!H1a Hierarchical Multiple Regression Analysis Summary for Exposure to Labor
Union Media Positively Predicting a Favorable Evaluation of Union-Endorsed
Candidate .................................................................................................................. 154!

x
15.!H1b Correlation Coefficient for Evaluation of Non Union-Endorsed Republican
Candidate and Predictor Variables ............................................................................ 155!
16.!H1b Hierarchical Multiple Regression Analysis Summary for Exposure to Labor
Union Media Positively Predicting a Negative Evaluation of Non Union-Endorsed
Republican Candidate ............................................................................................... 155!
17.!H2 Correlation Coefficient for Right-to-Work (RTW) and Anti-Union (AU) Laws
and Predictor Variable .............................................................................................. 156!
18.!H2 Hierarchical Multiple Regression Analysis Summary for Exposure to Labor
Union Media Negatively Predicting a Favorable Evaluation of Right-to-Work Anti-
Union Laws ............................................................................................................... 156!
19.!H3a Hierarchical Logistic Regression Analysis Summary for Exposure to Labor
Union Media Positively Predicting Awareness of Union’s Endorsements .............. 157!
20.!H3b Correlation Coefficient for a Favorable Evaluation of the Union-Endorsed
Candidate and Predictor Variable ............................................................................. 158!
21.!H3b Hierarchical Multiple Regression Analysis Summary for Awareness of Union’s
Endorsement Positively Predicting a Favorable Evaluation of the Union-Endorsed
Candidate .................................................................................................................. 158!
22.!H3c Correlation Coefficient for a Negative Evaluation of the Non-Union-Endorsed
Republican Candidate and Predictor Variable .......................................................... 159!
23.!H3c Hierarchical Multiple Regression Analysis Summary for Awareness of Union’s
Endorsement Negatively Predicting a Favorable Evaluation of the Non-Union-
Endorsed Republican Candidate ............................................................................... 159!

xi
24.!H3d Correlation Coefficient for a Favorable Evaluation Right-to-Work (RTW) and
Anti-Union (AU) Laws and Predictor Variable ........................................................ 160!
25.!H3d Hierarchical Multiple Regression Analysis Summary for Awareness of Union’s
Endorsement Negatively Predicting a Favorable Evaluation of Right-to-Work and
Anti-Union Laws ...................................................................................................... 160!
26.!RQ2 Moderation Analysis Summary for Total Effect of Exposure to Labor Union
Media Predicting Evaluation of the Gubernatorial Candidates (i.e., Rauner, Quinn,
and Grimm) via Traditional versus New Labor Media ............................................. 161!
27.!H4a Correlation Coefficient for Evaluation of Union-Endorsed Candidate and
Predictor Variables .................................................................................................... 163!
28.!H4a Hierarchical Multiple Regression Analysis Summary for Trust in Labor Union
Media Positively Predicting a Favorable Evaluation of Union-Endorsed Candidate 163!
29.!H4b Correlation Coefficient for Evaluation of Non-Union-Endorsed Republican
Candidate and Predictor Variables ............................................................................ 164!
30.!H4a Hierarchical Multiple Regression Analysis Summary for Trust in Labor Union
Media Positively Predicting a Favorable Evaluation of Non-Union-Endorsed
Republican Candidate ............................................................................................... 164!
31.!RQ4 Moderation Analysis Summary for Total Effect of Exposure to Labor Union
Media Predicting Evaluation of Union-Endorsed Candidate via Trust in Labor Union
Media ........................................................................................................................ 165!
32.!RQ5 Moderation Analysis Summary for Total Effect of Exposure to Labor Union
Media Predicting Evaluation of Union-Endorsed Candidate via Close Involvement in
Labor Union .............................................................................................................. 166

xii
LIST OF FIGURES
Figure Page
1.! RQ1 Means of Most Used Mediums ........................................................................ 167!
2.! RQ3 Means of Most Trusted Mediums .................................................................... 167!
3.! RQ1 Means of Top 1-10 Most Used Channels ......................................................... 168!
4.! RQ1 Means of Top 11-20 Most Used Channels ....................................................... 168!
5.! RQ3 Means of Top 1-10 Most Trusted Channels ..................................................... 169!
6.! RQ3 Means of Top 11-20 Most Trusted Channels ................................................... 169!

xiii
ABSTRACT
Framing theory posits the idea that media frames a particular issue, and provides a
focus or precedence of that frame to the exclusion of other information. Framing of a
candidate or issue may lead voters to have a particular point of view about a candidate or
issue based on their media diet (i.e., channel repertoire). The present study investigated
the effects of exposure to labor union media on labor union members’ evaluation of the
gubernatorial candidates in the 2014 State of Illinois election. The author conducted a
cross-sectional survey of 201 active and retired labor union members in the State of
Illinois recruited from a nonrandom, purposive, network sample. Gender, race, income,
party identification, party ideology, and religiosity were all controlled. Results indicated
exposure to labor union media, and awareness of the labor union endorsement, but not
trust in labor media, predicted a negative evaluation of the Republican candidate (Bruce
Rauner). Trust in labor union, but not exposure to labor union media, nor awareness of
the labor union endorsement, predicted a favorable evaluation of the union-endorsed
Democratic candidate (Pat Quinn). Awareness of the labor union endorsement, but not
exposure to labor media, predicted a negative evaluation of right-to-work and anti-union
laws. Channel repertoire indicated television, followed by newspapers (most trusted
medium), radio, and the Internet were most used for political information, but the
national labor union website garnered the most trust as a channel.

1
CHAPTER ONE: INTRODUCTION
Labor unions in the State of Illinois are bracing themselves for change based on
the results of the November 4, 2014 gubernatorial election. Democratic incumbent, Pat
Quinn, faced Republican nominee, Bruce Rauner, a multimillionaire, and venture
capitalist business executive for governor, with Quinn losing 46 to 51 percent (Pearson,
Garcia, Long, Secter, 2014). In Peoria, Illinois-based Caterpillar CEO Doug Oberhelman
endorsed Rauner for governor (Nightengale, 2013). Union leaders feared Rauner “will
try to be the next Mitch Daniels, the former Republican governor of Indiana who ended
collective bargaining for state workers by executive order, or a knockoff of Gov. Scott
Walker, the Wisconsin Republican who led efforts to cut collective bargaining rights for
most public employees in his state” (Davey, 2014, para. 2). Labor union management
worried about Quinn’s popularity problem with Democrats in general, and labor union
members in particular. Quinn proposed cuts to union retiree benefits as one measure to
try to balance the state’s budget due in part to the State’s pension debt (Bland, 2014).
Labor management tried to convince labor members that voting for the unpopular
incumbent Quinn would be better for labor than the management-supported member of
the “0.01 percent” Rauner (Davey, 2014, para. 10). Conventional wisdom of low voter
turnout in non-presidential election years also added fuel for labor leaders’ worry about
the midterm election (Kaufman, Petrocik, & Shaw, 2008, p. 149).
In order to understand why labor union advocates were worried about the results
of the gubernatorial election in Illinois, it is important to consider the recent changes in
state policies across the country that conservative groups have advocated, and Republican
governors have enacted, since 2011. In short, labor union members cannot simply rely

2
on being a member of a union to collect dues, maintain collective bargaining, and keep
established benefits. Labor unions are now in a period where they have to justify their
existence and the value they provide to members who pay union dues. Labor union
management also has to increase resources spent to ward off reduced wage and benefit
changes through legislation as part of a broad conservative plan to reduce union
influence, while also experiencing decreased resources due to fewer union members in
general. Ultimately, labor union leaders were justifiably worried about convincing labor
union members to vote for the labor union supported candidate.
Recent elections around the country have featured candidates with a platform of
economic reform who have become increasingly hostile to labor. The challenge for local
labor advocates is how they should communicate their message of union-friendly and
unfriendly candidates to union members-at-large? How should they communicate to
union members about issues that affect labor union members specifically? How should
they motivate their base to vote for the union-supported candidates when efforts in other
states have failed? The increased rise and impact of right-to-work and anti-union
legislation on members of labor unions, coupled with public perception of union
members as greedy, all make the ability to persuade individuals to pay dues, fight to
maintain collective bargaining rights, and fight to keep benefits difficult at best (“State of
the labor unions,” 2013). The effect on unionized labor has been a decline of union
membership, and a decline in those who pay dues, which both decreases union finances
and negatively affects the ability of unions to influence political elections on the same
level as well financed corporations (“Bureau of Labor Statistics,” 2013; Confessore,
2013; Suarez, 2013). The Supreme Court’s Citizens United decision cleared the way for

3
both corporations and unions to pay for advertising within 60 days of a general election
and within 30 days of a primary election (Citizens United v. Federal Election
Commission, 2010). Unions, however, are still at a financial disadvantage with less
money to spend on elections compared to corporations. Spending by corporate America
in the 2012 election cycle, at 9.5 billion dollars, far outpaced labor union election
expenditures at 600 million dollars (Blumenthal & Jamieson, 2014). State of Illinois
spending on election advertising more than doubled previous expenditures (Pearson,
2014b). The Quinn vs. Rauner campaign broke previous records spent on Illinois
gubernatorial campaigns with total contributions of almost $100 million in 2014
compared to just over $50 million in 2010 (Pearson, 2014a; Pearson, 2014b). Rauner
donated more than $26 million himself, which is almost as much as Quinn raised for the
entire 2014 campaign (Pearson, 2014b). Labor accounted for more than $13 million paid
directly to Quinn’s campaign, and business provided almost $38 million of Rauner’s
campaign funds, which does not include the money Rauner donated to his own campaign
(Merrion, 2014; Pearson, 2014b). Campaign spending limits imposed by Illinois state
law was removed because Rauner contributed heavily to his own campaign. Supporters
were then able to spend millions on the Rauner campaign, which broke state records
(Confessore, 2015). These figures do not even account for outside influence from
political action committees (PACs) from both labor and business, in addition to PACs
created by Rauner’s supporters.
In short, local unions, like those in Illinois, need to communicate a message to
members to vote for union-friendly candidates. Union leaders seek support for
candidates who are in direct contrast to those candidates interested in corporate profits

4
with higher executive compensation. Simply, union leaders want their members to reject
candidates who support companies where the compensation of their executive officers
outpaces the wages of average workers, as well as those candidates who work to reduce
labor union influence.
Right-To-Work and Anti-Union Legislation
Nationally, 2011 signaled the awareness of a widespread push by Republican
governors and legislators to restrict, remove, or otherwise eliminate union employees’
rights to collect dues, collectively bargain for wages, healthcare, and retirement among
other benefits and considerations such as automatic withdrawal of dues from paychecks
(Leckrone, 2011). Over 700 pieces of legislation have been introduced in almost every
state of the union to adopt, modify, or otherwise change states’ “right-to-work” status
and/or implement additional anti-union measures (Linn, 2013; Simon, 2011, “State
governments,” 2011; “State of the labor unions,” 2013).
Many pro-union supporters argue the term “right-to-work” is actually a
misnomer. The right-to-work moniker used by conservatives obfuscates the true meaning
of the issue. When a state enacts right-to-work legislation, constituents, and some policy
makers, may understand this as gaining a right-to-work. For example, the Director of
Fiscal Policy for the conservative Oklahoma Counsel of Public Affairs, Jonathan Small,
illustrates the confusion: “When you have a policy like we used to have, where someone
would have to be a member of some bullying organization in order to get a job,
regardless of what the outcome is, we still think it’s better for people to be able to move
freely throughout the job market” (Layden, 2012, para. 13). Right-to-work legislation
actually means employees may choose union representation; however, they are not

5
compelled to pay union dues despite the fact that a union is negotiating wages and
benefits on their behalf. New hires brought in after a contract, where the previous
employees chose representation by a union and the votes were certified, may resent part
of their paycheck going toward union dues even though the union negotiates the wages
and benefits for all employees in a unit. Union members call the group that refuses to
pay dues or fees for collective bargaining in right-to-work states “free riders.”
In short, right-to-work legislation affects both public and private sector labor
unions’ ability to collect dues unless otherwise specified by the state. For example,
Indiana’s right-to-work statutes only applied to public sector school employees starting in
1995 (U.S. Department of Labor, 2008). New right-to-work legislation in Indiana applies
statewide as of 2012 and includes the private sector (Guyett, 2012). Right-to-work
legislation gives employees a choice to pay union dues if they accept employment at a
company with union representation for their position, and employees in a union shop who
choose not to pay still receive the collective bargaining help for wages and benefits
without financially contributing to the union.
A conservative-backed group, The National Right to Work Legal Defense
Foundation (NRTWF), lists 25 states that have passed legislation since 1923 to either
reduce or eliminate compulsory union contributions (Cohn, 2015; LaJeunesse, 2013).
According to the NRTWF, Indiana’s latest status, as a right-to-work state, was part of a
decade-long push to reduce the impact of labor unions with eight more states currently
being targeted (LaJeunesse, 2013). The United States Department of Labor lists 23 states
with right-to-work laws and constitutional amendments as of January 2009, which
already included Indiana (“U.S. Department of Labor,” 2008). With Michigan and

6
Wisconsin added to the list the total number of states corresponds with NRTWF’s tally of
25 right-to-work states as of March 2015 (Cain, 2013; Cohn, 2015). As of March 6,
2015, the Republican led Assembly voted to make Wisconsin the 25th state to enact
right-to-work legislation (Associated Press, 2015).
Alternately, some states have actually enacted anti-union legislation. Anti-union
legislation may affect some, but not all, public sector labor unions on issues outside of
collecting union dues. Some examples of anti-union legislation of public sector labor
unions include: limiting collective bargaining (e.g., with regard to healthcare or increased
contributions to health care costs, wages, retirement benefits), limiting the ability to
strike, and the removal of automatic payroll deductions, and the removal of cost of living
increases to wages.
In short, anti-union legislation affects some, but certainly not all public sector
labor unions. For example, Republican legislators from states such as Wisconsin, which
is now considered a right-to-work-state, began by introducing anti-union bills to remove
collective bargaining rights and automatic union dues collection from many, but not all,
public sector union members. Public sector police officers and firefighters were able to
keep bargaining rights and automatic union dues collection. Many argue the police
officers’ and firefighters’ unions were able to keep these benefits because they supported
Governor Scott Walker of Wisconsin during his election (Barbour & Spicuzza, 2011;
Clark, 2011; Glauber, Umhoefer, & Bergquist, 2011; Stein & Marley, 2013; Vielmetti &
Marley, 2012).
On June 30, 2014 the Supreme Court created a third category called “partial
public employees” (Pamela Harris v. Pat Quinn, 2014). The United States Supreme

7
Court ruled that home health care workers in Illinois could not be forced to pay union
dues because they should not be considered public nor private employees (Pamela Harris
v. Pat Quinn, 2014; Pearson & Mears, 2014). Justice Samuel Alito wrote home health
care workers paid by Medicare should not be compelled to financially support a union
because, in part, they are only partial-public employees hired by the person needing the
assistance, and can be summarily dismissed by the customer with no grievance process
with a labor union through the state (Pamela Harris v. Pat Quinn, 2014). This decision
adds the new category of partial-public employees for right-to-work legislation that
previously included all public and private sector employees in a state. This Supreme
Court case limits right-to-work legislation in Illinois to only apply to home health care
workers, or those that are considered partial-public employees.
There has been varied success with implementation of right-to-work and anti-
union legislation affecting both the public and private sector unions across the United
States. The 2014 Supreme Court case emphasizes that efforts to influence legislation on
a large scale are still very active. Private conservative groups are making it their full time
job to have adopted both right-to-work and anti-union legislation state by state
(LaJeunesse, 2013).
The Rise of Anti-Union Legislation
Unions are undergoing a nationwide struggle to maintain their relevancy. Even
the previous strongholds of the traditionally friendly manufacturing states in the “rust
belt” from parts of Wisconsin into New York are not immune to right-to-work and anti-
union legislation. In February of 2011, Governor Scott Walker of Wisconsin introduced
policies to eliminate collective bargaining for some of its public employees, arguing the

8
move was necessary to eliminate lengthy negotiations with employees that would prevent
him from making sweeping financial reform in state government. Those who supported
Governor Walker’s election were spared, including police officers, firefighters, and
motor vehicle inspectors, which are part of the state troopers’ union (Stein & Marley,
2013). University police officers were not part of the group that supported Governor
Walker in the election, nor were they spared. Governor Walker sought to remove public
employees’ ability to negotiate the employee contribution rate for retirement and
insurance. Walker’s detractors argued he was “part of a nationwide effort to kill labor
unions” (Barbour & Spicuzza, 2011, p. A1). State Democrats fled the state to meet up in
Illinois to avoid a vote on the issue (Glauber, Umhoefer, & Bergquist, 2011). Walker
argued the move was necessary to make the Wisconsin State budget solvent. Detractors
argued the policy was more about ending the influence of organized labor and firing
anyone who disagreed with the governor’s policies. A Federal court in the Western
District of Wisconsin upheld the limits on collective bargaining, but would not uphold a
requirement to recertify the union every year nor stop automatic payroll deductions
(Vielmetti & Marley, 2012). The success of Governor Walker’s reforms in Wisconsin
added fuel to lawmakers in other states trying to limit union influence.
In March of 2011, Governor John Kasich of Ohio signed an anti-union bill to
prohibit striking and restrict collective bargaining to wages and job safety concerns,
which excluded “health care, sick time or pension benefits” (Leckrone, 2011, para. 16).
By November of that year, the voters rejected the bill on a referendum making Ohio one
of the few states that was able to overturn anti-union legislation (Terkel & Celock, 2011).
Legislative changes have resurfaced as a new anti-union strategy in Ohio called

9
“Workplace Freedom” that is designed to ban the collection of union dues from people
who are not members of a union but who benefit from the collective bargaining by unions
(Blackwell, 2013). As of June 2014, there was not enough support to pass this legislation
in Ohio, although the Ohio AFL-CIO worried that if re-elected Governor Kasich would
introduce legislation during a lame duck session after the November 2014 election (de
Souza, 2014). The introduction of new legislation supports the idea that passing anti-
union legislation or right-to-work laws are part of a broader strategy to limit the influence
of unions in elections by reducing union coffers.
In April of 2011, Governor Rick Scott of Florida also worked to remove
automatic deduction of union dues. Legislators were trying to prevent unions from
automatically collecting dues from paychecks, and trying to require that members vote
annually to allow their union to use dues for political purposes (Terkel, 2011). Governor
Scott did not have much support from the Republican Party because Florida is already a
right-to-work state, and the potential rule to prevent automatic deductions did not apply
to all Floridians or companies, just unions.
Republican legislators in other states, such as Massachusetts and New Jersey,
have been successful in limiting collective bargaining by public employees regarding
heath care (Dellisanti, 2011). New Jersey Governor Chris Christie was also able to
increase employee contributions for pensions. Outside of legislation, the governor of
Maine ordered a mural removed from a state building simply because it depicted labor
history and in his opinion was one-sided (Simon, 2011).
In February of 2012, Governor Mitch Daniels of Indiana signed a law that is most
notable because it was the first successful right-to-work legislation in the “rust belt” or

10
manufacturing heavy Midwest despite protests from labor unions (Greenhouse, 2012;
Guyett, 2012). Following Indiana’s lead, Governor Rick Snyder of Michigan also signed
a right-to-work bill in December of 2012. Individuals in Michigan represented by unions
will no longer be compelled to pay union dues for wage, healthcare, and retirement
contribution negotiations if they are currently being represented by a union or if they
work in a shop where there is union representation (Hartfield, 2012). This bill surprised
many as Michigan is known for its largely unionized automobile manufacturing industry,
and the bill comes on the heels of the positive news regarding the collaboration of the
United Auto Workers (UAW) and management.
The legislative lessons learned from around the country are important to union
advocates in Illinois. Since pro-business Bruce Rauner won the Illinois Governors’ seat,
labor unions now wonder how long it will take Rauner to make good on his promise to
“wrest institutions from the influence of labor unions” (Stout, 2014, para. 4). Rauner
says “he would model his governorship after those of Wisconsin Gov. Scott Walker and
former Indiana Gov. Mitch Daniels” (Burnett & Tareen, 2014, para. 9). The message
from Republican lawmakers is clear. Business leaders do not want to deal with labor
unions, and they are using GOP-backed legislation to clear the way to give individuals a
“right-to-work” as part of their effort to convince voters to support their candidates.
Voters who may be guided by a misunderstanding of what right-to-work means coupled
with recent Supreme Court decisions could very well pave the way for statewide right-to-
work status in Illinois.

11
The Impact of Right-to-Work Legislation
The state of Oklahoma saw a sharp drop in labor union membership in the four
years following the passage of right-to-work laws in 2001 (Layden, 2012); and while
there has been a small increase in union membership since 2005, the total number of
individuals belonging to a union is lower now than when the legislation was passed
(Layden, 2012). Numbers from 2012 show labor union membership in Oklahoma is at
115,000 members, which is just 4,000 shy of the number of members when right-to-work
was enacted in 2001 (“Bureau of Labor Statistics,” 2013). The number of workers who
do not pay for union representation in Oklahoma alone is up from 19,000 to 25,000 in
just one year from 2011-2012 (“Bureau of Labor Statistics,” 2013). In states that do not
have right-to-work legislation, labor unions are able to collect a fee (i.e., “fair share fee”)
to cover the cost of representation for wage and benefit bargaining from those who do not
want to belong to the union.
The overall impact of right-to-work has had a chilling effect on union coffers by
eliminating this fee from individuals who decide not to join a union even when an
existing union is in place where they apply to work (Layden, 2012). Additional impacts
of right-to-work legislation are difficult to determine because of the many variables that
affect state performance. Wages are lower in states that have adopted right-to-work laws
(“Bureau of Labor Statistics,” 2013; LoBianco, 2012). Union representatives look at the
increased push to reduce or eliminate money to support unions as another way to reduce
the already perceived waning political power of unions in elections. Still other union
leaders argue Republican governors are working to increase the profits of corporations at
the expense of employees. Legislators argue that designating itself as a right-to-work

12
state or enacting legislation to reduce or to remove collective bargaining is what will tell
companies that their state is “open for business” without the burden of union contracts
that typically include higher wages and benefits (“Bureau of Labor Statistics,” 2013).
Again, right-to-work legislation applies to public, private, and partial-public sector
unions and removes the requirement to pay union dues or fair share fees. Anti-union
legislation without the right-to-work designation mainly affects public sector employees,
and typically affects collective bargaining of benefits.
The Response of the National Labor Relations Board
The fight by unions to maintain collective bargaining rights and benefits, in
addition to fighting off outsourcing, has been problematic due to the lagging economy
and concern for larger corporate profits for shareholders in the private sector.
Additionally, mounting fiscal debt by states has contributed to the rhetoric for eliminating
rights of union employees. Union members had a belief that they would not lose benefits
they had already negotiated for in good faith. Poor profit margins and a lack of spending
by consumers have given conservative groups ammunition to cut wages and benefits. A
conservative movement in the country is leading these changes, in part, to improve the
business climate for corporations that struggle to earn profits because of perceived
“greedy” labor union employees.
In August of 2011, as one response to the mounting legislation affecting labor
unions, the National Labor Relations Board (NLRB) required companies to display a
poster that, in part, informed employees of their right to join a union (Semuels, 2011;
“U.S. Department of Labor,” n.d.). The rule was to be implemented by April of 2012
(“Employee Rights Notice Posting,” n.d.). The courts initially ruled the NLRB did not

13
have authority to create such a rule because it violated employers First Amendment
rights, which was later overturned (“The N.L.R.B.’s Contested Poster,” 2013). At this
point, the poster is available, but the NLRB chair will not enforce its placement until all
appeals have been exhausted (“Office of Public Affairs,” 2012). The NLRB cites a drop
in union membership as one reason for the need of a poster to inform employees of their
rights to join a union even in a right-to-work state amid declining union membership.
The Decline of Union Membership
According to the Bureau of Labor Statistics in the U.S. Department of Labor
(2013), the 2012 data show a continued drop in labor union membership. Since 1983,
total labor union membership dropped 3.3 million workers and 8.8 percent (“Bureau of
Labor Statistics,” 2013; Linn, 2013). In other words, 14.4 million people belong to a
labor union in 2012 compared to 17.7 million when comparable data were available in
1983 (“Bureau of Labor Statistics,” 2013). Public sector unions had a union membership
rate of 35.9 percent, compared to private sector unions with a 6.6 percent membership
rate (“Bureau of Labor Statistics,” 2013). For example, professionals in education,
training, and library positions had the highest union membership rates of over 34 percent,
which is higher than those in private sector construction trades, which is over 13 percent
(“Bureau of Labor Statistics,” 2013). Additionally, Black workers were more likely to be
union members than their White, Asian, or Hispanic counterparts (“Bureau of Labor
Statistics,” 2013). The least populous union memberships were found in southern and
western states (“Bureau of Labor Statistics,” 2013).
Today, union membership and middle-class wages are on the decline, and
executive compensation is on the rise (Liberto, 2011; “U.S.: Hostess,” 2012). Executive

14
compensation, or pay for Chief Executive Officers (CEOs), Chief Financial Officers
(CFOs), and other top-paid management executives including Vice President’s (VPs),
may include base pay, stock options, performance-based or non-performance-based
incentives, and other amenities such as exclusive use of cars, drivers, planes, and various
residences that may be supplemented by the company, and requires reporting to the
United States Securities and Exchange Commission (SEC) (“U.S. Securities,” 2011).
Executive compensation was up 23% in 2010, compared to 2009, and is now 343 times
more than the pay of typical workers (Liberto, 2011). This disparity is actually down
from 2000, when CEOs were outpacing the average worker’s wage by 525 times
(Liberto, 2011). This wage disparity brought about new disclosure requirements from the
SEC regarding executive compensation (Confessore, 2013). Now that the SEC requires
full disclosure of executive compensation, some would also like to see where
corporations are donating their money for political purposes (“U.S. Securities,” 2011).
The Supreme Court decision regarding Citizens United removed any spending limits in
campaigns by corporations or labor unions (“Citizens United,” 2010; Suarez, 2013).
Some argue that asking or requiring companies to disclose where their money is going
would be a burden to corporations, although labor unions are already required to submit
to the Department of Labor where their donations are going (Blumenthal & Jamieson,
2014; Confessore, 2013; Suarez, 2013).
Labor Union Communication and Vote Choice
When we consider the reduction in union membership annually, in addition to the
depth and breadth of legislation enacted in the last two years to reduce or eliminate union
influence, it seems that the efforts of union advocates to inform union membership of

15
issues important to their constituency and persuasive efforts to vote for “union-friendly”
candidates would be imperative for union survival. Therefore, this study focuses on the
effects of labor union communication from labor union media. In order to understand
how exposure to labor union media affects labor union members and their subsequent
vote choice, participants in this study are labor union members.
The main purpose of this study is twofold. First, the purpose is to examine local
labor union members’ use of labor media, including national, state, regional, and local
labor organizations, which endorse candidates and lobby for issues that affect them. To
this end, I conducted a survey of local union members from the state of Illinois regarding
a recent election to examine their sources of political information, and possible influence
of labor media on evaluation of candidates and subsequent vote choice. The second
purpose of this study is to understand if labor union members use and trust the messages
regarding candidates contained in the labor media when formulating their voting
decisions for union-supported candidates.
The increase in the amount of legislation that has been generated to enact right-to-
work and other anti-union legislation around the country make labor unions an important
group to study. Little scholarly work has been done to investigate communication organs
(i.e., “mediums” of communication) of labor unions (Blume, 1970). Conventional
wisdom holds that labor union members are all Democrats or liberals. Clearly, not all
union members vote for the labor union-supported candidate. The reality is there are also
many union members who vote for Republican and conservative candidates. Therefore,
it is important to study actual labor union members. Some labor union members identify
more strongly with Democrats or those who lean liberally, and some labor union

16
members identify more strongly with Republicans or those who lean conservatively.
Traditional Democratic candidates typically support policies that benefit labor union
membership, but this is not always the case. Therefore, labor union members in the State
of Illinois, and their consumption of national, state, regional, and local labor media
regarding candidates and issues important in the Illinois general election on November 4,
2014, and union members’ subsequent vote choice is the focus of this study.
Theoretical Perspectives
Framing Theory
Survey framework. Framing theory will be used to guide the construction of this
study’s survey as framing is the idea that a particular issue (e.g., or in this case an
endorsement of a candidate, or a position on a ballot referendum) is given focus or
precedence to the exclusion of other information about that candidate or issue (Borah,
2011; Bruggemann, 2014; Price & Tewksbury, 1997; Scheufele, 1999; Shah, McLeod,
Gotlieb, & Lee, 2009). This may lead voters to have a particular point of view about a
candidate or issue (Shah, Domke, & Wackman, 1996). Further, Price and Tewksbury
(1997) argue, “the more prominent group distinctions are made in news reports, the more
likely are group-related constructs to be used as reference points in interpreting the issue
at hand” (p. 201). This could mean, for example, that labor union members who identify
strongly with the union may perceive labor union communication to be more trustworthy
than mainstream media, and subsequently rely on their membership in the labor union to
guide decision-making at the polls. Alternately, a labor union member who felt their
membership in their church was more important than their membership in the labor
union, may place greater importance on information from the church compared to their
17
information from the labor union. Individuals may choose to expose themselves to or
ignore certain forms and sources of media, and therefore be exposed to certain frames
more than others.
Effects framework. Framing is used to examine if labor union members are
persuaded by their exposure to labor union media (Borah, 2011; Bruggemann, 2014;
Price & Tewksbury, 1997; Scheufele, 1999; Shah, McLeod, Gotlieb, & Lee, 2009).
Framing theory is appropriate to understand the vote choice of labor union membership
because it helps to explain how exposure to labor union media messages may influence
interpretation by a receiver at a later time. For example, how the labor media may choose
to cover or “frame” a candidate or issue may heighten awareness of previously held
beliefs, which may filter the lens that we use to view a candidate or issue (Zaller, 1992).
Political frames come from a variety of media sources. Although individuals may only
expose themselves to certain types of media, and exclude other media sources,
individuals perceive some sources of news to be more trustworthy than others (Jones,
2004; Lee, 2010). According to Price and Tewksbury (1997), the timing of exposure to
certain frames may prime a person to respond a certain way within a certain period
following exposure.
The source of these political frames may affect the salience of information
regarding candidates and issues to the individual. Issue salience may also be influenced
by conventional wisdom communicated by political pundits and “spin doctors”
(Kaufman, Petrocik, & Shaw, 2008). So, the salience of the coverage of candidates and
issues for an election communicated by labor media may be important to the decision
making of some members of the union, unimportant to others, and may ultimately

18
influence voting. Therefore, framing is an appropriate perspective for studying the
effects of labor media on labor union members’ vote choice.
Current Gaps in Literature
The first goal of the study is to fill a gap in the research of labor unions’
communication “organs,” also known as the medium (i.e., newspaper, radio, television,
and Internet) and channel (e.g., a specific newspaper like The Labor Paper) used by
union advocates to communicate to union members-at-large. To date, few studies within
the discipline of communication mention labor union organs or mediums, and almost no
analysis addresses labor media and subsequent vote choice (e.g., Digby-Junger, 1998;
Garver, 1958; Perry, Taylor, & Doerfel, 2003). Digby-Junger’s (1998) study provides a
comparison of four newspapers published by Blacks and their place in history as Black
radical press. The only mention of a labor union in this analysis is to acknowledge the
use of the Messenger by the “Brotherhood of Sleeping Car Porters” as their way to
communicate in the early 20th century (Digby-Junger, 1998, p. 268). Garver’s (1958)
research is the only available study to discuss the labor union press as a specific topic of
analysis, and unfortunately this work is over 50 years old. Perry, Taylor, and Doerfel
(2003) talk about how one union utilized the Internet during a strike. The examination of
labor union communication “organs” is not completely absent from academic research.
On the contrary, while dated, there is a healthy discussion of labor unions in the political
science literature (Blume, 1970; Juravich, 1986; Juravich & Shergold, 1988; LeRoy,
1990), yet this body of work is often limited in its communication focus. The present
study focuses on communication variables and constructs that are of interest to

19
understanding the political communication occurring between labor unions and their
members.
The second goal of the study seeks to fill a gap in the literature regarding the
influence of labor unions’ communication of political endorsements and positions on
issues to labor union members. There are a few studies that discuss how labor unions use
advertisements or advertorials to communicate their message to members and the public
at large (e.g., Brown, Waltzer, & Waltzer, 2001; Buss & Hofstetter, 1976; Mullen, 1963).
Even here, studies by Buss and Hofstetter (1976) and Mullen (1963) focused more on the
differences between Democrats and Republicans rather than labor unions’ use of
advertising in campaigns. Simply, there is a lack of understanding the impact of
communicating the union endorsement on the union voter.
In addition, the second goal of the study also seeks to identify the specific media
that labor union members use to acquire their political knowledge, and the ultimate vote
choice of labor union members. Therefore, the study will also fill gaps in the existing
literature regarding the influence of traditional and labor communication on labor union
members’ vote choice.
Literature regarding labor unions within the discipline of communication is
considered sparse at best (Botan & Frey, 1983; Freedman, 2004; Knapp & McCroskey,
1968). According to Freedman (2004), “few studies of the U.S. labor press have been
published in the peer-reviewed literature of journalism or labor, and those focused more
on the history of the labor press rather than what it reports and how” (Freedman, 2004, p.
304). One study examining labor press is a study by Martin (2010) that is devoted to
illustrating how researchers have underutilized publications by various social movements,

20
including labor unions as one group, as a source of data to illustrate media bias. It is
clear, as of 2015, that there are still many gaps in the communication literature in our
understanding and analysis of labor unions’ communication with their members. This
study examines extant political science literature of both traditional and modern labor
union influence in elections with the goal of broadening our overall understanding of
labor union communication practices with members and the effects of such
communication activity on union members’ voting behaviors.

21
CHAPTER TWO: REVIEW OF LITERATURE
The decline in labor union membership is well documented (Chang, 2001; Sousa,
1993, “State of the labor unions”, 2013). Labor union members, however, have a higher
voting turnout rate than labor union households, which have a higher voting turnout rate
than non-labor union households in a general election (Chang, 2001; Delaney, Masters, &
Schwochau, 1990; Sousa, 1993; Wolfe, 1969/1978). Despite the documented decline in
labor union membership and the rise of labor union voter turnout, an April 2014
Rasmussen poll, and an October 2014 Rasmussen poll two weeks prior to the election for
Illinois governor showed Republican Rauner leading the labor union-endorsed Democrat
Quinn 43 to 40 percent, and 48 to 47 percent respectively (“Election 2014”, 2014a;
“Election 2014”, 2014b). This begs the question: can a labor union voting bloc actually
impact an election? Labor union leaders certainly want to get labor union members to the
polls. The literature, however, is missing an important examination of how labor union
advocates are communicating with labor union members on topics and political
candidates of importance to a labor union friendly agenda; and, furthermore, if labor
union members are consuming labor media when making their political decisions. The
current chapter examines what we know about labor union influence in elections from
political science, as well as the communication literature that broadly covers research of
framing effects of media. The goal is to highlight the dearth of communication research
of labor union communication. Finally, the theoretical framework of the current study
will be provided, along with hypotheses and research questions that seek to understand
labor union members’ use of traditional and labor union media and its potential influence
on vote choice.

22
Traditional Labor Union Influence in Elections
There has long been an interest in how unions and labor union members affect
policy change in Washington, and how labor may influence candidate choices for various
elected offices (Greenstone, 1969; Norris, 2002; Ra, 1978; Wilson, 1979). While there is
some evidence of the relationship between knowledge and labor issues and vote choice,
perceived voting importance and registration, voter turnout, and some demographic
influence, ultimately, it is the hope of labor union leadership to create a reliable and
engaged labor bloc (LeRoy, 1990). Labor union advocates would like to see a labor bloc
that supports candidates who will create or advocate policies that are favorable to labor
union members and their families (LeRoy, 1990). Therefore, labor union leaders try to
influence the voting behavior of the labor union membership. The literature surrounding
labor unions and their influence on voting looks at a variety of local, state, and national
elections. Two common findings emerge from these studies, including mass media’s
influence on political knowledge, and political orientation as an important factor in labor
union voter turnout (Blume, 1970; Juravich & Shergold, 1988; LeRoy, 1990). Therefore,
the rationale for studying the communication of labor union media geared toward labor
union members and voters is based on gaining an understanding of the type of mediums,
and the trust of these mediums, on labor union members’ voting behavior, and labor
union media’s ability to influence the outcome of an election.
Vote Choice and Political Knowledge
It is a well established fact that union households are more likely to vote
Democratic than nonunion households (e.g., Axelrod, 1972/1978, Campbell et al., 1960;
Chang, 2001, Cook, 1975/1978; Hojnacki & Baum, 1992; Juravich & Shergold, 1988;

23
Kaufmann et al., 2008; LeRoy, 1990; Lewis-Beck, Jacoby, Norpoth, & Weisberg, 2008;
Nie, Verba, & Petrocik, 1979/1999; Rayback, 1959/1978; Sousa, 1993; Wolfe,
1969/1978). In fact, early political historians noted, “labor voted for Jackson in 1832 and
became an integral part of the Democratic Party” (Rayback, 1959/1978, p. 56). Later:
Union members…persisted in their Democratic voting. A Democratic candidate
for the House of Representatives, for example, can on the average expect to
obtain 60 to 70 percent of the union vote, and a Democratic presidential
candidate, even if he does badly, will do less badly among union members than
one would expect on the basis of national figures. This has not changed over
time. (Nie et al., 1979/1999, p. 232)
In an examination of more recent Presidential elections, Lewis-Beck et al. (2008) argue,
“regardless of the Presidential Election, 1948-1996, this pro-Democratic union sentiment
manifests itself” (Lewis-Beck et al., 2008, p. 321).
Additionally, those who are more active in union activities (e.g., Campbell et al.,
1960; Juravich, 1986; Juravich & Shergold, 1988) or take leadership positions (e.g.,
Juravich & Shergold, 1988) are more likely to vote for the union endorsed candidate.
Also, those who are more informed (e.g., Campbell et al., 1960; Juravich, 1986), have
higher political knowledge (e.g., Blume, 1970; Juravich, 1986), and identify more closely
with the union (e.g., Campbell et al., 1960; Lewis-Beck et al., 2008), are more likely to
support a union-endorsed candidate.
Surprisingly, a greater length of time spent in a union does not necessarily
increase the likelihood of supporting the union endorsed candidate (e.g., Boris & Bruno,
2010). It may be important to consider, however, that the Boris and Bruno (2010) study

24
investigated support of two Democrats (Barack Obama and Hillary Clinton). Also in this
study, length of time in the union and effect on voting may have been tempered because
the United Steel Workers originally supported John Edwards (Boris & Bruno, 2010).
Once Edwards left the race, “the international union did not give an immediate
endorsement to either Obama or Clinton…[Additionally], “there was a lack of clarity in
distinguishing between Clinton and Obama on the issues” (Boris & Bruno, p. 111).
Length of time spent in a union may well make a difference when the candidate choices
are between a Democrat and a Republican.
While current research is limited, and does not support the length of time spent in
a union as an influence on vote choice, those with greater political knowledge are more
likely to support a union-endorsed candidate (Blume, 1970; Juravich, 1986). Where do
union members receive most of their information when making their voting decisions?
Simply, union members report most of their political information comes from mass
media sources (Bruno, 2000; Juravich, 1986). Media influence on political knowledge is
prevalent even while union leaders may try to persuade union members to support a
particular candidate; and union members often cite sources other than union
communication or union leaders for their political knowledge (Bruno, 2000; Juravich,
1986). According to studies that explore the effects of a local union on its membership,
mass media is the predominant source union members cite as the basis for their political
information (Blume, 1970; Juravich & Shergold, 1988; LeRoy, 1990). LeRoy (1990)
acknowledged that most of the information regarding elections comes from very
influential media, while limited political information was received via union
communication: “The data suggest that union members get most of their political

25
information from the media, and get the least amount of their political information from
union newspapers, co-workers, and union leaders” (LeRoy, 1990, p. 24).
While the mass media are the dominant place where union members get political
information, Juravich and Shergold (1988) argued, “union publications and telephone
contacts have a significant impact…on voting preference” (Juravich & Shergold, 1988, p.
384). Although, according to Cook (1975/1978), telephone banks were distrusted and
disliked. Additionally, LeRoy (1990) argued, “the data do not indicate to what extent
these sources…[television, radio and newspapers, and their general use] influence the
voting decision…The data may reflect exposure to, as opposed to reliance on, these
sources” (LeRoy, 1990, p. 24). Juravich and Shergold (1988) propose that union
management has the ability to overcome a media message if the “traditional organs of
union opinion—the newsletter and flyer…message is conveyed in a manner that union
members find ‘useful’” (Juravich & Shergold, 1988, p. 381). It is important to note that
even though union members relied on the mass media for a majority of their political
information, their actual political knowledge is still relatively low (Blume, 1970;
Juravich, 1986).
Union members gained their political knowledge largely from mass media in the
form of newspapers during earlier times and television in more recent times (e.g., Blume,
1970; Bruno, 2000; Juravich, 1986). According to Juravich and Shergold (1988),
consumption of electronic media impacts the vote choice of labor union members. Also,
according to LeRoy (1990), when considering a presidential vote, union members rely on
the union as a source of political information less than television/radio, newspaper,
spouse/family, magazine, and political party. In the past, a majority of union members

26
received most of their political information from a daily newspaper, followed by
television, yet union members actually trusted their daily newspaper the least (Blume,
1970). Earlier research indicates union members trusted the union newspaper message
more than their local newspaper, although the major source of their information was from
non-union newspapers (Blume, 1970). Alternately, the union publication was the most
trusted source of “formal communication” (Blume, 1970, p. 142). As time has passed,
television has replaced the newspaper as the dominant form of mass media where union
members gathered political information (e.g., Blume, 1970; LeRoy, 1990). Blume (1970)
and LeRoy (1990) conducted their research on this topic during a time when the Internet
was not used as a source of political information, which makes examining labor union
communication – now with a variety of media choices – even more important during a
time in history where the prevalence and pervasiveness of political information on the
Internet is available to anyone. Many labor union leaders are still utilizing a printed
newspaper dedicated to labor members as their main form of communication. This
includes, for example, IBEW Local 34, who uses The Labor Paper as the official form of
communication for all members of the IBEW Local 34 in Central Illinois. The American
Federation of State County and Municipal Employees (AFSCME) Council 31 in Illinois
also use the newspaper AFSCME Works to communicate. Other labor unions in Illinois
receive their political news from national, regional, state, and local labor advocates in
various labor specific publications.
Presidential Elections
There have long been arguments regarding labor unions’ influence in Presidential
elections (e.g., Wolfe, 1969/1978). According to Sousa (1993):

27
The conventional wisdom that there has been a steady decline in the union effect
on voting in presidential elections is wrong. The union effect waned in the
turbulent campaigns of 1968 and 1972, but it took on renewed significance in
1976 and in the 1980’s. (p. 748)
Later, Chang (2001) illustrated the union effect on voting by comparing union member
household vote to the nonunion workers who vote in presidential elections. Labor union
households made up 26% of the voters in 2000, which is up from 23% in 1996, and 19%
in 1992, despite the fact that labor union members were only 13.5% of the workers in
2000 (Chang, 2001). Therefore, while there has been a decrease of union membership
over time, the remaining union members have increased their turnout at the polls during
general elections. This same surge is not shown during primary elections. The increase
in general election turnout may partially be due to the heavy emphasis labor union leaders
place on election communication leading up to and during a general election campaign.
In addition to union membership and changes in union member turnout at the
polls, individuals also view the role of unions in our society much differently now than in
the past. Lewis-Beck et al. (2008) argue, “the union remains an important, highly
partisan voting group in our society” (Lewis-Beck et al., 2008, p. 322). While union
membership is decreasing, individuals who believe unions should have more influence is
on the rise. A Gallup poll from 2005 indicates labor union membership has dropped over
time, although there is an increase in the number of people who believe labor union
members should have a stronger influence in elections—at 38% compared to those who
believe labor should have less influence at 30% (Lewis-Beck et al., 2008).

28
Voting Importance, Registration, and Turnout
The road to the ballot box begins with the conviction that voting is important.
The fundamental belief of the union member regarding the importance of registering to
vote and ultimately voting is the foundation or core of union member beliefs (Delaney,
Masters, & Schwochau, 1988), a fundamental commitment to democracy and rule by the
people. The first step to actually casting a ballot is the personal belief that one’s right to
vote is an important and worthwhile endeavor. Labor union members have this personal
belief and are more likely than their nonunion counterparts to believe voting makes a
difference (Delaney et al., 1988).
Registering to vote is the next step. Labor union members self-report at 14.5%
more likely to vote compared to a nonunion sample examining both those registered and
those not registered to vote. However, in an examination of those actually registered to
vote—labor union members are only 11.4% more likely to vote compared to nonunion
members (Delaney et al., 1988, Juravich & Shergold, 1988). Delaney et al. (1988) did
take the extra step of validating the self-reported data by comparing official results of a
local election. From the current evidence that we have, union members are more likely
than their nonunion counterparts to believe that registering to vote and voting is
important (Chang, 2001; Cook, 1975/1978; Delaney et al., 1988; Juravich & Shergold,
1988). The results of many studies on labor union voting behavior, however, measure a
union household and not the individual union member. This means that a nonunion
person who happens to live with someone who is a member of a labor union is measured
and reported as part of that union household.

29
Research on voter turnout is varied. Studies that measure the union household as
representative behavior of the union member may be part of the problem. Studies using
ANES data show that over time labor union households have higher voter turnout rates
than nonunion voters (Chang, 2001). According to Sousa (1993), however, in an analysis
of presidential elections between 1960 and 1988, voter turnout among union households
was not much higher than their nonunion counterparts, and only statistically higher in
1976 and 1984 (Sousa, 1993). Research from Delaney et al. (1988), and Juravich and
Shergold (1988) echoes Sousa’s (1993) work. Further, in primary elections, some
scholars (e.g., Delaney et al., 1988) argue that union household members are not more
likely than the general population to show up to vote.
Sousa (1993) elaborates on union membership and its effect on voter turnout after
controlling for demographics including age, income, race, strength of party identification,
and a dummy variable for their status as a union household or not (Sousa, 1993). Being a
member of a labor union household does not predict voter turnout. Although, Sousa
(1993) admits, “it is possible that the union effect on turnout was depressed by the
decision to focus on union householders, and not just union members” (Sousa, 1993, p.
754). In an earlier study, Delaney et al. (1988) emphasize, “researchers have not
empirically examined whether or not there are differences in political behavior between
nonmembers and nonmembers residing in union households” (Delaney et al., 1988, p.
223). Ultimately, Delaney et al. (1988) argue, “union family members’ turnout rates are
not different from nonmembers” (Delaney et al., 1988, p. 233). Later, Delaney, Masters,
and Schwochau (1990), in a study that also examined union endorsed candidates, explain
that the union household vote is somewhere in between the union member and the

30
nonunion member. This range or vote continuum may explain the varied results among
studies regarding turnout. Perhaps the answer is union members have higher turnout than
union households, which have higher turnout than nonunion members do, and their
respective households.
In short, while many claim greater voter turnout by union members and their
families, there is varied evidence to support this claim. Very few studies examine the
topic in depth over a longer period. Delaney et al. (1988) examined congressional voting
from one election in 1978. Juravich and Shergold (1988) examined union members in
Pennsylvania during the Presidential election of 1984. Sousa (1993) provides the most
thorough overview from ANES data covering the presidential elections from 1960-1988.
Chang (2001) does examine ANES data covering presidential elections from 1948-2000,
but does not provide the tables or statistical analysis that Sousa (1993) presents as
evidence.
The story of voter turnout of union members is best explained by understanding
that union member voter turnout in primary elections is low (e.g., Delaney et al., 1988),
and union member voter turnout in general elections is also low, but has been increasing
as union membership has been decreasing (e.g., Chang, 2001). In short, union members
are not necessarily motivated to go to the polls any more than nonunion members, but
when union members show up at the polls, they vote for the Democratic candidate more
often than not (Sousa, 1993), and evidence of union membership influencing vote choice
may be present (e.g., Campbell et al., 1960; Sousa, 1993). Further, union membership
impacted vote choice and was statistically significant in six of the eight election cycles
that Sousa (1993) examined, including the greatest impact in the 1984 Presidential

31
election when Democratic candidate Walter Mondale lost to incumbent Republican
President Ronald Regan. Finally, the literature regarding voter turnout of union members
utilizes data from union households and not just the union member when examining
ANES data, and our best understanding is that a union household may have only slightly
higher voter turnout than a nonunion household (Delaney et al., 1990).
Demographic Influence
The most defining demographic influence of the union voter is race. Analysis of
the demographics of labor union members encompass gender (Boris & Bruno, 2010;
Fiorito & Greer, 1986), education (Boris & Bruno, 2010; Juravich & Shergold, 1988),
age (Juravich & Shergold, 1988), religion (Boris & Bruno, 2010), and income (Campbell,
Converse, Miller, & Stokes, 1960; Sousa, 1993); however, race combined with union
membership appear to be the strongest predictors of vote choice (Boris & Bruno, 2010;
Sousa, 1993). While race is not the solitary predictor of vote choice, simply being Black
does make a difference in turnout and vote choice.
The empirical evidence from voter turnout tells us that the Black voter votes
Democratic (Lewis-Beck, Jacoby, Norpoth, & Weisberg, 2008; Pomper, 1975).
According to Lewis-Beck et al. (2008) African Americans have voted Democratic in
presidential elections for some time. Also, Black voters have more cohesion and stronger
ethnic identity: “When that identification intensifies, so does the political reaction…The
indication is that black Democratic support is issue-based, rather than merely symbolic”
(Lewis-Beck et al., 2008, p. 322). When a Black voter is also a union member, the union
effect on voting appears clearly:

32
The union effect appears to be much stronger and more consistent for black than
white voters. Union whites outvoted non-union whites by an average of only 2.5
percentage points, but turnout among union blacks exceeded that of non-union
blacks by an average of 12.7 points… [In short] union status helps to equalize the
differences in the voting rates of black and white voters. (Sousa, 1993, pp. 751-
752)
According to Kaufmann, Petrocik, and Shaw (2008), women are more likely to vote
Democratic than men, and white women are more likely than white men to vote
Democratic in an examination of ANES data. In a study of union members that examines
race and gender, Boris and Bruno (2010) show that a majority of Black (94.4%) union
members compared to White (32.8%) union members preferred Barack Obama as the
Presidential candidate, and females (58.2%) preferred Hillary Clinton compared to males
(45.2%) (Boris & Bruno, 2010). Demographic factors including race, gender, education,
age, geographic location, and religion explained 30.3 percent of the variance in
respondents’ primary voting decision (Boris & Bruno, 2010). Only race and gender were
statistically significant at .01; and education was statistically significant at .05 (Boris &
Bruno, 2010). This finding is consistent with Juravich (1986), who also did not find
income or age to be statistically significant. Unlike Boris and Bruno (2010), Juravich
(1986) did not find education to be statistically significant.
Later, Juravich and Shergold (1988) did find that younger and less educated union
members were less likely to vote (Juravich & Shergold, 1988). This is consistent with
empirical evidence that younger citizens consistently vote less than do older voters
(Kaufmann et al., 2008).

33
In all, Lewis-Beck et al. (2008) argue that Blacks vote more as a group, and labor
union members vote less as a group, although group cohesion may not help in predicting
the characteristics or attraction of one candidate over another within a particular election
(Lewis-Beck et al., 2008). Understanding how various demographics may influence
union membership may help explain the variance in union membership voting. Clearly,
studies of union membership should control for race considering the tremendous
influence of Black voters. Gender may also play an important role when determining
vote choice; however, more research is needed in this area to examine confounding
variables that may also contribute to vote choice.
There is not enough evidence to understand the story of demographic influence on
the union voter outside of race. While Sousa (1993) found union members with middle
and upper incomes would vote more Democratic, “for lower income voters, differences
were statistically significant in only four of eight election cycles” (Sousa, 1993, p. 745).
More research in the area of demographics is necessary to understand how the union
voter may differ from the nonunion voting population, again, outside of race.
Modern Labor Union Influence in Elections
Clearly, changes in the percent of the union workforce, labor union voting
turnout, labor union voting impact, and perceptions of labor union influence provides a
need to systematically understand how labor union leaders communicate with the labor
union workforce, and how this communication may affect union members’ vote choice.
The limited studies of labor union voting typically examine the labor union household,
and not the labor union member independently. Relevant political science literature on
“union membership” and “labor voting” revealed some support for labor union influence

34
on elections. Additionally, a few studies have examined union membership and not
union households in the context of labor issues, including organizing (e.g., Demsetz,
1993; Martinez & Fiorito, 2009; Martinez, Fiorito, & Ferris, 2011; Reed, 1989; Walker &
Lawler, 1986); political influence (e.g., Dark, 1996; Kau & Rubin, 1981; Masters &
Delaney, 1987; Moore, Chachere, Curtis, & Gordon, 1995); mobilization (e.g.,
Gershtenson, 2003; Greene, 1991; Lamare, 2010); interest group impacts (e.g., Clark,
1998; Patton & Marrone, 1984); and gender differences (Fiorito & Greer, 1986), but do
not include vote choice.
Finally, most studies of labor unions’ role in politics and elections are mainly
concerned with national Presidential elections that examined either large regional union
membership or analysis that utilized ANES data. In general, the preceding review of the
political science literature regarding labor union membership and elections revealed the
following four concepts: First, union members are more likely than their nonunion
counterparts to believe that registering to vote and voting is important; second, union
membership impacts vote choice; also Black union voter turnout exceeds nonunion
Blacks; and, finally, mass media is the dominant place where union members get political
information that informs their vote choice.
Theoretical Framework
Framing
Framing theory is often engaged to guide research on media content, such as how
the media frame topics and issues, as well as research examining the effects of media
frames (Price & Tewksbury, 1997). Topics that are framed in a particular way may
activate or “prime” previous knowledge on a candidate or issue, therefore affecting an

35
individuals’ judgment of a particular candidate or issue when exposed to certain frames
(Price & Tewksbury, 1997). Further, Price and Tewksbury (1997) argue that salient
messages that are consistent over a long period of time may be important to
understanding long-term effects. Framing considers the impact on the audience’s
cognitive interpretation of the message based on salient messages to the receiver created
by those in the media (Shah, McLeod, Gotlieb, & Lee, 2009).
Framing theory offers insight into how the framing of campaign issues by
journalists has the potential to affect vote choice. The crux of framing theory is certain
information about a particular issue is given focus or precedence to the exclusion of other
information about the same issue. This may lead individuals (voters) to have a particular
point of view about a candidate or a “plank issue” (i.e. a public position on an issue by a
political party), which may be important to understanding a candidate’s position by a
voter. Framing by traditional news organizations versus labor union media of candidates
and issues may be particularly relevant to labor union voters if they consume media that
utilize particular media frames while excluding others.
Price and Tewksbury (1997) argue this occurs due to how we store knowledge,
our active thoughts, and the stimuli within our current environment. Our “knowledge
store,” for example, is our network of thoughts we keep about various constructs (Price &
Tewksbury, 1997, p. 186). For example, if a union member is presented with the fact that
Bruce Rauner wants to enact right-to-work laws in a news story, the union member may
activate social objects and their attributes like “billionaire,” or “union hater.” Second,
goals, values, and motivations may also be activated like “he wants to break the unions”
or, “he wants to turn Illinois into Wisconsin.” Third, affective and emotional states are

36
activated like “hate,” “anger,” or even “despair.” Price and Tewksbury (1997) argue this
is because we associate connections among what we think, how we remember, our
previous opinions, and how we feel about these constructs.
Constructs that are salient to us are part of our “active thought” (Price &
Tewksbury, 1997). This means that when something is presented to us that we find
particularly important, we are more likely to actively think about this construct. For
example, if a union member is concerned about the outcome of the election, and a new
commercial comes on for Bruce Rauner, he or she would conduct an “Evaluation of
Construct Relevance.” Specifically, the union member may activate many areas within
the knowledge store; for example, because there may be a high excitation level the first
time the commercial is viewed. If the union member sees the same commercial again, he
or she may only activate the affective or emotional state “jerk,” because of the recency
and frequency of prior activation.
Evaluations of constructs are activated based on “current stimuli” (Price &
Tewksbury, 1997). This means that the salience of the various objects, attributes, and
events contribute to how we access various cognitions. Because we are presented with a
variety of messages about a given candidate or issues, we evaluate that which is of
particular importance to us based on our current stimuli. For example, new constructs
may be activated if the union member sees a new commercial about Bruce Rauner from
an attack ad by his political opponent Pat Quinn regarding outsourcing of jobs. The
union member may activate motivation constructs like “Rauner only wants to outsource
jobs to increase his own billions.” Again, the recency and frequency of current stimuli

37
can trigger active thought from our knowledge store based on the salience of a candidate
or issue in this case.
Therefore, the knowledge a union member stores regarding candidates may be
different depending on the media diet of a labor union member. For example, if a labor
union media diet includes heavy consumption of labor union media compared to
traditional media sources, the framing of labor union candidates and issues may activate
different active thoughts based on the stimuli within their labor union work environment.
Exposure to a heavy labor union media diet may influence labor union member vote
choice based on consumption of labor union frames compared to traditional media
frames.
Salience of a news story to a voter is more apparent when the
reader/listener/viewer is less familiar with a particular topic. The voter then relies more
on the news media’s frame or coverage of a particular topic for decision-making, making
the union members’ media diet important to their decision-making. For example, 2004
presidential candidate John Kerry incurred the attribute that he was a “flip-flopper” or
changed his mind on issues due in part to the news coverage surrounding his bid for the
presidency. Framing is then used to explain how John Kerry is viewed by the public as a
“flip-flopper,” or someone who changes their position on a topic to suit political purposes
(Melkote, 2009).
The challenge to the audience is that the news media end up highlighting some
issue or attribute at the expense or exclusion of other attributes. An example of how
news media frames make certain attributes salient for their core audience is the
September 11, 2012 terrorist attack on the U.S. embassy in Benghazi. Consider the

38
reporting regarding Benghazi in various news media. The frame that MSNBC provided
was not nearly as negative as to how then Secretary of State Hillary Clinton and President
Barack Obama handled the crisis (Benen, 2014). Alternately, the frame that FOX News
provides blames Clinton and Obama for attempting to cover up the attack (Herridge,
2014; Ingmire, 2014). A blogger, however, blasted MSNBC for not carrying any live
coverage of the April 2014 U.S. House of Representatives Oversight Committee hearing
on Benghazi, and praises Fox news for carrying “74 minutes and 25 seconds worth of live
coverage” (Meyer, 2014). In turn, MSNBC criticizes FOX News for mentioning
Benghazi 1,101 times during is coverage since 2013 (“The GOPs Summer of Benghazi
Coverage,” 2014).
The attack of a U.S. Embassy in Benghazi is framed differently for members of
different media audiences. This highlights the difference in exposure to a certain topic by
different media with very different frames. Some may argue this is “priming” an
audience or predisposing an audience to a particular viewpoint that is later accessed by a
voter during an election. Essentially, the audience may find that a particular candidate or
issue is salient, but the salience of the attributes is also important (Kiousis, 2004). In the
Benghazi example, for those who consumed media on this topic and considered the
information salient, not only would the position on the issue of a terrorist attack on
Benghazi be salient if exposed, but also one’s position on both former Secretary Clinton
and President Obama would be salient. If we were predisposed to learning about
Benghazi on MSNBC, we would believe that former Secretary Clinton and President
Obama handled the attack appropriately. If we were predisposed to learning about
Benghazi on FOX News, we would believe that former Secretary Clinton and President

39
Obama were covering up the mishandling of the United States’ response to the terrorist
attacks in Benghazi.
News frames are different based on the source (Dimitrova, Kaid, Williams, &
Trammell, 2005). Simply, different media frames may incite a difference in perception
of the issues (Rill & Davis, 2008). These differences are important when we consider
salience of channel and platform repertoire of a labor union member’s media diet. For
example, union members may only expose themselves to labor media, and may limit their
television exposure to FOX News (conservative-leaning) or MSNBC (liberal-leaning).
This limited exposure may activate constructs that are consistent or incongruent with
one’s current opinions.
Entman (2003) provided an extended view of framing called Cascading
Activation. Entman (2003) argued that the original message does not come from the
journalist (who is perceived to “set the agenda”), but actually from the White House and
other elites. Others then reinterpret this frame further down the line (e.g., White House >
Elites > Officials > Journalists > Public). Once the elite “frames” an issue in a particular
manner, it is very difficult to change. For example, information flows or cascades down
easier than transmission the other way. Although, the rise of information available to
many using the Internet, including various labor union media, offers an alternative to
these elite frames. Therefore, in the example provided by Entman (1993), the frame
created by the White House may end up dominating the news received by the public via
traditional television news. Alternative media choices like The Daily Show with Jon
Stewart on cable’s Comedy Central, or Rush Limbaugh via talk radio, or social media
(e.g., Facebook, Twitter, or blogs), and labor union media (e.g., labor union

40
communication via newspaper, social media, and websites dedicated to labor) may each
present alternative frames. Competing frames from others sources may not matter,
however, if an individual only exposes themselves to certain channels, also known as
channel repertoire.
Channel Repertoire
Channel repertoire is defined as the idea that individuals routinely choose from a
limited number of channels on a regular basis to access media content despite the
increased amount of choices available to the pubic in the current media landscape (e.g.,
Ferguson, 1992; Ferguson & Melkote, 1997; Ferguson & Perse, 1993; Heeter, 1985;
Lochte & Warren, 1989). The concept of channel repertoire is different from selective
exposure. Selective exposure, based on Festinger’s (1957) theory of cognitive
dissonance, is defined as individuals choosing to expose themselves only to ideas or
concepts that are congruent with their current attitudes, and avoiding information where
they might be exposed to ideas or concepts that are incongruent with their beliefs on an
issue (Festinger, 1957; Trilling & Schoenbach, 2014). Trilling and Schoenbach (2014),
in a study of online news, did not find statistically significant support for user
preference/avoidance of sites that matched their political viewpoints. Further, Trilling
and Schoenbach (2014) argue individuals use media that is popular and easily accessible.
Individuals may have a channel repertoire due to convenience. For example, local
union members may read The Labor Paper because it shows up in their mailbox twice a
month. Similarly, they may also watch Fox News or MSNBC because they have a cable
subscription, and want to see what is going on in the world at a time when they have
access to 24-hour news service. Individuals may also listen to their local radio station to

41
get news like WMBD-AM because that is what is available to them in their car to and
from their way to work. They may also be exposed to Fox News Radio on WMBD-AM
because that is the news service that the radio station subscribes to for national news.
They may also be exposed to certain labor news because they “like” a group on
Facebook, and information from this group may pop up in their newsfeed. Therefore,
exposure to a media source may not have as much to do with selective exposure and what
they may find credible, as much as convenience.
Early on, the concept of channel repertoire was applied to television (e.g.,
terrestrial, and cable) to convey that we may have many television channels to choose
from, but we select only a small few to watch on a regular basis when cable was
developing on the television landscape (Heeter, 1985; Taneja, Webster, Malthouse, &
Ksiazek, 2012). Later, researchers compared television receive-only (TVRO) satellite
systems or “free-to-air” C-band analog systems opposed to direct-broadcast satellite that
is encrypted (e.g., Lochte & Warren, 1989), to the up and coming cable choices, and even
the effect of having a remote control on choices (Ferguson, 1992; Ferguson & Melkote,
1997). Although channel repertoire has also been used to describe radio (e.g., terrestrial,
cable, and satellite) and television (e.g., terrestrial, cable, and satellite), emerging
research on repertoire has investigated Internet use of media (Ferguson & Perse, 2000),
and cross-platform approaches called media repertoire (Kim, 2014; Taneja, Webster,
Malthouse, & Ksiazek, 2012). Individuals are not only selecting from very few choices,
but the emergence of multiple platforms (i.e., access to television on the Internet using
mobile devices, tablets, laptops, or streaming on their television), is changing the way
individuals find content. Therefore, with more and more platforms available, individuals

42
are gaining political knowledge in a variety of ways, and consuming the same media the
same way on a regular basis. When someone wants political information, they are
typically going to go to the same few places to get that content, which means their
political knowledge is drawn from a relatively few places on a regular basis. Now,
whether the individual trusts a particular news source is a different story.
Trust in News Media
The salience of frames from our channel repertoire includes our knowledge store
about particular candidates and issues, and our active thoughts based on frames from a
varied or limited media diet. Therefore, our current evaluation of political actors and
issues become relevant because of an upcoming election. Adding to our knowledge store
is the trust we place in a variety of news media sources.
Conceptually, trust is defined as when individuals give control to someone else to
reduce the risk of an uncertain future. Giving this control to someone else happens when
the individual may not have knowledge regarding the outcome. In short, “when there is
nothing at stake, trust is not needed” (Kohring & Matthes, 2007, p. 238). This conceptual
definition is important when you consider that journalists frame news stories differently.
Therefore, our channel repertoire, and our choice of mediums place a level of trust in
where we get our news.
Several scholars have argued that Americans in general do not trust the media
(e.g., Jones, 2004; Lee, 2010; Williams, 2012). Mistrust of certain media would
ultimately impact salience of frames that we receive from these sources. For example,
we may still expose ourselves to media that we may be skeptical of to understand how

43
“the other side” may think about a political candidate or issue to add to our knowledge
store, but we may not consider their arguments salient when making a voting decision.
Tsfati and Cappella (2003), and later Tsfati (2010), expected that those who were
more skeptical of mainstream media news would seek alternatives, and avoid or limit
their media diet of mainstream media news. Tsfati and Cappella (2003) found that those
with higher levels of skepticism consumed higher levels of nonmainstream media
compared to their diet of mainstream news. Alternately, those with lower levels of
skepticism consumed more mainstream news as part of their overall media news diet
(Tsfati & Capella, 2003).
Those who mistrust mainstream media news may seek out alternatives for their
political knowledge store. Tsfati (2010), however, found that those with higher levels of
skepticism do not get their political news from the Internet as an alternative to
mainstream news. In short, they seek out Internet news less than those who have higher
levels of trust.
In a study regarding the relationship between media trust and news attention,
Williams (2012) examined the idea of different types of media trust by medium. For
example, Williams (2012) found higher age, more education, and greater income to be
statistically significant predictors of trust of the news reporters themselves when it comes
to newspapers. Higher income was the largest predictor of those who placed trust in
television news networks specifically (Williams, 2012). Audience attention to Internet
news did not show any statistically significant levels with regard to trust of news
reporters (like newspapers), trust of news institutions (like television), or trust of news
information content from traditional media and the Internet (like television). In short, for

44
the newspaper medium, some people place their trust in the reporter; and when it comes
to television, some people place their trust in the institution. The Internet, as a news
medium, does not show any predictors of media trust with regard to news reporters, news
corporations, or news content.
Kohring and Matthes (2007) argue that previous research on trust in news media
is varied because researchers utilize credibility constructs to operationalize trust.
Research regarding trust in news media has previously drawn on credibility in much of its
research (e.g., Kiousis, 2001; Tsfati, 2010; Tsfati & Cappella, 2003). Tsfati (2010), for
example, adapts McGrath’s (1986) news credibility scale. To counter these conceptual
issues, Kohring and Matthes (2007) developed and validated a multidimensional scale to
operationalize and examine trust in news media as a second order hierarchical factor
comprised of four first order factors including: “trust in selectivity of topics,” “trust in
selectivity of facts,” “trust in the accuracy of depictions,” and “trust in journalistic
assessment” (Kohring & Matthes, 2007, p. 239). The authors argue their
multidimensional scale is valid for assessing trust in news media. Their only caveat is
that each of their first order factors included four latent factors that all concerned the
issue of unemployment. Therefore, research utilizing union members as the sample, for
example, should test an issue salient to union members.
The Present Study
Framing
Framing tells us that a particular issue (and candidate, in this case) is given focus
to the exclusion of other information (Entman, 1989). Frames highlighted in exposure to
certain news media frames make certain attributes salient (Rill & Davis, 2008). The

45
Labor Paper, for example, ran a six-part comparison of Quinn vs. Rauner. A majority of
the articles in this series focused on how Bruce Rauner, and right-to-work and anti-union
laws would be a poor choice for labor (Stevens, 2014a). Some of the articles did
acknowledge Quinn’s popularity problem because he tried to cut public labor benefits to
help balance the Illinois budget (Stevens, 2014a; Stevens 2014b; Stevens, 2015). A
majority of the newspaper articles, however, focused on the negative aspects of Rauner
and the positive aspects of Quinn. Therefore, we should expect labor media to frame
union-endorsed candidates positively; the non-union-endorsed, and right-to-work and
anti-union laws negatively. The research on framing leads to the following hypotheses:
H1a: Union members’ exposure to labor union media will positively predict a
favorable evaluation of the union-endorsed candidate.
H1b: Union members’ exposure to labor union media will negatively predict a
favorable evaluation of the non union-endorsed Republican candidate.
H2: Union members’ exposure to labor union media will negatively predict a
favorable evaluation of right-to-work and anti-union laws.
H3a: Exposure to labor union media will positively predict awareness of
union’s endorsements.
H3b: Awareness of labor union’s endorsements will positively predict a
favorable evaluation of the union-endorsed candidate.
H3c: Awareness of labor union’s endorsements will negatively predict a
favorable evaluation of the non-union-endorsed Republican candidate.
H3d: Awareness of labor union’s endorsements will negatively predict a
favorable evaluation of right-to-work and anti-union laws.

46
Channel Repertoire
Individuals select a few channels to access media content out of popularity and
convenience, which constitutes their channel repertoire (e.g., Ferguson, 1992; Trilling &
Schoenbach, 2014). The proliferation of mediums and channels available for
consumption has changed the landscape of traditional and new media outlets. The
research on channel repertoire leads to the following research questions:
RQ1: What is the most used medium of news for labor union members?
RQ2: Will the relationship between labor union media exposure on candidate
evaluation differ according to whether participants get their labor news
mostly from traditional labor media (e.g., labor newspapers), or mostly
from new labor media (e.g., social media labor channels on Facebook and
Twitter) sources?
Trust in News and Labor Media
Labor union members’ political knowledge is mainly acquired from the mass
media (Blume, 1970; Bruno, 2000; Juravich, 1986; Juravich & Shergold, 1988).
Unfortunately, the research we have on trust in labor union media is dated; and the media
landscape is now completely different, which may change which sources are currently
most trusted. Previous research showed that political information is trusted the least
when it is from non-union newspapers (Blume, 1970). The most trusted source of
political information is the union paper (Blume, 1970; Cook 1975/1978; Juravich &
Shergold, 1988) and union leadership (Cook, 1975/1978; Juravich, 1986; LeRoy, 1990)
even though union membership cited union sources the least for their political
information. Additionally, telephone banks were also not trusted by union members

47
(Cook, 1975/1978), even though telephone banks were routinely one of the ways union
leadership communicates information to union members regarding candidates (LeRoy,
1990). This led to the following research questions and hypotheses regarding trust in
news and labor media:
RQ3: What is the most trusted medium of news for labor union members?
H4a: Trust in labor union media will positively predict a favorable evaluation of
the union-endorsed candidates.
H4b: Trust in labor union media will negatively predict a favorable evaluation
of the non union-endorsed Republican candidate.
RQ4: The relationship between labor union media exposure and a positive
evaluation of the labor-endorsed candidate will be moderated by trust in
labor union media, such that the relationship will be strongest among those
who are most trusting of labor union media.
Labor Union Membership
What do we know to be true about union members and their voting behavior?
Union members are more likely than non-union members to believe that voting is
important (Delaney et al., 1988), and more likely than non-union members to register to
vote (Delaney et al., 1988, Juravich & Shergold, 1988). Therefore, union members are
more likely to vote than nonunion members (Delaney et al., 1988; Juravich & Shergold,
1988). The exception is in primary elections (Delaney et al., 1988). Union membership,
however, does not guarantee higher turnout at the polls (Delaney et al., 1988; Juravich &
Shergold, 1988; Sousa, 1993).
48
Regardless of turnout, union membership does have an impact on vote choice
(Sousa, 1993). Of those who vote, union members and union households are more likely
to vote Democratic (Bok & Dunlop, 1970; Campbell et al., 1960; Chang, 2001;
Kaufmann, 2008; LeRoy, 1990; Nie et al., 1979/1999; Sousa, 1993). Additionally,
“union members who were active in their union, held leadership positions, and had
contact with their union were significantly more likely to vote for the candidate endorsed
by their union” (Juravich & Shergold, 1988, p. 383). While the core of LeRoy’s (1990)
study also illuminates the rise of issue voting over bloc voting, “unions’ influence on
voting behavior is considerably more complex than earlier analyses have suggested”
(Juravich & Shergold, 1988, p. 383). Early research echoes current findings, including
“The union effect on the union respondent’s voting behavior is enhanced the more
closely attached the respondent feels to unions, the more he accepts the legitimacy of
union political activity, and the more he perceives a clear voting preference” (Wolfe,
1969/1978, p. 379).
Union members who are more active (Campbell, 1960; Juravich, 1986; Juravich
& Shergold, 1988), serve as a union leader (Juravich & Shergold, 1988), and more
informed (Blume, 1970; Campbell, 1960; Juravich, 1986; Lewis-Beck, 2008), are more
likely to support a union-endorsed candidate. This led to the following research question
on involvement in the labor union:
RQ5: Will the relationship between labor union media exposure and positive
evaluations of union-endorsed candidates be strongest among those who
are closely involved in their union (i.e., union members who participate in
the labor union through a variety of labor-sponsored activities)?

49
Labor Union Communication
Clearly, there is evidence to show how union membership affects vote choice
(i.e., Chang, 2001; Sousa, 1993), although there is still a conceptual definition problem.
For example, more research is necessary to understand the voting differences among
union members and union households. Much of the research to date discusses the two
groups almost interchangeably. Little research acknowledges there might even be a
problem when considering these independent variables as the same when there may be
some characteristic differences (Delaney et al., 1990; Sousa, 1993). Therefore, this study
will focus on labor union members specifically.
This current chapter examined the idea of labor union communication, and labor
union voting behavior in the context of media framing, channel repertoire, and media
trust. More specifically, the goal is to understand labor union media influence with an
emphasis on the local coverage of political candidates by labor media. Clearly, the
frames created by labor union media work to tell a story that resonates with union
members if they select labor union media for their repertoire of political information. Of
course, labor union media promote a specific frame for their own best interest. This bias,
however, is not unlike findings in traditional news media where at times Republicans are
presented more favorably than Democrats and vice versa (Entman, 2010). Our earlier
cable news example explicates the day-to-day framing bias that exists in traditional news
media (Meyer, 2014; “The GOPs Summer of Benghazi Coverage”, 2014). In summary,
this chapter illuminates research from political science and communication related to
labor union media and subsequent voting behavior. The theoretical foundation was
established with framing. The next chapter will explicate the study’s method.
50
CHAPTER THREE: METHOD
This chapter will describe the participants, design, procedures, measures, and data
analysis in order to answer the research questions and hypotheses from Chapter Two.
Specifically, this chapter will explicate the need for a survey of labor union members.
Participants
This study attempts to understand labor union communication from labor union
media and its use on forming vote choice of labor union membership. To understand
labor union communication impact, if any, on labor unions’ members and their
subsequent vote choice, it is important to conceptually define and study actual labor
union members, and not just members of a union household, as previous research in this
area has used (Delaney et al., 1990; Sousa, 1993). Only active and retired union
members, and not members of union households, were asked to participate in the present
study. Members of various unions affiliated with the Illinois AFL-CIO (ILAFL-CIO)
were selected to survey because of potential access to 51 different labor unions affiliated
with the ILAFL-CIO, which represents almost 900,000 union members, their jurisdiction
within the boundaries of the State of Illinois, and their endorsement of political
candidates (“2014 General Election Endorsements,” 2014).
Because state and local unions were hesitant to allow survey of their membership
through direct mailing lists due to confidentiality and privacy concerns, I conducted a
nonrandom, purposive, network (snowball) sample of active and retired members of a
labor union in the State of Illinois. Recruitment of the initial sample was three-fold.
First, I posted a link to the survey on my personal Facebook account to recruit volunteers,
in addition to asking my personal network to share the link to the survey on their

51
Facebook accounts. Specifically, I posted “*If you belong to a labor union, or you are
retired from a labor union in the State of Illinois, you qualify to take this survey for my
research at the University of Missouri. *If you complete the survey now you may enter
for a chance to win one of four gift cards to Bass Pro Shop, Amazon, or a company of
your choice. *For a chance to win, complete by April 15th for $500, by April 20th for
$300, by April 25th for $150, or by April 30th for $50. *Friends: please like, comment,
tag, and share to spread the word to find volunteers to take this study, because you want
to help your friend complete her dissertation and graduate. This survey is confidential.
*Thanks all! Anji”. Second, I telephoned my personal network of labor union friends and
family I know from AFSCME (American Federation of State, County and Municipal
Employees), AFT (American Federation of Teachers), IBEW (International Brotherhood
of Electrical Workers), IBT (International Brotherhood of Teamsters), IFT (Illinois
Federation of Teachers), INA (Illinois Nurses Association), SMWIA (Sheet Metal
Workers International Association), UA (United Association of Journeymen and
Apprentices of the Plumbing, Pipefitting, and Sprinkler Fitting Industry of the U.S. and
Canada), and UFCW (United Food & Commercial Workers) to request that they
complete the survey, and invite their friends and family to complete the survey. I
provided each person a paper copy or electronic link based on his or her preference, and
their preference for how they wanted to reach out to their personal network. Finally, I
asked various labor leaders around the state, including the Illinois AFL-CIO, if they
would be willing to share the electronic link with their membership (see APPENDIX for
the survey).

52
A power analysis is appropriate to determine an appropriate sample size (Cohen,
1988). G*Power was used to calculate a total sample size of at least 191 with an effect
size of 0.2, an error probability of 0.05, with a power of 0.80 (Faul, Erdfelder, Lang, &
Buchner, 2007). There were a total of 201 labor union members who completed the
survey.
There were more male (68.2%) participants than females (31.8%) (see Table 1).
The majority of the participants were overwhelmingly White or European American or
Middle Eastern American or North African American (94.0%, N = 189) compared to
those who selected more than one race including White, and all other races (6.0%, N =
12) (see Table 1). All of the participants completed high school (100%, N = 201) while a
majority of participants had some college (78.6%, N = 158) and at least 29.9% (N = 60)
graduated from an apprenticeship training program (see Table 1). A majority of the
participants earned between $50,000 and $75,000 (34.3%, N = 69), which only accounted
for their individual income, and did not include their household income (see Table 1).
The age of the participants ranged from 22 to 75 years of age with an average age
of almost 46 years (M = 45.89, SD = 10.92); and active union members (86.1%)
participated at a higher rate than retired union members (13.9%) (see Table 2 and Table
3). The length of time the union members were part of their union ranged from 1 to 54
years with an average of almost 17 years (M = 16.64, SD = 11.57) spent in the union (see
Table 2).
Just over 77% (N = 155) of union members were aware of Pat Quinn’s
endorsement for Governor, and just over half of the union members (50.2%, N = 101)
voted for the incumbent and union-endorsed Democrat Pat Quinn (see Table 4).

53
Politically, the majority, which is just over a quarter of the sample, self-identified
as a Democrat (25.4%, N = 51) followed by Independent (16.9%, N = 34) (see Table 5).
The majority of members self-identified as a “moderate” in Economic (39.3%, N = 79),
Social (35.3%, N = 71), and Overall Political Ideology (39.3%, N = 79) (See Table 5).
There were 21 different unions represented from 57 different locals with a
majority from AFSCME (24.4%, N = 49), IBEW (16.4%, N = 33), International
Brotherhood of Teamsters (IBT) (13.4%, N = 27), and the Illinois Education Association-
National Education Association (IEA-NEA) (10.9%, N = 22) (see Table 6). There were
51 different job classifications with 79 different job titles ranging from Actor to Working
Foreman Clerk (see Table 7).
Participants had union membership from 29 different Illinois cities as far North as
Rockford, as far South as Pinckneyville, as far West as Macomb, and as far East as
Chicago. A majority of union membership was from Peoria (33.3%, N = 67), Centralia
(23.9%, N = 48), Springfield (9.0%, N = 18), East Peoria (8.5%, N = 17), Galesburg
(6.0%, N = 12), and Chicago (5.5%, N = 11) (see Table 8).
Design and Procedures
The purpose of this study was to examine local union membership use of labor
media, and whether union members trust labor media in their subsequent decision to vote
for the union-endorsed candidate. To this end, the author employed a cross-sectional
survey design of active and retired members of labor unions affiliated with the ILAFL-
CIO to examine labor union membership exposure to labor union media frames, their
channel repertoire, trust of labor media, and how union membership may impact vote
choice following an election.

54
Procedures. The author distributed both a paper survey with an option to fill out
the survey in an electronic version for convenience to participants, and an electronic link
to the survey via social media. The paper copies were distributed to labor union members
known by the researcher throughout the State of Illinois. The electronic version was for
those who were not interested in completing the paper version of the survey, and for
distribution on Facebook accounts associated with labor unions in the State of Illinois
using a link from Qualtrics software. A unique number was attached to each paper copy
of the survey to prevent duplicate entries from someone filling out both the paper version,
and the online version. If someone filled out the electronic version, he or she was asked
to supply this unique number before beginning the survey if they received a paper copy,
or asked to enter “the number 9 followed by the time (for example, 90720 or 91243)” if
they clicked on the link with no paper copy. The author asked that all paper copies of the
surveys be returned regardless of paper or electronic completion.
The author applied for and received exempt approval from the IRB. The author
began distribution of the survey in April 2015 via paper and electronic link, and received
197 complete responses during the month of April. There were four surveys completed
during the first week of May 2015.
All participants were given an informed consent indicating that participation was
voluntary prior to taking the survey. The paper version and the electronic version
included the informed consent on the first page of the survey prior to the survey
questions. Returning the paper copy of the survey by hand, or through a secure URL,
was an indication of consent. The questions were ordered the same for both the paper
version and the electronic version to maintain consistency among participants.

55
Respondents were offered an incentive to complete the survey in a timely manner by
having a choice to enter a drawing to receive one of four gift cards to Bass Pro Shop,
Amazon, or a company of their choice.
Any identifying information received to enroll in the drawing was separated and
discarded prior to any analysis of data. Four participants were chosen randomly to
receive a reward according to the date of submission once the identifying information
was separated from responses. Winners were all notified via telephone by June 8, 2015.
The following labor union members won a gift card to a company of their choice: $500
(Lowe’s)- “General Services” from IBT (International Brotherhood of Teamsters) Local
627 in Peoria, Illinois; $300 (Amazon)- “Firefighter” from IAFF (International
Association of Firefighters) Local 4186 in Glenview, Illinois; $150 (Amazon)-
“Journeyman Steamfitter” from UA (United Association of Union Plumbers, Fitters,
Welders, and Service Tech’s) Local 353 in Peoria, Illinois; $50 (Gander Mountain)-
“Correctional Officer” from AFSCME (American Federation of State, County, and
Municipal Employees) Local 203 in Centralia, Illinois. All four individuals completed a
W9 form in order to receive their gift card. All four W9 forms and gift cards were
procured and delivered to participants in June 2015.
Measures
The survey consisted of items to measure labor union member media exposure,
their medium and channel repertoire, trust of media, evaluation/awareness of union-
endorsed candidates and right-to-work and anti-union laws, in addition to, union
involvement, and demographics. The survey is included in the Appendix.

56
Independent variables.
Union member exposure to labor union media. Labor union media are defined
as any media that are distributed on behalf of the labor union or federation that affiliates
with labor unions with the intent to inform and/or persuade members of the union
regardless of medium or channel. The variable labor union media exposure was
measured by using a combined mean score of each type of channel specific to labor
where a higher number indicates greater exposure to labor union media. The index
includes two newspaper sources (i.e., local labor union, national labor union) in addition
to 16 items from Internet channels that were specific to labor members from Facebook,
Twitter, YouTube, and websites (i.e., local labor union, national labor union, ILAFL-
CIO, and AFL-CIO). There were 18 items in total to measure union member exposure to
labor union media. See Table 9 for the combined mean and standard deviation.
Mediums. Mediums are defined as the means through which individuals access
news content. Mediums were measured using a combined mean score of each type of
channel by medium (i.e., newspaper, radio, television, and internet) excluding “other”,
wherein a higher number indicates greater frequency of use by each medium using a 7-
point Likert scale (i.e., 0 = Never, 1 = Almost never (a few times a year), 2 = Rarely (once
a month or less), 3 = Sometimes (a few times per month), 4 = Often (once a week), 5 =
Frequently (a few times per week), 6 = Every Day) to denote the frequency they used
each medium to access news content. See Table 9 for means and standard deviations.
Channels. Channels are conceptually defined as the location of content by type
after an individual chooses a medium. Channels were measured by scoring the types of
channels within each medium using a 7-point Likert scale (i.e., 0 = never, 1 = Almost

57
never (a few times a year), 2 = Rarely (once a month or less), 3 = Sometimes (a few times
per month), 4 = Often (once a week), 5 = Frequently (a few times per week), 6 = Every
Day) to denote the frequency they used each type of channel to access news content
within each medium. See Table 10 for means and standard deviations.
The types of newspaper channels included were narrowed down from a list drawn
from any newspaper that serves, and originates from, inside the State of Illinois, and
newspapers with a national presence outside of Illinois, including those relevant to labor.
The newspapers examined for inclusion were derived from a list of members and
nonmembers maintained by the Illinois Press Association (IPA). The IPA is a statewide
newspaper association that represents over “450 daily and weekly newspapers” (“A Brief
History of the IPA,” n.d.). Survey fatigue prevents listing these papers individually.
Types of newspaper channels within the medium of newspaper were measured by
stating “I read from the following types of newspapers to get political information” where
a higher number indicates more frequent use (i.e., Local Daily (like Journal Star) that
delivers a physical newspaper 5-7 days per week, Local Weekly (like The Weekly
Messenger) that delivers a physical newspaper at least one day per week, State Daily that
may be purchased locally (like The Chicago Tribune), National Daily (like The New York
Times) that have a national presence that may be purchased locally, and newspapers that
are specific to labor (i.e., Your Local Labor Union Paper (like The Labor Paper), Your
National Labor Union Paper (like The Electrical Worker)). There were seven types of
newspaper channels in total, including the “Other Newspaper (Write In)” category. The
other category was not included in the analysis.

58
Radio channels selected broadly included the types of radio channels by terrestrial
(i.e., Local AM Radio (like 1470 WMBD-AM), Regional AM Radio (like 890 WLS-AM),
Local FM Radio (like Public Radio 89.9 WCBU), Satellite Radio (like Sirius XM),
Internet Streamed Radio, and Other Radio (Write In)) regardless of the specific
frequency or channel the participant may use to access news content. Radio channels
were measured by stating, “I listen to the following types of radio channels to get
political information” where a higher number indicates more frequent use. There were
six radio channels in total. The other category was not included in the analysis.
Reducing channels to only measure local AM, regional AM, local FM, satellite,
and internet streamed radio was determined after all commercial and noncommercial
AM, and FM radio stations that primarily program a news, talk, and/or informational
format including sports talk stations that operate inside the State of Illinois were found.
In addition, “Class A” AM stations that operate in the State of Illinois that have
transmitter power at 50,000 watts to reach our participants were found using the Federal
Communications Commission (FCC) AM and FM Query Broadcast Station Search (“AM
Query Broadcast Station Search,” n.d.; “FM Query Broadcast Station Search,” n.d.). The
appropriate stations were found by removing all records for the federal allotment (FA)
channels that are either licensed or vacant. Next, I removed all license applications for
construction permits (CP) to build translators (FX) for rebroadcast, and low power-FM,
and full service FM stations or applications for a license not currently broadcasting. I
added call letters for the remaining records of translators used to rebroadcast other
stations, added formats from each stations’ website, and deleted any format that did not
match the operational definition. The FCC does not collect data on the format, and so

59
each station’s website was reviewed to determine if the format met the operational
definition for inclusion. The FCC query lists 130 licensed AM, and 954 licensed FM
stations in the State of Illinois, which prevented each station from being included due to
survey fatigue. There is not a regional FM equivalent to AM because FM radio waves do
not travel as far as AM radio waves.
Television channels included all types of commercial broadcast (i.e., ABC, CBS,
NBC, and FOX), noncommercial broadcast (i.e., PBS), and the main 24-hour cable and
satellite channels (i.e., Al Jazeera America, BBC World, CNN, FOX News Channel,
MSNBC, and other television). Television channels were measured by stating, “I watch
the following types of television channels to get political information” where a higher
number indicates more frequent use. There were 11 television channels in total.
The network affiliate or the noncommercial equivalent was chosen to measure
traditional broadcast channels. Television channels that offer news as part or all of their
programming, and were available in the State of Illinois with strong and moderate
broadcast signals using the digital television (DTV) reception maps from the FCC, were
included (“DTV Reception Maps,” n.d.). The broadcast stations were found using the
FCC TV Query Broadcast Station Search (“TV Query Broadcast Station Search,” n.d.),
which yielded 202 stations. Only affiliates from those stations that had strong or
moderate signal strength that met the criteria were included. I did not include any of the
secondary or tertiary digital channels available, because these digital channels on
traditional broadcast carry limited to no news/information programs. This limited the
number of broadcast channels to five.

60
Channels on cable television and satellite systems were found by identifying the
companies that serve the communities within the State of Illinois using the Cable
Operations and Licensing System (COALS) from the FCC (“Cable Operations and
Licensing System,” n.d.). There were 91 cable companies that served the State of
Illinois. Nationally, DirectTV and DISH provide a majority of the satellite service. I
examined nine websites at random to view the channel line-up of each cable and satellite
company to identify their news-only channels. Not all cable and satellite companies had
every news channel available; however, 16 channels were found among all cable and
satellite providers that offer either 24-hour news, or news as a distinct part of their
programming (i.e., Al Jazeera America, BBC World, Bloomberg TV, CNBC, CNBC
World, CNN, CNN International, C-Span, C-Span 2, C-Span 3, ESPN News, FOX
Business News, FOX News Channel, Headline News, MSNBC, WGN-TV). This group
was further reduced to include only the main 24-hour news services of cable networks
that offer a variety of news programs with hosts, and did not specifically focus on
financial, sports, or historical news, and includes limited to no coverage of entertainment
news (i.e., Al Jazeera America, BBC World, CNN, FOX News Channel, and MSNBC).
Participants were also able to choose “other” where they could write in a TV channel not
included. In total, there are 42 broadcast, cable, and satellite television channels that
were originally included, and then reduced to five to reduce the potential for survey
fatigue. A total of 11 television channels were measured including the “Other TV (Write
In)” category. The other category was not included in the analysis.
Internet channels selected broadly included the places where labor union members
may access news content using some of the more popular sources by today’s standard of

61
news on the Internet (Facebook (any page with news), Twitter (any feed with news),
Websites (any site with news), and YouTube (any channel with news), in addition to 16
Internet channels that were specific to labor members from Facebook, Twitter, YouTube,
and union-affiliated websites (i.e., Your Local Labor Union, Your National Labor Union,
Illinois AFL-CIO, and AFL-CIO).
Internet channels were measured by stating, “I use the following types of Internet
sites to get political information” where a higher number indicated more frequent use.
There were 4 total types of Internet channels, and 16 specific to labor. Participants were
also able to choose “other” where they could write in an Internet channel not included.
There are 21 channels total. The other category was not included in the analysis.
Media Trust. Media trust is conceptually defined as the degree to which an
individual believes the veracity of the source of a medium or channel including selection
of topics, facts, accuracy, and journalistic assessment regarding a specific topic. Media
trust was measured using a single item question to examine medium trust, channel trust,
and labor media trust. Kohring and Matthes (2007) argue it is important to measure trust
and not credibility, therefore, I chose an exemplary statement that is in line with previous
statements in the survey (“I trust this source of media for political information”).
Medium trust was measured using a combined mean score for the trust of each
channel within each medium (i.e., newspaper trust, radio trust, television trust, and
Internet trust), and channel trust was measured using all previous listed individual
channels (i.e., from newspapers, radio, television, and Internet) by using a 7-point Likert
scale where a higher level of agreement denotes a greater level of trust (i.e., 0 =
Absolutely Untrustworthy, 1 = Untrustworthy, 2 = Slightly Untrustworthy, 3 = Neutral, 4

62
= Slightly Trustworthy, 5 = Trustworthy, 6 = Absolutely Trustworthy), and excludes those
who did not use the channels pairwise. There were 49 items used to measure media trust.
See Table 9 and Table 11 for means and standard deviations.
Labor media trust was measured using a combined mean score of all labor-
specific channels of media trust that mirrors the channels used to measure union member
exposure to labor union media, and excludes those who did not use the channels pairwise.
There were 18 items used to measure labor media trust. Labor media trust was also used
as a moderator variable.
Dependent variables.
Evaluation of candidates. Evaluation of candidates is conceptually defined as a
positive or negative feeling an individual has about a particular candidate. Respondents
were asked to respond to the following statement, “Rate your feelings on the following
three candidates.” The author used a “feeling thermometer” adapted from Benoit,
McKinney, and Holbert (2001) to measure labor union member evaluations of each of the
three Illinois gubernatorial candidates (i.e., 0-100 = Bruce Rauner – Republican, 0-100 =
Pat Quinn – Democrat (union-endorsed candidate), and 0-100 = Chad Grimm –
Libertarian) who were listed on the November 4, 2014 ballot (“Illinois Voters Guide,”
n.d.). Specifically, respondents were able to rate each of the three candidates from 0 to
100, where 0 represents a “cold, unfavorable” or negative rating, and 100 signifies a
“warm, favorable” or positive rating (Benoit, McKinney, & Holbert, 2001). See Table 9
for means and standard deviations.
Evaluation of right-to-work and anti-union laws. Evaluation of right-to-work,
and anti-union laws is conceptually defined as a positive or negative feeling an individual

63
has about right-to-work and anti-union legislation that propose limiting labor union
influence. Respondents were asked to respond to the following statement, “Rate your
feelings on the following two laws.” A combined score of the variable evaluation of
right-to-work and anti-union laws using a feeling thermometer to evaluate both right-to-
work, and anti-union legislation was used. Right-to-work laws (i.e., 0-100 = “How do
you feel about laws that remove the requirement to pay union dues for representation (by
public, private, and partial-public sector unions)?”), and anti-union laws (i.e., 0-100 =
“How do you feel about laws that limit the ability of unions to collectively bargain for
benefits (by public, and partial-public sector unions)?”) was measured by asking
respondents to rate each of the two statements using a feeling thermometer from 0 to 100,
where 0 represents a “cold, unfavorable” or negative rating, and 100 signifies a “warm,
favorable” or positive rating (Benoit, McKinney, & Holbert, 2001). See Table 9 for
means and standard deviations.
Awareness of union endorsements. Awareness of union endorsements is
conceptually defined as an awareness of labor union leadership’s (i.e., local union,
ILAFL-CIO, AFL-CIO) support for a particular candidate (i.e., Pat Quinn – Democrat).
Awareness was measured by the question “Which candidate did your labor union endorse
for governor of the State of Illinois?” with the nominal choices of each candidate for
governor (i.e., 0 = “I do not know who was endorsed,” 1 = “Bruce Rauner – Republican,”
2 = “Pat Quinn – Democratic,” or 3 = “Chad Grimm – Libertarian”). As a matter of
record, the ILAFL-CIO, in addition to local unions around the state, endorsed Pat Quinn
– Democrat for governor. This variable was dummy-coded to indicate whether
participants were either aware (i.e., 1), or unaware (i.e., 0) of the labor endorsement for

64
Quinn. Awareness of union endorsements was also used as an independent variable. See
Table 4 for descriptive statistics.
Moderator variables.
Traditional Labor versus New Labor Media Channels. To measure use of
traditional labor versus new labor media channels I calculated a difference score from the
combined mean score of traditional labor media channels minus the combined mean
score of social media labor channels, where a positive number indicated use of more
traditional labor media channels, and a negative number indicated use of more new labor
media channels.
Traditional labor media channels are conceptually defined as organs of labor
communication that are established as the official form of labor union communication for
labor union members (i.e., local and national labor newspapers). Traditional labor media
channels include a combined mean score of the two labor channels.
New labor media channels are conceptually defined as organs of labor
communication that supplement traditional labor channels, and include social media
accounts from Facebook and Twitter created for members of labor unions in, and readily
available to members and nonmembers, where respondents may view video, interact,
like, share, and comment on issues. New labor media channels included a combined
mean score of 8 channels that were specific to labor members, and included their local
union, national/international union, State of Illinois AFL-CIO, and the AFL-CIO. See
Table 9 for means and standard deviations.
Union involvement. Union involvement is conceptually defined as union
members who participate in the labor union through a variety of labor-sponsored

65
activities. Union involvement is an important measure to consider because members who
participate, make the union a priority, and support activities sponsored by the union on a
more frequent basis may feel closer to their union, and may indicate their willingness to
support issues and candidates endorsed by union leaders. Past research on those who are
more active in union activities (e.g., Campbell et al., 1960; Juravich, 1986; Juravich &
Shergold, 1988) or take leadership positions (e.g., Juravich & Shergold, 1988) are more
likely to vote for the union endorsed candidate.
Union involvement was measured using a combined score of 5 items on 7-point
Likert scales to create a union involvement index created by the author where a higher
number indicates more involvement (i.e., 0 = Never, 1 = Almost Never (less than 10% of
the time), 2 = Rarely (about 30% of the time), 3 = Sometimes (about 50% of the time), 4 =
Often (about 70% of the time), 5 = Frequently (about 90% of the time), 6 = Every Time).
For example, “How often do you attend regularly scheduled union meetings?”; “How
often do you make attending a union meeting a priority if a special vote has been
called?”; “How often do you participate in union-sponsored community activities (e.g.,
marching in the labor day parade, participating in blood drives, boycotting do not
patronize stores, etc.)?”; “How often do you participate in union-sponsored labor
activities (e.g., picketing a non-union job site, manning phone banks to get out the vote,
attending an awards banquet, etc.)?”; “How often do you volunteer/run to participate in
a leadership position to serve the members of the union (e.g., as an officer or member of
the board, committees, teaching, etc.) when positions are available?”. Inter-Item
correlation coefficients revealed all positive values, which indicates that the items are
likely all measuring the same underlying characteristics. Cronbach’s Alpha for the

66
Political Ideology Scale (α = .89) indicates good internal consistency. See Table 12 for
means and standard deviations.
Control variables. Control variables include union involvement, party
identification, party ideology, religiosity, and demographics.
Party Identification. I asked participants to respond to the following question,
“Which political party do you most identify with?” Party identification was measured
using a 7-point Likert scale (i.e., 1 = Strong Democrat, 2 = Democrat, 3 = Leaning
Democrat, 4 = Independent, 5 = Leaning Republican, 6 = Republican, 7 = Strong
Republican). See Table 5 for the mean and standard deviation.
Political Ideology. I asked participants to respond to the following statement,
“Consider your political ideology for the following.” Political ideology was measured
using a combined score of economic, social, and overall political ideology to create a
three-item political ideology index using 7-point Likert scales (i.e., 1 = Highly Liberal, 2
= Liberal, 3 = Slightly Liberal, 4 = Moderate, 5 = Slightly Conservative, 6 =
Conservative, 7 = Highly Conservative). Inter-Item Correlation revealed all positive
values, which indicates that the items are likely all measuring the same underlying
characteristics. Cronbach’s Alpha for the Political Ideology Scale (α = .94) indicates
good internal consistency. See Table 5 for means and standard deviations.
Religiosity. Religiosity was measured as a control variable exclusively because
those that are more religious are more likely to vote for the conservative and/or
Republican candidate. Religiosity was measured using a combined score of four-items
on 7-point Likert scales (i.e., 0 = Never, 1 = Almost never (a few times a year), 2 = Rarely
(once a month or less), 3 = Sometimes (a few times per month), 4 = Often (once a week),

67
5 = Frequently (a few times per week), 6 = Every Day) to create a religiosity index
adapted from Golan and Day (2010) where a higher number indicates a higher level of
religiosity. I asked participants to respond to the following statement, “Consider your
religion for the following.” The items included “How much guidance does religion
provide you in your day-to-day life?”; “How often do you attend religious services?”;
“How often does religion play an important role in your life?”; and “How often do you
pray?”. Inter-Item Correlation revealed all positive values, which indicates that the items
are likely all measuring the same underlying characteristics. Cronbach’s Alpha for the
Religiosity Scale (α = .92) indicates good internal consistency. See Table 12 for means
and standard deviations.
Demographics. Demographics include age (i.e., In years); gender (i.e., 0 = Male,
1 = Female); Individual Income (i.e., 1 = 25K or Less, 2 = 25-50K, 3 = 50-75K, 4 = 75-
100K, 5= 100-125K, or 6 = Greater than 125K); race (i.e., 1 = American Indian or Alaska
Native, 2 = Asian, 3 = Black or African American or Haitian American, 4 = Native
Hawaiian or Other Pacific Islander, 5 = White or European American or Middle Eastern
American or North African American, 6 = Other, 7 = Hispanic or Latino (of any race));
education (i.e., 1 = High School Diploma or GED Equivalent, 2 = Some College, 3 =
Associate’s Degree, 4 = Bachelor’s Degree, 5 = Master’s Degree, 6 = Graduate of
Apprenticeship Training Program, 7 = Doctorate’s Degree). The categories used were
adapted from the ANES Guide to Public Opinion and Electoral Behavior (ANES, n.d.),
and the U.S. Census Bureau (“Race,” n.d.). This variable was dummy-coded to indicate
whether participants’ race was either White (i.e., 1), or non-White only (i.e., 0).

68
Additionally, age, vote choice, and status of their labor union membership were not used
as control variables, but are included for additional demographic information about the
participants. See Table 1 and Table 2 for descriptive statistics.
Vote Choice. Vote choice was measured by asking, “Whom did you vote for
Governor for the State of Illinois in the November 4, 2014 election?” (i.e., 0 = I am not
registered to vote; 1 = I did not vote, but I am registered to vote; 2 = Bruce Rauner –
Republican, 3 = Pat Quinn – Democrat, 5= Chad Grimm – Libertarian, or 5 = other-
Write In). This variable was dummy-coded to indicate whether participants voted for the
union endorsed candidate Quinn (i.e., 1), or they did not vote for Quinn (i.e., 0), and a
second variable was dummy-coded to indicate whether participants voted for the non-
union-endorsed Republican candidate Rauner (i.e., 1), or they did not vote for Rauner
(i.e., 0). See Table 4 for descriptive statistics.
Labor Union Membership and Specialty. Labor union membership was
measured by asking the following questions: “What is your membership status in your
union?” (i.e., 0 = Not a Member, 1 = Fair Share Member, 2 = Member, 3 = Retired). See
Table 3 for descriptive statistics. “What city is your local union located?” (i.e., Write In).
See Table 8 for descriptive statistics. “What city do you have union meetings?” (i.e.,
Write In). “Are you considered a student, apprentice, trainee, non-tenured, journeyman,
tenured, or certified?” (i.e., 0 = None, 1 = Student, 2 = Apprentice, or 3 = Trainee, 4 =
Non-tenured, 5 = Journeyman, 6 = Tenured, 7 = Certified). “Which labor union do you
belong to?” (i.e., Write In, for example, AFSCME, IBEW). See Table 6 for descriptive
statistics. “What is your local number?” (i.e., Write In number). “What is your council
number (if you have one)?” (i.e., Write In number, or 0 if you do not have one). “What is

69
your union classification?” (i.e., Write In. For example, RC6, Inside Wireman, etc.).
“What is your job title in the labor union?” (i.e., Write In For example, Captain,
Journeyman Electrician, etc.). See Table 7 for descriptive statistics. “How many years
have you been a member of your labor union?” (i.e., Write In. Round up to the nearest
year). See Table 2 for descriptive statistics.
Data Analysis
The following statistical analyses were used to answer the hypotheses and
research questions with SPSS. Andrew Hayes’ PROCESS (moderation/mediation) macro
was used where indicated (Hayes, 2013).
H1a: Hierarchical multiple regression was used to examine whether the
continuous independent variable (IV) union member (exposure to labor union media)
will positively predict the continuous dependent variable (DV) a favorable (evaluation of
the union-endorsed candidate) while controlling for the following covariates (gender,
race, income, party identification, political ideology, and religiosity).
H1b: Hierarchical multiple regression was used to examine whether the
continuous independent variable (IV) union member (exposure to labor union media)
will negatively predict the continuous dependent variable (DV) a favorable (evaluation of
the non-union-endorsed Republican candidate) while controlling for the following
covariates (gender, race, income, party identification, political ideology, and religiosity).
H2: Hierarchical multiple regression was used to examine whether the continuous
IV union member (exposure to labor union media) will negatively predict the continuous
DV a favorable (evaluation of right-to-work and anti-union laws) while controlling for

70
the following covariates (gender, race, income, party identification, political ideology,
and religiosity).
H3a: Hierarchical logistic regression was used to examine whether the continuous
IV union member (exposure to labor union media) will positively predict
the categorical DV (awareness of union’s endorsements) while controlling for the
following covariates (gender, race, income, party identification, political ideology, and
religiosity).
H3b: Hierarchical multiple regression was used to examine whether the
categorical IV (awareness of union’s endorsements) will positively predict the continuous
dependent variable (DV) a favorable (evaluation of the union-endorsed candidate) while
controlling for the following covariates (gender, race, income, party identification,
political ideology, and religiosity).
H3c: Hierarchical multiple regression was used to examine whether the
categorical IV (awareness of union’s endorsements) will negatively predict the
continuous dependent variable (DV) a favorable (evaluation of the non-union-endorsed
Republican candidate) while controlling for the following covariates (gender, race,
income, party identification, political ideology, and religiosity).
H3d: Hierarchical multiple regression was used to examine whether the
categorical IV (awareness of union’s endorsements) will negatively predict the
continuous DV a favorable (evaluation of right-to-work and anti-union laws) while
controlling for the following covariates (gender, race, income, party identification,
political ideology, and religiosity).

71
RQ1: Repeated measures ANOVA was used to examine the difference between
the continuous IV (mediums) of news (i.e., including newspapers, radio, television, and
Internet) for labor union members.
RQ2: PROCESS Model 1 with 1000 bootstrap samples was used to estimate if the
relationship between the continuous IV (exposure to labor union media) and the
continuous DVs (candidate evaluation: Rauner, Quinn, and Grimm) is moderated by
whether participants get their labor news mostly from the DV (traditional labor media)
or the DV (new labor media) while controlling for the following covariates (gender, race,
income, party identification, political ideology, and religiosity).
RQ3: Repeated measures ANOVA was used to examine the difference between
the continuous IV (most trusted mediums) of news (i.e., including newspapers, radio,
television, and Internet) for labor union members.
H4a: Hierarchical multiple regression was used to examine whether the
continuous IV (trust in labor union media) will positively predict a continuous DV
(evaluation of the union-endorsed candidate: Quinn) while controlling for the following
covariates (gender, race, income, party identification, political ideology, and religiosity).
H4b: Hierarchical multiple regression was used to examine whether the
continuous IV (trust in labor union media) will negatively predict a continuous DV
(evaluation of the non-union-endorsed Republican candidate: Rauner) while controlling
for the following covariates (gender, race, income, party identification, political
ideology, and religiosity).
RQ4: PROCESS Model 1 with 1000 bootstrap samples was used to estimate if the
relationship between the continuous IV (exposure to labor union media) and a continuous

72
DV (evaluation of the labor-endorsed candidate: Quinn) is moderated by (trust in labor
union media), such that the relationship will be strongest among those who are most
trusting of labor union media, while controlling for the following covariates (gender,
race, income, party identification, political ideology, and religiosity).
RQ5: PROCESS Model 1 with a 1000 bootstrap samples was used to estimate if
the relationship between the continuous IV (exposure to labor union media) and a
continuous DV (evaluation of the labor-endorsed candidate: Quinn) is moderated by
(closely involved in their union), such that the relationship will be strongest among those
who are more involved in their union, while controlling for the following covariates
(gender, race, income, party identification, political ideology, and religiosity).

73
CHAPTER FOUR: RESULTS
This chapter presents the results of hypotheses and research questions presented
in Chapter Two using the statistical methods outlined in Chapter Three. Preliminary
analyses were conducted for each regression to ensure no violation of the assumptions of
normality, linearity, multicollinearity, and homoscedasticity, by examining the regression
line of best fit using a scatterplot. No violations of normality, linearity, or variance of the
residuals were detected. The variance inflation factor (VIF) was also examined and
reported for each regression model to detect multicollinearity, and no variables had a
value greater than 10, which indicates the variance in the predictor variable is not due to
large correlations with other variables in the model.
Framing
H1a: Union members’ exposure to labor union media will positively predict a
favorable evaluation of the union-endorsed candidate.
Hierarchical multiple regression was used to assess the ability of exposure to
labor union media to positively predict a favorable evaluation of the union-endorsed
candidate after controlling for gender, race, income, party identification, political
ideology, and religiosity. The means and standard deviations for the independent and
dependent variables can be found in Table 9. The correlation coefficients can be found in
Table 13.
Gender, race, income, party identification, political ideology, and religiosity were
entered at Step 1, explaining an adjusted R2 = 28.3%, of the variance in evaluation of the
union-endorsed candidate, F (6,194) = 14.19, p = .001. After entry of exposure to labor

74
union media at Step 2, the total variance explained by the model was 28.1% (adjusted
R2), F (1,193) = .21, p = .65. Exposure to labor union media (β = .03, p = .65) explained
an additional .1%, which is negligible, and not statistically significant. The hypothesis
was not supported. The beta coefficients are presented in Table 14.
In the final model, party identification (β = -.38, p = .001), political ideology (β =
-.17, p = .049), religiosity (β = .16, p = .012), and gender (β = -.15, p = .022) were
statistically significant predictors of evaluations of Quinn. Overall, those who identified
more with the Democratic Party compared to those who identified more with the
Republican Party, and those who identified more as a liberal compared to those who
identified as conservative, were more likely to report a favorable evaluation of Pat Quinn,
the union-endorsed candidate. Those who identified as more religious also positively
predicted a favorable evaluation of Pat Quinn. Alternately, women viewed Pat Quinn
less favorably compared to men.
H1b: Union members’ exposure to labor union media will negatively predict a
favorable evaluation of the non-union-endorsed Republican candidate.
Hierarchical multiple regression was used to assess the ability of exposure to
labor union media to negatively predict a favorable evaluation of the non-union-endorsed
Republican candidate after controlling for gender, race, income, party identification,
political ideology, and religiosity. The means and standard deviations for the
independent and dependent variables can be found in Table 9. The correlation
coefficients can be found in Table 15.
Gender, race, income, party identification, political ideology, and religiosity were
entered at Step 1, explaining an adjusted R2 = 45.0%, of the variance in evaluation of the

75
union-endorsed candidate, F (6,194) = 28.25, p = .001. After entry of exposure to labor
union media at Step 2, the total variance explained by the model was 46.4% (adjusted
R2), F (1,193) = 6.29, p = .01. Exposure to labor union media (β = -.14, p = .01)
explained an additional 1.7%, which is a small amount according to Cohen (1988). The
hypothesis was supported. The beta coefficients are presented in Table 16.
In the final model, party identification (β = .50, p = .001), followed by gender (β =
.22, p = .001) and labor exposure, were statistically significant. Overall, those who
identified more with the Democratic Party compared to those who identified more with
the Republican Party, and those exposed to more labor media, positively predicted a
negative evaluation of Bruce Rauner, the non-union-endorsed Republican candidate.
Additionally, women viewed Bruce Rauner as more favorable compared to men.
H2: Union members’ exposure to labor union media will negatively predict a
favorable evaluation of right-to-work and anti-union laws.
Hierarchical multiple regression was used to assess the ability of exposure to
labor union media to negatively predict a favorable evaluation of right-to-work and anti-
union laws. The means and standard deviations can be found in Table 9. The correlation
coefficient can be found in Table 17.
Gender, race, income, party identification, political ideology, and religiosity were
entered at Step 1, explaining an adjusted R2 = 14.1%, of the variance in evaluation of the
right-to-work and anti-union laws, F (6,194) = 6.45, p = .001. After entry of exposure to
labor union media at Step 2 the total variance explained by the model was 13.8%
(adjusted R2), F (1,193) = .36, p = .55. Exposure to labor union media (β = -.04, p = .55)

76
explained an additional .2%, which is negligible, and not statistically significant. The
hypothesis was not supported. The beta coefficients are presented in Table 18.
In the final model, only gender (β = .25, p = .001) was statistically significant.
Overall, women viewed right-to-work and anti-union laws more favorably compared to
men.
H3a: Exposure to labor union media will positively predict awareness of labor
union’s endorsements.
Hierarchical logistic regression was used to assess the ability of exposure to labor
union media to positively predict awareness of labor union’s endorsed candidates after
controlling for gender, race, income, party identification, political ideology, and
religiosity. The means and standard deviations for the independent variable can be found
in Table 9, and descriptive statistics of the dependent variable can be found in Table 4.
Gender, race, income, party identification, political ideology, and religiosity were
entered at Step 1, explaining a Nagelkerke R2 = 18.2%, of the variance in evaluation of
the union-endorsed candidate, χ2 (6, N = 201) = 25.61, p = .001. After entry of exposure
to labor union media at Step 2, the total variance explained by the model was 19%
(Nagelkerke R2), χ2 (7, N = 201) = 26.88, p = .001. Prediction success overall was 78.1%
(98.1% for aware, and 10.9% for unaware). The Wald criterion for exposure to labor
union media (Wald = 1.17, p = .280) had an odds ratio of 1.43, which was not statistically
significant. The hypothesis was not supported. The coefficients are presented in Table
19.
In the final model, party identification (Wald = 10.39, p = .001) with an odds ratio
of .60 was the only variable that was statistically significant. Overall, those who

77
identified more with the Republican Party were less aware of labor union’s endorsement
compared to those who identified more with the Democratic Party, who were more aware
of the union endorsement.
H3b: Awareness of union’s endorsements will positively predict a favorable
evaluation of the union-endorsed candidate.
Hierarchical multiple regression was used to assess the ability of awareness of
union’s endorsements to positively predict a favorable evaluation of the union-endorsed
candidate after controlling for gender, race, income, party identification, political
ideology, and religiosity. Descriptive statistics for the independent variable can be found
in Table 4, and the means and standard deviations for the dependent variable can be
found in Table 9. The correlation coefficients can be found in Table 20.
Gender, race, income, party identification, political ideology, and religiosity were
entered at Step 1, explaining an adjusted R2 = 28.3%, of the variance in evaluation of the
union-endorsed candidate, F (6,194) = 14.19, p = .001. After entry of awareness of
union’s endorsements (i.e., 0 = unaware, 1 = aware) at Step 2, the total variance
explained by the model was 28.1% (adjusted R2), F (1,193) = .23, p = .63. Awareness of
labor union endorsement (β = .03, p = .63) explained an additional .1%, which is
negligible and not statistically significant. The hypothesis was not supported. The beta
coefficients are presented in Table 21.
In the final model, party identification (β = -.38, p = .001), party ideology (β = -
.17, p = .046), religiosity (β = .16, p = .01), and gender (β = -.15, p = .02) were
statistically significant predictors of candidate evaluations of Pat Quinn. Overall, those
who identified as Democrats and Liberals were more favorable to the union-endorsed

78
candidate Quinn compared to Republicans and Conservatives. In addition, those who
considered themselves more religious held a more favorable view of Quinn. Women held
a less favorable view of Quinn compared to men.
H3c: Awareness of union’s endorsements will negatively predict a favorable
evaluation of the non-union-endorsed Republican candidate.
Hierarchical multiple regression was used to assess the ability of awareness of
union’s endorsements to negatively predict a favorable evaluation of the non-union-
endorsed Republican candidate after controlling for gender, race, income, party
identification, political ideology, and religiosity. Descriptive statistics for the
independent variable can be found in Table 4, and the means and standard deviations for
the dependent variable can be found in Table 9. The correlation coefficients can be found
in Table 22.
Gender, race, income, party identification, political ideology, and religiosity were
entered at Step 1, explaining an adjusted R2 = 45.0% of the variance in evaluation of the
non-union-endorsed Republican candidate, F (6,194) = 28.25, p = .001. After entry of
awareness of union’s endorsements at Step 2, the total variance explained by the model
was 45.9% (adjusted R2), F (1,193) = 4.25, p = .041. Awareness of union’s endorsement
(β = -.11, p = .04) explained an additional 1.1%, which is smaller than typical according
to Cohen (1988). The hypothesis was supported. The beta coefficients are presented in
Table 23.
In the final model, party identification (β = .50, p = .001), followed by gender (β =
.23, p = .001) and awareness of the union-endorsed candidate, were statistically
significant. Overall, those who identified more with the Democratic Party compared to

79
those who identified more with the Republican Party negatively predicted a favorable
evaluation of the non-union-endorsed Republican candidate, Bruce Rauner. Additionally,
women viewed Bruce Rauner as more favorable compared to men. Finally, those who
were aware of the union-endorsement held a more negative evaluation of the non-labor
union-endorsed Republican candidate, Bruce Rauner.
H3d: Awareness of union’s endorsements will negatively predict a favorable
evaluation of right-to-work and anti-union laws.
Hierarchical multiple regression was used to assess the ability of awareness of
union’s endorsements to negatively predict a favorable evaluation of right-to-work and
anti-union laws after controlling for gender, race, income, party identification, political
ideology, and religiosity. Descriptive statistics for the independent variable can be found
in Table 4, and the means and standard deviations for the dependent variable can be
found in Table 9. The correlation coefficients can be found in Table 24.
Gender, race, income, party identification, political ideology, and religiosity were
entered at Step 1, explaining an adjusted R2 = 14.1%, of the variance in evaluation of the
right-to-work and anti-union laws, F (6,194) = 6.45, p = .001. After awareness of union’s
endorsements at Step 2, the total variance explained by the model was 20.5% (adjusted
R2), F (1,193) = 16.64, p = .001. Awareness of union’s endorsements (β = -.27, p = .001)
explained an additional 6.6%, which is smaller than typical according to Cohen (1988).
The hypothesis was supported. The beta coefficients are presented in Table 25.
In the final model, awareness of union’s endorsements, followed by gender (β =
.24, p = .001) and political ideology (β = .21, p = .021), were statistically significant.
Overall, those who were aware of the endorsement by the labor union were less favorable

80
to right-to-work and anti-union laws. Alternately, women were more favorable to right-
to-work and anti-union laws compared to men. Finally, those that considered themselves
more conservative were more favorable to the laws compared to those who considered
themselves liberal.
Channel Repertoire
RQ1: What is the most used medium of news for labor union members?
A repeated-measures ANOVA, with Huynh-Feldt correction, was conducted to
assess whether there were differences between the average use of four mediums used for
news (i.e. newspaper, radio, television, and Internet). Results indicate there are
differences between mediums used for news. The following assumptions were tested: (a)
independence of observations, (b) normality, and (c) sphericity. Independence of
observations and normality were met. The assumption of sphericity was violated. Thus,
the Huynh-Feldt correction was used. Results indicated that participants used mediums
differently, and these differences were statistically significant, F (2.92, 583.95) = 62.98, p
= .001, partial eta2 = .24. The means and standard deviations for the mediums are
presented in Table 9, and individuals channels used to comprise the mediums can be
found in Table 10. Examination of these means suggests that participants primarily used
television (M = 1.85, SD = 1.08), then newspapers (M = 1.62, SD = .97), followed by
radio (M = 1.23, SD = 1.19), and Internet (M = .81, SD = .79) for political information. A
polynomial contrast indicated that there is a statistically significant linear trend, F (1,
200) = 68.37, p = .001, partial eta2 = .26. There was also a statistically significant
quadratic trend, F (1, 200) = 30.15, p < .001, partial eta2 = .13, and cubic trend, F (1, 200)
= 88.94, p = .001, partial eta2 = .31. The graph indicates the linear trend is strongest (see

81
Figure 1). Further examination of pairwise comparison show the difference among
mediums is statistically significant at (p = .001) for all except television and newspapers,
which are statistically significant at (p = .02).
RQ2: Will the relationship between labor union media exposure on candidate
evaluation differ according to whether participants get their labor news
mostly from traditional labor media (e.g., labor newspapers), or mostly from
new labor media (e.g., social media labor channels on Facebook and Twitter)
sources?
A moderation analysis with 1000 bootstrap samples was conducted using Process
Model 1. Each model provides a regression of the predictor (labor union exposure) and
its ability to predict the outcome variable (evaluations of each candidate: Rauner, Quinn,
or Grimm), and whether their labor media use (from a difference score to indicate either
greater use of traditional or new labor media) moderates this relationship while
controlling for gender, race, income, party identification, party ideology, and religiosity.
The means and standard deviations can be found in Table 9.
The total variance explained by the Rauner model was R2 = 48.5%, F (9, 191) =
22.97, p = .001. While the overall model was statistically significant, the interaction
effect of exposure to labor union media and use of more traditional or new labor media
was not significant. See Table 26 for the unstandardized coefficients. The total variance
explained by the Quinn model was R2 = 31.4%, F (9, 191) = 10.92, p = .001. Again,
while the overall model was statistically significant, the interaction effect of exposure to
labor union media and use of more traditional or new labor media was not significant.
The total variance explained by the Grimm model was R2 = 7.9%, F (9, 191) = 1.49, p =

82
.15. Neither the overall model Grimm model, nor the interaction effect of exposure to
labor union media and use of more traditional or new labor media was statistically
significant. Thus, the relationship between labor media exposure and candidate was not
dependent on whether the union members used more traditional media than new media.
However, some of the covariates exhibited main relations on candidate
evaluations. For example, exposure to labor union media (b = -.29, p = .008), gender (b =
14.60, p = .0004), and party identification (b = 8.59, p = .001) were all statistically
significant predictors of evaluations of Rauner. In short, labor union members’ exposure
to labor union media predicted a negative view of Rauner. Women had a more positive
view, and men held a more negative view of Rauner. Additionally, those who identified
their political party as Republican held a more positive view of Rauner.
Gender (b = -10.33, p = .03), party identification (b = -6.55, p = .0001), and
religiosity (b = .67, p = .02) were all statistically significant regarding Quinn. In short,
women held a more negative view of Quinn compared to males, and those who identified
as Republicans held a more negative view of Quinn compared to Democrats. Alternately,
those who identified as more religious held a more positive view of Quinn.
Party identification (b = 3.88, p = .02) was the only statistically significant
predictors regarding of the evaluation of Grimm. Those who identified as Republicans
held a more favorable view of Grimm compared to those who identified as Democrats.
Media Trust
RQ3: What is the most trusted medium of news for labor union members?
A repeated-measures ANOVA, with Huynh-Feldt correction, was conducted to
assess whether there were differences between the average trust of four mediums used for
83
news (i.e. newspaper, radio, television, and Internet). Results indicate there are
differences between the trusted mediums used for news. The following assumptions
were tested: (a) independence of observations, (b) normality, and (c) sphericity.
Independence of observations and normality were met. The assumption of sphericity was
violated. Thus, the Huynh-Feldt correction was used. Results indicated that participants
trusted mediums differently, and these differences were statistically significant, F (2.73,
351.61) = 3.19, p = .03, eta2 = .024. The means and standard deviations for the media
trust mediums are presented in Table 9, and individual channels used to comprise the
media trust mediums can be found in Table 11. Examination of these means suggests
that participants trusted newspapers (M = 3.59, SD = 1.12) more than television (M =
3.50, SD = 1.05), followed by radio (M = 3.49, SD = 1.08), and Internet (M = 3.26, SD =
1.09) for political information. A polynomial contrast indicated that there is a
statistically significant linear trend, F (1, 129) = 6.61, p = .011, eta2 = .049. Further
examination of pairwise comparison show the only statistically significant difference is
between newspapers and the Internet (p = .035).
H4a: Trust in labor union media will positively predict a favorable evaluation of the
union-endorsed candidate.
Hierarchical multiple regression was used to assess the ability of trust in labor
union media to positively predict a favorable evaluation of the union-endorsed candidate
after controlling for gender, race, income, party identification, political ideology, and
religiosity. The means and standard deviations for the independent and dependent
variables can be found in Table 9. The correlation coefficients can be found in Table 27.
84
Gender, race, income, party identification, political ideology, and religiosity were
entered at Step 1, explaining an adjusted R2 = 28.0%, of the variance in evaluation of the
union-endorsed candidate, F (6,198) = 12.29, p = .001. After entry of trust in labor union
media at Step 2 the total variance explained by the model was 30.4% (adjusted R2), F
(1,167) = 6.68, p = .011. Thus, H4a was supported. Trust in labor union media
explained an additional 2.7%, which is smaller than typical according to Cohen (1988).
The results of the HRM are presented in Table 28. In the final model, party identification
(β = -.34, p = .001), followed by gender (β = -.15, p = .031), religion (β = .16, p = .021),
and trust in labor union media (β = .18, p = .011) were statistically significant predictors
of evaluations of Pat Quinn.
In addition, women held a more negative view of Quinn than men. Those who
identified as Republicans also held a negative view of Quinn. Alternately, those who had
higher religiosity score, and those who trust labor media held a more positive evaluation
of Quinn, the labor union-endorsed candidate.
H4b: Trust in labor union media will negatively predict a favorable evaluation of
the non-union-endorsed Republican candidate.
Hierarchical multiple regression was used to assess the ability of trust in labor
union media to negatively predict a favorable evaluation of the non-union-endorsed
Republican candidate after controlling for gender, race, income, party identification,
political ideology, and religiosity. The means and standard deviations for the
independent and dependent variables can be found in Table 9. The correlation
coefficients can be found in Table 29.
85
Gender, race, income, party identification, political ideology, and religiosity were
entered at Step 1, explaining an adjusted R2 = 44.7%, of the variance in evaluation of the
non-union-endorsed Republican candidate, F (6,198) = 24.46, p = .001. After entry of
trust in labor union media at Step 2 the total variance explained by the model was 44.9%
(adjusted R2), F (1,167) = 1.48, p = .23. Thus, H4b was not supported. Trust in labor
union media explained an additional .5%, which is negligible and not statistically
significant. The results of the HRM are presented in Table 30. In the final model, party
identification (β = .53, p = .001), followed by gender (β = .24, p = .001) were statistically
significant.
Specifically, those who identified as Republicans held a more positive view of
non-union-endorsed Republican candidate Rauner, and those who identified as
Democrats held a more negative view of Rauner. Women held a more positive view of
Rauner compared to men.
RQ4: The relationship between labor union media exposure and a positive
evaluation of the labor-endorsed candidate will be moderated by trust in
labor union media, such that the relationship will be strongest among those
who are most trusting of labor union media.
A moderation analysis was conducted using Process Model 1 with 1000 bootstrap
samples. The model provides a regression of the predictor (labor union media exposure)
and its ability to predict the outcome variable (evaluations of Quinn), and whether
participants’ trust in labor union media moderates this relationship, while controlling for
gender, race, income, party identification, political ideology, and religiosity. The results
demonstrate that trust in labor union media did not moderate the relationship between

86
exposure to labor union media and a positive evaluation of the labor-endorsed candidate,
Pat Quinn. The total variance explained by the model was R2 = 31.1%, F (9, 165) =
11.82, p = .001. While the overall model was statistically significant, the interaction
effect between exposure to labor union media and trust in labor union media was not
significant. Individual variables that contributed to the overall model and were
statistically significant included party identification (b = -5.42, p = .002), and trust in
labor union media (b = 4.18, p = .048). In short, those who identified as Republicans
were less favorable to Quinn, and those who had greater trust in labor union media were
more favorable to Quinn. Means and standard deviations for the independent and
dependent variables can be found in Table 9, and the results can be found in Table 31.
Labor Union Involvement
RQ5: Will the relationship between labor union media exposure and positive
evaluations of union-endorsed candidates be strongest among those who are
closely involved in their union (i.e., union members who participate in the
labor union through a variety of labor-sponsored activities)?
A moderation analysis was conducted using Process Model 1 with 1000 bootstrap
samples. The model provides a regression of the predictor (labor union exposure) and its
ability to predict the outcome variable (evaluations of Quinn), and whether their union
involvement moderates this relationship while controlling for gender, race, income, party
identification, political ideology, and religiosity. The results demonstrate that union
involvement did not moderate the relationship between exposure to labor union media
and a positive evaluation of the labor-endorsed candidate, Pat Quinn. The total variance
explained by the model was R2 = .31 or 31.2%, F (9, 191) = 11.50, p = .001. While the

87
overall model was statistically significant, the interaction effect between exposure to
labor union media and union involvement was not significant. Individual variables that
contributed to the overall model and were statistically significant were gender (b = -9.48,
p = .046), party identification (b = -6.59, p = .001), and religiosity (b = .62, p = .03). In
short, women, and those who identified as Republicans were less likely to give the union-
endorsed candidate a positive evaluation. Those who were more religious were more
favorable to Quinn. Means and standard deviations for the independent and dependent
variables can be found in Table 9 and Table 12, and the results can be found in Table 32.

88
CHAPTER FIVE: DISCUSSION
This chapter presents the discussion of hypotheses and research question results
presented in Chapter Four. In addition, the theoretical implications, limitations, future
directions, and conclusion are provided.
Framing
H1a: Union members’ exposure to labor union media will positively predict a
favorable evaluation of the union-endorsed candidate.
Exposure to labor union media did not positively predict a favorable evaluation of
the union-endorsed Democratic candidate, Pat Quinn. While those who identified as
Democrats and liberals held a favorable opinion of Quinn, he did not fare as well among
the women in this sample.
The finding that exposure to labor union media did not positively predict a
favorable evaluation of Quinn does not mean that exposure to labor union media does not
have an influence on labor union membership (see H1b). Rather, the influence of
exposure to labor union media may be small, and the positive frame from labor media
was not enough to overcome the intense dislike for Quinn after he championed and
signed legislation to reduce pension benefits of state workers as one way to overcome a
“105 billion unfunded pension liability” (Arnold, 2014, para. 8). Positive frames of
Quinn in labor union media were often qualified by negative frames acknowledging that
labor union members did not always agree on 100 percent of his policies (Stevens,
2014a). It seems as though the Democrats and liberals voted for him according to party
lines, and they did so because the alternative was to vote for the Republican gubernatorial

89
candidate, Bruce Rauner, who vocally spoke out against union labor, or the lesser known
candidate Chad Grimm. Party identification of labor union members, primarily aligning
with Democrats, had a stronger impact when favorability of the labor-endorsed candidate
Quinn was low. Ultimately, the labor union media need to argue for the importance of
the union communication as a source of information about candidates, stressing the
importance of the election for the union, regardless of the labor union member’s feeling
toward their political party or candidate. In the case of Quinn’s popularity problem, it
may be prudent for labor union leadership to not only acknowledge the low favorability
of the candidate, but also include counterclaims providing justification for the importance
of a labor union member’s decision to support the labor union-endorsed candidate. It
may also be important for labor union media to consistently emphasize the positive
frames of their candidate, and avoid criticizing their candidate leading up to an election.
H1b: Union members’ exposure to labor union media will negatively predict a
favorable evaluation of the non-union-endorsed Republican candidate.
The influence of exposure to labor union media on evaluations of Rauner was
observed even after controlling for the variance in evaluations of Rauner that is explained
by gender and party identification. Ultimately, mere exposure to labor union media
yielded an unfavorable evaluation of the non-union-endorsed candidate with a small
effect size.
The negative frame of Rauner provided by the labor union had the intended effect.
Many of the labor channels communicated a consistent and sustained dialogue of how
Rauner was not a good choice for labor unions, and ran multi-issue comparisons of
Rauner versus Quinn (e.g., The Labor Paper). Ultimately, almost 29% of the labor union

90
members ended up voting for Bruce Rauner, with just over 50% of the labor union
members voting for Pat Quinn. Thus, the message about Rauner not being a great
candidate for labor unions was somewhat effective; however, over 16% of the labor
union members did not turn out to vote (i.e., either not registered to vote, or did not make
it to the polls).
Labor union leaders should consider emphasizing the importance of getting to the
polls to vote in their labor media just as much as pointing out a candidate’s flaws, and
providing a negative frame of the non-union-endorsed candidate. Ultimately, Illinois
labor union members had an opportunity to persuade over 16% of their non-voting
membership to get to the polls. Labor union leaders could come up with an incentive for
their members who are registered to vote. In addition, labor union leaders could expand
voting education by communicating how to request an absentee ballot, or how to find a
polling location that allows early voting. Labor leaders could also poll their membership,
and publish the results in aggregate. Perhaps exposure to labor union media regarding
how their local union will be voting may persuade members to vote, by showing that
every vote counts.
H2: Union members’ exposure to labor union media will negatively predict a
favorable evaluation of right-to-work and anti-union laws.
Exposure to labor union media did not negatively predict a favorable evaluation
of right-to-work and anti-union laws. Additionally, labor union females viewed the laws
more favorably compared to their male counterparts. This may be explained by the
earlier findings in the first hypothesis where more female union members identified as
Republicans compared to Democrats.

91
Feelings about right-to-work laws (M = 20.13; SD = 31.21) out of a 100-point
“feeling thermometer” scale were viewed as more favorable than anti-union laws (M =
10.84, SD = 23.26). This can be partially explained by wording. The question about
right-to-work laws asked about how they felt about laws that remove the requirement to
pay union dues for representation (since this is the definition of right-to-work laws). It is
important to note that this wording was intentional. The goal was to remove bias from
the term right-to-work. Again, right-to-work may sound positive to those who are
uninformed. Instead, the goal was to have the union member consider the actual issues.
At the end of the day, a union member may like the benefits of the union, but may dislike
paying the union dues.
It is possible that exposure to labor union media did not have an impact because
the issues regarding these laws may be communicated as secondary to the communication
about the candidates. This would mean that individuals are exposed to fewer union
frames about these laws. It may be important for labor unions to add a section to their
communication channel that includes and defines right-to-work and anti-union laws on a
consistent basis. This way, as new members are added to the rank-and-file, they may
have an opportunity to be exposed to the information.
H3a: Exposure to labor union media will positively predict awareness of labor
union’s endorsements.
Exposure to labor union media did not positively predict awareness of labor
union’s endorsements. This finding could indicate that labor union media did not
explicitly frame their endorsement in labor media. That is, the labor union may have
focused the labor media frame on the issues, and the candidates. Labor union media may

92
not have reiterated the endorsement after the initial announcement. Party identification
was the only variable that was statistically significant, as Democrats were more likely to
be aware of the union endorsement compared to Republicans.
H3b: Awareness of union’s endorsements will positively predict a favorable
evaluation of the union-endorsed candidate.
Similar to H1a (i.e., exposure to labor union media), simply being aware of the
labor union’s endorsement did not yield a favorable evaluation of Quinn. Also similar to
H1a, party identification (i.e., Democrats were favorable), political ideology (i.e., liberals
were favorable), and gender (i.e., females were not favorable) were all statistically
significant as control variables. Additionally, those with higher religiosity scores held
more favorable views of Quinn.
H3c: Awareness of union’s endorsements will negatively predict a favorable
evaluation of the non-union-endorsed Republican candidate.
The influence of awareness of union’s endorsements on evaluations of Rauner
was observed even after controlling for the variance in evaluations of Rauner, which is
explained by party identification and gender. Ultimately, awareness of union’s
endorsement yielded an unfavorable evaluation of the non-union-endorsed candidate
consistent with H1b (i.e., exposure to labor union media) with a small effect size. This
finding makes it clear that it is important for labor union leaders to communicate their
endorsement to the membership. The labor union media seem to be effective in
communicating whom not to vote for, but if the candidate is very unlikeable, the
members may not automatically cast a vote for the endorsed candidate either.

93
H3d: Awareness of union’s endorsements will negatively predict a favorable
evaluation of right-to-work and anti-union laws.
The influence of awareness of union’s endorsements on evaluations of right-to-
work and anti-union laws was observed even after controlling for the variance in
evaluations of the laws that is explained by political ideology and gender. Ultimately,
awareness of union’s endorsement yielded an unfavorable evaluation of the non-union-
endorsed candidate unlike H2 (i.e., exposure to labor union media) with a small effect
size. Simple exposure to labor union media is not effective. Labor union members must
also be aware of the union’s endorsements, which may mean they are more actively
engaged in politics, and the endorsement message was more salient. These findings may
also mean that frequency of communication on an issue espoused by the Democratic
Party or labor union leadership might increase awareness.
Channel Repertoire
RQ1: What is the most used medium of news for labor union members?
The most used medium of news for labor union members is television, followed
by newspapers, radio, and Internet (see Figures 3 and 4 for means and standard deviations
of the top 20 most used channels, and Table 10 for means and standard deviation of all
channels used). Blume’s (1970) study found labor union members relied on the daily
newspaper (26%), local television (16%), and their local labor paper (11%) as “important
sources of political information” (p. 141). Of course, the Internet was not a factor in
1970, nor was the proliferation of television channels. The availability of many
television channels makes it easy to include more television channels as part of the

94
overall media diet of a labor union member. The current study shows that television is
the overall most used medium of news for labor union members.
Network television, despite the competition from cable, is still a mainstay for
political information. NBC (M = 3.08, SD = 2.07) had the second highest mean, ABC (M
= 2.66, SD = 1.99) fourth, and CBS (M = 2.56, SD = 2.00) sixth. Less than a quarter of
the sample, however, cite frequent use of network television (NBC (21.4%, N = 43),
ABC (18.4%, N = 37), and CBS (15.4%, N = 31)). Alternately, about a quarter of the
sample never get their news from network television (NBC (20.9%, N = 42), ABC
(25.4%, N = 51), and CBS (26.9%, N = 54)).
A comparison of broadcast networks to cable networks reveals CNN (M = 2.47,
SD = 2.06) seventh, MSNBC (M = 1.85, SD = 1.92) eleventh, and FOX News Channel
(M = 1.70, SD = 2.04) thirteenth. Those who cite frequent use of CNN (12.9%, N = 26)
leads MSNBC (8.5%, N = 7), and FOX News Channel (8.0%, N = 16). Those who avoid
cable network news are greater than those who avoid traditional broadcast television
news (CNN (30.8%, N = 62), MSNBC (42.8%, N = 86), and FOX News Channel
(50.2%, N = 101)). Even public broadcaster PBS (M = 1.37, SD = 1.79) sees very
infrequent use (7.5%, N = 15), and those who avoid PBS (51.7%, N = 104) are similar to
those who avoid the cable news networks. Greater use of broadcast television news may
be partially explained by the fact that network television is still free. You do not have to
purchase a cable package to receive the programming, and therefore, is still in wider use
due to access and availability in all markets. In short, labor union members are still
getting their news through traditional media, so labor union leadership should focus their
publicity through those traditional channels.

95
The daily newspaper (M = 3.39, SD = 2.01) is still the primary channel of choice
for labor union members. Labor union members in this study who used the daily
newspaper frequently (a few times per week) (21.4%, N = 43) were greater than those
who used the paper daily (17.4%, N = 35). A full 12.9% (N = 26) of labor union
members did not use the local daily newspaper at all. Comparatively, the largest use of
the local labor union paper was once per month (25.9%, N = 52), while 28.9% (N = 58)
never use the local labor union paper for political information. This difference is largely
explained through circulation. Many of labor unions only publish their papers once per
month, or once every other month. Although, over a quarter of the labor union members
do not use their labor union paper at all for political information, and finding out why
may be of importance to labor union leaders.
Local FM radio (Public Radio) had the eighth largest mean (M = 2.28, SD = 2.36),
with a majority of labor union members citing daily (15.9%, N = 32) use, while greater
percentages of labor union members avoid public radio (42.3%, N = 85). Local AM
radio had the seventeenth largest mean (M = 1.25, SD = 1.88); and 10.4% (N = 21) tune
in to local AM radio a few times per month, with a majority (60.2%, N = 121) avoiding
AM radio.
The Internet is also a place where labor union members get their political
information including Facebook (any page with news) (M = 2.91, SD = 2.43) third, and
websites (any page with news) (M = 2.64, SD = 2.30) fifth. Those who use Facebook
every day (23.4%, N = 47) is greater than those who use Facebook frequently (12.4%, N
= 25) for political information. Comparatively, 32.8% (N = 66) never use Facebook for
at all for political information. Those who use the website frequently (14.4%, N = 29),

96
and every day (15.4%, N = 31) is still less than those who never (33.3%, N = 67) use
websites to get political information.
Those who cite frequent (8.0%, N = 16) and daily (1.5%, N = 3) use of their local
labor union on Facebook is much lower than those who never (57.2%, N = 115)
access/use their labor union on Facebook for political information. The local labor union
Facebook page had the ninth highest mean (M = 2.02, SD = 2.16), which was larger than
the national labor union Facebook page (M = 1.30, SD = 1.90) at sixteenth. Of those who
use their local labor union Facebook page for political information only 9.5% (N = 19)
cite frequent use; and 9.5% (N = 19) cite daily use, with a majority (44.3%, N = 89) who
never use their local labor union on Facebook for political information. Of those who use
their national labor union on Facebook for political information only 5.5% (N = 11) cite
frequent use; and 5.5% (N = 11) cite daily use, with a majority of 59.2% (119) who never
use their national labor union on Facebook for political information.
The local labor union website had the eighteenth highest mean (M = 1.23, SD =
1.75), larger than use of the national labor union website (M = 0.91, SD = 1.54), which
did not make the top 20 channels used for political information. Only 8.0% (N = 16) cite
frequent use of their local labor union website, and only 3.5% (N = 7) cite frequent use of
their national labor union website. Those who never use their local labor union website
(57.2%, N = 11), and those who never use their national labor union website (66.2%, N =
133) greatly exceeds those who use the websites regularly. Labor union members used
neither Twitter nor YouTube for political information. There are many local labor unions
that do not have an official Facebook page. Local members, with no oversight or
interaction with their labor leaders, run some local labor union Facebook pages. There is
97
a larger percentage of labor unions that run a Facebook page at the national level. The
personalized information about job calls or union meetings or even grievances may be
easily shared on the local page. Labor leaders should consider managing a local union
Facebook page to present their information in a readily accessible manner to their union
members who are using Facebook. The labor union members who use Facebook do so
frequently. This presents an opportunity for the labor union to engage and communicate
with their members on a regular basis.
In all, labor union members use a variety of mediums, which include an even
larger variety of channels. These findings are similar to Trilling and Schoenbach (2014)
who argue that individuals use media that are popular and easily accessible. Indeed,
labor union members use few sources out of many choices. There was not one channel
among the four mediums that dominated the others. This may be important to consider
when labor leaders are trying to reach their membership. Labor leadership needs to
consider that their members’ choice of media is just as varied as their membership. In
short, when communicating with their membership, labor leaders should consider the
widespread use of traditional channels (e.g., the local daily newspaper, and broadcast
television), in addition to Facebook and websites.

98
RQ2: Will the relationship between labor union media exposure on candidate
evaluation differ according to whether participants get their labor news
mostly from traditional labor media (e.g., labor newspapers), or mostly from
new labor media (e.g., social media labor channels on Facebook and Twitter)
sources?
A moderation analysis did not reveal a statistically significant interaction effect
between labor media exposure and the primary source of their labor news. This finding
may indicate that it does not necessarily matter whether the labor union member was
exposed to labor news via traditional ways (e.g., local labor union newspaper) or new
ways (e.g., local labor union on Facebook). It may matter, however, that union members
actually trust the source of their political information (see results of H4a & H4b).
A direct effect was statistically significant for Rauner showing exposure to labor
union media predicted a less favorable rating of Rauner with a small effect size. This is
consistent with H1b (i.e., exposure to labor union media). In addition, gender played an
important role for both Rauner and Quinn. The predominately Republican females had
more positive feelings about Rauner (R), and more negative feelings about Quinn (D).
There was no indication that exposure to labor union media made a difference among
females regarding Grimm (L). This may be because Grimm was a lesser-known
candidate, and there was not as much media exposure regarding Grimm’s candidacy.
Party identification produced expected results. Those who identified their
political party as Republican held a more positive view of Rauner, and a more negative
view of Quinn. Additionally, those who identified as Republicans held a more favorable
view of Grimm after exposure to labor union media; compared to those who identified as

99
Democrats who did not view Grimm as favorable. This may be partially explained by the
fundamental issue central to Libertarians, that of less government, an issue which may
also be appealing to some of the more conservative Republicans. Finally, religiosity was
only important for Quinn. Those who had higher levels of religiosity were more
favorable toward Quinn, similar to H3b (i.e., awareness of union’s endorsements).
Ultimately, while there was a main effect for exposure to labor union media
predicting a less favorable view of Rauner (similar to H1b), there was no main effect for
Quinn (similar to H1a), and there was no main effect for Grimm. The first model was
statistically significant for both Rauner and Quinn, but not Grimm. There was no
statistical significance in the second model. In short, candidate evaluations could not
withstand the introduction of the control variables into the models.
Media Trust
RQ3: What is the most trusted medium of news for labor union members?
It is important to note that while there is a statistically significant difference
among mediums, a pairwise comparison shows the only statistically significant difference
is between newspapers and the Internet (p = .035). In short, a majority of labor union
members (on a seven point Likert-type scale where 0 = absolutely untrustworthy to 6 =
absolutely trustworthy) fall somewhere between neutral and slightly trustworthy (see
Figures 5 and 6 for means and standard deviations of the top 20 most trusted channels).
While newspapers have the highest mean for a particular medium, they were not
the most trusted channel overall, which was the national labor union website. The local
daily newspaper had the highest number of individuals who get their political information
from a local daily newspaper (92.0%, N = 186); but this was not in the top 20 trusted

100
sources, compared to the local labor union paper (71.1%, N = 143, ranked 7th overall)
and the national labor union paper (61.2%, N = 123, ranked 9th overall). However, local
union members trusted their local labor union paper (M = 3.92, SD = 1.48), and their
national labor union paper (M = 3.85, SD = 1.54), more than the local daily paper (M =
3.28, SD = 1.47).
Public radio ranked 13th overall for trustworthiness, and was the only radio
choice in the top 20. A full 57.7% of labor union members use local FM public radio (N
= 116, M = 3.72, SD = 1.24) for political information; and the next highest use of radio
for political information was local AM radio (39.8%, N = 80, M = 3.43, SD = 1.38),
which was not in the top 20. These two channels commonly use a talk format, and they
cover local political information, which may contribute to the reliance on these two
channels specifically.
Television had seven of the top 20 trustworthy channels, with PBS (48.3%, N =
97, M = 3.95, SD = 1.28) in fifth overall, followed by BBC World (24.4%, N = 49, M =
3.84, SD = 1.33, ranked 11th overall), CNN (69.2%, N = 139, M = 3.69, SD = 1.31,
ranked 14th overall), ABC (74.6%, N = 150, M = 3.56, SD = 1.20, ranked 16th overall),
CBS (73.1%, N = 147, M = 3.54, SD = 1.20, ranked 17th overall), MBNBC (57.2%, N =
115, M = 3.54, SD = 1.35, ranked 18th overall), and Al Jazeera America (8.5%, N = 17,
M = 3.53, SD = 1.63, ranked 20th overall). Neither FOX (58.7%, N = 118, M = 3.54, SD
= 1.58, ranked 36th overall), nor FOX News Channel (49.8%, N = 100, M = 3.29, SD =
1.73, ranked 33rd overall) ranked in the top 20. These findings provide additional
support for the idea of a broader channel repertoire opposed to selective exposure (see
Festinger, 1957). Labor union members did not rank all of the television they watched as

101
absolutely trustworthy; instead, majorities were either neutral with some slightly less or
slightly more trustworthy. Very few considered the television they watched as either
absolutely untrustworthy or absolutely trustworthy. A similar number of labor union
members are exposing themselves to both PBS and FOX News Channel; and while they
find PBS to be more trustworthy, they are not avoiding opposing viewpoints.
The Internet included ten of the top 20 means including the national labor union
website (33.8%, N = 68, M = 4.18, SD = 1.16, ranked 1st overall), followed by the local
labor union website (42.8%, N = 86, M = 4.14, SD = 1.12, ranked 2nd overall), AFL-CIO
website (24.4%, N = 49, M = 4.08, SD = 1.19, ranked 3rd overall), Illinois AFL-CIO
website (26.9%, N = 54, M = 3.98, SD = 1.22, ranked 4th overall), followed by the AFL-
CIO on Facebook (29.4%, N = 59, M = 3.93, SD = 1.34, ranked 6th overall), national
labor union on Facebook (40.8%, N = 82, M = 3.89, SD = 1.40, ranked 8th overall),
Illinois AFL-CIO (32.3%, N = 65, M = 3.85, SD = 1.40, ranked 10th overall), local labor
union on Facebook (55.78%, N = 112, M = 3.81, SD = 1.38, ranked 12th overall), local
labor union on Twitter (7.0%, N = 14, M = 3.64, SD = 1.34, ranked 15th overall), and
AFL-CIO on YouTube (8.5%, N = 17, M = 3.53, SD = 1.13, ranked 19th overall).
Overall, less than 50% of the labor union members are utilizing Internet sources to get
their political information, with the exception of the local labor union on Facebook with
almost 56%. Although, trust of labor sources on the Internet included the top four means
with websites as the most trustworthy; and compare this to the trust of websites (any site
with news) (66.7%, N = 134, M = 2.98, SD = 1.13, ranked 37th overall), which is
considered slightly untrustworthy to neutral overall. Labor union websites are typically
the most up-to-date source for labor news. Members may be conditioned to utilize these

102
websites for more than just political information (e.g., member benefits information, job
calls). Additionally, the official use of social media accounts is not always consistent
among labor unions. Again, a member of the union that is not in leadership, but uses
social media, may run a local labor union Facebook or Twitter page. Labor leaders
officially manage the national labor unions on Facebook, but not all of them manage the
local social media accounts. As the labor union membership beings to age, however, it
may be ideal for local labor leaders to start formally utilizing Facebook and other social
media sites as another official way to communicate with their members on a regular
basis, in addition to their websites.
Additionally, while simple exposure to labor union media predicted negative
evaluations of the non-union-endorsed candidate, Rauner, this was not enough to predict
positive evaluations of the union-endorsed candidate Quinn (e.g., see discussion of H1a
and H1b). Alternately, trust in labor union media did predict positive evaluations of
Quinn, but not for Rauner (see discussion of H4a and H4b). This means trust in the labor
media was able to overcome the general dislike for Quinn as the labor union-endorsed
gubernatorial candidate, which makes communicating effectively through both the most
used channels, and the most trusted channels, important.
In all, labor union leaders end up with the challenge of trying to communicate
with their labor union members in a variety of mediums. The channel repertoire labor
union members use differs from the channel repertoire they trust. Specifically, labor
union members use the local daily paper, broadcast television (including PBS), Facebook,
and local FM public radio. Local union members trust all of their labor websites, PBS,
labor Facebook sites, and their local labor union newspaper. The good news for labor

103
leaders is that labor union members find labor media to be trustworthy. It is important
for labor leaders to capitalize on the variety of ways labor union members access their
political information, and reach out to various members in new ways to account for the
variance of use and trust in labor union members’ media diet. Some ways to build trust
among labor union membership could include advertising on these channels to promote
the labor union brand internally (i.e., among its own membership), as well as externally
(i.e., potential customers, the public) to build brand awareness in a positive manner.
Some topics could include how the labor union is giving back to the community and the
quality of work that comes from a labor union member.
H4a: Trust in labor union media will positively predict a favorable evaluation of the
union-endorsed candidate.
The influence of trust in labor union media on evaluations of Quinn was observed
even after controlling for the variance in evaluations of Quinn that is explained by
gender, party identification, and religiosity. Ultimately, trust in labor union media
yielded a favorable evaluation of the union-endorsed candidate with a small effect size,
unlike H1a (i.e., exposure to labor union media), or H3b (i.e., awareness of union’s
endorsements). Trust in labor union media is the only variable that was able to overcome
the popularity problem of Quinn with his own party. This means that even after the
likely support from the Democrats is accounted for, trust in labor union media still made
a small difference.
The greatest challenge for labor union leaders will be to communicate to their
members with a varied media diet, while simultaneously communicating with channels
union members find trustworthy. Many local labor unions use a labor newspaper to

104
communicate with their membership, although the local labor union paper fell to 7th
place overall for media trust (see RQ3 discussion). In all, 11.2% (N = 16) found the local
labor union paper to be untrustworthy, while a majority of respondents found the paper to
be trustworthy (50.9%, N = 87), and the remaining labor union members were neutral
(28.0%, N = 40). The highest trustworthiness score is from labor websites, with a solid
group of members who consider the labor sites on Facebook to be trustworthy. The
challenge for labor leaders is that the group who trust social media (local labor union on
Facebook N = 112) sites is still smaller than those who use a newspaper (local labor
union paper N = 143), but the trustworthiness scores for social media sites will only
increase as the population ages. Even though the local labor union website (M = 4.14, N
= 86) had the second highest mean to the national labor union website, less than half of
the sample (N = 68) use the website; and of those, over 66% (N = 55) considered the
labor union website to be trustworthy.
Overall, the goal of labor union leaders should be to cultivate trust. Specifically,
they should consider how to build greater trust through their communication with union
members. While neither exposure to labor union media, nor awareness of the union-
endorsed candidate was statistically significant regarding Quinn, trust of this very same
media did matter. Quinn was disliked intensely by labor union members (Ujifusa, 2014).
Perhaps the answer is labor media trust matters when you are asking something from
your membership. Labor union leaders want membership to vote for the union-endorsed
candidate. Without trust, there is no loyalty to support the preferred candidate. Perhaps
communicating some of the successes of the local union would be persuasive. Labor
union members spend a portion of their paychecks to support the labor union in the form

105
of union dues. Communicating contracts that were secured, benefits negotiated, or even
an increase in membership may all be things that could help cultivate trust by
communicating how their paycheck is going to work for them. This type of
communication may help to offset the negative frames about union dues and political
action taken by Republicans intended to diminish the influence of labor unions (Epps,
2015).
H4b: Trust in labor union media will negatively predict a favorable evaluation of
the non-union-endorsed Republican candidate.
Trust in labor union media did not negatively predict a favorable evaluation of
Bruce Rauner. Unlike evaluations of Quinn (see discussion of H1a and H3b), exposure
to labor union media (see discussion of H1b), and awareness of union’s endorsement (see
discussion of H3c), both predicted an unfavorable evaluation of Rauner. Why did trust in
labor union media not have the same results? Both party identification (i.e., Republicans)
and gender (i.e., females) had positive evaluations of Rauner individually. Trust in labor
union media was in the expected direction, but not statistically significant.
Rauner was disliked by labor union members as much as Quinn, but perhaps labor
union leaders did not ask membership to dislike Rauner as much as they asked
membership to vote for Quinn. Trust in labor union media may have made a difference if
labor union leaders specifically asked their membership to not vote for Rauner and then
provide several reasons why. Perhaps labor union members did not consider the message
from the labor union salient because the expected message regarding Rauner was
negative, and therefore irrelevant in the decision-making process.

106
RQ4: The relationship between labor union media exposure and a positive
evaluation of the labor-endorsed candidate will be moderated by trust in
labor union media, such that the relationship will be strongest among those
who are most trusting of labor union media.
Trust in labor union media did not moderate the relationship between exposure to
labor union media and a positive evaluation of the labor-endorsed candidate, Pat Quinn.
The interaction effect between exposure to labor union media and trust in labor union
media was not significant. This may be explained in part by what we learned from H1
(i.e., exposure to labor union media). In short, mere exposure to labor union media does
not produce a positive feeling toward the union-endorsed candidate. Again, Pat Quinn
was disliked by labor union members prior to the election. Exposure to labor union
media did not change labor union members’ opinion of Pat Quinn. Those who had a
positive evaluation of Pat Quinn fell along typical party lines. Those who considered
themselves Republicans were less likely to rate Pat Quinn positively, and those who
consider themselves Democrats were more likely to rate Pat Quinn positively. Trust in
labor union media was a small factor (i.e. those with greater trust of labor media had a
positive evaluation of Quinn), but again it did not moderate the relationship. In all, the
implication is trust of labor union media is more than the combination of exposure of
labor union media and trust of labor union media combined. Labor union leaders should
focus on trust in labor union communication (see discussion of H4a and H4b).

107
Labor Union Involvement
RQ5: Will the relationship between labor union media exposure and positive
evaluations of union-endorsed candidates be strongest among those who are
closely involved in their union (i.e., union members who participate in the
labor union through a variety of labor-sponsored activities)?
Greater involvement in the labor union did not moderate the relationship between
exposure to labor union media and a positive evaluation of the labor-endorsed candidate,
Pat Quinn. The interaction effect between exposure to labor union media and union
involvement was not significant. Again, mere exposure to labor union media does not
produce a positive feeling toward the union-endorsed candidate (see discussion in H1a).
Additionally, greater union involvement did not translate into favorability of Pat Quinn.
Those who had a positive evaluation of Pat Quinn fell along typical party lines. Those
who consider themselves Republicans were less likely to rate Pat Quinn positively, and
those who consider themselves Democrats were more likely to rate Pat Quinn positively.
Additionally, gender was a factor. Women were less likely to favorably evaluate the
union-endorsed candidate. This is likely due to their political identification as
Republicans (see H1 discussion). Finally, religiosity was also statistically significant.
Those who were more religious had a more favorable evaluation of Pat Quinn.
More involvement in the union is usually touted by labor leaders as being a potent
factor in support of labor union policies and union-endorsed candidates. Many labor
leaders struggle to get younger members to even attend union meetings. Involvement in
the labor union might also be motivated by factors other than just agreeing with the
union’s platform on issues and candidates. Greater involvement in the union may have

108
more to do with job advancement. For example, someone in construction may prefer to
work up to a foreman or an administrative position that does not require the manual labor
of working in the field with tools all day. Involvement in the labor union may also be
motivated by social capital. For example, if you have friends that attend the meetings,
perhaps the social aspect would motivate you to attend a meeting. Of course, it is
important to continue to work to get more labor union members involved. While this
current study does not support the notion that greater involvement leads to more support
for the labor union-endorsed candidate, it is important for the labor union leadership to
develop trust (see discussion in H4a).
Theoretical Implications
Labor union media exposure did have a small impact on the non-labor union-
endorsed Republican candidate, Bruce Rauner, and awareness of the labor union
endorsement resulted in less favorability of the Republican candidate and right-to-work
and anti-union legislation. Thus, based on these effects, we might deem that the negative
frames of Rauner that were likely available in union members’ exposure to union media
did matter. Based on framing theory, it is likely that the media frames regarding the
Republican contender and legislation encouraged participants to store knowledge about
Rauner and right-to-work legislation that was salient due to mere exposure of these
messages. Additionally, the results for the channel repertoire research questions revealed
that the main media diet of the labor union members primarily included mainstream news
on a regular basis, and labor union media on a less frequent basis. Bruce Rauner received
a lot of media attention from not only the mainstream news outlets, but he also ran an
extensive advertising campaign (Confessore, 2015). The salience of these frames

109
regarding Rauner may be due to the amount of coverage that Rauner received from
mainstream news, advertising, and labor union media that might be an additive effect that
all equal a negative evaluation of Rauner. It would have been hard to miss the coverage
surrounding the State of Illinois budget crisis and how both Rauner and Quinn planned to
solve the problem. The frequency of discussion surrounding the Illinois budget, and its
direct impact on public employee unions made the negative frames regarding Rauner
salient. These union members then received competing frames from their labor union
newspaper on how Rauner was planning to eliminate collective bargaining and fair share
fees using the blueprint of Scott Walker, the Governor of Wisconsin, as the model for
success (Burnett & Tareen, 2014). In addition, The Labor Paper featured front-page
news of Rauner’s plan to allow local governments to create “employee empowerment
zones,” otherwise known as right-to-work, following the election (Stevens, 2015).
These same competing frames might have also had an impact on the favorability
of Pat Quinn. Labor union media was not able to frame Quinn as the obvious candidate.
Quinn lost popularity when he worked to cut union benefits in direct contradiction of
state law (Arnold, 2014). Quinn was then faced with negative frames from both the
mainstream media, and the labor union media (e.g., The Labor Paper). Quinn’s negative
frames were not as extensive as the negative frames provided for Rauner; however, labor
union media did acknowledge Quinn’s policies to fix the Illinois budget as “unpopular”
and “controversial” (Helfers, 2014; Stevens, 2014b). These negative frames about Quinn
were qualified with terms like “tough,” followed by a positive frame in the same
sentence. For example, “Governor Quinn made the tough, many times unpopular
decisions that put Illinois on the path to recovery” (Helfers, 2014, p. 1). The negative

110
frame would sometimes follow the positive frame. For example, “Incumbent Governor
Pat Quinn has spent his life initiating and supporting programs and policies that assist
working people, even though workers have not always agreed with him, nor supported
100 percent of his policies” (Stevens, 2014a). These frames are an example of how the
labor union media was not able to avoid Quinn’s popularity problem due to his policies
that affected some public sector union members. Ultimately, mere exposure could not
predict a favorable evaluation of Pat Quinn, because negative frames were surrounding
him regardless of the labor members’ channel repertoire from mainstream news, labor
news, and/or the Rauner campaign attack advertisements. Therefore, the knowledge store
of labor union members included contradictory information. This variance in information
regarding Quinn may have triggered the active thought of labor union members to
include a variety of frames from a variety of sources, which made the information salient.
It seems consistency of framing is key, and the labor union media should avoid criticizing
the endorsed candidate during the election season. Ultimately, labor union members had
to make a decision. Trust in labor union media, of all the variables, was predictive of a
positive evaluation of Quinn. Perhaps the union members who trust the labor union
media also trust the union. Despite issues with Quinn, he is still the candidate labor
union members would positively evaluate. The choice by labor union members to trust
their labor media then positively predicted a favorable evaluation of Quinn. Ultimately,
the positive frames highlighted by the labor union media did have a small impact despite
Quinn’s lack of popularity.

111
Limitations
There are a few limitations to consider as part of this study. First, the results
cannot be generalized to labor unions as a whole. This sample was within the state of
Illinois under conditions that may vary from state to state. In particular, while a race
between a Democrat and a Republican is not that unusual, the enormous dislike of the
incumbent gubernatorial candidate even within his own party is not necessarily typical
and findings may differ in similarly replicated studies.
Additionally, variation in the union membership is not captured by the dataset.
This means that some members may be part of a union of their own volition, while others
may be a part of a union for various other reasons (e.g., social capital, see RQ5
discussion). This variation in union membership could explain why exposure to labor
union media had mixed results, in addition to, Quinn’s likeability problem. A labor
union members’ identity construction could have an influence based on whether they
wanted to join the union or not. Labor union media may not be a direct influence.
Next, the sample overrepresented White participants. Previous research has
indicated that the combination of being Black and a union member appears to be the
strongest predictors of vote choice (Boris & Bruno, 2010; Sousa, 1993). This study
included only 6 (3%) individuals who identified as Black or African American or Haitian
American, compared to the 97% (N = 195) who identified as White, European American,
Middle Eastern American, or individuals of North African American descent. The ratio
of males to females was even, but a lack of racial diversity in the sample prevents greater
understanding of labor union membership and their vote choice, in addition to the ability
to compare these findings with earlier studies.

112
The data for this study was collected in April following a November election,
which is why evaluation of the candidate was measured instead of intended vote choice.
Conducting the survey after the election could mean that events that happened during
Rauner’s first three months in office could affect his evaluation. Therefore, this study
cannot speak to a campaign influence exclusively.
Finally, this study is cross-sectional. Thus, this study only accounts for one
moment in time. It is possible that labor union members liked Quinn, and then came to
trust the labor union media more. The causality could be reversed.
Future Directions
The sample included 21 different unions with 51 different job classifications, and
79 different job titles with union membership representing 29 different cities across the
state of Illinois. This made for a very diverse sample; however, it is difficult to ascertain
if there is any difference between the various types of labor unions. There are not enough
participants in each union within the current sample to provide a robust enough sample
size for appropriate power. Future research should compare two different labor unions.
For example, do service unions communicate and vote differently than teachers unions,
or those who work in construction and manufacturing? What about the difference
between unions with unskilled or skilled trades? We know that there are income
discrepancies. Future studies should examine and compare at least two groups to
understand if the type of union membership impacts results of exposure to labor union
media, awareness of union’s endorsements, and trust of labor union media. This type of
research may help to explicate the gender differences uncovered in this study.

113
Higher levels of religiosity were associated with more support for the Democratic
candidate. Labor union groups are typically linked with Democrats, and the sample
indicated those who identify as more religious primarily self-identified as a Democrat.
One might expect individuals with higher levels of religiosity to self-identify as
Republican or conservative (e.g., Campbell et al., 2011); however, research regarding
religion and partisanship indicates that those who self-identify as evangelical or perceive
the candidate to be evangelical are more likely to identify with the Republican party
compared to other organized religious groups such as Catholics (e.g., Green, 2007).
Catholics, for example, are no longer considered associated mainly with the Democratic
Party (e.g., during the Kennedy administration). Instead, Catholics may be associated
with both the Republican Party and the Democratic Party evenly. Religious people may
lean more Republican than Democratic compared to nonreligious people (Campbell et al.,
2011), however, our sample revealed greater religiosity indicated greater support for the
Democratic candidate. Clearly, the sample features a partisan group that strongly
identifies with the Democratic Party. Future labor union communication research should
include demographics that include specific religions to understand the complexities of
religious affiliation and union membership on voting. Specifically, Evangelical
Christians, in addition to religiosity, should be a control variable. Finally, it would be
interesting to consider the differences in those who may identify as spiritual but may not
consider themselves religious.
The ways in which labor union members access political information and then
how they act on that information are varied. Here, the results suggested that the media
diet of labor union members definitely includes a large repertoire of channels. Some of
114
the Internet channels were considered the most trustworthy when compared to other
traditional channels of labor communication. It may be important to consider if this
varies across types of labor unions. Future studies should compare unique groups (e.g.,
electricians compared to teachers) to see if there is a difference.
Future studies should also investigate the use of more Internet channels. Trust of
labor union Internet media outperformed the standard labor newspaper. The absolute
variety of ways that labor unions have the ability to communicate with their membership
has increased in the last 30 years. The challenge for labor unions is how to manage these
new communication technologies while maintaining traditional ways of communicating
with labor union members. Labor union leaders should consider more than one way to
officially communicate with their members as a means of fostering greater trust.
Next, future labor union research should focus on the labor union member, and
not the labor union household. Past research (outside of Boris & Bruno, 2010; Bruno
2000) has focused almost exclusively on the union household, or relied on ANES data,
which also focuses on the union household. The differences between a labor union
household, and the individual labor union member should also be examined.
Exposure to labor union media yielded differing results. Future research should
examine labor media through content analysis followed by a survey to understand the
frequency and topics of labor union media. It would be important to compare the recency
and frequency of articles regarding the labor-endorsed candidates and the non-labor-
endorsed candidates. For example, would the recency and frequency of coverage of the
candidates have any impact on awareness of the union’s endorsements? In addition, what
is the difference in coverage between candidates and standard issues of the Democratic

115
Party and/or labor union leaders? Does frequency of coverage impact awareness?
Finally, how might the amount of coverage affect candidate evaluation after exposure to
labor union communication?
Finally, early research used the term “organ” to describe the various types of labor
communication within the conceptual definition. Various definitions can be found
regarding the communicative nature of “organ.” Merriam-Webster in its fourth and last
entry simply defines organ as a “periodical.” Dictionary.com defines organ as a
“newspaper, magazine, or other means of communicating information, thoughts, or
opinions, especially in behalf of some organization, political group, or the like.” Even
these definitions are outdated with the types of media we use to communicate today. A
periodical is typically a subscription that periodically showed up at your house (i.e., a
magazine subscription). The Dictionary.com definition only refers to outdated ways of
communicating, and does not even mention television or the Internet. I propose using a
common conceptual definition for future research regarding the “organs” of
communication. Specifically, I propose the term “channel” when talking about a specific
media source (e.g., ABC, WLS-AM, The New York Times, or Facebook) regardless of
medium. Medium should then be used to describe the general source of media (e.g.,
Newspaper, Radio, Television, Internet, and future technology). The terms “channel”
and “medium” are not limited to the study of an organization or group. They simply
define how and what we use to communicate.
Conclusion
This research provides a springboard for research in the area of labor
communication within the discipline of communication. This study serves as a

116
beginning, with many unexplored areas for future research. It is my hope that labor
union leaders will begin to examine the role of communication in their efforts to connect
and affect the vote choice of their labor union members.
The current story of labor union communication is complicated. We learned that
exposure of labor union communication from a labor media frame may have an impact on
how labor union members view candidates and issues. Specifically, exposure to labor
media predicts a negative evaluation of the non labor-endorsed political candidate (i.e.,
Rauner), but it did not predict a negative evaluation of right-to-work and anti-union laws.
Additionally, exposure did not predict a favorable evaluation of the labor-endorsed
candidate (i.e., Quinn), nor did labor union media exposure predict awareness of the labor
union-endorsed candidate. Again, this may be due, in part, to the construction of the
union members’ identity.
Awareness of the labor union’s endorsements did negatively predict an
unfavorable evaluation of the Republican opponent, in addition to right-to-work and anti-
union laws. Awareness of the labor union’s endorsement was unable to positively predict
a favorable evaluation of the labor union-endorsed candidate (i.e., Quinn). We know that
the incumbent was unpopular. Future research will uncover whether the popularity
problem of Quinn was the main reason for the results.
This study also found out that the channel repertoire of labor union members is
broad. In addition, labor union members expose themselves to channels they may not
necessarily trust. Interestingly, the labor union members spend most of their media use
time watching television, reading newspapers, listening to the radio, followed by using
the Internet for political information. The local daily newspaper is the most used

117
medium; yet, the local daily newspaper is not even in the top 20 channels that are
considered trustworthy. Local, state, and national labor union websites are considered
the most trustworthy. Public television, and the local and national labor union newspaper
do make the top 10. Additionally, at this time there is no difference in candidate
evaluation on whether the labor union member utilizes more traditional or more new
labor media.
Perhaps the most provocative finding of this study relates to labor members’
media trust. While exposure to labor union media, and awareness of union’s
endorsement had no impact on the unpopular Quinn, media trust did positively predict a
favorable evaluation. Alternately, labor media trust did not positively predict a negative
evaluation of Rauner. Overall, trust in labor media mattered most when it came to
supporting the labor union-endorsed candidate. Greater involvement in the labor union
could not even predict a favorable evaluation of Quinn.
Trust of labor media is a potent factor in the labor union member evaluation of a
labor union-endorsed gubernatorial candidate. Previous research has indicated that party
identification is the only major factor that one needs to consider when predicting vote
choice. The present study sought to ameliorate this perception by statistically controlling
for not only party identification, but gender, race, income, political ideology, and
religiosity as well. In short, labor union communication does have an impact on vote
choice. Labor union leaders will have to focus on trust when creating and disseminating
their messages regarding candidates in the media. Clearly, labor leaders need to
thoughtfully consider the communication channels their members are using, and which

118
channels their members trust. Political communication research now has a foundation to
expand its focus to include labor unions as a vital group to understand.

119
REFERENCES
2014 General Election Endorsements. (2014, October 17). Illinois AFL-CIO. Retrieved
from http://www.ilafl-cio.org/documents/OfficialCOPEendorsements10-17-
14.pdf
A Brief History of the IPA. (n.d.). Illinois Press Association. Retrieved from
http://www.illinoispress.org/AboutUs.aspx
AM Query Broadcast Station Search. (n.d.). Federal Communications Commission.
Retrieved from http://www.fcc.gov/encyclopedia/am-query-broadcast-station-
search
ANES. (n.d.). The ANES guide to public opinion and electoral behavior. Retrieved from
http://electionstudies.org/nesguide/nesguide.htm
Arnold, T. (2014, November 21). Labor unions celebrate judge’s ruling against Illinois
pension law: State legislators’ solution to the country’s worst public-employee
pension crisis overruled. WBEZ 91.5. Retrieved from http://www.wbez.org
Associated Press. (2015, March 6). Wisconsin legislature approves right-to-work bill.
Retrieved from http://www.foxnews.com/
Axelrod, R. (1972/1978). Where the votes come from: An analysis of electoral coalitions,
1952-1968 (and 1972 addendum). In C. M. Rehmus, D. B. McLaughlin, & F. H.
Nesbitt (Eds.), Labor and American politics: A book of readings (Rev. ed., pp.
383-397). Ann Arbor: The University of Michigan Press.
Barbour, C. & Spicuzza, M. (2011, February 12). Walker to unions: No negotiations;
moves seen as part of an effort to end clout of organized labor. Wisconsin State
Journal, p. A1.

120
Benen, S. (2014, August 5). Benghazi conspiracy theorists have a decision to make.
MSNBC. Retrieved from http://www.msnbc.com/
Benoit, W. L., McKinney, M. S., & Holbert, R. L. (2001). Beyond learning and persona:
Extending the scope of presidential debate effects. Communication Monographs,
68(3), 259 –273. doi: 10.1080/03637750128060
Blackwell, B. (2013, May 4). Ohio ‘right to work’ fight likely to resurface in state
legislature [Web log post]. The Plain Dealer. Retrieved from
http://www.cleveland.com/
Bland, S. (2014, March 19). Will Pat Quinn’s luck run out against Bruce Rauner?
National Journal. Retrieved from http://www.nationaljournal.com/
Blume, N. (1970). The impact of a local union on its membership in a local election.
Political Research Quarterly, 23(1), 138-150. doi: 10.1177/106591297002300108
Blumenthal, P., & Jamieson, D. (2014, March 15). Koch brothers are outspent by a labor
force millions of times their size, but…. The Huffington Post. Retrieved from
http://www.huffingtonpost.com
Bok, D. C., & Dunlop, J. T. (1970). Labor and the American community. New York, NY:
Simon & Schuster.
Borah, P. (2011). Conceptual issues in framing theory: A systematic examination of a
decade’s literature. Journal of Communication, 61, 246-263. doi: 10.1111/j.1460-
2466.2011.01539.x
Boris, M. B., & Bruno, R. (2010). Not ready to make nice. Labor Studies Journal, 35(1),
94-115. doi: 10.1177/0160449X09355581

121
Botan, C. H., & Frey, L. R. (1983). Do workers trust labor unions and their messages?
Communication Monographs, 50(3), pp. 233-244. doi:
10.1080/03637758309390166
Brown, C., Waltzer, H., & Waltzer, M. B. (2001). Daring to be heard: Advertorials by
organized interests on the op-ed page of The New York Times, 1985-
1998. Political Communication, 18(1), 23-50. doi: 10.1080/10584600150217640
Bruggemann, M. (2014). Between frame setting and frame sending: How journalists
contribute to news frames. Communication Theory, 24, 61-82. doi:
10.1111/comt.12027
Bruno, R. (2000). From union identity to union voting: An assessment of the 1996
election. Labor Studies Journal, 25(3), 3-28. doi: 10.1177/0160449X0002500301
Bureau of Labor Statistics, U.S. Department of Labor. (2013). Union members—2012
(USDL Publication No. USDL-13-0105). Retrieved from
http://www.bls.gov/news.release/pdf/union2.pdf
Burnett, S., & Tareen, S. (2014, March 19, 2014). Rauner wins GOP nomination for
Illinois governor. AP. Retrieved from http://bigstory.ap.org/
Buss, T. F., & Hofstetter, C. R. (1976). An analysis of the logic of televised campaign
advertisements: The 1972 presidential campaign. Communication Research, 3(4),
367-392. doi: 10.1177/009365027600300402
Cable Operations and Licensing System. (n.d.). Federal Communications Commission.
Retrieved from https://apps.fcc.gov/coals/forms/search/cableSearchNf.cfm
Cain C. (2013, January 27). Debate goes on over Michigan’s right-to-work law. Detroit
Free Press. Retrieved from http://www.freep.com/

122
Campbell, A., Converse, P. E., Miller, W. E., & Stokes, D. (1960). The American Voter.
New York, NY: John Wiley.
Campbell, D.E, Green, J.C, & Layman, G.C. (2011). The party faithful: Partisan images,
candidate religion, and the electoral impact of party identification. American
Journal of Political Science, 55(1), 42-58. doi: 10.1111/j.1540-
5907.2010.00474.x
Chang, T. F. (2001). The labour vote in US national elections, 1948-2000. Political
Quarterly, 72, 375-385. doi: 10.1111/1467-923X.00397
Citizens United v. Federal Election Commission, 558 U.S. 08-205 (2010).
Clark, P. F. (1998). Conservative interest group impact on union voters: The link between
social and economic issues. Labor Studies Journal, 22(4), 47-61.
Clark, R. (2011, March 9). Walker budget puts roads ahead of children. The Capital
Times, p. 29.
Cohen, B. (1988). Statistical power analysis for the behavioral sciences. Hillsdale, NJ:
Lawrence Erlbaum Associates.
Cohn, S. (2015, May 29). An American workplace war that’s reaching a tipping point.
CNBC. Retrieved from http://www.cnbc.com/
Confessore, N. (2015, November 29). A wealthy governor and his friends are remaking
Illinois. The New York Times. Retrieved from http://www.nytimes.com/
Confessore, N. (2013, April 23). S.E.C. is asked to require disclosure of donations. The
New York Times. Retrieved from http://www.nytimes.com/
Cook, S. L. (1975/1978). AFL-CIO local central body political activity—A case study. In
C. M. Rehmus, D. B. McLaughlin, & F. H. Nesbitt (Eds.), Labor and American

123
politics: A book of readings (Rev. ed., pp. 293-307). Ann Arbor: The University
of Michigan Press.
Dark, T. E. (1996). Organized labor and the congressional democrats: Reconsidering the
1980s. Political Science Quarterly, 111(1), 83-104. doi: 10.2307/2151929
Davey, M. (2014, March 19). Union leaders gird for battle against Republican running
for governor of Illinois. The New York Times. Retrieved from
http://www.nytimes.com/
de Souza, B. (2014, March 9). Is right to work alive as an issue? The Vindicator.
Retrieved from http:// http://www.vindy.com/
Delaney, J. T., Masters, M. F., & Schwochau, S. (1988). Unionism and voter turnout.
Journal of Labor Research, 9(3), 221-236. doi: 10.1007/BF02685314
Delaney, J. T., Masters, M. F., & Schwochau, S. (1990). Union membership and voting
for COPE-endorsed candidates. Industrial & Labor Relations Review, 43(5), 621-
635. doi: 10.2307/2523332
Dellisanti, A. (2011, June 28). New Jersey anti-union bill approved, Governor Chris
Christie signs into law. Huffington Post. Retrieved from
http://www.huffingtonpost.com/
Demsetz, R. S. (1993). Voting behavior in union representation elections: The influence
of skill homogeneity and skill. Industrial & Labor Relations Review, 47(1), 99-
113. doi: 10.2307/2524235
Digby-Junger, R. (1998). The Guardian, Crisis, Messenger, and Negro World: The early-
20th-century black radical press. Howard Journal of Communication, 9(3), 263-
282. doi: 10.1080/106461798247023

124
Dimitrova, D. V., Kaid, L. L., Williams, A. P., & Trammell, K. D. (2005). War on the
web: The immediate news framing of Gulf War II. The Harvard International
Journal of Press/Politics, 10(1), 22-44. doi: 10.1177/1081180X05275595
DTV Reception Maps. (n.d.). Federal Communications Commission. Retrieved from
http://transition.fcc.gov/mb/engineering/dtvmaps/
Election 2014: Illinois Governor. (2014a, April 14). Rasmussen Reports. Retrieved from
http://www.rasmussenreports.com/
Election 2014: Illinois Governor. (2014b, October 23). Rasmussen Reports. Retrieved
from http://www.rasmussenreports.com/
Employee Rights Notice Posting. (n.d.). National Labor Relations Board. Retrieved from
http://www.nlrb.gov/poster
Entman, R. M. (1989). How the media affect what people think: An information
processing approach. Journal of Politics, 51, 347-370. doi: 10.2307/2131346
Entman, R. M. (1993). Framing: Toward the clarification of a fractured paradigm.
Journal of Communication, 43(4), 51-58. doi: 10.1111/j.1460-
2466.1993.tb01304.x
Entman, R. M. (2003). Cascading activation: Contesting the white house’s frame after
9/11. Political Communication, 20, 415-432. doi: 10.1080/10584600390244176
Entman, R. M. (2010). Media framing biases and political power: Explaining slant in
news of campaign 2008. Journalism, 11(4), 389-408. doi:
10.1177/1464884910367587
Epps, G. (2015, May 13). Breaking the law and blaming the Supreme Court: Illinois
Governor Bruce Rauner refuses to collect “fair share” fees from public employees
125
because he expects them to be found unconstitutional. The Atlantic. Retrieved
from http://www.theatlantic.com/
Faul, F., Erdfelder, E., Lang, A. G., & Buchner, A. (2007). G*Power 3: A flexible
statistical power analysis program for the social, behavioral, and biomedical
sciences. Behavior Research Methods, 39, 175-191. doi: 10.3758/BF03193146
Ferguson, D. A. (1992). Channel repertoire in the presence of remote control devices,
VCRs and cable television. Journal of Broadcasting & Electronic Media 36(1):
83–91. doi: 10.1080/08838159209364156
Ferguson, D. A., & Melkote, S. R. (1997). Leisure time and channel repertoire in a
multichannel environment. Communication Research Reports, 14(2), 189-194.
doi: 10.1080/08824099709388660
Ferguson, D. A., & Perse, E. M. (1993) Media and audience influences on channel
repertoire. Journal of Broadcasting & Electronic Media 37(1): 31–47. doi:
10.1080/08838159309364202
Ferguson, D. A., & Perse, E. M. (2000) The world wide web as a functional alternative to
television. Journal of Broadcasting & Electronic Media 44(2): 155-174. doi:
10.1207/s15506878jobem4402_1
Festinger, L. (1957). A theory of cognitive dissonance. Stanford, California: Stanford
University Press.
Fiorito, J., & Greer, C. R. (1986). Gender differences in union membership, preferences,
and beliefs. Journal of Labor Research, 7(2), 145-164. doi: 10.1007/BF02685307

126
FM Query Broadcast Station Search. (n.d.). Federal Communications Commission.
Retrieved from http://www.fcc.gov/encyclopedia/fm-query-broadcast-station-
search
Freedman, E. (2004). Union magazines’ coverage of the NAFTA controversy before
congressional approval. Journal of Labor Research, 25(2), 301-313. doi:
10.1007/s12122-004-1038-1
Garver, R. A. (1958). The labor press: As a leadership tool. Journalism & Mass
Communication Quarterly, 35(3), 324-332.
Gershtenson, J. (2003). Mobilization strategies of the democrats and republicans, 1956-
2000. Political Research Quarterly, 56(3), 293-308. doi:
10.1177/106591290305600305
Glauber, B, Umhoefer, D., & Bergquist, L. (2011, June 4). Budget confrontation rocked
the state—and beyond. Milwaukee-Journal Sentinel. Retrieved from
http://www.jsonline.com/
Golan, G. J., & Day, A. G. (2010). In God we trust: Religiosity as a predictor of
perceptions of media trust, factuality, and privacy invasion. American Behavioral
Scientist, 54(2), 120-136. doi: 10.1177/0002764210376314
Green, J. C. (2007). The faith factor: How religion influences the vote. Westport, CT:
Praeger Press.
Greene, J. J. (1991). “The strike at the ballot box”: The American Federation of Labor's
entrance into election politics, 1906-1909. Labor History, 32(2), 165-192. doi:
10.1080/00236569100890121

127
Greenhouse, S. (2012, January 2). A gathering storm over ‘right to work’ in Indiana. The
New York Times. Retrieved from http://www.nytimes.com/
Greenstone, J. D. (1969). Labor in American politics. New York, NY: Alfred A. Knopf.
Guyett, S. (2012, February 1). Indiana becomes 23rd “right-to-work” state. Reuters.
Retrieved from http://www.reuters.com/
Hartfield, E. (2012, December 11). Michigan governor signs right to work bill into law.
ABC News. Retrieved from http://abcnews.go.com/
Hayes, A. F. (2013). Introduction to mediation, moderation, and conditional process
analysis: A regression-based approach. New York, New York: The Guilford
Press.
Heeter, C. (1985). Program selection with abundant choice. Human Communication
Research, 12(1), 126-152. doi: 10.1111/j.1468-2958.1985.tb00070.x
Helfers, M. (2014, October 16). From the desk of publisher Marty Helfers. The Labor
Paper, pp. 1, 20.
Herridge, C. (2014, June 11). Fact check: Hillary came up with Benghazi video
explanation. Fox News. Retrieved from http://www.foxnews.com/
Hojnacki, M. & Baum, L. (1992). “New-style” judicial campaigns and the voters:
Economic issues and union members in Ohio. Political Research Quarterly,
45(4), 921-948. doi: 10.1177/106591299204500407
IBEW 34. (n.d.). IBEW 34. Retrieved from http://www.ibew34.org/home/
IBEW Directory. (n.d.) IBEW. Retrieved from
http://www.ibew.org/IBEW/directory/index.asphttp://www.ibew.org/IBEW/direct
ory/index.asp

128
Illinois Voters Guide. (n.d.). General election – November 4, 2014: Statewide elected
offices: Governor and lieutenant governor. Retrieved from
http://votersguide.elections.il.gov/ILVote/CandidateList.aspx
Ingmire, M. (2014, May 2). Benghazi scandal: When will team Obama tell truth about
night my nephew was killed? Fox News. Retrieved from
http://www.foxnews.com/
International Brotherhood of Electrical Workers History & Structure. (n.d.). IBEW.
http://www.ibew.org/IBEW/history/Form%20169%20-
%20History%20and%20Structure.pdf
Jones, D. A. (2004). Why Americans don’t trust the media: A preliminary analysis. The
Harvard International Journal of Press/Politics, 9(2), 60-75. doi:
10.1177/1081180X04263461
Juravich, T. (1986). Beyond the myths of ’84: Union members and the presidential
election. Labor Studies Journal, 11, 135-148.
Juravich, T., & Shergold, P. R. (1988). The impact of unions on the voting behavior of
their members. Industrial & Labor Relations Review, 41(3), 374-385. doi:
10.2307/2523904
Kau, J. B., & Rubin, P. H. (1981). The impact of labor unions on the passage of
economics legislation. Journal of Labor Research, 2(1), 133-145. doi:
10.1007/BF02685126
Kaufmann, K. M., Petrocik, J. R., & Shaw, D. R. (2008). Unconventional wisdom: Facts
and myths about American voters. New York, NY: Oxford University Press.
129
Kim, S. J. (2014). A repertoire approach to cross-platform media use behavior. New
Media & Society. Advance online publication. doi: 10.1177/1461444814543162
Kiousis, S. (2004). Explicating media salience: A factor analysis of New York Times
issue coverage during the 2000 U.S. presidential election. Journal of
Communication, 54(1), 71-87. doi: 10.1111/j.1460-2466.2004.tb02614.x
Knapp, M. L., & McCroskey, J. C. (1968). Communication research and the American
labor union. Journal of Communication, 18(2), 160-172. doi: 10.1111/j.1460-
2466.1968.tb00067.x
Kohring, M., & Matthes, J. (2007). Trust in news media: Development and validation of
a multidimensional scale. Communication Research, 34, 231-252, doi:
10.1177/0093650206298071
LaJeunesse, R. (2013, March). Impact of right-to-work laws. Symposium conducted at
the meeting of the Society for Human Resource Management Employment Law
& Legislative Conference, Washington, DC. Retrieved from
http://www.nrtw.org/files/nrtw/SHRM_Presentation_03112013.pdf
Lamare, J. R. (2010). Union influence on voter turnout: Results from three Los Angeles
county elections. Industrial & Labor Relations Review, 63(3), 454-470. doi:
10.1177/001979391006300305
Layden, L. (2012, April 5). A decade after right-to-work, bitterness remains in
Oklahoma. StateImpact NPR Oklahoma. Retrieved from
http://stateimpact.npr.org/oklahoma/
Leckrone, J. (2011, April 1). Ohio governor signs anti-union bill. Reuters. Retrieved from
http://www.reuters.com/

130
Lee, T. (2010). Why they don’t trust the media: An examination of factors predicting
trust. American Behavioral Scientist, 54(1), 8-21. doi:
10.1177/0002764210376308
LeRoy, M. H. (1990). The 1988 elections: Re-emergence of the labor bloc vote? Labor
Studies Journal, 15(1), 5-32.
Lewis-Beck, M. S., Jacoby, W. G., Norpoth, H., & Weisberg, H. F. (2008). The American
voter revisited. Ann Arbor: University of Michigan Press.
Liberto, J. (2011, April 20). CEOs earn 343 times more than typical workers.
CNNMoney. Retrieved from http://money.cnn.com/
Linn, A. (2013, January 23). Union woes continue as membership shrank again in 2012.
Today Money. Retrieved from http://www.today.com/money/
LoBianco, T. (2012, January 27). After 70 years, right-to-work impact still unclear. Fox
News. Retrieved from http://www.foxnews.com/
Lochte, R. H. & Warren, J. (1989). A channel repertoire for TVRO satellite viewers.
Journal of Broadcasting & Electronic Media, 33(1), 91-95. doi:
10.1080/08838158909364064
Martin, A. W. (2010). Movement publications as data: An assessment of an underutilized
resource. Research in Social Movements, Conflicts and Change, 30, pp. 271-299.
doi: 10.1108/S0163-786X(2010)0000030012
Martinez, A., & Fiorito, J. (2009). General feelings toward unions and employers as
predictors of union voting intent. Journal of Labor Research, 30(2), 120-134. doi:
10.1007/s12122-008-9053-2

131
Martinez, A., Fiorito, J., & Ferris, G. (2011). Solidarity revisited: Group-level effects on
individual-level union voting. Journal of Labor Research, 32(1), 61-74. doi:
10.1007/s12122-011-9102-0
Masters, M. F., & Delaney, J. T. (1987). Union political activities: A review of the
empirical literature. Industrial & Labor Relations Review, 40(3), 336-353. doi:
10.2307/2523491
McKinney, D. (2015, August 10). The Illinois pension disaster: What went wrong?
Crain’s Chicago Business. Retrieved from http://www.chicagobusiness.com/
Melkote S. R. (2009). News framing during a time of impending war: An examination of
coverage in The New York Times Prior to the 2003 Iraq War. The International
Communication Gazette 71(7): 547–559. doi: 10.1177/1748048509341887
Merrion, P. (2014, November 4). Cost of a vote for governor, $23.90. Winning the
election, priceless. Crain’s Chicago Business. Retrieved from
http://www.chicagobusiness.com/
Meyer, J. (2014, May 1). NewsBusters: Exposing & combating liberal media bias [Blog].
Retrieved from http://newsbusters.org/blogs/jeffrey-meyer/2014/05/01/no-live-
coverage-cnn-and-msnbc-skip-latest-benghazi-hearing
Moore, W. J., & Chachere, D. R., Curtis, T. D., & Gordon, D. (1995). The political
influence of unions and corporations on COPE votes in the U.S. Senate, 1979-
1988. Journal of Labor Research, 16(2), 203-221. doi: 10.1007/BF02685741
Mullen, J. J. (1963). Newspaper advertising in the Kennedy-Nixon campaign. Journalism
& Mass Communication Quarterly, 40(1), 3-11. doi:
10.1177/107769906304000101

132
Nie, N. H., Verba, S., & Petrocik, J. R. (1979/1999). The changing American voter
[Enlarged edition]. Bridgewater, NJ: Replica Books.
Nightengale, L. (2013, June 6). Caterpillar CEO endorses GOP candidate Bruce Rauner
for governor. Journal Star. Retrieved from http://www.pjstar.com/
Norris, P. (2002). Democratic phoenix: Reinventing political activism. New York, NY:
Cambridge University Press.
Office of Public Affairs. (2012, April 17). NLRB chairman Mark Gaston Pearce on
recent decisions regarding employee rights posting [Press Release]. National
Labor Relations Board. Retrieved from http://www.nlrb.gov/news-outreach/news-
releases/nlrb-chairman-mark-gaston-pearce-recent-decisions-regarding-employee-
rig
Pamela Harris, et al v. Pat Quinn, Governor of Illinois, et al, 573 U.S. 11-681 (2014).
Patton, D. B., & Marrone, J. J. (1984). The impact of labor endorsements: Union
members and the 1980 presidential vote. Labor Studies Journal, 9(1), 3-18.
Pearson, R. (2014a, September 1). Quinn, Rauner ad war at full throttle. Chicago
Tribune. Retrieved from http://www.chicagotribune.com/
Pearson, R. (2014b, October 30). Rauner, Quinn shatter Illinois fundraising record,
funding barrage of attack ads. Chicago Tribune. Retrieved from
http://www.chicagotribune.com/
Pearson, M., & Mears, B. (2014, June 30). Supreme Court narrowly limits reach of labor
unions. CNN. Retrieved from http://www.cnn.com/

133
Pearson, R., Garcia, M., Long, R., & Secter, R. (2014, November 5). Quinn concedes
defeat to Rauner in Illinois governor’s race. Chicago Tribune. Retrieved from
http://www.chicagotribune.com/
Pearson, R., Secter, R, Garcia, M., & Coen, J. (2014, November 5). Rauner, Quinn out of
sight day after election. Chicago Tribune. Retrieved from
http://www.chicagotribune.com/
Perry, D. C., Taylor, M., & Doerfel, M. L. (2003). Internet-based communication in crisis
management. Management Communication Quarterly, 17(2), 206-232. doi:
10.1177/0893318903256227
Pomper, G. M. (1975). Voters’ choice: Varieties of American electoral behavior. New
York, NY: Dodd, Mead & Company.
Price, V., & Tewksbury, D. (1997). News values and public opinion: A theoretical
account of media priming and framing. In G. Barnett and F. J. Boster (Eds.).
Progress in the Communication Sciences (pp. 173-212). Norwood, N. J., Ablex
Pub. Corp.
Ra, J. O. (1978). Labor at the polls: Union voting in presidential elections, 1952-1976.
Amherst: University of Massachusetts Press.
Race. (n.d.). United States Census Bureau. Retrieved from
http://quickfacts.census.gov/qfd/meta/long_RHI125213.htm
Rayback, J. (1959/1978). Did labor vote for Jackson? In C. M. Rehmus, D. B.
McLaughlin, & F. H. Nesbitt (Eds.), Labor and American politics: A book of
readings (Rev. ed., pp. 56-58). Ann Arbor: The University of Michigan Press.

134
Reed, T. A. (1989). Do union organizers matter: Individual differences, campaign
practices, and representation outcomes. Industrial & Labor Relations Review, 43,
103-119.
Rill, L. A., & Davis, C. B. (2008). Testing the second level of agenda setting: Effects of
news frames on reader-assigned attributes of Hezbollah and Israel in the 2006 war
in Lebanon. Journalism & Mass Communication Quarterly, 85(3), 609-624. doi:
10.1177/107769900808500308
Scheufele, D. A. (1999). Framing as a theory of media effects. Journal of
Communication, 49(1), 103-122.
Semuels, A. (2011, August 25). NLRB requires posting of workers’ rights to unionize
[Web log post]. Los Angeles Times. Retrieved from http://www.latimes.com/
Shah, D. V., Domke, D., & Wackman, D. B. (1996). “To thine own self be true”: Values,
framing and voter decision-making strategies. Communication Research, 23(5),
509-560. doi: 10.1177/009365096023005001
Shah, D. V., McLeod, D. M., Gotlieb, M. R., & Lee, N. (2009). Framing and agenda
setting. In R. L. Nabi & M. B. Oliver (Eds.), The SAGE handbook of media
processes and effects (pp. 83-98). Thousand Oaks, CA: SAGE.
Simon, R. (2011, April 2). Anti-union push gains steam nationwide. Los Angeles Times.
Retrieved from http://www.latimes.com/
Sousa, D. J. (1993). Organized labor in the electorate, 1960-1988. Political Research
Quarterly, 46(4), 741-758. doi: 10.1177/106591299304600403
State governments move forward with anti-union bills. (2011, February 23). Russia
Today. Retrieved from http://rt.com/

135
State of the labor unions: Worst in 76 years. (2013, January 24). CNBC. Retrieved from
http://www.cnbc.com/
Stein, J. & Marley, P. (2013, January 18). Federal court of appeals upholds Walker’s Act
10 union law. Milwaukee-Journal Sentinel. Retrieved from
http://www.jsonline.com/
Stevens, C. M. (2014a, September 4). Part V: Quinn vs. Rauner – Who is best for
organized labor? The Labor Paper, pp. 1, 10.
Stevens, C. M. (2014b, October 16). Governor Quinn: The right choice for organized
labor. The Labor Paper, pp. 1, 17.
Stevens, C. M. (2015, February 5). Governor Bruce Rauner attacks union workers and
wages. The Labor Paper, pp. 1, 12.
Stout, D. (2014, March 19). Bruce Rauner wins GOP nod for Illinois governor. Time.
Retrieved from http://ti.me/1kHmEXw
Suarez, R. (Host). (2013, May 6). SEC considering new rule for political contributions by
public companies [Transcript of television broadcast]. Debate with P. Atkins, &
R. J. Jackson, Jr. in PBS Newshour. Retrieved from
http://www.pbs.org/newshour/bb/politics/jan-june13/sec_05-06.html
Taneja, H., Webster, J. G., & Malthouse, E. C. , & Ksiazek, T. B. (2012). Media
consumption across platforms: Identifying user-defined repertoires. New Media &
Society, 14(6), 951–968. doi: 10.1177/1461444811436146
Terkel, A. (2011, April 28). Rick Scott rebuffed by Florida republicans on anti-union bill.
Huffington Post. Retrieved from http://www.huffingtonpost.com/
136
Terkel, A., & Celock, J. (2011, November 9). Ohio issue 2: Controversial anti-union law
defeated by voters. Huffington Post. Retrieved from
http://www.huffingtonpost.com/
The N.L.R.B.’s Contested Poster. (2013, May 9). [Opinion-Editorial]. The New York
Times. Retrieved from http://www.nytimes.com/
“The GOPs Summer of Benghazi Coverage”. (2014, May 5). The Ed Show [Television
Episode]. Retrieved from http://www.msnbc.com/the-ed-show/watch/the-gops-
summer-of-benghazi-coverage-247436355830
Trilling, D, & Schoenbach, K. (2014). Challenging selective exposure, do online news
users choose sites that match their interests and preference? Digital Journalism.
Advance online publication. doi: 10.1080/21670811.2014.899749
Tsfati, Y. (2010). Online news exposure and trust in the mainstream media: Exploring
possible associations. American Behavioral Scientist, 54(1), 22-42. doi:
10.1177/0002764210376309
Tsfati, Y., & Cappella, J. N. (2003). Do people watch what they do not trust?: Exploring
the association between news media skepticism and exposure. Communication
Research, 30(5), 504-529. doi: 10.1177/0093650203253371
TV Query Broadcast Station Search. (n.d.). Federal Communications Commission.
Retrieved from http://www.fcc.gov/encyclopedia/tv-query-broadcast-station-
search
Ujifusa, A. (2014, April 1). Illinois Governor's race puts unions in tough position.
Education Week. Retrieved from http://www.edweek.org/

137
U.S. Department of Labor. (2008). State right-to-work laws and constitutional
amendments in effect as of January 1, 2009 with year of passage. Retrieved from
http://www.dol.gov/whd/state/righttowork.htm
U.S. Department of Labor. (n.d.). Employee rights under the national labor relations act.
Retrieved from
http://www.dol.gov/olms/regs/compliance/EmployeeRightsPoster11x17_Final.pdf
U.S. Securities and Exchange Commission. (2011, September 2). Executive
compensation. Retrieved from http://www.sec.gov/answers/execomp.htm
U.S.: Hostess liquidation bonuses too sweet for managers. (2012, November 19).
Chicago Tribune. Retrieved from http://www.chicagotribune.com/
Vielmetti, B. & Marley, P. (2012, March 30). Federal court strikes down parts of union
law. Milwaukee-Journal Sentinel. Retrieved from http://www.jsonline.com/
Walker, J., & Lawler, J. J. (1986). Union campaign activities and voter preferences.
Journal of Labor Research, 7(1), 19-40. doi: 10.1007/BF02685298
Williams, A. (2012). Trust or bust?: Questioning the relationship between trust and news
attention. Journal of Broadcasting & Electronic Media, 56(1), 116-131. doi:
10.1080/08838151.2011.651186
Wilson, G. K. (1979). Unions in American national politics. New York, NY: St. Martin’s
Press.
Wolfe, A. C. (1969/1978). Trends in labor union voting behavior, 1948-1968. In C. M.
Rehmus, D. B. McLaughlin, & F. H. Nesbitt (Eds.), Labor and American politics:
A book of readings (Rev. ed., pp. 368-380). Ann Arbor: The University of
Michigan Press.

138
Zaller, J. (1992). The nature and origins of mass opinion. Cambridge, UK: Cambridge
University Press

139
TABLES
Table 1 Descriptive Statistics for Gender, Race, Education, and Individual Income Variable N % M SD Gender Male 137 68.2 Female 64 31.8 Racea American Indian or Alaska Native 5 2.5 Asian 1 0.5
Black or African American or Haitian American
6 3.0
Native Hawaiian or Other Pacific Islander
0 0.0
White or European American or Middle Eastern American or North African American
195 97.0
Other (Write In) 0 0.0 Hispanic or Latino (of any race) 1 0.5 Educationab High School or GED Equivalent 201 100.0 Some College 158 78.6 Associate’s Degree 43 21.4 Bachelor’s Degree 52 25.9 Master’s Degree 26 12.9
Graduate of Apprenticeship Training Program
60 29.9
Doctorate 1 0.5 Individual Incomec
3.16 1.04
25K or Less 4 2.0 25-50 K 55 27.4 50-75K 69 34.3 75-100K 56 27.9 100-125K 12 6.0 Greater than 125K 5 2.5 Note. a Percentages do not equal 100 due to more than one choice available. b Education does not include a mean nor standard deviation because participants could choose more than one. c Income is for the individual and not the household.

140
Table 2 Descriptive Statistics for Age and Length of Time in a Labor Union Variable Range M SD Age 22 75 45.89 10.92 Years in Union 1 54 16.64 11.57 Table 3 Descriptive Statistics for Labor Union Membership Status Variable N % Status Member 173 86.1 Retired Member 28 13.9

141
Table 4 Descriptive Statistics for Awareness of Union Endorsement, Awareness, and Vote Choice Variable N % Endorsement I do not know who was endorsed 37 18.4 Bruce Rauner - Republican 9 4.5 Pat Quinn - Democrat 155 77.1 Chad Grimm - Libertarian 0 0.0 Awareness Aware of Quinn’s Endorsement 155 77.1 Unaware of Quinn’s Endorsement 46 22.9 Vote Choice I am not registered to vote 5 2.5
I did not vote, but I am registered to vote
28 13.9
Bruce Rauner - Republican 58 28.9 Pat Quinn - Democrat 101 50.2 Chad Grimm - Libertarian 7 3.5 Other – Write In 2 1.0 Vote for Endorsed Candidate
Voted for Quinn 101 50.2 Did not vote for Quinn 100 49.8

142
Table 5 Descriptive Statistics for Party Identification and Political Ideology Variable N % M SD Party Identification 3.55 1.77 Strong Democrat 23 11.4 Democrat 51 25.4 Leaning Democrat 30 14.9 Independent 34 16.9 Leaning Republican 27 13.4 Republican 25 12.4 Strong Republican 11 5.5 Economic Ideology 4.23 1.48 Highly Liberal 9 4.5 Liberal 23 11.4 Slightly Liberal 13 6.5 Moderate 79 39.3 Slightly Conservative 29 14.4 Conservative 40 19.9 Highly Conservative 8 4.0 Social Ideology 3.91 1.61 Highly Liberal 18 9.0 Liberal 28 13.9 Slightly Liberal 20 10.0 Moderate 71 35.3 Slightly Conservative 27 13.4 Conservative 27 13.4 Highly Conservative 10 5.0 Overall Ideology 4.07 1.43 Highly Liberal 7 3.5 Liberal 30 14.9 Slightly Liberal 17 8.5 Moderate 79 39.3 Slightly Conservative 27 13.4 Conservative 37 18.4 Highly Conservative 4 2.0 Combined Economic, Social, and Overall Political Ideology
3.00 21.00 12.21 4.27
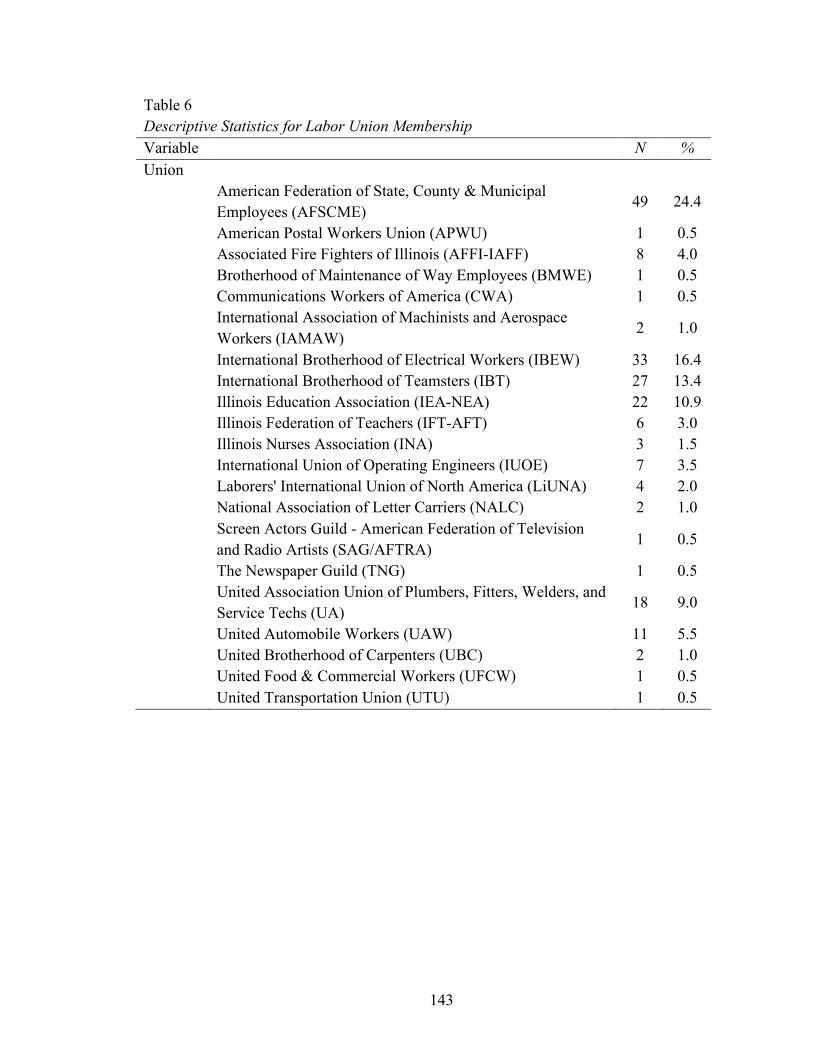
143
Table 6 Descriptive Statistics for Labor Union Membership Variable N % Union
American Federation of State, County & Municipal Employees (AFSCME)
49 24.4
American Postal Workers Union (APWU) 1 0.5 Associated Fire Fighters of Illinois (AFFI-IAFF) 8 4.0 Brotherhood of Maintenance of Way Employees (BMWE) 1 0.5 Communications Workers of America (CWA) 1 0.5
International Association of Machinists and Aerospace Workers (IAMAW)
2 1.0
International Brotherhood of Electrical Workers (IBEW) 33 16.4 International Brotherhood of Teamsters (IBT) 27 13.4 Illinois Education Association (IEA-NEA) 22 10.9 Illinois Federation of Teachers (IFT-AFT) 6 3.0 Illinois Nurses Association (INA) 3 1.5 International Union of Operating Engineers (IUOE) 7 3.5 Laborers' International Union of North America (LiUNA) 4 2.0 National Association of Letter Carriers (NALC) 2 1.0
Screen Actors Guild - American Federation of Television and Radio Artists (SAG/AFTRA)
1 0.5
The Newspaper Guild (TNG) 1 0.5
United Association Union of Plumbers, Fitters, Welders, and Service Techs (UA)
18 9.0
United Automobile Workers (UAW) 11 5.5 United Brotherhood of Carpenters (UBC) 2 1.0 United Food & Commercial Workers (UFCW) 1 0.5 United Transportation Union (UTU) 1 0.5

144
Table 7 Descriptive Statistics for Labor Union Job Titles Variable N % Job Title Actor 1 0.5 Apprentice Lineman 4 2.0 Apprentice Operating Engineer 1 0.5 Assembler and Tester 3 1.5 Baker 1 0.5 Broadcast Engineer 1 0.5 Captain 1 0.5 Captain / Treasurer 1 0.5 Captain Retired 1 0.5 Chief Clerk 1 0.5 Clerk 1 0.5 Communications Clerk 1 0.5 Conductor 1 0.5 Construction 1 0.5 Correctional Counselor 1 0.5 Correctional Counselor II 1 0.5 Correctional Lieutenant 5 2.5 Correctional Major Shift Supervisor 2 1.0 Correctional Officer 23 11.4 Correctional Officer (President) 1 0.5 Correctional Sergeant 3 1.5 Custodial Foreman 1 0.5 Custodian 13 6.5 Driver 3 1.5 Engineer 2 1.0 Fire / Arson Investigator 1 0.5 Firefighter 1 0.5 Foreman Journeyman Electrician 3 1.5 General Services 3 1.5 Habilitation Program Coordinator 1 0.5 Healthcare and Family Services Nurse 1 0.5 Human Service Casework Manager 1 0.5 Investigator 1 0.5 Journeyman Carpenter 2 1.0 Journeyman Electrician 17 8.5 Journeyman Instrument Technician 1 0.5

145
Journeyman Lineman 4 2.0 Journeyman Machinist 1 0.5 Journeyman Mechanical Engineer 1 0.5 Journeyman Operating Engineer 4 2.0 Journeyman Operating Engineer Working Foreman 1 0.5 Journeyman Pipefitter 3 1.5 Journeyman Plumber 4 2.0 Journeyman Plumber Lead 1 0.5 Journeyman Powerhouse Electrician 2 1.0 Journeyman Reporter 1 0.5 Journeyman Steamfitter 9 4.5 Journeyman Technician 1 0.5 Journeyman Welder Retired 1 0.5 Laborer 4 2.0 Lecturer and Assistant Professor 1 0.5 Letter Carrier 2 1.0 Licensed Practical Nurse 2 1.0 Lieutenant 1 0.5 Machine Operator 1 0.5 Machinist 1 0.5 Maintenance Craftsman 1 0.5 Major 1 0.5 Material Handler 1 0.5 Mechanic 1 0.5 Mental Health Technician I 2 1.0 Mental Health Technician II 1 0.5 Mental Health Technician III 1 0.5 Non-Tenure Track Faculty 2 1.0 Paraprofessional 1 0.5 Professor 1 0.5 Quality Specialist 1 0.5 Quality Specialist IV 1 0.5 Registered Nurse 4 2.0 Retired Machinist 1 0.5 Safety 1 0.5 Salvage Welder 1 0.5 SDS for State 1 0.5 Sportswriter 1 0.5 Support Service Worker 1 0.5 Teacher 22 10.9

146
Teacher’s Assistant 1 0.5 Union Steward 1 0.5 Working Foreman Clerk 2 1.0

147
Table 8 Descriptive Statistics for Labor Union City Located in Illinois Variable N % City Bloomington 3 1.5 Burr Ridge 1 0.5 Carol Stream 1 0.5 Centralia 48 23.9 Chicago 11 5.5 Columbia 1 0.5 Dunlap 1 0.5 East Alton 1 0.5 East Peoria 17 8.5 Elgin 1 0.5 Elwood Park 1 0.5 Galesburg 12 6.0 Glenview 1 0.5 Joliet 1 0.5 Kewanee 1 0.5 La Grange 1 0.5 Mackinaw 1 0.5 Macomb 1 0.5 Mokena 2 1.0 Normal 2 1.0 Pekin 1 0.5 Peoria 67 33.3 Pinckneyville 2 1.0 Rock Island 1 0.5 Rockford 1 0.5 Romeoville 1 0.5 Springfield 18 9.0 St. Louis a 1 0.5 Wheeling 1 0.5 Note. a While this union is headquartered in Missouri, the local union meetings are held in Peoria, IL, and the union members live in Illinois.

148
Table 9 Descriptive Statistics for Key Independent Variables Variable Range M SD Exposure
Union Member Exposure to Labor Union Media
0.00 64.00 12.83 13.67
Mediums Newspaper 0.00 31.00 9.71 5.84 Radio 0.00 27.00 6.16 5.96 Television 0.00 50.00 18.51 10.84 Internet 0.00 73.00 16.28 15.81 Media Trust Newspaper 0.00 36.00 19.55 6.33 Radio 0.00 30.00 14.81 5.51 Television 0.00 54.00 29.33 10.03 Internet 0.00 105.00 59.00 20.77 Labor Media Trust 0.00 108.00 56.17 20.36 Evaluation of Candidates
Bruce Rauner – Republican 0.00 100.0 25.51 30.13 Pat Quinn – Democrat 0.00 100.0 38.95 31.03 Chad Grimm - Libertarian 0.00 100.0 27.47 25.52 Evaluation of RTW and AU Laws
Right-to-Work Laws 0.00 100.0 20.13 31.21 Anti-Union Laws 0.00 100.0 10.84 23.26 Combined RTW and AU 0.00 200.0 30.97 45.34 Labor Media Traditional Labor Mediaa 0.00 6.00 1.59 1.39 New Labor Social Mediaa 0.00 3.50 0.78 0.89 Traditional minus New -2.88 6.00 0.81 1.38 Note. a Traditional and New Labor Social Media scores presented are from mean scores because there were only two for traditional and eight for new media.

149
Table 10 Descriptive Statistics for Channels including Newspaper, Radio, Television, and Internet (N = 201) Variable Range M SD Newspaper
Local Daily Paper (like Journal Star)
0 6 3.39 2.01
Local Weekly Paper (like The Weekly Messenger)
0 6 1.23 1.65
State Daily Paper (like The Chicago Tribune)
0 6 1.02 1.58
National Daily Paper (like The New York Times)
0 6 0.88 1.49
Your Local Labor Union Paper (like The Labor Paper)
0 6 1.78 1.57
Your National Labor Union Paper (like The Electrical Worker)
0 6 1.40 1.48
Other Newspaper (Write In) a 0 6 0.25 0.92 Radio
Local AM Radio (like 1470 WMBD-AM)
0 6 1.25 1.88
Regional AM Radio (like 890 WLS-AM)
0 6 0.85 1.62
Local FM Radio (like Public Radio 89.9 WCBU)
0 6 2.28 2.36
Satellite Radio (like Sirius XM) 0 6 0.98 1.85 Internet Streamed Radio 0 6 0.81 1.68 Other Radio (Write In) a 0 5 0.11 0.62 Television ABC 0 6 2.66 1.99 CBS 0 6 2.56 2.00 NBC 0 6 3.08 2.07 FOX 0 6 1.99 2.05 PBS 0 6 1.37 1.79 Al Jazeera America 0 6 0.19 0.77 BBC World 0 6 0.64 1.36 CNN 0 6 2.47 2.06 FOX News Channel 0 6 1.70 2.04 MSNBC 0 6 1.85 1.92 Other TV (Write In) a 0 6 0.38 1.26

150
Internet Facebook (any page with news) 0 6 2.91 2.43
Your Local Labor Union on Facebook
0 6 2.02 2.16
Your National Labor Union on Facebook
0 6 1.30 1.90
Illinois AFL-CIO on Facebook 0 6 0.90 1.60 AFL-CIO on Facebook 0 6 0.77 1.50 Twitter (any feed with news) 0 6 0.37 1.26 Your Local Labor Union on Twitter 0 6 0.16 0.72
Your National Labor Union on Twitter
0 6 0.17 0.73
Illinois AFL-CIO on Twitter 0 6 0.15 0.71 AFL-CIO on Twitter 0 6 0.15 0.71 Websites (any site with news) 0 6 2.64 2.30 Your Local Labor Union Website 0 6 1.23 1.75
Your National Labor Union Website
0 6 0.91 1.54
Illinois AFL-CIO Website 0 5 0.60 1.20 AFL-CIO Website 0 5 0.53 1.15 YouTube (any channel with news) 0 6 0.72 1.49
Your Local Labor Union on YouTube
0 6 0.23 0.78
Your National Labor Union on YouTube
0 6 0.22 0.78
Illinois AFL-CIO on YouTube 0 6 0.17 0.66 AFL-CIO on YouTube 0 4 0.17 0.51 Other Internet (Write In)a 0 6 0.36 1.18 Note. a Other scores were not used in the analysis.

151
Table 11 Descriptive Statistics for Channels including Newspaper Trust, Radio Trust, Television Trust, and Internet Trust Variable N Range M SD Newspaper
Local Daily Paper (like Journal Star)
186 0 6 3.28 1.47
Local Weekly Paper (like The Weekly Messenger)
93 0 5 3.29 1.24
State Daily Paper (like The Chicago Tribune)
85 0 6 3.25 1.49
National Daily Paper (like The New York Times)
74 0 6 3.38 1.60
Your Local Labor Union Paper (like The Labor Paper)
143 0 6 3.92 1.49
Your National Labor Union Paper (like The Electrical Worker)
123 0 6 3.85 1.54
Other Newspaper (Write In) a 22 0 6 3.32 1.21 Radio
Local AM Radio (like 1470 WMBD-AM)
80 0 6 3.43 1.38
Regional AM Radio (like 890 WLS-AM)
58 0 6 3.29 1.27
Local FM Radio (like Public Radio 89.9 WCBU)
116 0 6 3.72 1.24
Satellite Radio (like Sirius XM) 58 0 6 3.33 1.23 Internet Streamed Radio 48 0 6 2.90 1.36 Other Radio (Write In) a 10 3 6 3.60 1.08 Television ABC 150 0 6 3.56 1.20 CBS 147 0 6 3.54 1.20 NBC 159 0 6 3.49 1.28 FOX 118 0 6 3.05 1.58 PBS 97 0 6 3.95 1.28 Al Jazeera America 17 0 6 3.53 1.63 BBC World 49 1 6 3.84 1.33 CNN 139 0 6 3.69 1.31 FOX News Channel 100 0 6 3.29 1.73 MSNBC 115 0 6 3.54 1.35 Other TV (Write In) a 22 0 5 2.95 1.21

152
Internet Facebook (any page with news) 135 0 5 2.39 1.29
Your Local Labor Union on Facebook
112 0 6 3.81 1.38
Your National Labor Union on Facebook
82 0 6 3.89 1.40
Illinois AFL-CIO on Facebook 65 0 6 3.85 1.40 AFL-CIO on Facebook 59 0 6 3.93 1.34 Twitter (any feed with news) 21 1 5 2.86 0.96
Your Local Labor Union on Twitter
14 2 6 3.64 1.34
Your National Labor Union on Twitter
15 2 5 3.47 0.92
Illinois AFL-CIO on Twitter 13 2 5 3.46 1.05 AFL-CIO on Twitter 13 2 5 3.46 1.05 Websites (any site with news) 134 0 6 2.98 1.13 Your Local Labor Union Website 86 1 6 4.14 1.12
Your National Labor Union Website
68 1 6 4.18 1.16
Illinois AFL-CIO Website 54 1 6 3.98 1.22 AFL-CIO Website 49 1 6 4.08 1.19 YouTube (any channel with news) 48 0 5 2.73 1.01
Your Local Labor Union on YouTube
23 1 5 3.43 .99
Your National Labor Union on YouTube
22 1 5 3.45 1.01
Illinois AFL-CIO on YouTube 18 1 5 3.50 1.20 AFL-CIO on YouTube 17 1 5 3.53 1.13 Other Internet (Write In) a 23 1 6 2.60 1.17 Note. a Other scores were not used in the analysis.

153
Table 12 Descriptive Statistics for Variables Union Involvement and Religiosity Variable Range M SD Union Involvement a
0 30 12.78 8.36
How often do you attend regularly scheduled union meetings?
0 6 2.51 2.01
How often do you make attending a union meeting a priority if a special vote has been called?
0 6 3.94 2.08
How often do you participate in union-sponsored community activities (e.g., marching in the labor day parade, participating in blood drives, boycotting do not patronize stores, etc.)?
0 6 2.50 1.84
How often do you participate in union-sponsored labor activities (e.g., picketing a non-union job site, manning phone banks to get out the vote, attending an awards banquet, etc.)?
0 6 2.14 1.91
How often do you volunteer/run to participate in a leadership position to serve the members of the union (e.g., as an officer or member of the board, committees, teaching, etc.) when positions are available?
0 6 1.68 2.16
Religiosity a 0 24 12.50 7.69
How much guidance does religion provide you in your day-to-day life?
0 6 3.44 2.24
How often do you attend religious services?
0 6 1.92 1.66
How often does religion play an important role in your life?
0 6 3.31 2.26
How often do you pray? 0 6 3.83 2.30 Note. a Results for combined scores.

154
Table 13 H1a Correlation Coefficient for Evaluation of Union-Endorsed Candidate and Predictor Variables Variable 1 2 3 4 5 6 7
Feeling Thermometer-Pat Quinn (D) Predictor Variable
-.22*** -.08 .12* -.50*** -.38*** .02 .22***
1. Gender - .13* -.33*** .15* -.04 .12* -.18** 2. Race - .04 .03 .03 .08 .04 3. Income - -.06 .01 -.15* .18**
4. Party Identification
- .66*** .17** -.35***
5. Party Ideology
- .24*** -.19**
6. Religiosity - -.07
7. Exposure to Labor Union Media
-
Note. *p < .05; **p < .01; ***p < .001 Table 14 H1a Hierarchical Multiple Regression Analysis Summary for Exposure to Labor Union Media Positively Predicting a Favorable Evaluation of Union-Endorsed Candidate Variable B SEB β R2 ΔR2 VIF Step 1 .31 .31*** Gender -10.16 4.41 -.15* 1.23 Race -7.76 7.97 -.06 1.03 Income 1.98 1.94 .07 1.17 Party Identification -6.61 1.50 -.38*** 2.03 Political Ideology -1.20 .61 -.17* 1.93 Religiosity .65 .25 .16** 1.10 Step 2 .31 .001
Exposure to Labor Union Media
.07 .15 .03 1.18
Note. *p < .05; **p < .01; ***p < .001

155
Table 15 H1b Correlation Coefficient for Evaluation of Non Union-Endorsed Republican Candidate and Predictor Variables Variable 1 2 3 4 5 6 7
Feeling Thermometer-Bruce Rauner (R) Predictor Variable
.31*** .10 -.09 .64*** .44*** .15* -.36***
1. Gender - .13* -.33*** .15* -.04 .12* -.18** 2. Race - .04 .03 .03 .08 .04 3. Income - -.06 .01 -.15* .18**
4. Party Identification
- .66*** .17** -.35***
5. Party Ideology
- .24*** -.19**
6. Religiosity - -.07
7. Exposure to Labor Union Media
-
Note. *p < .05; **p < .01; ***p < .001 Table 16 H1b Hierarchical Multiple Regression Analysis Summary for Exposure to Labor Union Media Positively Predicting a Negative Evaluation of Non Union-Endorsed Republican Candidate Variable B SEB β R2 ΔR2 VIF Step 1 .47 .47*** Gender 14.48 3.70 .22*** 1.23 Race 6.90 6.67 .05 1.03 Income 1.16 1.63 .04 1.17 Party Identification 8.45 1.26 .50*** 2.03 Political Ideology .65 .51 .09 1.93 Religiosity .05 .21 .01 1.10 Step 2 .48 .02**
Exposure to Labor Union Media
-.31 .12 -.14** 1.18
Note. *p < .05; **p < .01; ***p < .001

156
Table 17 H2 Correlation Coefficient for Right-to-Work (RTW) and Anti-Union (AU) Laws and Predictor Variable Variable 1 2 3 4 5 6 7
Feeling Thermometer RTW / AU Predictor Variable
.29*** -.01 -.20** .26*** .21*** -.004 -.17**
1. Gender - .13 -.33*** .15* -.04 .12* -.18** 2. Race - .04 .03 .03 .08 .04 3. Income - -.06 .01 -.15** .18**
4. Party Identification
- .66*** .17** -.35***
5. Party Ideology
- .24*** -.19**
6. Religiosity - -.07
7. Exposure to Labor Union Media
-
Note. *p < .05; **p < .01; ***p < .001 Table 18 H2 Hierarchical Multiple Regression Analysis Summary for Exposure to Labor Union Media Negatively Predicting a Favorable Evaluation of Right-to-Work Anti-Union Laws Variable B SEB β R2 ΔR2 VIF Step 1 .17 .17*** Gender 24.66 7.06 .254*** 1.23 Race -7.59 12.74 -.04 1.03 Income -5.00 3.10 -.11 1.17 Party Identification 2.67 2.40 .10 2.03 Political Ideology 1.84 .97 .17 1.93 Religiosity -66 .41 -.11 1.10 Step 2 .17 .002
Exposure to Labor Union Media
-.14 .24 -.04 1.18
Note. *p < .05; **p < .01; ***p < .001

157
Table 19 H3a Hierarchical Logistic Regression Analysis Summary for Exposure to Labor Union Media Positively Predicting Awareness of Union’s Endorsements Variable B SEB Wald Exp(B) R2 a Step 1 .18*** Gender -.21 .41 .27 .81 Race -.50 .87 .33 .61 Income .53 .20 3.18 1.42 Party Identification -.52 .16 10.39*** .60 Political Ideology .09 .06 2.09 1.09 Religiosity .02 .03 .52 1.02 Step 2 .19***
Exposure to Labor Union Media
.36 .33 1.17 1.43
Note. *p < .05; **p < .01; ***p < .001; a Nagelkerke

158
Table 20 H3b Correlation Coefficient for a Favorable Evaluation of the Union-Endorsed Candidate and Predictor Variable Variable 1 2 3 4 5 6 7
Feeling Thermometer-Pat Quinn (D) Predictor Variable
-.22*** -.08 .12* -.50*** -.38*** .02 .19**
1. Gender - .13* -.33*** .15* -.04 .12 -.16** 2. Race - .04 .03 .03 .08 -.04 3. Income - -.06 .01 -.15* .17**
4. Party Identification
- .66*** .17** -.29***
5. Party Ideology
- .24*** -.10
6. Religiosity - -.01
7. Awareness of Union’s Endorsement
-
Note. *p < .05; **p < .01; ***p < .001 Table 21 H3b Hierarchical Multiple Regression Analysis Summary for Awareness of Union’s Endorsement Positively Predicting a Favorable Evaluation of the Union-Endorsed Candidate Variable B SEB β R2 ΔR2 VIF Step 1 .31 .31*** Gender -10.22 4.40 -.15* 1.22 Race -7.43 7.96 -.06 1.03 Income 1.97 1.94 .07 1.17 Party Identification -6.61 1.50 -.38*** 2.03 Political Ideology -1.22 .61 -.17* 1.95 Religiosity .64 .26 .16** 1.11 Step 2 .31 .001
Awareness of Union’s Endorsement
2.24 4.71 .03 1.13
Note. *p < .05; **p < .01; ***p < .001

159
Table 22 H3c Correlation Coefficient for a Negative Evaluation of the Non-Union-Endorsed Republican Candidate and Predictor Variable Variable 1 2 3 4 5 6 7
Feeling Thermometer-Bruce Rauner (R) Predictor Variable
.31*** .10 -.09 .64*** .44*** .15* -.30***
1. Gender - .13* -.33*** .15* -.04 .12* -.16** 2. Race - .04 .03 .03 .08 -.04 3. Income - -.06 .01 -.15* .16**
4. Party Identification
- .66*** .17** -.28***
5. Party Ideology
- .24*** -.10
6. Religiosity - -.01
7. Awareness of Union’s Endorsement
-
Note. *p < .05; **p < .01; ***p < .001 Table 23 H3c Hierarchical Multiple Regression Analysis Summary for Awareness of Union’s Endorsement Negatively Predicting a Favorable Evaluation of the Non-Union-Endorsed Republican Candidate Variable B SEB β R2 ΔR2 VIF Step 1 .47 .47*** Gender 14.9 3.71 .23*** 1.22 Race 5.53 6.70 .04 1.03 Income 1.09 1.64 .04 1.17 Party Identification 8.61 1.26 .51*** 2.03 Political Ideology .71 .51 .10 1.95 Religiosity .06 .21 .02 1.11 Step 2 .48 .01*
Awareness of Union’s Endorsement
-8.17 3.96 -.11* 1.13
Note. *p < .05; **p < .01; ***p < .001

160
Table 24 H3d Correlation Coefficient for a Favorable Evaluation Right-to-Work (RTW) and Anti-Union (AU) Laws and Predictor Variable Variable 1 2 3 4 5 6 7
Feeling Thermometer RTW / AU Predictor Variable
.29*** -.01 -.20** .26*** .21*** .004 -.35***
1. Gender - .13* -.33*** .15* -.04 .12* -.16** 2. Race - .04 .03 .03 .08 -.04 3. Income - -.06 .01 -.15* .16**
4. Party Identification
- .66*** .17** -.28***
5. Party Ideology
- .24*** -.10
6. Religiosity - -.01
7. Awareness of Union’s Endorsement
-
Note. *p < .05; **p < .01; ***p < .001 Table 25 H3d Hierarchical Multiple Regression Analysis Summary for Awareness of Union’s Endorsement Negatively Predicting a Favorable Evaluation of Right-to-Work and Anti-Union Laws Variable B SEB β R2 ΔR2 VIF Step 1 .17 .17*** Gender 23.33 6.76 .24*** 1.22 Race -9.61 12.23 -.05 1.03 Income -3.71 2.98 -.09 1.17 Party Identification .59 2.30 .02 2.03 Political Ideology 2.18 .94 .21* 1.95 Religiosity -.59 .39 -.10 1.11 Step 2 .23 .07***
Awareness of Union’s Endorsement
-29.50 7.23 -.27*** 1.13
Note. *p < .05; **p < .01; ***p < .001

161
Table 26 RQ2 Moderation Analysis Summary for Total Effect of Exposure to Labor Union Media Predicting Evaluation of the Gubernatorial Candidates (i.e., Rauner, Quinn, and Grimm) via Traditional versus New Labor Media Variable SEa ba LLCI ULCI Rauner Difference Traditional versus
New Labor Media 1.39
0.6 -2..15 3.35+
Exposure to Labor Union Media
.11 -.29**
-.49 -.08
Interaction .11 0.04 -.18 .27+ Gender 4.07 14.60**
* 6.58 22.62
Race 7.09 6.83 -7.15 20.82+ Income 1.73 1.1 -2.32 4.51+ Party Identification 1.41 8.59*** 5.82 11.37 Party Ideology .56 0.63 -.46 1.73+ Religiosity .23 0.06 -.39 .51+ Constant 8.79 -27.95** -45.28 -10.61 Quinn Difference Traditional versus
New Labor Media 1.94
0.44 -3.39 4.26+
Exposure to Labor Union Media
.15 0.13
-.17 .42+
Interaction .16 0.16 -.15 .46+ Gender 4.75 -10.33* -19.70 -.96 Race 6.61 -7.62 -20.65 5.42+ Income 1.95 1.8 -2.05 5.64+ Party Identification 1.67 -6.55*** -9.84 -3.26 Party Ideology .65 -1.17 -2.46 .12+ Religiosity .28 .67* .11 1.23 Constant 10.50 73.04**
* 52.33 93.76
Grimm Difference Traditional versus
New Labor Media 1.41
0.89 -1.90 3.68+
Exposure to Labor Union Media
.15 0.19
-.11 .48+
Interaction .12 -0.14 -.38 .10+ Gender 4.53 1.48 -7.45 10.40+

162
Race 9.53 -9.45 -28.24 9.34+ Income 1.77 -3.16 -6.66 .33+ Party Identification 1.57 3.88** .78 6.98 Party Ideology .62 -0.31 -1.54 .92+ Religiosity .26 -0.27 -.77 .24+ Constant 12.33 39.05** 14.73 63.38 Note. *p < .05; **p < .01; ***p < .001. a Unstandardized values reported according to Hayes (2013). 1000 bootstrap samples used. +Confidence interval ncludes zero, and is not valid.

163
Table 27 H4a Correlation Coefficient for Evaluation of Union-Endorsed Candidate and Predictor Variables Variable 1 2 3 4 5 6 7
Feeling Thermometer-Pat Quinn (D) Predictor Variable
-.22*** -.08 .12* -.50*** -.38*** .02 .36***
1. Gender - .13* -.33*** .15* -.04 .12* -.09 2. Race - .04 .03 .03 .08 .05 3. Income - -.06 .01 -.15* .15*
4. Party Identification
- .66*** .17** -.37***
5. Party Ideology
- .24*** .33***
6. Religiosity - -.08
7. Trust in Labor Union Media
-
Note. *p < .05; **p < .01; ***p < .001 Table 28 H4a Hierarchical Multiple Regression Analysis Summary for Trust in Labor Union Media Positively Predicting a Favorable Evaluation of Union-Endorsed Candidate Variable B SEB β R2 ΔR2 VIF Step 1 .31 .31*** Gender -10.05 4.63 -.15* 1.22 Race -8.88 8.40 -.07 1.03 Income 1.40 2.05 .05 1.17 Party Identification -6.00 1.56 -.34*** 1.96 Political Ideology -.96 .65 -.13 1.97 Religiosity .63 .27 .16* 1.11 Step 2 .33 .03**
Trust in Labor Union Media
4.11 1.59 .18** 1.21
Note. *p < .05; **p < .01; ***p < .001

164
Table 29 H4b Correlation Coefficient for Evaluation of Non-Union-Endorsed Republican Candidate and Predictor Variables Variable 1 2 3 4 5 6 7
Feeling Thermometer-Bruce Rauner (R) Predictor Variable
.31*** .10 -.09 .64*** .44*** .15* -.31***
1. Gender - .13 -.33*** .15* -.04 .12* -.09 2. Race - .04 .03 .03 .08 .05 3. Income - -.06 .01 -.15* .15*
4. Party Identification
- .66*** .17** -.37*
5. Party Ideology
- .24*** -.33***
6. Religiosity - -.08
7. Trust in Labor Union Media
-
Note. *p < .05; **p < .01; ***p < .001 Table 30 H4a Hierarchical Multiple Regression Analysis Summary for Trust in Labor Union Media Positively Predicting a Favorable Evaluation of Non-Union-Endorsed Republican Candidate Variable B SEB β R2 ΔR2 VIF Step 1 .47 .47*** Gender 15.26 4.00 .24*** 1.22 Race 6.51 7.26 .05 1.03 Income .95 1.77 .03 1.17 Party Identification 8.97 1.34 .53*** 1.96 Political Ideology .52 .56 .07 1.97 Religiosity .05 .23 .01 1.11 Step 2 .47 .01
Trust in Labor Union Media
-1.67 1.38 -.08 1.21
Note. *p < .05; **p < .01; ***p < .001

165
Table 31 RQ4 Moderation Analysis Summary for Total Effect of Exposure to Labor Union Media Predicting Evaluation of Union-Endorsed Candidate via Trust in Labor Union Media Variable SEa ba LLCI ULCI Exposure to Labor Union Media .19 0.02 .05 8.31 Trust in Labor Union Media 2.09 4.18* -.35 .39+ Interaction .15 -0.03 -.32 .25+ Gender 5.30 -10.39 -20.85 .06+ Race 6.77 -8.01 -21.37 5.35+ Income 2.26 1.46 -3.00 5.92+ Party Identification 1.75 -5.42** -8.88 -1.95 Political Ideology .71 -1.14 -2.54 .25+ Religiosity .30 0.54 -.04 1.13+ Constant 10.78 72.18*** 50.89 93.46 Note. *p < .05; **p < .01; ***p < .001. a Unstandardized values reported according to Hayes (2013). 1000 bootstrap samples used. +Confidence interval ncludes zero, and is not valid.

166
Table 32 RQ5 Moderation Analysis Summary for Total Effect of Exposure to Labor Union Media Predicting Evaluation of Union-Endorsed Candidate via Close Involvement in Labor Union Variable SEa ba LLCI ULCI Exposure to Labor Union Media .22 0.13 -.44 .77+ Union Involvement .31 0.16 -.30 .57+ Interaction .02 -0.02 -.06 .02+ Gender 4.72 -9.48* -18.79 -.17 Race 6.69 -7.89 -21.09 5.31+ Income 2.01 1.71 -2.25 5.67+ Party Identification 1.59 -6.59*** -9.72 -3.45 Political Ideology .65 -1.15 -2.44 .14+ Religiosity .28 .62* .06 1.17 Constant 10.35 74.89*** 54.47 95.31 Note. ***p < .001. a Unstandardized values reported according to Hayes (2013). +Confidence interval ncludes zero, and is not valid.

167
FIGURES
Figure 1. RQ1 Means of Most Used Mediums
Figure 1. The figure shows statistically significant (linear, quadratic, and cubic trend of most used medium of news for labor union members. Figure 2. RQ3 Means of Most Trusted Mediums
Figure 2. The figure shows statistically significant linear trend of most trusted medium of news for labor union members.
1.851.62
1.23
0.81
0
0.5
1
1.5
2
2.5
3
3.5
4
4.5
Television Newspaper Radio Internet
M
M
3.59 3.5 3.493.26
0
0.5
1
1.5
2
2.5
3
3.5
4
4.5
Newspaper Television Radio Internet
M
M

168
Figure 3. RQ1 Means of Top 1-10 Most Used Channels
Figure 3. Note. Maximum vertical axis set to compare with Figures 4, 5, and 6. *Any page with news opposed to specific sites with news. Figure 4. RQ1 Means of Top 11-20 Most Used Channels
Figure 4. Note. Maximum vertical axis set to compare with Figures 3, 5, and 6.
3.393.08 2.91 2.66 2.64 2.56 2.47
2.28 2.02 1.99
0.000.501.001.502.002.503.003.504.004.50
M
M
1.85 1.78 1.701.40 1.37 1.30
1.25 1.23 1.23 1.02
0.000.501.001.502.002.503.003.504.004.50
M
M

169
Figure 5. RQ3 Means of Top 1-10 Most Trusted Channels
Figure 5. Note: Maximum vertical axis set to compare with Figures 3, 4, and 6. Figure 6. RQ3 Means of Top 11-20 Most Trusted Channels
Figure 6. Note: Maximum vertical axis set to compare with Figures 3, 4, and 5.
4.18 4.14 4.08 3.98 3.95 3.93 3.92 3.89 3.85 3.85
0.000.501.001.502.002.503.003.504.004.50
M
M
3.84 3.81 3.72 3.69 3.64 3.56 3.54 3.54 3.53 3.53
0.000.501.001.502.002.503.003.504.004.50
M
M

170
APPENDIX
Note. This page intentionally left blank.

171
Labor Union Communication Survey
Dear Labor Union Member of Illinois:!!Thank you for volunteering to participate in this research study. The purpose of this research is to understand labor union communication and vote choice. During this study you will fill out a survey about media, your involvement in your labor union, and vote choice.!!You must be 18 years of age, and a current or retired member of a labor union in the State of Illinois to participate. The entire survey should take 20 minutes or less to complete, and your responses are confidential. !!If you complete the survey now you may enter for a chance to win one of four gift cards to Bass Pro Shop or Amazon (your choice). For a chance to win, complete by April 5th for $500, by April 7th for $300, by April 10th for $150, or by April 30th for $50. Any information you provide will be kept separately from your responses if you choose to participate in the drawing. !!If you have questions about this research study you may contact the principal investigator, Anji L Phillips, doctoral candidate in the Department of Communication at the University of Missouri and Instructor at Bradley University, at 309-453-8403. !!If you have additional questions, please feel free to contact Anji's advisor: Mitchell S. McKinney, Ph.D., Professor & Chair at the University of Missouri in the Department of Communication, and Director of the Political Communication Institute at 573-882-9230. !Please note: If you have any questions about this study’s approval by the Institutional Review Board (IRB) or would like to more about your rights as a research participant, please contact the University of Missouri-Columbia Campus IRB at 573-882-9585.!
The following box includes your Survey ID number. If you prefer to complete the paper version of this survey, you may start the survey now. If you would prefer to take this survey online, enter this Survey ID number at the following website, and return the paper version: XXXXXXXXXXXXXXXX

172
Rate your feelings on the following three candidates.
Rate from 0 to 100, where 0 represents a "cold, unfavorable" or negative rating, and 100 signifies a "warm, favorable" or positive rating.
Bruce Rauner - Republican
Pat Quinn - Democrat
Chad Grimm - Libertarian
Rate your feelings on the following two laws.
Rate from 0 to 100, where 0 represents a "cold, unfavorable" or negative rating, and 100 signifies a "warm, favorable" or positive rating.
How do you feel about laws that remove the requirement to pay union dues for representation (by public, private, and partial-public sector unions)?
How do you feel about laws that limit the ability of unions to collectively bargain for benefits (by public, and partial-public sector unions)?

173
I read from the following types of newspapers to get political information. (Select one for each type).
Never
Almost Never (a few times
a year)
Rarely (Once a
month or less)
Sometimes (a few
times per month)
Often (once
a week)
Frequently (a few times per
week)
Every Day
Local Daily Paper (like Journal Star) Local Weekly Paper (like The Weekly Messenger) State Daily Paper (like The Chicago Tribune) National Daily Paper (like The New York Times) Your Local Labor Union Paper (like The Labor Paper) Your National Labor Union Paper (like The Electrical Worker) Other Newspaper (Write In)
Which candidate did your labor union endorse for governor of the State of Illinois? (Select one).
I do not know who was endorsed
Bruce Rauner - Republican
Pat Quinn - Democrat
Chad Grimm - Libertarian

174
I listen to the following types of radio channels to get political information. (Select one for each type).
Never
Almost Never (a few times
a year)
Rarely (Once a
month or less)
Sometimes (a few
times per month)
Often (once a week)
Frequently (a few times per week)
Every Day
Local AM Radio (like 1470 WMBD-AM) Regional AM Radio (like 890 WLS-AM) Local FM Radio (like Public Radio 89.9 WCBU) Satellite Radio (like Sirius XM) Internet Streamed Radio Other Radio (Write In)

175
I watch the following types of television channels to get political information. (Select one for each type).
Never
Almost Never (a few times
a year)
Rarely (Once a
month or less)
Sometimes (a few
times per month)
Often (once a week)
Frequently (a few times per week)
Every Day
ABC CBS NBC FOX PBS Al Jazeera America
BBC World
CNN
FOX News Channel
MSNBC Other TV (Write In)

176
I use the following types of Internet sites to get political information. (Select one for each type).
Never
Almost Never (a few times
a year)
Rarely (Once a
month or less)
Sometimes (a few
times per month)
Often (once a week)
Frequently (a few times per week)
Every Day
Facebook Facebook (any page with news)
Your Local Labor Union on Facebook
Your National Labor Union on Facebook
Illinois AFL-CIO on Facebook
AFL-CIO on Facebook
Twitter Twitter (any feed with news)
Your Local Labor Union on Twitter
Your National Labor Union on Twitter
Illinois AFL-CIO on Twitter
AFL-CIO on Twitter

177
I use the following types of Internet sites to get political information. (Select one for each type).
Never Almost
Never (a few times a year)
Rarely (Once a month or
less)
Sometimes (a few times per month)
Often (once a week)
Frequently (a few times per week)
Every Day
Websites Websites (any site with news)
Your Local Labor Union Website
Your National Labor Union Website
Illinois AFL-CIO Website
AFL-CIO Website
YouTube YouTube (any channel with news)
Your Local Labor Union on YouTube
Your National Labor Union on YouTube
Illinois AFL-CIO on YouTube
AFL-CIO on YouTube Other Other Internet (Write In)

178
I trust this source of media for political information: (Select one for each type of newspaper). Absolutely
Untrust-worthy
Untrust-worthy
Slightly Untrust-worthy
Neutral Slightly Trust-worthy
Trust-worthy
Absolutely Trust-worthy
Local Daily Paper (like Journal Star) Local Weekly Paper (like The Weekly Messenger) State Daily Paper (like The Chicago Tribune) National Daily Paper (like The New York Times) Your Local Labor Union Paper (like The Labor Paper) Your National Labor Union Paper (like The Electrical Worker) Other Newspaper (Write In)

179
I trust this source of media for political information. (Select one for each type of radio channel). Absolutely
Untrust-worthy
Untrust-worthy
Slightly Untrust-worthy
Neutral Slightly Trust-worthy
Trust-worthy
Absolutely Trust-worthy
Local AM Radio (like 1470 WMBD-AM) Regional AM Radio (like 890 WLS-AM) Local FM Radio (like Public Radio 89.9 WCBU) Satellite Radio (like Sirius XM) Internet Streamed Radio Other Radio (Write In)

180
I trust this source of media for political information. (Select one for each type of TV channel). Absolutely
Untrust-worthy
Untrust-worthy
Slightly Untrust-worthy
Neutral Slightly Trust-worthy
Trust-worthy
Absolutely Trust-worthy
ABC CBS NBC FOX PBS Al Jazeera America
BBC World
CNN
FOX News Channel
MSNBC Other TV (Write In)

181
I trust this source of media for political information. (Select one for each type of Internet site). Absolutely
Untrust-worthy
Untrust-worthy
Slightly Untrust-worthy
Neutral Slightly Trust-worthy
Trust-worthy
Absolutely Trust-worthy
Facebook Facebook (any page with news)
Your Local Labor Union on Facebook
Your National Labor Union on Facebook
Illinois AFL-CIO on Facebook
AFL-CIO on Facebook
Twitter Twitter (any feed with news)
Your Local Labor Union on Twitter
Your National Labor Union on Twitter
Illinois AFL-CIO on Twitter
AFL-CIO on Twitter

182
I trust this source of media for political information. (Select one for each type of Internet site). Absolutely
Untrust-worthy
Untrust-worthy
Slightly Untrust-worthy
Neutral Slightly Trust-worthy
Trust-worthy
Absolutely Trust-worthy
Websites Websites (any site with news)
Your Local Labor Union Website
Your National Labor Union Website
Illinois AFL-CIO Website
AFL-CIO Website
YouTube YouTube (any channel with news)
Your Local Labor Union on YouTube
Your National Labor Union on YouTube
Illinois AFL-CIO on YouTube
AFL-CIO on YouTube Other Other Internet (Write In)

183
Consider your level of involvement in the union for the following questions. (Choose one for each item).
Never
Almost Never
(less than 10% of
the time)
Rarely (about 30% of
the time)
Sometimes (about 50% of the time)
Often (about
70% of the time)
Frequently (about 90% of the time)
Every Time
How often do you attend regularly scheduled union meetings?
How often do you make attending a union meeting a priority if a special vote has been called?
How often do you participate in union-sponsored community activities (e.g., marching in the labor day parade, participating in blood drives, boycotting do not patronize stores, etc.)?
How often do you participate in union-sponsored labor activities (e.g., picketing a non-union job site, manning phone banks to get out the vote, attending an awards banquet, etc.)?
How often do you volunteer/run to participate in a leadership position to serve the members of the union (e.g., as an officer or member of the board, committees, teaching, etc.) when positions are available?

184
Which political party do you most identify with? (Select one). Strong
Democrat Democrat Leaning Democrat Independent Leaning
Republican Republican Strong Republican
Consider your political ideology for the following. (Choose one for each item).
Highly Liberal Liberal Slightly Liberal Moderate Slightly
Conservative Conservative Highly Conservative
Economic Ideology Social Ideology Overall Ideology
Consider your religion for the following. (Choose one for each item).
Never Almost
Never (a few times a year)
Rarely (once a month)
Sometimes (a few times
a month)
Often (Once a week)
Frequently (a few times
a week)
Every Day
How much guidance does religion provide you in your day-to-day life?
How often do you attend religious services? How often does religion play an important role in your life?
How often do you pray?

185
Whom did you vote for Governor for the State of Illinois in the November 4, 2014 election?
I am not registered to vote
I did not vote, but I am registered to vote
Bruce Rauner - Republican
Pat Quinn - Democrat
Chad Grimm - Libertarian
Other (Write In)
What is your membership status in your union?
Not a member Fair Share Member Member Retired
What city is your local union located? (Write In)
What city do you have union meetings? (Write In)

186
Are you considered a student, apprentice, trainee, non-tenured, journeyman, tenured, or certified?
None Student Apprentice Trainee Non-tenured Journeyman Tenured Certified
Which labor union do you belong to? (Write In. For example, AFSCME, IBEW).
What is your local number? (Write In).
What is your council number? (Write In Number, or 0 if you do not have one).
What is your union classification? (Write In. For example, RC6, Inside Wireman, etc.).

187
What is your job title in the labor union? (Write In. For example, Captain, Journeyman Electrician, etc.).
How many years have you been a member of your labor union? (Write In. Round up to nearest year).
Write your age. (In years).
Household Income (Select one).
25K or Less 25-50K 50-75K 75-100K 100-125K Greater than 125K
Select your gender:
Male
Female

188
Race (Check all that apply to you):
American Indian or Alaska Native
Asian
Black or African American or Haitian American
Native Hawaiian or Other Pacific Islander
White or European American or Middle Eastern American or North African American
Other (Write In)
Hispanic or Latino (of any race)
Education (Check all that apply to you):
High School or GED Equivalent
Some College
Associate Degree
Bachelor’s Degree
Master’s Degree
Graduate of Apprenticeship Training Program
Doctoral Degree

189
Thank you for taking the time to complete this survey. Your answers will help researchers understand more about labor union communication. If you completed the survey you may now enter for a chance to win one of four gift cards ($500, $300, $150, $50) to Bass Pro Shop or Amazon. Simply include your name, phone number where you may be reached, and the best time to call. Do not enter any information if you do not want to enter. If you are randomly selected to win, you will be contacted by phone before May 31st. Again, thank you for your time.
Name (Write In):
Phone Number with Area Code (Write In):
Best time to call with AM or PM (Write In):

190
VITA
Anji L (Rigg) Phillips was born and raised in Peoria, Illinois. She majored in
radio and television, and earned her bachelor’s degree in Communication from Bradley
University in 1994. She worked in industry for a time, and left to pursue her master’s
degree. She completed her thesis on the effects of a political documentary film on the
favorability of political candidates, and received a Master of Science in Communication
from Illinois State University in 2007. Phillips completed her doctoral studies at the
University of Missouri in 2015. She has co-authored four journal articles, and enjoys
research at the intersection of political and mass communication with a particular interest
in labor unions. She has worked full time at Bradley University since 2012, where she
teaches courses in both audio and television production, in addition to, media
management, sales, and programming and promotion. Phillips will continue working at
Bradley University as an assistant professor of television arts in the Department of
Communication.