labor market l - bureau of labor statistics · employment and unemployment, are ... taiwan czech...
TRANSCRIPT

14 CHARTING INTERNATIONAL LABOR COMPARISONS | SEPTEMBER 2012 U.S. BUREAU OF LABOR STATISTICS | www.bls.gov
2
Labor force statistics, such as employment and unemployment, are key indicators of how labor markets are functioning within and
across countries. Labor force levels and participation rates provide information on the supply of labor in an economy. Employment levels and employment-population ratios measure the extent to which people are engaged in productive labor market activities, while unemployment levels and rates provide information on an economy’s unused labor supply.
LaborMarket
SECTION

U.S. BUREAU OF LABOR STATISTICS | www.bls.gov SEPTEMBER 2012 | CHARTING INTERNATIONAL LABOR COMPARISONS 15
China and India had the largest workforces; China had the highest labor force participation rate, while India had the lowest.
Women made up less
than half of the labor force
in all selected countries
and Europe. India had
the lowest proportion
of women in the labor
market, by far.
2.1CHAR
TLabor force size, gender composition, and participation rates, selected countries, 2010Women's share of the labor force (percent)
50 55 60 65 70 75 80
Total labor force participation rate (percent)
NOTE: Each bubble represents the size of the labor force for that country. Europe includes Austria, Belgium, Czech Republic, Denmark, Estonia, Finland, France, Germany, Greece, Hungary, Ireland, Italy, the Netherlands, Norway, Poland, Portugal, Slovakia, Spain, Sweden, Switzerland, and the United Kingdom.
SOURCES: U.S. Bureau of Labor Statistics and International Labour Office.
50
45
40
35
30
25
20
Canada
Australia
Argentina
South KoreaJapan
Philippines
Mexico
Brazil
India
ChinaEurope
UnitedStates

16 CHARTING INTERNATIONAL LABOR COMPARISONS | SEPTEMBER 2012 U.S. BUREAU OF LABOR STATISTICS | www.bls.gov
Women’s participation rates in India and Mexico were among the lowest, and these countries had the largest gender gaps.
Labor force
participation rates were
higher for men than
women in all selected
countries, although the
size of the male-female
gap varied considerably.
The largest differences
between men and women
were in Asian and Latin
American countries.
The highest
participation rates for
men were in large
emerging economies:
Brazil, India, Mexico, and
China. China also had the
highest participation rate
for women and, thus, a
relatively low gender gap.
2.2CHAR
T Labor force participation rates by sex, selected countries, 2010
China
Canada
Norway
New Zealand
Sweden
Switzerland
Australia
Denmark
Brazil
Netherlands
United States
United Kingdom
Singapore
Estonia
Portugal
Finland
Austria
Israel
Ireland
Germany
France
Spain
Slovakia
Philippines
Czech Republic
South Korea
Japan
Poland
Belgium
Argentina
Greece
Mexico
Hungary
Italy
India
0 30 40 50 60 70 80 90
SOURCES: U.S. Bureau of Labor Statistics and International Labour Office.
Percent
Women's participation rate Men's participation rate
— Male-female gap

U.S. BUREAU OF LABOR STATISTICS | www.bls.gov SEPTEMBER 2012 | CHARTING INTERNATIONAL LABOR COMPARISONS 17
2.3CHAR
T
India
Mexico
South Korea
Philippines
Italy
Israel
Argentina
Ireland
Hungary
United States
Brazil
Australia
Greece
Japan
Poland
New Zealand
United Kingdom
Singapore
Spain
Belgium
Canada
Slovakia
Germany
Norway
Czech Republic
Finland
Austria
Netherlands
Estonia
Portugal
France
Denmark
Switzerland
Sweden
China 0 10 20 30 40 50 60 70 80 90 100
SOURCE: International Labour Office.
Percent
Ages 15–24
Ages 25–54
Ages 55–64
Ages 65 and older Participation
rates were lowest for those ages 65 and older in all selected countries except South Korea.
In the Philippines, more
than one-third of people
ages 65 and older were
still in the labor force. In
contrast, many European
countries had rates below 5
percent for this age group.
Participation rates
among youth (ages
15–24) varied most across
countries. The Netherlands
and Australia had the
highest participation rates,
and Hungary, South Korea,
and Italy had the lowest
rates.
Labor force participation rates by age, selected countries, 2010

18 CHARTING INTERNATIONAL LABOR COMPARISONS | SEPTEMBER 2012 U.S. BUREAU OF LABOR STATISTICS | www.bls.gov
The working-age population is composed of those in the labor force—the employed and the unemployed—and those not in the labor force.
Italy was the only
country with less than
half of its working-age
population in the labor
force.
High unemployment in
Spain and Estonia led to
employment rates similar
to countries with lower
labor force participation,
such as Italy and Hungary.
2.4CHAR
T Working-age population by labor force status, selected countries, in percent, 2010
China
Brazil
Switzerland
New Zealand
Canada
Singapore
Australia
Norway
United States
Sweden
Denmark
Philippines
Netherlands
United Kingdom
Portugal
Mexico
Estonia
Austria
Argentina
Ireland
South Korea
Finland
Spain
Slovakia
Japan
Czech Republic
Germany
Israel
France
Poland
India
Greece
Belgium
Hungary
Italy
0 10 20 30 40 50 60 70 80 90 100
SOURCES: U.S. Bureau of Labor Statistics and International Labour Office.
Percent
Employed Unemployed Not in the labor force

U.S. BUREAU OF LABOR STATISTICS | www.bls.gov SEPTEMBER 2012 | CHARTING INTERNATIONAL LABOR COMPARISONS 19
In 2010, China and Switzerland had the highest proportions of employed persons, while Italy and Hungary had the lowest.
Employment-population
ratios decreased between
2007 and 2010 in 30 out
of 36 selected countries,
with the steepest declines
in Ireland, Estonia, Spain,
and the United States.
2.5CHAR
TEmployment-population ratios,selected countries, 2007 and 2010
China
Switzerland
Brazil
Norway
New Zealand
Singapore
Australia
Canada
Netherlands
Denmark
Philippines
Sweden
United States
Mexico
United Kingdom
South Korea
Austria
Japan
Argentina
Portugal
Finland
Taiwan
Czech Republic
Germany
India
Israel
Ireland
France
Estonia
Slovakia
Poland
Belgium
Greece
Spain
Hungary
Italy
0 20 40 60 80
SOURCES: U.S. Bureau of Labor Statistics and International Labour Office.
Percent
2010 2007

20 CHARTING INTERNATIONAL LABOR COMPARISONS | SEPTEMBER 2012 U.S. BUREAU OF LABOR STATISTICS | www.bls.gov
Between 2007 and 2010, the sharpest declines in employment were in Estonia and Ireland, followed by Spain and the United States.
Employment grew
from 2000 to 2007 in all
selected countries except
Japan, but it decreased
in almost half of the
selected countries from
2007 to 2010, a period of
global recession.
The largest gains in
employment between
2007 and 2010 were in
Singapore, Israel, and
the Philippines. These
countries and Poland were
the only countries that
had more employment
growth between 2007
and 2010 than between
2000 and 2007.
2.6CHAR
T Employment growth, selected countries, average annual rates, 2000–2007 and 2007–2010
Estonia
Ireland
Spain
United States
Denmark
Hungary
Portugal
Greece
Japan
Finland
Italy
Slovakia
Czech Republic
United Kingdom
Netherlands
Sweden
New Zealand
France
India
Belgium
South Korea
Germany
Canada
Taiwan
China
Switzerland
Austria
Norway
Argentina
Mexico
Poland
Brazil
Australia
Philippines
Israel
Singapore
–5 –4 –3 –2 –1 0 1 2 3 4 5
SOURCES: U.S. Bureau of Labor Statistics and International Labour Office.
Percent
2007–2010 2000–2007

U.S. BUREAU OF LABOR STATISTICS | www.bls.gov SEPTEMBER 2012 | CHARTING INTERNATIONAL LABOR COMPARISONS 21
Part-time work for men and women was most prevalent in the Netherlands; it was much less common in Eastern European countries.
A larger share of
employed women worked
part time (fewer than
30 hours per week) than
did employed men in all
selected countries. The
part-time employment
rate for women was
roughly two to five times
higher than the men’s rate
in all selected countries.
2.7CHAR
TPart-time employment rates by sex, selected countries, 2010
Netherlands
Switzerland
United Kingdom
Australia
Ireland
Germany
Japan
New Zealand
Austria
Belgium
Italy
Norway
Mexico
Canada
Denmark
France
Israel
Spain
Sweden
United States
Finland
South Korea
Greece
Portugal
Poland
Estonia
Czech Republic
Hungary
Slovakia
0 10 20 30 40 50 60 70
SOURCE: Organisation for Economic Co-operation and Development.
Percent
Men Women

22 CHARTING INTERNATIONAL LABOR COMPARISONS | SEPTEMBER 2012 U.S. BUREAU OF LABOR STATISTICS | www.bls.gov
More than half of employment was in the service sector in all selected countries.
The United States,
the Netherlands, and the
United Kingdom had the
largest shares of service
employment (more than
80 percent).
The largest shares of
industry employment
(near or more than
30 percent) were in
five Eastern European
countries: the Czech
Republic, Hungary,
Estonia, Slovakia, and
Poland. These countries,
plus Portugal and Mexico,
also had the lowest
shares of employment in
services.
Mexico, Poland,
Greece, and Portugal had
the largest agricultural
sectors.
2.8CHAR
T Share of employment by sector, selected countries, 2010
Netherlands
United States
United Kingdom
Denmark
Canada
Sweden
Norway
Australia
Greece
Israel
Ireland
France
New Zealand
Switzerland
Spain
Finland
Belgium
Mexico
Austria
South Korea
Japan
Italy
Portugal
Germany
Poland
Slovakia
Estonia
Hungary
Czech Republic
0 20 40 60 80 100Percent
NOTE: 2009 data for the Czech Republic and Switzerland. Agriculture includes hunting, forestry, and fishing. Industry is composed of mining and quarrying, manufacturing, construction, and for some countries, public utilities (electricity, gas, and water). Public utilities represent less than 3 percent of industry in all countries shown.
SOURCES: U.S. Bureau of Labor Statistics and Organisation for Economic Co-operation and Development.
Industry Services Agriculture
U.S. BUREAU OF LABOR STATISTICS | www.bls.gov SEPTEMBER 2012 | CHARTING INTERNATIONAL LABOR COMPARISONS 23
2.9CHAR
T
SOURCES: U.S. Bureau of Labor Statistics and Organisation for Economic Co-operation and Development.
Percent
United States
Mexico
Canada
North America
20
15
10
5
0
Poland
Slovakia
Estonia
Czech Republic
Hungary
Percent Eastern Europe
20
15
10
5
0
2000 2002 2004 2006 2008 2010
2000 2002 2004 2006 2008 2010
2000 2002 2004 2006 2008 2010 2000 2002 2004 2006 2008 2010
2000 2002 2004 2006 2008 2010
2000 2002 2004 2006 2008 2010
Percent
New Zealand
South Korea Japan
Australia
Asia and Oceania
20
15
10
5
0
Percent
GermanyIreland
France
Austria
United Kingdom
Switzerland
Western Europe
20
15
10
5
0
Finland
Sweden
Denmark
NorwayNetherlands
Percent Northern Europe
20
15
10
5
0
Spain
Greece
Portugal
Italy
Percent Southern Europe
20
15
10
5
0
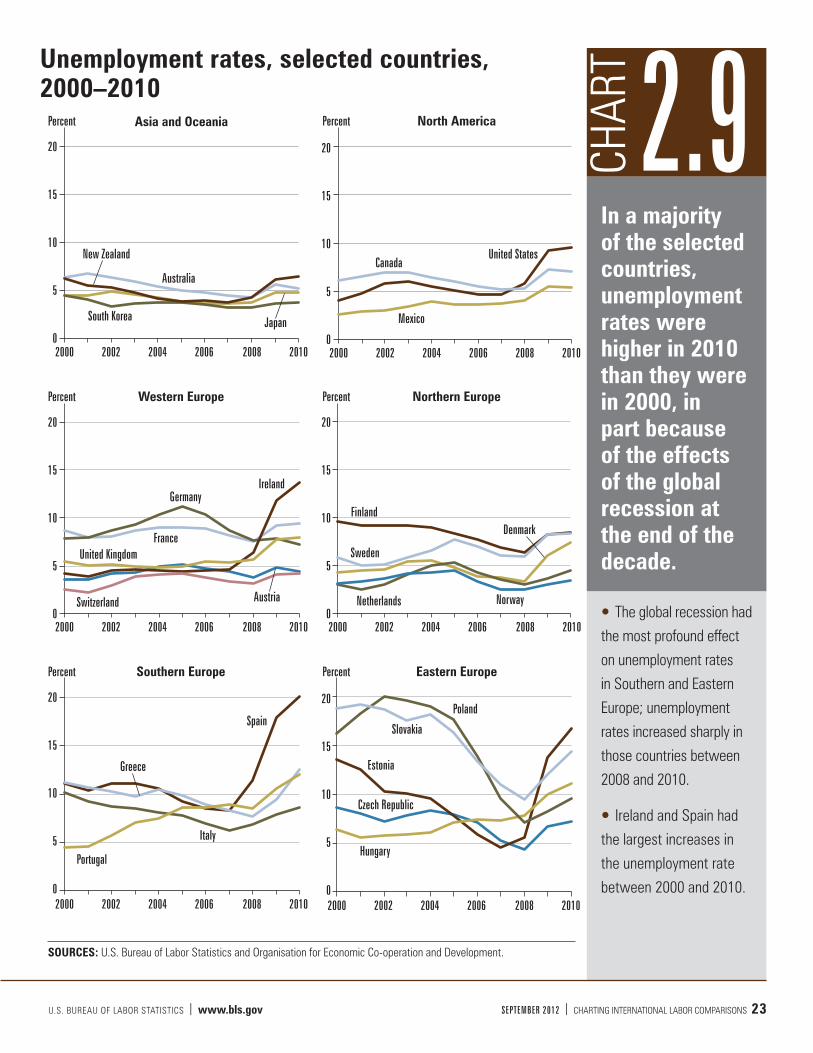
Unemployment rates, selected countries, 2000–2010
In a majority of the selected countries, unemployment rates were higher in 2010 than they were in 2000, in part because of the effects of the global recession at the end of the decade.
The global recession had
the most profound effect
on unemployment rates
in Southern and Eastern
Europe; unemployment
rates increased sharply in
those countries between
2008 and 2010.
Ireland and Spain had
the largest increases in
the unemployment rate
between 2000 and 2010.

24 CHARTING INTERNATIONAL LABOR COMPARISONS | SEPTEMBER 2012 U.S. BUREAU OF LABOR STATISTICS | www.bls.gov
Unemployment rates for youth (teenagers and young adults) are generally higher than those for adults, partly because youth lack skills and work experience. They are therefore more vulnerable to economic downturns.
Unemployment rates
for youth are highest in
Eastern and Southern
Europe. For countries
in these regions, youth
unemployment rates
topped 30 percent for
teenagers, and exceeded
15 percent for young
adults.
2.10CHAR
TSwitzerland
Japan
Mexico
Austria
Germany
Netherlands
South Korea
Norway
Denmark
Australia
Canada
Israel
New Zealand
United States
Finland
France
United Kingdom
Poland
Portugal
Belgium
Sweden
Greece
Czech Republic
Ireland
Italy
Hungary
Estonia
Spain
Slovakia
0 10 20 30 40 50 60 70
Percent
NOTE: For Canada, France, Norway, Spain, Sweden, the United Kingdom, and the United States, teenagers are ages 16 to 19.
SOURCES: U.S. Bureau of Labor Statistics and Organisation for Economic Co-operation and Development.
Unemployment rates by age, selected countries, 2010
Teenagers (15–19) Young adults (20–24) Adults (25 and older)

U.S. BUREAU OF LABOR STATISTICS | www.bls.gov SEPTEMBER 2012 | CHARTING INTERNATIONAL LABOR COMPARISONS 25
In 26 out of 30 selected countries, college graduates had the lowest unemployment rates, followed by high school graduates; those with less than a high school education had the highest rates.
The unemployment
rate gap between
persons with less than
a high school education
and those with a high
school diploma was
generally larger than the
gap between college
graduates and high school
graduates, reflecting the
value of a high school
education in seeking
employment.
2.11CHAR
TUnemployment rates by education, selected countries, 2009
Norway
Netherlands
Switzerland
Austria
South Korea
New Zealand
Australia
Mexico
Denmark
Czech Republic
Italy
United Kingdom
Japan
Sweden
Belgium
France
Brazil
Poland
Germany
Finland
Israel
Canada
Hungary
Portugal
Greece
United States
Slovakia
Ireland
Estonia
Spain
0 5 10 15 20 25 30 35 40Percent
NOTE: Data refer to persons ages 25 to 64. Data for those who have less than a high school education are not available for Japan.
SOURCE: Organisation for Economic Co-operation and Development.
Less than high school High school or trade school College or university

26 CHARTING INTERNATIONAL LABOR COMPARISONS | SEPTEMBER 2012 U.S. BUREAU OF LABOR STATISTICS | www.bls.gov
Long-term unemployment (1 year or more) made up the largest share of total unemployment in 13 out of 28 selected countries; the 12 countries with the largest shares of long-term unemployment were all in Europe.
Slovakia had the
highest composition of
long-term unemployment,
with nearly 60 percent
of the unemployed out of
work for 1 year or more.
In Mexico, more
than two-thirds of the
unemployed were out
of work for less than 3
months.
2.12CHAR
T Composition of unemployment by duration, selected countries, 2010
Slovakia
Portugal
Hungary
Ireland
Belgium
Italy
Germany
Estonia
Spain
Greece
Czech Republic
France
Japan
Switzerland
United Kingdom
United States
Netherlands
Poland
Austria
Finland
Israel
Denmark
Australia
Sweden
Canada
Norway
New Zealand
Mexico
0 20 40 60 80 100
Percent
SOURCE: Organisation for Economic Co-operation and Development.
1 year or more 3 months to less than 1 year Less than 3 months

U.S. BUREAU OF LABOR STATISTICS | www.bls.gov SEPTEMBER 2012 | CHARTING INTERNATIONAL LABOR COMPARISONS 27
SourcesData for 10 countries for most indicators are based
on the BLS report International Comparisons of
Annual Labor Force Statistics, Adjusted to U.S.
Concepts, 10 Countries, 1970–2010. The 10
countries are the United States, Canada, Australia,
Japan, France, Germany, Italy, the Netherlands,
Sweden, and the United Kingdom. To facilitate
international comparisons, BLS adjusts data for
these countries to U.S. concepts. For specific
adjustments and breaks in series, see the country
notes associated with the BLS report.
Data for the remaining countries and for some
indicators in their entirety—labor force participation
rates by age (chart 2.3), part-time employment rates
(chart 2.7), and unemployment by education (chart
2.11) and by duration (chart 2.12)—are based on
data from the International Labour Office (ILO) or
the Organisation for Economic Co-operation and
Development (OECD).
Country coverage for labor force levels and
participation rates, employment-population
ratios, and employment growth (charts 2.1–2.6) is
supplemented with data from the ILO database Key
Indicators of the Labour Market (KILM). The KILM
harmonizes data using econometric models to
account for differences in national data and scope of
coverage, collection and tabulation methodologies,
and other country-specific factors, such as military
service requirements. Although some differences
remain between the KILM and ILC series, they do
not materially affect comparisons across countries.
Country coverage for part-time employment
rates, employment by sector, and unemployment
data (charts 2.7–2.12) is supplemented with data
from the OECD database OECD.Stat. The OECD
generally uses labor force surveys and captures
labor force statistics according to ILO guidelines,
which facilitate cross-country comparisons, because
these guidelines create a common conceptual
framework for countries. However, except for total
unemployment rates (chart 2.9), the OECD does
not adjust data for differences that remain across
countries in coverage and definitions that can
affect international comparisons. See Labor Force
Statistics in OECD Countries: Sources, Coverage and
Definitions. For total unemployment rates, the OECD
series used is the “harmonized unemployment rates”
(HURs), which are adjusted to conform to the ILO
guidelines in countries where deviations occur. For
a full discussion of comparability issues, see the
BLS article, “International unemployment rates:
how comparable are they?” at www.bls.gov/opub/
mlr/2000/06/art1full.pdf.
Using multiple sources for an indicator to extend
country coverage can introduce additional
comparability issues, because each organization
employs different methods for harmonizing data,
if adjustments are made at all. Users should use
caution when making international comparisons
and are encouraged to review the methodological
documents associated with each source.
In chart 2.6, the periods 2000–2007 and 2007–2010
are selected to compare a time of global recession
(2007–2010) against a prerecessionary time (2000–
Section 2 Notes LABOR MARKET

28 CHARTING INTERNATIONAL LABOR COMPARISONS | SEPTEMBER 2012 U.S. BUREAU OF LABOR STATISTICS | www.bls.gov
2007). The chart shows the average annual growth
rate during each period. Although 2007 is included
in both, it represents two different annual changes
that do not overlap: 2006–2007 in the first period and
2007–2008 in the second period.
DefinitionsLabor market data cover only civilians (i.e., members
of the Armed Forces are not included). The labor force
participation rate is the labor force as a percent of the
working-age population. The labor force is the sum of
all persons classified as employed and unemployed.
The working-age population is either ages 15 and
older or ages 16 and older, with the lower age limits
varying by country. (See BLS and ILO documents
from above sources.)
The employed are persons who, during the
reference week, did work for at least 1 hour as
paid employees; worked in their own business,
profession, or on their own farm; or did work as
unpaid workers in an enterprise operated by a family
member (for at least 1 hour according to the ILO
guidelines but for at least 15 hours according to
U.S. concepts). Definitions of the employed vary by
country. (See BLS, ILO, and OECD documents from
above sources.) The employment-population ratio is
employment as a percentage of the working-age
population. Part-time employment refers to employed
persons who usually work less than 30 hours per
week in their main job; in some countries, “actual”
rather than “usual” hours are used. The part-time
employment rate is the share of total employment that
is part time and is also referred to as the incidence
of part-time employment.
The unemployed are persons without work, who were
actively seeking employment and currently available
to start work. Definitions of the unemployed vary by
country. (See BLS and OECD documents from above
sources.) The unemployment rate is unemployment as
a percentage of the labor force; it is the most widely
used measure of an economy’s unused labor supply.
For unemployment rates by education (chart 2.11),
the levels of educational attainment accord with
the 1997 International Standard Classification for
Education (ISCED). Less than high school corresponds
to “less than upper secondary education” and includes
ISCED levels 0–2 and 3C. High school or trade school
corresponds to “upper secondary and post-secondary
education” and includes levels 3A, 3B, and 4. College
or university corresponds to “tertiary non-university
and university” and includes levels 5–6.