lab-scale demonstration of the urex+ process
TRANSCRIPT

IIFET 2012 Tanzania Proceedings
1
IMPROVING THE SUPPLY CHAIN OF TILAPIA INDUSTRY OF THE PHILIPPINES
Wilfred Jamandre, Central Luzon State University, [email protected]
Upton Hatch, North Carolina State University, [email protected]
Remedios Bolivar, Central Luzon State University, [email protected]
Russell Borski, North Carolina State University, [email protected]
ABSTRACT
This study evaluated the Philippine tilapia supply chain including the roles of key actors, logistical issues, external
influences, and transaction flows among market levels. It identified improvement areas and provided
recommendations for the industry. Key players include hatcheries, nurseries, commercial/small-scale farmers,
consumers and institutional buyers. Pampanga, Batangas and Laguna are major tilapia sources while Metro Manila,
Angeles and Baguio are the major demand centers. Dagupan is the major tilapia transshipment point for Northern
Luzon. Many farmers employ a 'circuitous' production technique to meet markets' preferences. Direct buying and
selling at central markets are the common operations of the tilapia industry. Consumers generally prefer whole live
fish with size from 250-300 grams per fish. The requirements of institutional buyers are more varied. Filleted tilapia
requires about 2-3 pieces per kg. High costs of logistics and transactions; lack of cold storage and transport vehicles;
and meeting delivery requirements are the major concerns of nurseries, farmers and traders. Irregular supply of
desired quality and volume of tilapia, limited capital for expansion, and predatory market practices are the main
concerns of processors. Some recommendations to address the issues and concerns, are: encourage the establishment
of more nurseries while intensifying technology transfer to farmers; conduct promotions for niche opportunities of
tilapia; motivate small farmers to link with supply chains through an incentive mix; institutionalize an accreditation
program for feed manufacturers, hatcheries, processors, etc.; and provide capital windows to improve facilities and
reduce logistics and transaction costs in the entire supply chain.
INTRODUCTION
Tilapia culture is widely undertaken in the Philippines with regions III and IV of Luzon Island constituting the major
production areas. Due to the product attributes and productivity as offshoots of research and development (R & D)
in the mid 80’s, tilapia production has been a dynamic aquaculture enterprise in the country. Markets for tilapia
remain vibrant with encouraging growth potentials. All major demand areas such as cities of Metro Manila, Baguio
and Angeles, among others, are now preferring other product forms and shopping venues for reasons of convenience
and availability than the traditional marketing mode.
Recently, efforts to sustain the industry’s growth momentum have been focused on the genetic improvement of
broodstock through cross breeding of different strains. Likewise, improved stock management and cultural practices
have been developed to decrease mortality and to maintain growth vigor.
However, the tilapia industry remains slow to serve new market niches such as supermarkets, food chains and
exports. Scale issues and environmental factors further preclude expansion to new markets.
This existing condition of the tilapia industry necessitates a more coordinated production, handling and distribution
processes or activities in order to achieve a more efficient and sustainable industry in an environment of increased
competition due to liberalized markets.
Objectives
This study was designed to evaluate and develop an efficient tilapia supply chain to foster the development of viable
fast food and supermarket purchases of tilapia from small-scale producers. Specifically, the objectives are:
(1) Develop tilapia supply chain maps for each market level, i.e., producer, wholesale, restaurant, supermarket, fast
food stores, etc., to identify specific activities and services, key players, logistical issues, external influences,
flow of product, and information and payment among market levels.
(2) Analyze tilapia supply chain performance for efficiency, flexibility and overall responsiveness.
(3) Identify areas for improvement in supply chain (i.e.,behavioral, institutional and process),
(4) Provide recommendations to improve the tilapia industry in general and its specific supply chain items

IIFET 2012 Tanzania Proceedings
2
METHODOLOGY
This study was guided by the general methodology employed in [4].
Study Areas and Coverage
The study covered Regions III, IV and Metro Manila (e.g., National Capital Region, NCR). In order to draw the
major tilapia routes, at least one shipment in each of these regions, from the supply center to the ultimate end-user
was traced.
Table 1 shows the total number of respondents covered, for each of the supply chains mapped. Five chain players
performed either one process or a combination of processes depending on the degree of coordination in the chain.
These players include hatchery and nursery operators, farmers, processors, traders/consolidators/shippers and
institutional buyers.
Table 1. Number of respondents covered in the tilapia supply chains
Routes of SC mapped Supply Chain Players Number of Respondents
Bicol-Laguna-Batangas-
Manila-Baguio (Chain 1):
Hatchery and Nursery Operators 3
Fish farmers 15
Processors 2
Traders/consolidators 8
Institutional buyers 5
Pampanga-Pangasinan-Ilocos
and Isabela - Baguio and
Manila (Chain 2):
Hatchery and Nursery Operators 2
Fish farmers 13
Processors 2
Traders/consolidators 16
Institutional buyers 6
Data Collection and Requirements
Primary data were obtained through survey, key informant interview and focus group discussions (FGD). FGD was
also conducted to validate secondary information and to answer more specific questions related to supply chain
mapping. A questionnaire was designed to answer key questions, such as:
1. Who are the key costumers and what are their product requirements (especially quality standards)?
2. Who are the key players and what are their respective roles?
3. How do product, information and money flow through the supply chain?
4. What are the activities and services provided at each level in the supply chain?
5. What are the critical logistics issues?
6. What are the external influences?
Secondary data were obtained from various agencies such as the Bureau of Agricultural Statistics (BAS), Bureau of
Fisheries and Aquatic Resources (BFAR) and other relevant agencies of the Department of Agriculture (DA).
Previous studies on the production and marketing of tilapia also served as sources of secondary information [2] and
[3], including the Central Luzon State University. Finally, officers and staff of appropriate government agencies and
other industry personalities composed the key informants’ pool.
The following primary data were collected: key players and their respective roles, activities and services, product
requirements (especially quality standards), information and money flows, critical logistics issues (including
problems in production and marketing), extension services and external influences.

IIFET 2012 Tanzania Proceedings
3
Data Processing and Analysis
Table 2 presents method of analysis for each objective. Areas for improvement in the supply chain were identified
and specific policy recommendations were formulated to improve the country’s tilapia industry, through an
improved supply chain management.
Table 2. Objectives and methods of analysis
Objectives Methods of Analysis
(1) To provide an overview of the tilapia industry Synthesis of relevant studies and trends
(2) To map out the specific supply chain for tilapia Flowchart analysis from downstream to upstream
(3) Analyze the performance of the tilapia supply chain in
terms of efficiency, flexibility and overall responsiveness
Descriptive statistics, and relevant performance
metrics (both qualitative and quantitative)
(4) Identify areas for improvement in the supply chain such as
behavioral, institutional and process
(5) To provide specific policy recommendations to improve
the tilapia industry in general, and the specific supply
chain in particular
RESULTS AND DISCUSSION
The Philippine Tilapia Industry: An Overview
In 2008, Philippines tilapia production was estimated at 299,813 MT [2]. Out of this, regions III and IV contributed
about 80% while the rest of the regions shared the remaining 20%. The top 5 producing provinces (in descending
order) include Pampanga (37.68%), Batangas (21.06%), Laguna (4.64%), Rizal (4.06%) and Bulacan (3.58%).
Important inputs to tilapia culture are the quality of seeds and broodstocks. With R&D agencies such as CLSU,
BFAR and GIFT foundation, among others, many hatchery farms were established across the country. However,
despite the combined production outputs of the hatcheries, the demand for fry and fingerlings exceeds supply. Many
producers adopt direct and indirect stocking due to high mortality rates and longer culture periods [1]. Those who
stock directly have a higher density per m2 than their counterparts. Those who stock indirectly require larger sized
fingerlings from mesh size 17-14, hence, offering opportunities for nursery operations.
Other inputs consist of capital investments like land, water supply system, drainage system, pump and supplies or
equipment (seine net, weighing scales, tubs/buckets). Inputs also include the operating capital – fingerlings,
fertilizer (chicken manure and ammonium phosphate), supplemental feeding (fry mash, fish starter, fish grower, fish
finisher), labor, fuel/lubricant and electricity. Each item affects the operation of the tilapia industry particularly with
regard to feeds, which accounts for about 73% of the operating capital [1].
Marketing systems of tilapia in the Philippines is as varied as the locations of the supply sources. The traditional
marketing of tilapia in some places is relatively simple. Traders normally pick up the harvested tilapia at the farms.
Most tilapia farmers sell their produce to wholesalers-assemblers. Some sell their produce to retailers, consumers,
and brokers. In Central Luzon, some distributors and retailers procure tilapia in bulk on unsorted basis. Moreover,
there are some traders that take charge in harvesting the produce and pay all the expenses during the activity. This
practice is very common in the province of Pampanga [1]. Some traders, particularly wholesalers, finance small-
scale farmers in order to be assured of a steady supply of fish. Under this arrangement, the farmer is required to sell
exclusively to the trader at a pre-agreed price. Major marketing issues for tilapia include fluctuating prices, irregular
supply, nonpayment of debts by traders, informal levies (particularly when transporting the product), and seasonal
off-flavors that render the fish less marketable.
The supermarket phenomenon and more liberalized trading environment have induced the emergence of market
niches such as the fillet, smoked, dried and other processed forms. Links with these new markets and increased
participation of small-scale producers require a new approach to tilapia marketing.

IIFET 2012 Tanzania Proceedings
4
Key Customers and Product Requirements
The tilapia chain’s key customers are classified into two: the institutional buyers (hypermarkets or
restaurants/specialty food shops) and the household-level/end-users or consumers.
Product form
Generally, household customers prefer live whole tilapia with firm meat and with the size of 4-5 pieces per kg (200 -
250 g per fish). Also, regular tilapia consumers in Manila and Southern Luzon are indifferent relative to the source
and skin color of tilapia. However, consumers in the Northern Luzon markets such as Pangasinan and Baguio
exhibit similar fish size requirements except that they prefer darker-skinned tilapia because they perceive that these
fish have more belly fat and are tastier. The common food recipes for tilapia are charcoal grilled, fried, boiled and
“paksiw”. Most of these customers buy tilapia from fish vendors at local public markets or stalls. Regular customers
in Laguna require daily volume of about 1,700 kg while Manila customers require 2,500 kg per day.
Institutional buyers such as specialty shops, hypermarkets or malls, restaurants and food chains cater to relatively
affluent customers with varied product requirements. Hypermarkets normally require live whole fish with size from
3-4 pieces per kg (250 – 350 g per fish). Institutional buyers of this sort are indifferent to the source of tilapia as
long as suppliers meet the fish size, volume and delivery requirements as stipulated in the marketing contract.
Hypermarkets in Manila and Laguna normally require 500 – 1000 kg of tilapia per day while Pangasinan and
Baguio require a daily volume of 65-70 kg.
In the case of specialty shops and food chains such as Monterey shops and SM South Mall, Central Barbeque Plaza
in Parañaque and Ineng’s Barbeque Shop in Global City, tilapia fillet and whole frozen fish are preferred over whole
live fish. Specialty restaurants selling fish soups, tilapia belly and deep fried tilapia skin absorb by-products of
filleting. The specialty shops require consistent fillet size and volume. The total volume requirement of these
institutional buyers is 1,000 kg daily with a fish size of 1-2 pieces per kg (450- 600 g fish).
Volume Requirement
The total volume requirements of the supply chains serving major customers in Luzon averages about 5,335 kg daily
or approximately 1, 947,275 kg (or ~ 1,947.28 MT) annually. With the per capita consumption of around 3.81 kg
(or ~ 323,850 MT), these chains could barely meet 1% of the consumption requirement of the country.
Major Players and Their Activities
The major players and their activities are highlighted in Fig. 1. Hatchery and nursery operators supply fry and
fingerlings as well as provide technical guidance to fish producer-customers. Both operators are closely linked and
coordinated with each other.
The hatchery handles about 3,000 breeders (Genomar crossed with IDRC strain) that produce 1.5 million sex-
reversed fry every 18 days. The hatchery farms are located in Ligao City, Camarines Sur, which is around 600 km
south of the nursery operator in Cabuyao, Laguna. Due to the travel distance, 33 plastic bags (imported from
Taiwan) with no bottom corners, each containing 400,000 fry are used to reduce stress and minimize fry mortality
while being transported in rented trucks with 6-ton capacity. Often, the hatchery operators pay “goodwill fees” to
traffic enforcers on top of the regular toll fees charged in the superhighways in Manila. Hatchery operators also
maintain nursery ponds to serve other farmer-customers requiring bigger fingerlings in nearby towns of Buhi, Baao
and Bato, Camarines Sur. These customers usually also require 400,000 fry every 18 days. Hatchery operators
charge P0.05 higher than other competitors in the area because fry are already sex-reversed. Upon reaching Laguna,
delivered fry are immediately unloaded to conditioning ponds for acclimatization. The nursery operators manage
and maintain the fry until reaching marketable sizes of 14 and 12 as required by regular producer-customers (chain
members) in Laguna and Batangas. Fry are maintained for 1 month and then an additional 3-4 weeks to reach size
14 for sex-reversed fingerlings. Otherwise it takes 1 to 1½ months for non-sex reversed fish. The nursery ponds
handle various tilapia strains since the regular customers tend to try other strains in their operations. Usually, the
nursery operators deliver fingerlings four times a week to their regular customers. Also, the sizes of fingerlings
delivered vary with “season” i.e. smaller size (22-20) during in-season months (May, June, July, August); and larger

IIFET 2012 Tanzania Proceedings
5
(14-12) during off-season months (September, October, November, December). The nursery operators prefer tilapia
nilotica as a better species compared with other tilapias.
Figure 1. Major Players and their Activities
The fish producers are the main “production centers” of the tilapia chain
that focus on production of marketable tilapia for distribution through traders
for end-users or consumers and processors for institutional buyers. The
regular producer-customers usually take 2.5 – 3 months to grow their fish to
reach marketable size of 4-5 pieces per kg and about 3.5-4.5 months to reach
2-3 pieces per kg. Fish producers (chain-members) are aware of the
product, volume and delivery requirements of their trader-customers. To
reach markets in the Northern Luzon which prefer darker colored skin
tilapia, fish producers grow the tilapia first in Laguna under semi-extensive
feeding regime for about 2-3 months, then transfer the fish to Taal Lake in
Batangas for conditioning for 3 weeks before harvest – a kind of “circuitous”
production technique. Most fish producers do not have delivery trucks and
facilities for cold storage. Thus, they wait for their customers to haul their
fish harvests from the farm site. Other producers (non-chain member) in
Laguna and Batangas persist to stock non-sex reversed fingerlings since it is
cheaper and it performs at par with sex-reversed counterparts as they claim.
However it takes a longer time to reach equivalent weights or sizes to that
of sex-reversed fingerlings. Hence, these producers are losing more in
terms of low fish recovery of about 18-20% in Laguna Lake, 25-30% in
Taal Lake and high feed costs.Occasionally, customers of non-chain
members complain about the off-flavor taste of their tilapia. Accordingly,
farmers’ knowledge on preventing repeat of such incidents is fairly limited.
Traders generally refer to consolidators/wholesalers/retailers and brokers
or agents a.k.a. consignacion. All are engaged in the buying, selling and
distribution of tilapia. The consolidators are big traders that regularly
supply supermarkets and bulk buyers in major fish terminal markets (or
transshipment points). At the terminal markets, the “consignacions”
facilitate the transactions between the traders (shippers or viajeros) and bulk buyers (provincial traders) for a
“commission fee”. Consignacions own stalls at the terminal market. They act as gatekeepers of the traders and are
key players in the price discovery process. Thus, they also perform price monitoring and occasional small-scale
trading. The wholesalers are shippers or viajeros who buy tilapia from the terminal markets in bulk and ship them to

IIFET 2012 Tanzania Proceedings
6
other bulk buyers serving other geographical markets.
Strategically, some wholesalers resort to backward integration by
producing their own tilapia and contracting other farmers to meet
market commitments and reduce supply risks. The retailers are
the smallest traders in the market chain that cater to the end-users.
They own stalls at public markets and small delivery vehicles
such as tricycles and jeeps with aerators. Their sales volumes
depend on the deliveries by local traders. Since they compete with
many retailers, they handle about 100-150 kg of live fish (with
average size of 5-6 pieces per kg) for easier disposal and to
minimize unsold products for each transaction day.
Processors regularly supply the specific product forms such as
the fillet, cubes, whole frozen and choice portions or trimmings
for institutional buyers (supermarket, specialty food shop, food
chain, bar and restaurants, canteens, among others). One big
processor known as Fishda Enterprises has been operating and
registered since 1995. This processor has been incorporated and
now known as Unavis. Its operation is accredited by Department
of Food and Drugs. Product forms, volumes and deliveries depend
on the arrangements with the various customers. Presently, its
customers include Monterey specialty shops, SM Southmall,
Metro Bank canteens, Central Barbeque Plaza in Parañaque,
Ineng’s Barbeque at Global city, Setton Golf Club, etc. To
maintain its customers, the processor ensures that raw materials
meet the size, volume and meat quality requirements for
processing. The processing plant has 1.5 - 2 ton capacity
(processing-in-demand) with 6-ton cold storage capacity for
filleted tilapia. The plant maintains a safety stock level of 5 tons.
The filleting process for a per kilogram raw tilapia (2-3 pieces per
kg) yields 30-35% fillet, 18% belly, 25% innards, 21% head and
1% skin. Because the cost of filleting is about P35 per pack (1
pack = 300 grams), cost recovery includes sales of the by-
products. The processor could not raise the price of tilapia fillet
due to cheaper import alternatives like the pangasius and dowry
fillets. To increase the shelf-life and maintain quality of products,
quick or blast freezing is necessary. Increasing the present
capacity of cold storage and blast freezers entails additional costs,
which is unaffordable at the moment. Finally, a few tilapia
producers can meet and assure volume, size and quality of raw
materials, thus, processors cannot expand market coverage. Many
orders and inquiries from potential high-end customers like
Philippine Airlines, Cathay Pacific, five star hotels and restaurants
are not met.
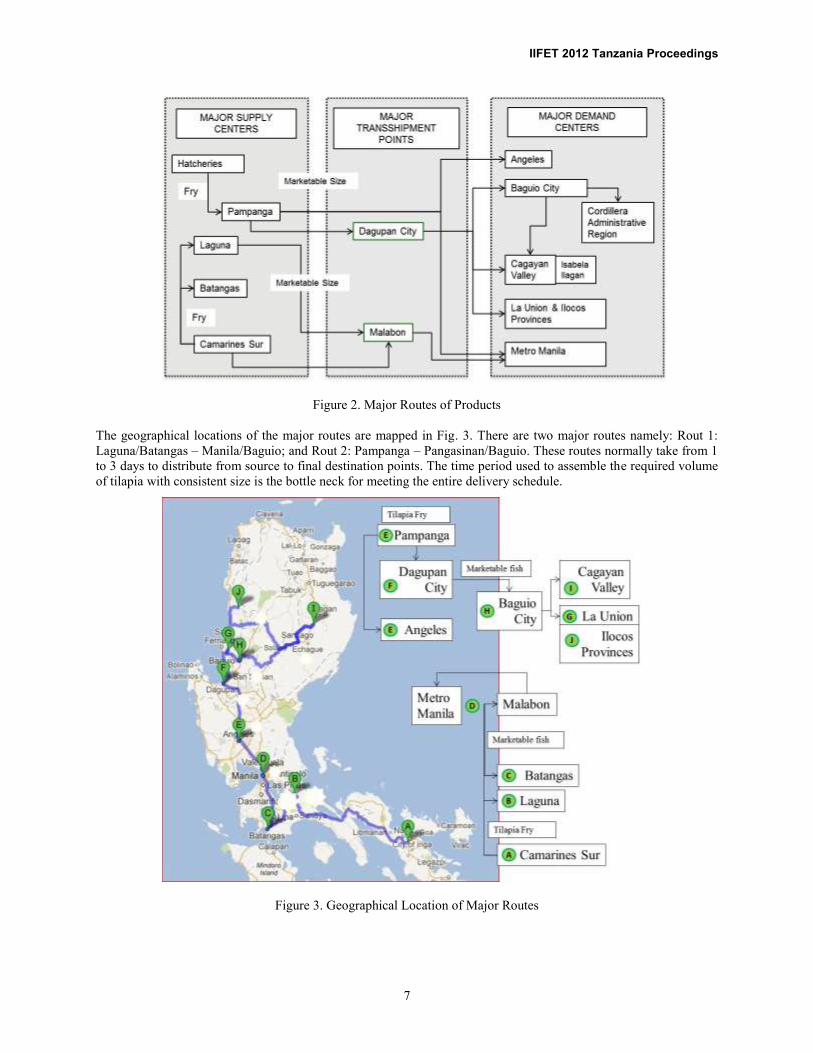
Major Routes of Products
Fig. 2 shows the tilapia supply chain’s major routes in Luzon. The
cities of Malabon in Manila, Angeles in Pampanga and Dagupan
are the major transshipment points of tilapia in Luzon. Cities in
Metro Manila, Angeles and Baguio, La Union and Ilocos
provinces, Isabela and Cagayan Valley provinces and the
Cordillera Administrative Region, are the major demand centers.
Pampanga, Batangas and Laguna provinces are the major
production centers while Pampanga, Laguna and Camarines Sur
possess the major hatcheries.
Processors
Traders
IIFET 2012 Tanzania Proceedings
7
Figure 2. Major Routes of Products
The geographical locations of the major routes are mapped in Fig. 3. There are two major routes namely: Rout 1:
Laguna/Batangas – Manila/Baguio; and Rout 2: Pampanga – Pangasinan/Baguio. These routes normally take from 1
to 3 days to distribute from source to final destination points. The time period used to assemble the required volume
of tilapia with consistent size is the bottle neck for meeting the entire delivery schedule.
Figure 3. Geographical Location of Major Routes

IIFET 2012 Tanzania Proceedings
8
Fig. 4 describes the product flow of Route 1. Eighteen-day old tilapia fry from Camarines Sur hatchery are brought
to the nursery operators in Cabuyao, Laguna for conditioning and growth for about 45 days to reach fingerling size
of 14-12. The fish are then delivered to grow-out operators in Laguna and Batangas for 2-3 months before harvest.
Fish sizes range from 4-5, 3-4 and 2-3 pieces per kg. Small fishes are sold to local markets in Los Baños and Pila,
Laguna. The larger fishes are delivered to supermarkets in Calamba and Sta. Cruz, Laguna. Largest fishes are
delivered to the processors in Los Baños, Laguna and Parañaque. Fishes intended for the Northern Luzon
supermarkets such as Rosales, Pangasinan and Baguio City are transferred and conditioned in Taal Lake for a period
of 3-4 weeks to ensure that fishes have dark-colored skin before marketing.
Figure 4. Product Flow (Laguna/Batangas-Manila/Baguio-Route 1)
In Batangas, fry of size 22-20 from Calauan, Laguna hatcheries are brought to grow-out operators in Tanauan,
Talisay and other towns along the Taal lake. Large fish producers (with 500 cages) in Batangas usually stock 200
fish/m3. Their fish recovery in Taal lake ranges from 25%-30%. Furthermore, their feed conversion ratio (FCR) on
the average is 1.5:1 while Laguna producers have lower FCR.
After 6-8 months of culture period, marketable tilapia are picked up by wholesalers and brought to Malabon in
Manila, being the major transshipment point for seafood that cater to Metro Manila markets and the rest of Luzon.
Smaller traders and other provincial traders buy their fishes from wholesalers through consignacion in Malabon
market. Fishes are then packed in iceboxes for distribution to supermarkets and far-flung markets.
The flow of products in Route 2 is shown in Fig. 5. Pampanga fish producers usually obtain their fry from nearby
hatcheries and stock them directly in their grow-out ponds. After 6-8 months of culture period, tilapia is harvested
using mesh nets from ponds of 2-12 hectares wide. Some larger farms have about 25-100 hectares surface areas.
Most farmers do not have trucks equipped with tanks and aerators, thus, they wait for traders through an agent to
pick up their harvest and bring the fish to the terminal market in Pampanga with Angeles City as the major
transshipment point of Pampanga.
Wholesalers and local traders including consolidators buy their live tilapia at this market. Wholesalers bring their
tilapia to the consignacion market in Dagupan City, Pangasinan serving as transshipment point for the rest of the
Northern Luzon markets. Fishes usually reach this market alive, which is preferred by most, if not all, customers.
However, once passed on to other provincial traders whose markets are farther, fishes are stacked with ice to retain

IIFET 2012 Tanzania Proceedings
9
freshness upon reaching destination points. It takes around 1-2 days to reach some markets in Ilocos and Isabela
provinces together with Cagayan Valley and Cordillera Administrative regions.
Figure 5. Product Flow (Pampanga-Pangasinan/Baguio-Route 2)
Payment Flow
In general, payments are made on spot cash and cash-on-delivery (COD) between the local consumers and retailers;
wholesaler and trader/consolidators; processor and producers; small-scale traders and producers. Bank payments
through 7-day post-dated checks are made among hatchery/nursery operators and producers; supermarket and
processors/traders or consolidators (Fig. 6).
Figure 6. Payment Flow of Tilapia Supply Chain
Only the specialty shops make advanced payments to the processor for about 1-2 days before product delivery, as
stipulated in a contract. On the other, the traders/consolidators who loan out feeds to producers and provide trading
capital to small-scale traders adopt a different payment arrangement. The small scale-traders check on the exact
harvesting dates of the farmer-borrowers. Upon harvest, these traders weight, transport and consign the tilapia

IIFET 2012 Tanzania Proceedings
10
harvest to the local retailers at an agreed price. After each transaction day, the retailers remit the net sales proceeds
to the small-scale traders who in turn remit the same plus the trading capital equivalent to the fish volume purchases
from the producer-borrowers to the trader/consolidator. After deducting the cost of feeds, the traders pay the
producers the net sales value of their tilapia.
Information Flow
Fig. 7 shows the flow of information among the supply chain members. Information exchange between and among
the chain members and the mode of contact are face-to-face and through mobile or telephones which are concluded
in a short period of time. The price, sources, quality, availability and delivery schedules of tilapia are the major
information required by the chain members. Farm gate prices are lower and more unstable than those in the
wholesale and retail levels. Such behavior is prevalent because institutional buyers are slow to react with price
changes. Additionally, the processor maintains a price level of two years ago for fear of losing customers with or
without contracts. Retail prices tend to be sticky upwards but faster to adjust downwards.
Figure 7. Information of the Supply Chains
External Influences
(1) Production and market support programs of the government
Recognizing the importance of tilapia in poverty alleviation and development of the country side, the government
has embarked on a tilapia upgrading program through genetic improvement projects espoused by CLSU, GIFT,
BFAR and other international R&D agencies. This program had effected the participation and entry of many tilapia
industry players. Additionally, the establishment of hatcheries and dispersal programs of BFAR had facilitated the
extension of broodstock quality improvement of tilapia into the countryside. Likewise, training and capacity-
building among tilapia farmers has been implemented. The training includes improved technologies in
management, nutrition and health aspects of tilapia culture. The continuing improvement of broodstock and
dispersal program will help foster the growth of the industry. On the other, the market support program of the
government of the Philippines is limited to market matching and participation in aqua fairs.
(2) Food safety through permits and accreditation
In preparation for globalization, BFAR has instituted an accreditation protocol for quality assurance of meeting
export standards. However, many found it to be very rigid which restricts the potential exporters to qualify.
IIFET 2012 Tanzania Proceedings
11
Unfortunately, fish imports continually flood the domestic market which dampens further the competitiveness of the
local industry.
(3) Presence of “rent-seeking” law enforcers
In addition to the toll fees in superhighways paid by traders or viajeros including hatchery operators, unreceipted
fees are charged that serve as goodwill to rent-seeking law enforcers at check points. Such expense is ultimately
passed on to the final consumers.
Issues and Concerns
The major concerns of hatcheries and nurseries are high cost of outbound logistics, which is exacerbated by high
competitive pressures of inferior quality but inexpensive stocks (e.g., non-sex reversed) and high levels of mortality
due to environmental and cultural factors. This is treated as opportunity cost for not able to expand their market by
convincing other farmers to choose better quality fingerlings.
The fish farms’ major concerns are the expensive but low quality feeds (at times mislabeled) and other inputs
coupled by very low fish recovery of about 25% in lakes’ cages or pens and about 60% in ponds system. The more
pronounced fluctuations in climate pattern has induced more variability in production volume hence, overstocking
became a “recouping mechanism” among fish growers. Grow-out period ranges from 6-8 months to reach a
marketable size of 250-400 grams per fish across production systems. Their transaction costs include the cost of
waiting for buyers, delays in delivery, in-transit mortality, and “goodwill” or toll fees as well as shrinkage losses.
Lack of cold storage and transport vehicles equipped with tanks and aerators or refrigeration facilities delimits
farmers to take market opportunities in terms of value-adding and processing activities. Interestingly, due to the high
consumers’ preference of “darker tilapia”, many farmers adopt a “circuitous” production technique i.e. fry from the
hatcheries say in Bicol (pond based) are transferred to nurseries’ pond in Cabuyao, Laguna then moved and raised in
a semi-intensive grow-out environments in Laguna lake then finally transferred and conditioned as “dark tilapia”
within 3 weeks in another place like Taal, Batangas to take advantage of such marketing premium.
The major concerns of processors are too few farms that could regularly supply the desired quality and volume of
tilapia at each process-in-demand period. Also, there is lack of blast freezers to maintain higher quality products
while maintaining longer shelf-life of products and other derivatives. Due to high cost of filleting and low dressing
recovery, processors could hardly compete with the influx of cheaper imported alternative fillets like pangasius, sea
bass and others, saved by the revenues derived from by-products such as heads, bellies and skin. Demand for choice
portions and trimmings by high-end institutional buyers like Philippine Airlines and Cathay Pacific remain
untapped. Also, tilapia nuggets and fingers are test markets that have not been met, yet show bright prospects.
The concerns of traders (“consignacion”, suppliers or consolidators) are: (a) regularly meeting the quantity and
delivery schedules of their customers is undermined by their defaulting “contract tilapia farmers” (b) high logistics
and transaction costs of searching, locating, assembling and distributing fish from sources to destinations (c) lag
responses in unexpected price movements and the absence of product grades and standards contribute to the
difficulty of maintaining a “profitable” volume of operation.
RECOMMENDATIONS
The following are some recommendations to address the various issues and concerns of the various chain players:
(1) encourage the establishment of more nursery farms and better quality broodstock while intensifying technology
transfer to farmers for better health and management of tilapia, (2) conduct market promotion activities highlighting
the various niche opportunities of tilapia among growers and consumers, (3) motivate the participation of small
farmers in supply chains by setting up an incentive scheme through a mix of patronage refund and profit sharing, (4)
institutionalize an accreditation program for feed manufacturers, hatcheries, processors and the like to improve the
quality assurance of products and services, and (5) provide capital windows to improve facilities and reduce logistics
and transaction costs in the entire supply chains of tilapia.

IIFET 2012 Tanzania Proceedings
12
REFERENCES
[1] Bureau of Fisheries and Aquatic Resources (BFAR, various issues). Tilapia: Overview of the Industry.
http://www.bfar.da.gov.ph
[2] Bureau of Agricultural Statistics (BAS, various issues). http://www.bas.gov.ph
[3] Jamandre, W.E., Bolivar, R.B., Hatch, U. and Borski, R.J. 2010.Implications of Export Market Opportunities for
Tilapia Farming.In AquaFish Collaborative Research Support Program: Technical Reports 2007-2009.
vol 2. pp 217-227. Oregon State University.
[4] Philippine Council for Agriculture, Forestry and Natural Resources Research and Development. Exploring The
Opportunities Towards Competitiveness: Supply Chain Improvement in Selected Commodities in
AFNR (Phase 1), Los Baños, Laguna: PCARRD-DOST, 2011. 268p. – (Book Series No. 183/2011).