lab report basics - school of engineeringdaniel/www/labreporttalk2011.pdf · goals of the lab...
TRANSCRIPT

1
Lab Report Basics!
Prof. Dan Burkey!CHEG 4137W!
!
UConn CMBE!!
Fall 2011!

2
Goals of the Lab Report
• Planning! (Pre-lab and preparation) • Performing an Experiment • Taking Good Lab Notes • Analyzing Data • Discussing what that data means (results) • Conclusions - What did you learn?
– This is the ultimate goal - effectively communicating what you did and why the results are significant!

3
Different Types of Reports • Academic Report
– 10-12 pages, enough detail for someone to fully replicate your procedures and, hopefully, your results.
– Example: A journal article or scientific paper.
• Technical Memo – Brief; 5-7 pages.
Generally highlights the problem your were trying to evaluate, your key results, and a recommendation or conclusion.
– Example: Technical report for a supervisor.
There are other kinds of reports too: memos, technical briefs, white papers…
4
Parts of the Report
• Introductory Material: – Title Page (as described in the syllabus) – Abstract or Summary – Table of Contents (if the report is long, with
many distinct sections) • Body of the Report:
– Introduction/Background/Theory – Apparatus and Materials Used

5
Parts of the Report
• Body of the Report (Continued): – Experimental Details/Procedure – Safety Considerations – Results (including important figures) – Discussion (what do your results mean, in context) – Conclusions – Recommendations (optional) – Nomenclature (optional - if you have a lot of terms or
abbreviations) – Literature cited, References, Bibliography, etc.
6
Parts of the Report
• Appendices – Original data (neatly!) – Sample/representative calculations (correct of course!) – Intermediate data (used in calculations, etc.) – Derivations (if needed) – Calibration curves, other graphs of data, if they weren’t
needed in the body of the report. – Supplementary exposition (if needed) – Supplementary bibliography (if needed)

7
Abstract
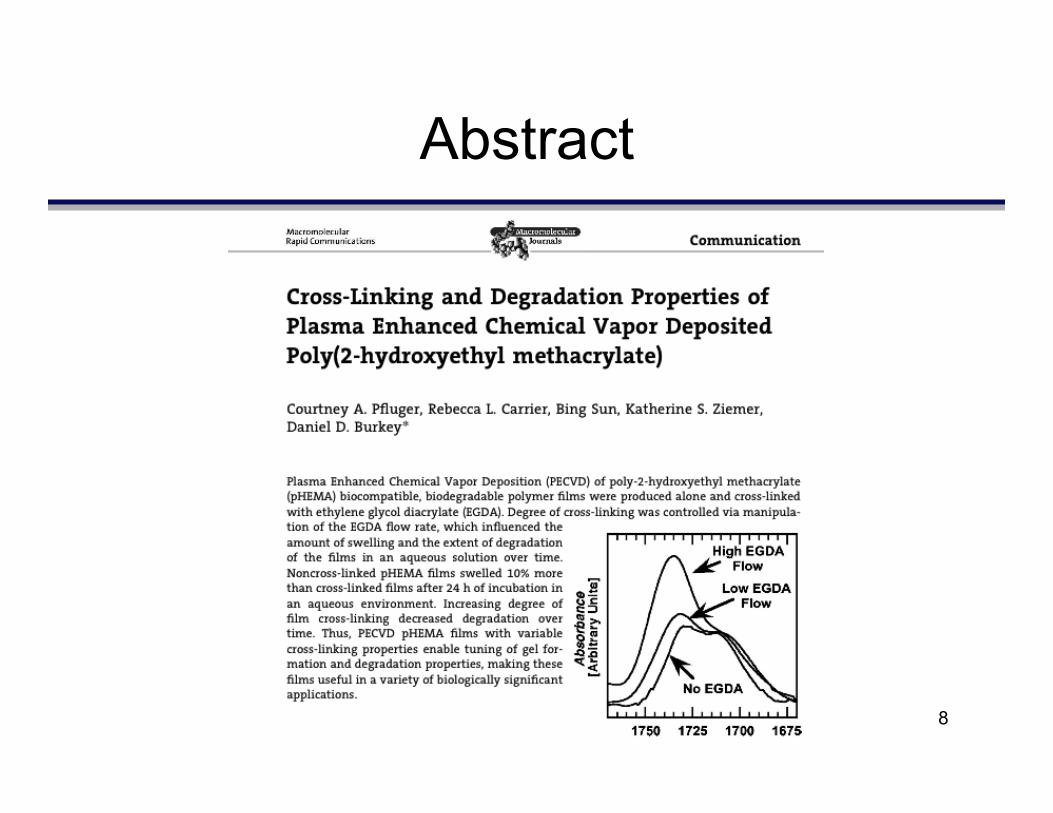
• Abstract – The most important part of a report! – Should be a concise overview of the report
• One paragraph - 200-300 words • What was the purpose of the experiment? • What did you do? • How did you do it? • What are the major results and conclusions?
– No figures, tables, or overcomplication – Write it last, based on the body of work.
8
Abstract

9
Abstract

10
Introduction/Background/Theory • Some Do’s
– Be concise - the problem, it’s importance, and the motivation for the report.
– Synopsis of relevant theory and equations. – Enough info that a competent engineer could get the gist of what
you are talking about. – Use references to back up your theory/explanations. – The last sentence gives a concise statement of what you intend
to do. • Some Don’ts
– Excessive detail (this isn’t a textbook) – Extensive theory or equations (ditto) – No conlcusions or recommendations (save for later)

11
Introduction…
12
Experimental • Apparatus:
– A neat schematic drawing, labeled, with dimensions – A brief description of the most relevant equipment and analysis
methods • Procedures:
– Use paragraphs instead of bullets – Should be a template for others to reproduce your work. – Read through afterwards - could you follow this as a recipe?
• Safety: – State any hazards associated with equipment and chemicals
• MSDSs - read them, put them in the appendix – Define appropriate precautions to avoid accidents – Suggest safety-related improvements to equipment, procedures,
and analytical methods.

13
Experimental
14
Results • Objectively present important facts from the observed data. • For clarity, other information can be added: intermediate results; a
basic calculation; important assumptions. • Don’t just include figures or tables - interpretation or explantion is
needed! • Only include the most pertinent results (i.e. not everything but the
kitchen sink…) • Raw data and intermediate calculations can go in the appendix. • Don’t double-dip: don’t have a figure and then present the same
data as a table. • Be quantitative, not qualitative. • Include uncertainty analysis, error propagation, statistics, and
discussion of possible errors.

15
Results

16
Discussion • Discussion is second only to the results in terms of
importance - results on their own are often meaningless without context!
• The discussion should be a critical interpretation and evaluation of the results, in the context of the greater experiment. – What is the significance of the results, and how does it impact
the application of the technology? – Reliability and accuracy: What are the sources of error and their
impact. – A comparison of the observed results with those expected or
predicted by theory. A discussion of why they might be different. • Results and discussion are often combined.
– This makes it somewhat easier on the reader, as they don’t have to flip back and forth between sections

17
Conclusions and Recommendations
• Rather short for you - (nothing earth shattering, likely). • Conclusions should be based on the results, rather than
opinion or speculation. • Look back at your objectives for the experiment - did you
answer your questions? • For each objective, you should have a corresponding
conclusion that can be arrived at in the context of having evaluated the results.
• List the conclusions in the order of their importance. • Any recommendations for improvement or expansion of
the experiment may be included here. • Recommendations should be specific and factual.
– i.e. “I didn’t like this experiment, it sucked and we shouldn’t do it” = not helpful

18
References • http://www.lib.berkeley.edu/CHEM/acsstyle.html • Correctly cited references are a key part of your
report! • Not attributing sources of information is
considered academic dishonesty.

19
Writing Styles and Tips
• Prepare an Outline (1-2 pages) – Hits the major points you want to expand on
• Identify the figures/tables you want to include before you start writing. – Structure the report around these - they are
focal points and represent what you did. • Don’t “wall of text” the reader. Short
paragraphs, 3-4 sentences each.

20
Writing Styles and Tips (2)
• Use subheadings to break things up. – Makes things easier to read.
• Spelling. No excuses. • Hyphenate compound adjectives:
– 20-in. pipe, stirred-tank reactor, copper-constantan thermocouple.
• Effective writing usually has the verb near the beginning of he sentence, by the subject:

21
Writing Styles and Tips (3)
• Poor: – The mass-transfer coefficient, shown in
Figure 1 as a function of temperature and compared with theory in Table 2, was calculated from Equation 3.
• Better: – The mass-transfer coefficient was calculated
from Equation 3. Figure 1 shows the effect of temperature on that coefficient, and Table 2 gives a comparison with theory.

22
Writing Styles and Tips (4)
• Poor: – The temperature of the liquid, the flow rate of
the vapor, the pressure of the evaporator, and the power input to the motor were measured.
• Better: – The following were measured: liquid
temperature, vapor flowrate, evaporator pressure, and power input to the motor.

23
Writing Styles and Tips (5)
• Use tenses carefully: – Past tense: acts that are now history. – e.g. “The temperature was measured with an
iron-constantan thermocouple.” • This event has occurred in the past.
– Present tense: things that are contemporary – e.g. “Figure 1 shows the variation of vapor
temperature with time.” • This figure is currently showing this information,
and will continue to do so whenever looked at.
24
Writing Styles and Tips (6) • Short, qualifying sentences are best placed at
the beginning: • Poor:
– The pressure of the evaporator was constant at 3 psia, but it is difficult to say exactly because the pressure meter was flopping back and forth.
• Better: – Although the pressure meter fluctuated, the average
evaporator pressure was nearly constant at 3 psia.

25
Writing Styles and Tips (7)
• Use relative pronouns correctly: – Defining clauses: ‘that’ – e.g. “The particle volume that was measured
by displacement was greater than the calculated volume.
– Non-defining clauses: ‘which’ – e.g. “The measured particle volume, which
was 3% greater than the calculated volume, was used in the porosity determination.”
26
Writing Styles and Tips (8)
• Avoid the dangling participle: – The robber ran from the policeman, still
holding the money in his hands. – After being whipped fiercely, the cook boiled
the egg. – Flitting happily from flower to flower, the
football player watched the butterfly.

27
Writing Styles and Tips (9)
• Don’t be wordy – After writing a paragraph, go back and
remove all the extra words. • Use simple language
– “Don’t use a fifty-cent word when a nickel will do.”
– Don’t try to ‘pad’ your writing by using excessively jargon-y or technical words. Convey your information concisely!
28
Writing Styles and Tips (10)
• Avoid ‘filler’ or opinion-y phrases: – It may be stated that… – You wil find it interesting to know… – For your information… – In this connection the statement may be made
that… – At this point in time it may be appropriate to… – In order to…

29
Writing Styles and Tips (11) • Avoid generalities:
– Be specific – Quantitative rather than Qualitative – Positive rather then negative
• Poor: – The temperature measurement was not accurate because the
thermometer was no good. • Better:
– The accuracy of the temperature measurement can be improved by better thermometer calibration.
• Poor: – Figure 1 shows that the data are in bad agreement with the values
calculated from Equation 3. • Better:
– Figure 1 shows that the experimental hat-transfer coefficients are about 60% larger than those predicted by Equation 3.

30
Report Craftsmanship • All reports submitted as PDFs! • Margin: 1” all around. • Page number: Bottom centered. • Double spaced. • Equations on their own lines, numbered. • Figures and tables numbered and captioned. • Report Lengths:
– Academic report: 10-12 pages – Technical memo: 5-7 pages
• Any form of cheating is clearly forbidden.
31
Avoiding Misconduct • Plagiarism: taking the thoughts, words, or ideas of other and
passing them off as your own. • Misrepresentation: e.g. claiming work done by another as your own. • Unauthorized possession, use, or destruction of academic or
research materials. • Computer violations. • Fabrication or falsification in research: e.g. deliberate falsification of
experimental results. • Research violations • Conflicts of interest • Tampering • Any attempt to influence improperly. • Aiding or abetting: e.g. helping someone else commit academic
misconduct. • Any impropriety or act of misconduct committed by a graduate
student in a teaching role.

32
Plotting a Good Figure Student Weights in the Grade Six
100
102
104
106
108
110
112
114
116
118
120
0 1 2 3 4 5 6Student
Wei
ght,
Lbs
Hint: This isn’t it…

33
Plotting a Good Figure

34
Chemical Reactions
• Don’t use PowerPoint to draw chemical structures - it just stinks. – http://scistore.cambridgesoft.com/sitelicense.cfm?sid=70

35
Making a Good Table A B C D E
0.78799174 0.87677244 0.99348605 0.23781547 0.244375260.24910355 0.79708654 0.39825661 0.4894876 0.220794560.65729261 0.46901063 0.36471191 0.04697233 0.634680590.48205396 0.52657506 0.70503426 0.35280176 0.409353130.46328137 0.0774365 0.71517444 0.9394662 0.468436380.09762717 0.70884867 0.81407539 0.24571711 0.724978190.00773315 0.39906447 0.42344939 0.90776976 0.222090060.15857663 0.4181197 0.56488165 0.91405841 0.35783490.59242455 0.17894389 0.61926672 0.02978346 0.507891720.41285757 0.71470398 0.31906988 0.79658426 0.215876470.8855586 0.46534556 0.3701164 0.12452538 0.334154970.28231467 0.17509894 0.85801024 0.72984635 0.947312380.82370951 0.03235362 0.95622299 0.27726297 0.766198790.86245578 0.21094811 0.93272287 0.48265505 0.049606460.38953201 0.3665743 0.33754918 0.28178635 0.396370090.80522838 0.63509032 0.43333321 0.97677807 0.961981720.35928212 0.14878634 0.44201417 0.23251612 0.833751540.72099806 0.75212293 0.81061259 0.23756284 0.485189960.13329065 0.31602317 0.87489249 0.5304632 0.261915650.2588109 0.89039838 0.81380512 0.59139955 0.484887590.99314419 0.34635186 0.73292414 0.25933239 0.292304910.88041055 0.11473455 0.01934078 0.15717245 0.937806760.72332226 0.80195173 0.1792961 0.07832254 0.411545790.95925002 0.41696749 0.24905812 0.2111233 0.002565360.00580885 0.65322119 0.49666074 0.91641276 0.405732750.26004883 0.3010126 0.45604195 0.99935168 0.912710480.1508427 0.84418604 0.96241158 0.05548096 0.940931540.63750743 0.08979734 0.11100042 0.34646613 0.099945330.17176871 0.85518113 0.94522781 0.29368901 0.774441610.15186964 0.53105474 0.69991523 0.07876247 0.00239780.72306385 0.73755246 0.71402806 0.68090612 0.760156360.42140074 0.39036871 0.02247591 0.94725973 0.70692042
Hint: This isn’t it… …again…

36
Making a Good Table