lab manager may 2010
TRANSCRIPT
Subscribe Today; if you haven’t already. Visit www.labmanager.com/subscribe.asp
Volume 5 • Number 4May 2010
INDEPENDENT GUIDE
TO BUYING UV-VIS
SPECTROPHOTOMETERS
INSIDE!
WWW.LABMANAGER.COM
ASK THE EXPERT: How to Overcome Challenges with Mass Spectrometry
THE POLITICS OF STEM CELL RESEARCH
Management’s role in the continuous improvement process
Leading Change

At Molecular Devices, we have one focus—our customers. Understanding your laboratory work-flow is our top priority, and we direct product development toward solving your unique issues. Our instruments offer a full spectrum of detec-
tion technologies and meet all throughput needs. Our goal is to deliver highly relevant analytical products to detect biology, decode data, and drive discovery.
Analytical Systems• Microplate Detection• Research Imaging• High-Content Analysis• Automated Patch Clamp• High-Throughput Screening• Microarray Scanning• Conventional Electrophysiology• Label-Free Analysis
Target Applications
Contact us today to learn how we can support your scientific success.
For Research Use Only. Not for use in diagnostic procedures.©2010 Molecular Devices, Inc. All Rights Reserved. Molecular Devices, the Molecular Devices logo, and all other trademarks are the property of Molecular Devices, Inc.
Email [email protected]@[email protected]@moldev.com
Sales & SupportUnited States & Canada1 800 635 5577
Brazil: +55 11 3616 6607
United Kingdom: +44 118 944 8000
Germany: +49 89/96 05 88 0
China+86 10 6410 8669 (Beijing)+86 21 6887 8820 (Shanghai)
Japan+81 6 6399 8211 (Osaka)+81 3 5282 5261 (Tokyo)
South Korea: +82 2 3471 9531
www.moleculardevices.com1311 Orleans Drive, Sunnyvale, CA 94089-1136 USA
Phone: 1 408 747 1700 | Fax: 1 408 747 3601Toll Free: 1 800 635 5577
Your Science. Our Systems. Your Success.
• Screening• Safety / Toxicology• QA / QC• Cancer Biology• Neurobiology• Stem Cells
• RNAi• GPCRs• Ion Channels• Kinases• Transporters• And More


In February, the NIH released a report showing the annual support level for various re-search, based on grants that are funded by the ARRA. The report, based on data ranging from the actual 2006 totals to the esti-mated totals for 2011, revealed increased funding for stem cell research as: Human Embryonic increased 232%; Non-Human Embryonic increased 86%; Adult Stem Cells, which includes um-bilical cord blood/placenta and other non-embryonic, increased 96%; and Stem Cell Research, an all-inclusive category that defied categorization, increased 71%. Visit http://report.nih.gov/rcdc/categories/default.aspx for the complete report.
ww
w.la
bman
ager
.com
M
ay
20
10
10CO
NTE
NTS
LEADERSHIP & STAFFING
16 How to Run an Effective Meeting Productivity expert David Allen recommends starting every meeting with a “statement of wild success,” a clear definition of the best possible outcome for the meeting. Just stating the ideal result often inspires participants and makes meetings more productive. Cyrus Farivar
20 Leading ChangeA change in behavior, in attitude or in lifestyle is not easy to achieve, and some seem near impossible. However, the change process can be understood, and change can be implemented more successfully and more reliably by following a few rules. Ron Pickett
TECHNOLOGY & OPERATIONS
26 Managing the Coming Data Flood Lab managers will face an increasing challenge in the next decade—managing a rising tide of data. To realize the full benefit and value of these diverse and voluminous data requires effective data management techniques, institutional arrangements, and policies. John K. Borchardt
30 Greening UPS A new 12-year-rated UPS battery has a smaller carbon footprint but, equally important, will be ready to supply clean power when instruments and other automated test equipment are exposed to utility power problems. Ron Seredian
LAB SAFETY
52 The ABC’s of IEQ Design considerations for laboratory indoor environmental quality. Vince McLeod
BUSINESS MANAGEMENT
56 Managing Obsolescence One of the best approaches for proactively managing obsolescence is to develop and maintain a multiyear capital plan that explicitly designates a specific portion for instrument replacement each year. Wayne Collins
61 A Multi-Vendor Service Model Multi-vendor service models continue to evolve in order to address changing customer and market needs, such as the increasing need for asset utilization data that is vendor independent. Gary E. Grecsek
Q is for QualityDespite the vigilance of federal, state and local regulators and of accreditation organizations that evaluate and certify laboratories, the development and maintenance of quality in laboratories are constant concerns.
Bernard Tulsi
24
The Politics of Stem Cell Research The NIH recently published its annual report on funding levels for various research, condition, and disease categories. Since the NIH is a government institution, it should come as no surprise that the big-gest changes came in areas that have been the subject of fierce political debate, the most volatile area of which being stem cell research.
Richard Daub
36ASK THE EXPERTHOW TO OVERCOME CHALLENGES WITH MASS SPECTROMETRY
David Hachey, Ph.D., talks about his role as the director of both the mass spectrom-
etry and proteomics core laboratories at Vanderbilt University. He offers insights into
the common challenges encountered when using mass spectrometers and in running
an open-access core facility. Tanuja Koppal

How far would you go to protect your samples?
Researchers worldwide protect more than two billion samples inside
Thermo Scientific cold storage equipment. With +4°C refrigerators to
-196°C cryogenic freezers and Nalgene® and Nunc™ consumables,
you’re free to concentrate on your work without worrying about your
valuable samples.
Thermo Scientific Revco PLUS ultra-low temperature freezers offer
significantly more than competitive units:
• Maximum temperature recovery – up to 20% more heat removalcapacity, ensuring faster temperature recovery after door openings
• Energy efficiency – up to 15% less power consumption and lessheat released into the environment, minimizing air conditioningcosts
• Enhanced productivity – quiet operation allows the freezer toreside directly in the lab
Learn more at www.thermoscientific.com/plus
© 2
010
Ther
mo
Fish
er S
cien
tific
Inc.
All
righ
ts re
serv
ed. A
ll tr
adem
arks
are
the
prop
erty
of
Ther
mo
Fish
er S
cien
tific
Inc.
and
its
subs
idia
ries
.
Moving science forward
Introducing the new 31.4 cu. ft.Thermo Scientific Revco PLUS HD. The industry’s highest capacity -80°C freezer stores up to 70,000 vials in the footprint of a 25 cu. ft. unit.
Visit us at ASM, booth 517!
RevcoPlus_LabMan_0510:Thermo 4/16/10 8:18 AM Page 1
Lab Manager Magazine® (ISSN: 1931-3810) is published 10 times per year; monthly with
combined issues in February/March and July/August, by LabX, P.O. Box 216, 478 Bay Street,
Midland, ON Canada L4R 1K9. USPS 024-188 Periodical Postage Paid at Fulton, MO 65251
and at an additional mailing office. A requester publication, Lab Manager, is distributed to
qualified subscribers. Non-qualified subscription rates in the U.S. and Canada: $120 per
year. All other countries: $180 per year, payable in U.S. funds. Back issues may be purchased
at a cost of $15 each in the U.S. and $20 elsewhere. While every attempt is made to ensure
the accuracy of the information contained herein, the publisher and its employees cannot
accept responsibility for the correctness of information supplied, advertisements or opinions
expressed. POSTMASTER: Send address changes to Lab Manager Magazine®, P.O. Box 120,
Georgetown, CT 06829.
©2009 Lab Manager Magazine® by Geocalm Inc. All rights reserved. No part of this publica-
tion may be reproduced without permission from the publisher.
WDS Canadian return: P.O. Box 216, 478 Bay Street, Midland, ON Canada L4R 1K9.
Lab Manager Magazine® is audited by BPA
PERSPECTIVE ON: 48 AN ENVIRONMENTAL LAB For Florida’s Advanced Environmental Laboratories, success is achieved through strong management support and smart hiring. Sara Goudarzi
SCIENCE MATTERS 34 The Four Characteristics of Successful Networkers Diane Barker
PRODUCT FOCUS AA SPECTROSCOPY 40 RAMAN SPECTROSCOPY 42 FTIR SPECTROSCOPY 43 CHROMATOGRAPHY-MASS SPECTROMETRY 44 UV-VIS SPECTROSCOPY 46
EVOLUTION OF 38 THE LAB CENTRIFUGE
TECHNOLOGY NEWS 64 The latest equipment, instrument and system introductions to the laboratory market.
HOW IT WORKS CONSISTENT, STABLE INCUBATOR AND OVEN TEMPERATURE 72 SAMPLE PREP FOR PHOSPHOLIPID REMOVAL 73 MEASURING SAMPLE VOLUME AND DETECTING PRECIPITATES 74 ACCURATE SHEARING OF CHROMOSOMAL DNA 76 MAINTAINING SAMPLE VIABILITY 78
MARKETPLACE 79
ADVERTISERS INDEX 80
PARTING POINTS 82
Introducing The NewBuck M530 IR
Spectrophotometer!
The New Model 530 is a con-tinuation of our wildly popularM500 Infrared Spectrophotom-
eter. We have updated theelectronics to bring the cus-
tomer faster scan times, quickerresponse to software com-mands, USB output and a
touchscreen. Also available is anew version of our Buck-Scansoftware which has been devel-
oped to save our customersmoney on third party software.Give us a call and find out why
our customers are throwingtheir FT-IRs in the dumpster
and going with Buck.
Starting @ $9,995.00Well equiped w/ software &ATR @ $12,685Mention this ad and get thepackage for $11,995
[email protected]# 203-853-0569
Just Say No ToService Contracts!
The PLC-11MSingle reflectionZnSe ATR can beused for Liquids,pastes, solublepowders and films.
$1,695
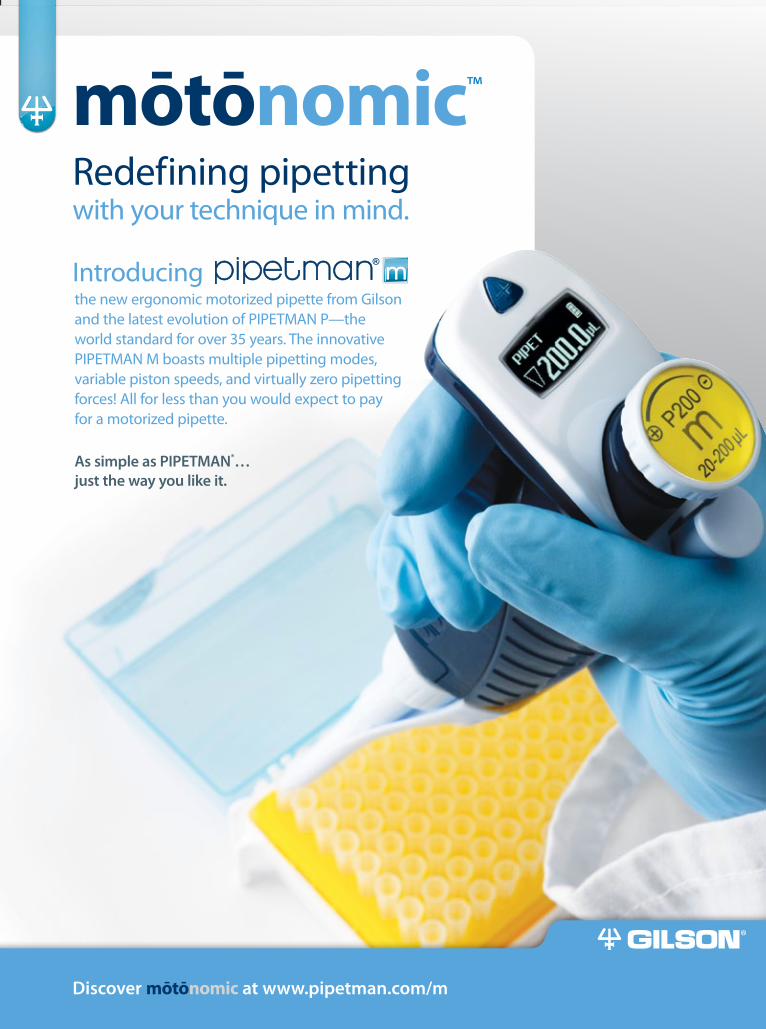
mōtōnomic™
Redefining pipetting with your technique in mind.
the new ergonomic motorized pipette from Gilson and the latest evolution of PIPETMAN P—the world standard for over 35 years. The innovative PIPETMAN M boasts multiple pipetting modes, variable piston speeds, and virtually zero pipetting forces! All for less than you would expect to pay for a motorized pipette.
As simple as PIPETMAN®… just the way you like it.
Introducing
Discover mōtōnomic at www.pipetman.com/m
8 Lab Manager May 2010 labmanager.com
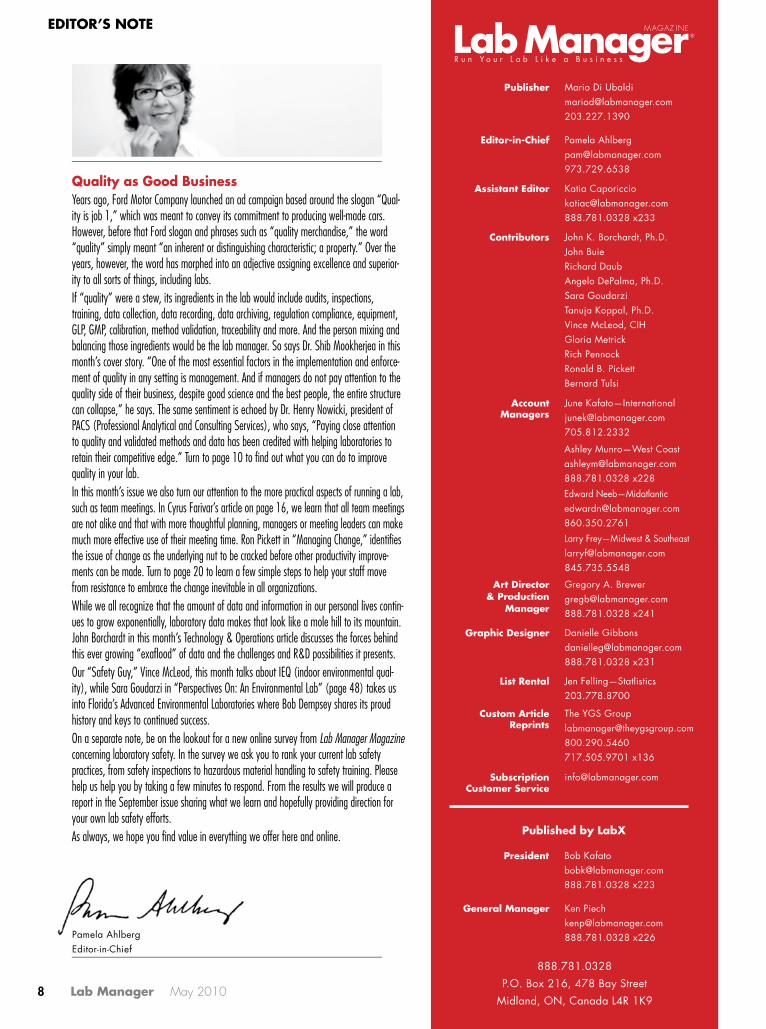
EDITOR’S NOTE
888.781.0328
P.O. Box 216, 478 Bay Street
Midland, ON, Canada L4R 1K9
Art Director & Production
Manager
Gregory A. [email protected] x241
Contributors John K. Borchardt, Ph.D.John BuieRichard DaubAngelo DePalma, Ph.D.Sara GoudarziTanuja Koppal, Ph.D.Vince McLeod, CIHGloria MetrickRich PennockRonald B. PickettBernard Tulsi
Publisher Mario Di [email protected]
Editor-in-Chief Pamela [email protected]
General Manager Ken [email protected] x226
President Bob [email protected] x223
Published by LabX
Pamela AhlbergEditor-in-Chief
List Rental Jen Felling—Statlistics203.778.8700
Custom Article Reprints
The YGS [email protected] x136
SubscriptionCustomer Service
Larry Frey—Midwest & [email protected]
Ashley Munro—West [email protected] x228
June Kafato—[email protected]
AccountManagers
Edward Neeb—[email protected]
Assistant Editor Katia [email protected] x233
Graphic Designer Danielle [email protected] x231
Quality as Good BusinessYears ago, Ford Motor Company launched an ad campaign based around the slogan “Qual-ity is job 1,” which was meant to convey its commitment to producing well-made cars. However, before that Ford slogan and phrases such as “quality merchandise,” the word “quality” simply meant “an inherent or distinguishing characteristic; a property.” Over the years, however, the word has morphed into an adjective assigning excellence and superior-ity to all sorts of things, including labs. If “quality” were a stew, its ingredients in the lab would include audits, inspections, training, data collection, data recording, data archiving, regulation compliance, equipment, GLP, GMP, calibration, method validation, traceability and more. And the person mixing and balancing those ingredients would be the lab manager. So says Dr. Shib Mookherjea in this month’s cover story. “One of the most essential factors in the implementation and enforce-ment of quality in any setting is management. And if managers do not pay attention to the quality side of their business, despite good science and the best people, the entire structure can collapse,” he says. The same sentiment is echoed by Dr. Henry Nowicki, president of PACS (Professional Analytical and Consulting Services), who says, “Paying close attention to quality and validated methods and data has been credited with helping laboratories to retain their competitive edge.” Turn to page 10 to find out what you can do to improve quality in your lab.In this month’s issue we also turn our attention to the more practical aspects of running a lab, such as team meetings. In Cyrus Farivar’s article on page 16, we learn that all team meetings are not alike and that with more thoughtful planning, managers or meeting leaders can make much more effective use of their meeting time. Ron Pickett in “Managing Change,” identifies the issue of change as the underlying nut to be cracked before other productivity improve-ments can be made. Turn to page 20 to learn a few simple steps to help your staff move from resistance to embrace the change inevitable in all organizations.While we all recognize that the amount of data and information in our personal lives contin-ues to grow exponentially, laboratory data makes that look like a mole hill to its mountain. John Borchardt in this month’s Technology & Operations article discusses the forces behind this ever growing “exaflood” of data and the challenges and R&D possibilities it presents. Our “Safety Guy,” Vince McLeod, this month talks about IEQ (indoor environmental qual-ity), while Sara Goudarzi in “Perspectives On: An Environmental Lab” (page 48) takes us into Florida’s Advanced Environmental Laboratories where Bob Dempsey shares its proud history and keys to continued success.On a separate note, be on the lookout for a new online survey from Lab Manager Magazine concerning laboratory safety. In the survey we ask you to rank your current lab safety practices, from safety inspections to hazardous material handling to safety training. Please help us help you by taking a few minutes to respond. From the results we will produce a report in the September issue sharing what we learn and hopefully providing direction for your own lab safety efforts. As always, we hope you find value in everything we offer here and online.
Ergonomically Correct.
Environmentally Safe.Best Products. Best Performance. Best Protection.
C l a ss I I B i o l o g i c a l Sa fe ty Ca b i n ets
Ultra High Effi ciency Motor Saves
Our DC / ECM motor technology lowers your total cost of
ownership: reduces energy costs, increases fi lter life, and
maintains true laminar airfl ow.
Experience Ergonomics™
All NuAire Biological safety cabinets are specifi cally
designed to reduce user fatigue. Maximum knee/thigh
clearance, low noise and vibration, proper armrest with
large effective work zone, frameless polished edge
view window and proper lighting for reduced glare and
expanded vision, and additional ergonomics accessories
to improve productivity, safety, quality, and reliability.
TouchLink™ Electronic Control System
More to offer with control at your fi ngertips. TouchLink™
is a microprocessor based touch screen LCD that
controls all cabinet functions. intellifl ow™ powered by
TSI™ manages real time airfl ow. nitecare™ saves energy
while maintaining a sterile environment overnight.
Sustainability
Our commitment extends to purchasing or using products
that reduce energy consumption, reduce environmental
health hazards, minimize pollution, and/or use recycled
content that will not deplete natural resources.
C l a ss I I B i o l o g i c a l Sa fe ty Ca b i n ets
2100 Fernbrook Lane | Plymouth, MN 55447 | U.S.A. | 763.553.1270 | WWW.NUAIRE.COM
5warranty
yearincluding filters
™
Over 100,000 Biological Safety Cabinets Located Throughout the World
Made in the U.S.A.®
ww.nuaire.com
CellGardES_LabManager_FP_v1_FEB2010.indd 1 2/24/2010 9:02:45 AM
10 Lab Manager May 2010 labmanager.com
Q IS FOR QUALITY
In the laboratory context, quality is a measure reflect-ing how effectively laboratory management and staff are able to deploy their instrumentation, tools, reagents and software to conduct laboratory tests and investigations with validated methods and regulated procedures to pro-duce accurate and consistent results on a routine basis.
The majority of laboratories are organized along in-house models—within companies, government agencies and universities—or as service entities that provide an array of analytical testing for a variety of customers. Irrespective of the end user of the output generated by laboratories, “Good quality translates into greater de-mand for services. Bad quality carries the risk of losing customers, and in a competitive environment, labora-tories cannot afford to lose good customers,” says Dr. Henry Nowicki, president of PACS Testing, Consulting,
Training, which offers a number of training courses in chromatography, mass spectroscopy and related areas for laboratory personnel.
Despite the vigilance of federal, state and local regu-lators and of accreditation organizations that evaluate and certify laboratories, the development and mainte-nance of quality in laboratories are constant concerns. Because much can and does go wrong and quality can be undermined by a variety of variables, laboratories may find it necessary to commission audits aimed at ascer-taining the quality of their operations.
Laboratory audits and inspections are listed among the capabilities of Nowicki’s group. “Before inspecting and auditing a lab, it is important to get a solid understanding of its equipment and the standard operating procedures, preferably of its most widely used tests. This is essential to get a good sense of a lab’s activities and processes and an understanding of the measurements it uses.
“Furthermore, it is important to know whether the lab uses state-of-the-art equipment and to have a good grasp of the staff ’s levels of training and experience. In highly specialized labs, which are common today, it is important to determine whether they have the right equipment, training, data collection, and recording and archiving, among other key attributes,” says Nowicki.
If and when deficiencies are found, the next step for laboratory auditors is usually to make recommenda-
tions to management about correc-tive action. Some adjustments may be necessary to ensure that labs are compliant, and that they are able to stay out of regulatory trouble and avoid the enormous costs associ-ated with it. In some cases strategic
changes may help them to streamline their processes and improve productivity.
Nowicki says that once an audit is completed and evaluated, it is important to bring anything amiss to the attention of the lab managers. It is also vital to inform them about potential remedies and to show them how to implement changes capable of fixing deficiencies in the operation as well as delivering key benefits. “It helps to show them the marginal returns for taking the recom-mended action. Lab managers really take note when they realize that they may be deficient compared to other labs
IS FOR QUALITYDESPITE GOOD SCIENCE AND THE BEST PEOPLE, LABS WILL SUFFER WITHOUT MORE ATTENTION PAID TO QUALITY by Bernard Tulsi
“… the development and maintenance of quality in laboratories are constant concerns.”
Q
PUBS: American LaboratoryAmerican Drug DiscoveryAmerican Pharmaceutical ReviewBio BusinessBio IT WorldBioTech WorldBioTechnology FocusBioPharm InternationalBioProcess InternationalChemical & Engineering NewsChemistry WorldDrug Discovery and DevDrug Discovery News
Environmental Science & TechnologyFood ProcessingFood QualityFood Safety MagazineGenetic Engineering News (GEN)Genome TechnologyGenomics & ProteomicsJour of The American Soc for Mass SpectrometryLab Asia Media GuideLab Business - JesmarLCGC AsiaLCGC N. AmericaLCGC Europe
Molecular and Cellular Protemomics Nature MethodsPharmaceutical Discovery & DevelopmentPharmaceutical ManufacturingPharmaceutical TechnologyPharmaceutical Technology EUROPEPharmaceutical ExecutivePharm Form and QualityProteomics JournalScientific Computing & InstrumentationScientific Computing World
Please note this is a COMMON SIZE mechanical file, you will need to center file using the center marks
provided when placing ad in the publication page area. (common size = smallest live/smallest trim / largest bleed)
Job # & CC: WATR12218_A
Job Name: WATR12218_A_Empower_CDS_2010_edit_DBmec.indd Date: 03-30-10Live: 6.75"x9.5" SmallTrim: 7.75"x10.5” LargeTrim: 8.375"x10.875" Bleed: 8.625"x11.375" Page: 1 Rev: 1Stage: mech Release: 03-30-10 DB AD: RR CW: GK PM: JT Scale: 100%Color: 4c Gutter: — Other: COPYRIGHT 2010_W/NEW COPY ST: DB
APP
RO
VALS C-LO
MECH PROOF
MK: ______________________ PM: ______________________ AB: ______________________
AD: ______________________ CW: ______________________ RM:______________________
QC: ______________________ CD: ______________________
Initials / Date Initials / Date Initials / Date
Client / Date: ________________________________________________
Get back more than what you put in — with Empower™ chromatography data software. Empower gets your laboratory up and running faster. Streamlines your workflow. And has tools to maximize capabilities like Method Validation Manager and Enterprise Data Manager. It’s every laboratory’s greatest asset. Learn more at waters.com/empower
ANY SOFTWARE CAN RETRIEVE DATA.HOW ABOUT RETURNING YOUR INVESTMENT?
©2010 Waters Corporation. Waters, Empower, and The Science of What’s Possible are trademarks of Waters Corporation.

12 Lab Manager May 2010 labmanager.com
and that changes are essential to stay com-petitive.” In fact, paying close attention to qual-ity and validated meth-ods and data has been credited with helping laboratories to retain their competitive edge, he says.
“In fact, insufficient attention to quality, validation and inadequacies in proper management oversight has been known to lead to the demise of laboratory-related business enterprises,” says Dr. Shib Mookherjea, who is currently senior manager for analytical services at Al-lergan, Inc. (Santa Barbara, Calif.), and whose lab quality experience has been honed in a number of large phar-maceutical companies and as an instructor on quality issues with the American Chemical Society and other professional organizations.
“We have to build and maintain quality and validation from the very outset; otherwise our measurement pro-cesses and our data will become questionable. People are realizing more now that they have to do increased due diligence and can’t go on taking shortcuts, an approach that has created big problems for labs in the past.”
He says that while there are still some laggards, more lab managers are inculcating in their staff the idea that regulations set out by agencies such as the FDA or the EPA are binding requirements, not merely suggestions. Sometimes that connection is missing in labs, and it would serve these organizations well if top management were to take repeated measures to instill the understand-ing that regulatory requirements have serious meanings.
Mookherjea says that quality practices vary by indus-try and by setting within industries and organizations. What cuts across several situations, however, is quality management system infrastructure, which may either be part of a regulatory regimen or optional. He says that some companies, especially in the pharmaceutical sector, are required to conform to regulatory guidelines such as good laboratory practice (GLP) and good manufacturing practice (GMP), often without exception.
“The infrastructure of the quality system is very important in maintaining GLP, GMP or ISO 9000 focus. With GLP, elements have to be defined at the outset because GLP is a very structured environment. For instance, it is not sufficient to say that there is document control, which is a GMP task, in the case of GLP. There
has to be an archivist for GLP final reports, which is not required in GMP.”
Mookherjea points out that in a number of companies there are questions about where GMP starts and GLP ends. He says management needs to be aware of this and to understand clearly the purpose of GMP and the tenets of GLP.
“This is essential in a regulated environment, but even in nonbinding situations there is a need to maintain an infrastructure of the quality system—and that is where quality control (QC) becomes very important.”
He says that QC is more or less the general lab procedure that is needed to maintain the focus on data quality. “It is basically concerned with how to calibrate instruments and how to maintain the documentation associated with sample management systems and other procedures,” Mookherjea says.
By contrast, quality assurance (QA) is more strategic. “Imagine QC as a small circle and QA as a slightly larger one, because QA gets into the development of infra-structure and how to maintain the quality control focus, and it may include auditing, documentation and train-ing. What the two different circles portray is that QC is limited to day-to-day operations, while QA is more open and strategic,” says Mookherjea.
Turning to the question of method validation, Mookherjea says that in every process, on a risk as-sessment basis, management has to make a decision on whether the process needs to be qualified or validated. He says, “If a lab is involved in developing a manufac-turing process, then that must certainly be validated. If it is involved in a cleaning process, then the cleaning validation will take effect, or if it is a case of an aseptic method, then aseptic validation comes into play.”
When dealing with methods, it is important to under-stand the goals of the methods, according to Mookherjea. “To do that, you need to go into the design stages of the method and assess what is needed to achieve the goal. Does the method require LC or LCMS or GC or AAICP? That depends on what parameters must be validated, what kind of resolution is needed and what level of laboratory
“In highly specialized labs … it is important to determine whether they have the right equipment, training, data collection, and recording and archiving …”
Q IS FOR QUALITY

Eeny, meeny, miny, more.
Get more than you bargained for with the Epoch Microplate Spectrophotometer with Take3. With our unique Take3 Multi-Volume Plate, you can read up to 16 2µL samples, 6- to 384-
well microplates, our patented BioCell with 1 cm vertical pathlength and standard cuvettes __ all with ease. One system, more choices, more assays.
www.biotek.com/epoch
I n t r o d u c i n g
Epochwith Take3
The world’s most versatile multi-volume, multi-sample Spectrophotometer System.
China • France • Germany • India • Singapore • Switzerland • United Kingdom • United States
Epoch-ad-LabX.indd 1 4/14/10 8:27 AM
labmanager.com
AutomatedSamplePrep in
Minutes
AutomatedSamplePrep in
Minutes Processes samples directly from original sample bottle Automatically delivers required solvents, rinses bottle, extracts analytes from the SPE disk Preprogrammed EPA Methods Reduces solvent use Lowers operating costs Increases productivity and effi ciency Improves quality/consistency
Automated Sample Preparation
for GC/MS & HPLC/MS
ExtractionDrying
Concentration
Telephone: 1.603.893.3663 Email: [email protected]
Web: www.horizontechinc.com/labmgr
quality assurance is required, among other factors.”
Mookherjea says that method valida-tion is only one of the components of QA. Another key component is trace-ability based on unique identification numbers for samples. “There are several cases of samples getting mixed up and misplaced because people do not take the time to develop distinct alphanu-meric labels for them. They do not take the time to understand how an analytical work request is created, what the goals are, and whether it is specific enough to convey what is being requested by internal users or ex-ternal customers.”
Turning to the issues of manage-ment and leader-ship, Mookherjea says that all quality standards recog-nize that one of the most essential factors in the implementation and enforcement of quality in any setting is management. Invoking quality gurus such as William Edwards Deming and Joseph Moses Durant, Mookherjea says quality is everybody’s responsibil-ity, “but quality needs to start at the top, and management has to buy into quality first; then it has to be carried through the entire organization.”
He says that quality is not static but rather a continuous improvement process. “Quality is not a project, it is a continuous process, and both Deming and Durant have maintained that quality must be a never-ending commitment of a company.”
In describing the drivers of qual-ity in the laboratory environment, Mookherjea says that there are three large buckets: one contains the funda-
mental science, which comes first and drives everything; the second contains the technology, software and informa-tion systems; and the third contains management techniques and roles and “the big letter Q for quality. If atten-tion is not paid to the quality side, de-spite good science and the best people, the entire structure can collapse.”
Prior to considering quality, it is important to know the science behind it. “If people do not understand the underlying analytical chemistry of an
analytical process, for example, they will of neces-sity use a robotic rather than a scientific approach in their laboratory analyses.”
As a result, well-trained personnel are another vital component of a
well-functioning laboratory, accord-ing to both Mookherjea and Nowicki. “Training should be ongoing to keep up with rapidly changing technology and new regulations. Human resourc-es are crucial, and management has to select and empower them and provide the resources for them to thrive in an environment of scientific discipline and professionalism’’, says Nowicki.
“Overall, there could be more training of personnel—training that includes the use of computerized systems and data interpretation—to produce a higher-quality staff for laboratories. A lot of the training that chemists receive lacks exposure to key instrumentation, and a number of academic universities do not teach fundamental skills such as how to interpret mass spectrometry data, which should be a core skill. Motivation is very important in the lab environment,
Q IS FOR QUALITY
“Some adjustments may be necessary to ensure that labs are … able to stay out of regulatory trouble …”
AutomatedSamplePrep in
Minutes
AutomatedSamplePrep in
Minutes Processes samples directly from original sample bottle Automatically delivers required solvents, rinses bottle, extracts analytes from the SPE disk Preprogrammed EPA Methods Reduces solvent use Lowers operating costs Increases productivity and effi ciency Improves quality/consistency
Automated Sample Preparation
for GC/MS & HPLC/MS
ExtractionDrying
Concentration
Telephone: 1.603.893.3663 Email: [email protected]
Web: www.horizontechinc.com/labmgr

SPE DisksProcess Larger
and DirtierSamples
SPE DisksProcess Larger
and DirtierSamples
Pesticides and Herbicides Pharmaceutical By-Products Personal Care Products Hormones/Endocrine Disruptors Bisphenol A /Nonyl Phenol Oil & Grease/1664A Semi Volatile Organics TPHs, PAHs, PCBs Emerging Contaminents EPA Methods 525.2, 8270, 1694 ... many more
Extraction Solutions forGC/MS & HPLC/MS
Aqueous andEnvironmentalApplications
Telephone: 1.603.893.3663 Email: [email protected]
Web: www.horizontechinc.com/labmgr
Q IS FOR QUALITY
and training helps tremendously in that process,” says Nowicki.
Both experts acknowledge that new analytical technologies have been a huge help in maintaining laboratory quality. Mookherjea points to HPLC equipment, particularly the introduc-tion of the autosampler, which he de-scribes as a quantum leap in analytical instrumentation that provides labora-tories with a tremendous advantage.
Despite some major gains, how-ever, Nowicki points to the need for technology to make labora-tory measure-ments faster and to deliver results in minutes instead of hours. “We need to push to have technology that can do analyses faster, better and cheaper. Instru-ment developers need to come up with new measurement technologies based on DNA and other techniques. They are doing that, but this is a continuous process, and there is still more ground to cover.”
To be sure, some major causes for concern still exist. Mookherjea says that in the past few years, “Quality has improved by leaps and bounds, but it is still not where it should be. The focus is not there because companies are changing rapidly and dynamically.
“There is a lack of constant aware-ness by top management teams that build labs and focus on the building rather than on the far more valuable and essential human resources. They do not promote ongoing training but instead rely on the skill sets that workers are recruited with. They need to find ways to expand on those
skills. Lab workers need to be trained on regulations and new technolo-gies—that is where a big gap exists.”
Despite strong optimism about the future of analytical laboratories, Nowicki was more emphatic about some of the current shortcomings. “I think that laboratory leadership has largely failed. Management has cut the head count in labs to such an extent that the remaining personnel are overworked—and when people are overworked and worn out, qual-
ity suffers.”The other side
of the problem is that when leaders try to run their operations with too many workers, cost-effectiveness suffers, he says. “There must be a careful balance between the num-
ber of people needed and the quality of the output,” he says.
In addition, the quality should match the business. “Some areas must have high, precision quality all the time, while some others may be able to operate at a lower quality threshold. In every laboratory, the key question that must be addressed at all times is, ‘What level of quality is required?’”
Still, Nowicki is confident that labs will deliver on the desired quality goals. “Laboratories know their problems, and they know their strengths and weak-nesses.… I am encouraged that over time laboratories will get better.”
Bernard Tulsi is a freelance writer based in Newark, Del. He may be contacted at [email protected] or 302-266-6420.
“Lab managers really take note when they realize that they may be deficient compared to other labs …”
SPE DisksProcess Larger
and DirtierSamples
SPE DisksProcess Larger
and DirtierSamples
Pesticides and Herbicides Pharmaceutical By-Products Personal Care Products Hormones/Endocrine Disruptors Bisphenol A /Nonyl Phenol Oil & Grease/1664A Semi Volatile Organics TPHs, PAHs, PCBs Emerging Contaminents EPA Methods 525.2, 8270, 1694 ... many more
Extraction Solutions forGC/MS & HPLC/MS
Aqueous andEnvironmentalApplications
Telephone: 1.603.893.3663 Email: [email protected]
Web: www.horizontechinc.com/labmgr
how to Run an effeCtive Meeting
LeadeRShiP & Staffing
Make youR MeetingS MatteR by Cyrus farivar
16 Lab Manager May 2010 labmanager.com
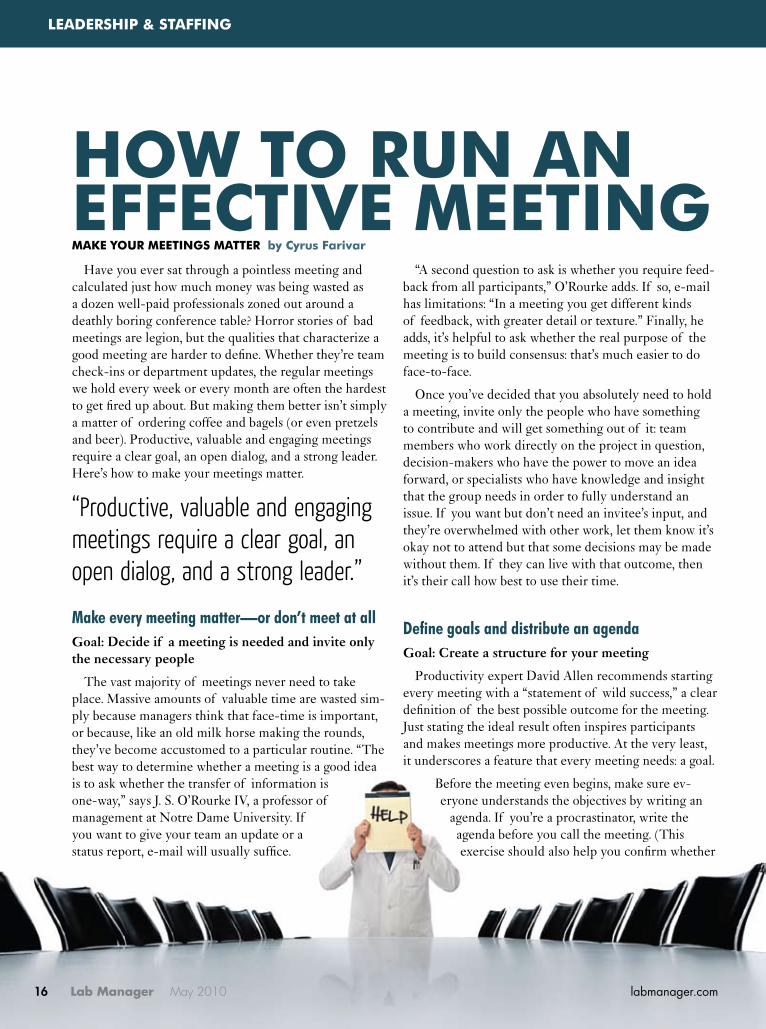
Have you ever sat through a pointless meeting and calculated just how much money was being wasted as a dozen well-paid professionals zoned out around a deathly boring conference table? Horror stories of bad meetings are legion, but the qualities that characterize a good meeting are harder to define. Whether they’re team check-ins or department updates, the regular meetings we hold every week or every month are often the hardest to get fired up about. But making them better isn’t simply a matter of ordering coffee and bagels (or even pretzels and beer). Productive, valuable and engaging meetings require a clear goal, an open dialog, and a strong leader. Here’s how to make your meetings matter.
Make every meeting matter—or don’t meet at allGoal: Decide if a meeting is needed and invite only the necessary people
The vast majority of meetings never need to take place. Massive amounts of valuable time are wasted sim-ply because managers think that face-time is important, or because, like an old milk horse making the rounds, they’ve become accustomed to a particular routine. “The best way to determine whether a meeting is a good idea is to ask whether the transfer of information is one-way,” says J. S. O’Rourke IV, a professor of management at Notre Dame University. If you want to give your team an update or a status report, e-mail will usually suffice.
“A second question to ask is whether you require feed-back from all participants,” O’Rourke adds. If so, e-mail has limitations: “In a meeting you get different kinds of feedback, with greater detail or texture.” Finally, he adds, it’s helpful to ask whether the real purpose of the meeting is to build consensus: that’s much easier to do face-to-face.
Once you’ve decided that you absolutely need to hold a meeting, invite only the people who have something to contribute and will get something out of it: team members who work directly on the project in question, decision-makers who have the power to move an idea forward, or specialists who have knowledge and insight that the group needs in order to fully understand an issue. If you want but don’t need an invitee’s input, and they’re overwhelmed with other work, let them know it’s okay not to attend but that some decisions may be made without them. If they can live with that outcome, then it’s their call how best to use their time.
Define goals and distribute an agendaGoal: Create a structure for your meeting
Productivity expert David Allen recommends starting every meeting with a “statement of wild success,” a clear definition of the best possible outcome for the meeting. Just stating the ideal result often inspires participants and makes meetings more productive. At the very least, it underscores a feature that every meeting needs: a goal.
Before the meeting even begins, make sure ev-eryone understands the objectives by writing an
agenda. If you’re a procrastinator, write the agenda before you call the meeting. (This exercise should also help you confirm whether
“Productive, valuable and engaging meetings require a clear goal, an open dialog, and a strong leader.”
LeadeRShiP & Staffing
a meeting is necessary and who should attend.) Include everything your group will need to discuss or decide on but keep it brief, using bullet-pointed items instead of full paragraphs. Be clear about who will lead each agenda item and whether it’s an update, a discussion or an action item that requires group decision-making.
Email the agenda to your colleagues a day in advance, so that potential naysayers will have the opportunity to make their objections known privately—rather than dur-ing the meeting. (If necessary, you’ll then have time to in-clude their suggestions in a revised agenda.) Always paste the agenda into the body of the email; if it’s an attach-ment, no one will bother to open it. Phrase your agenda in a way that will increase the sense of urgency and impor-tance. An item called “sales challenge for this quarter” is much more captivating than “sales quarter update.”
“You want to interest people,” says Bert Decker, a com-munications consultant who has worked with Siemens, Charles Schwab, and Representative Nancy Pelosi. “It gives them a guide to where you’re going. It has a point of view and an action step. You’re influencing them towards something, not just informing them.”
In bigger meetings that require more bodies and more time, give the conversation a clear structure by assigning topics an allotted amount of time. Decker recommends picking odd numbers—25 minutes instead of 30, for example—to show that you’re serious about sticking to a precise schedule.
To increase involvement, consider giving everyone a role or assignment. Team heads or those with specialized knowledge should handle the agenda items that apply to their areas. For longer meetings, if the material covered is not relevant to some people, arrange to have them excused from that portion of the meeting, so they can get back to work rather than waiting through issues that don’t concern them.
Essential ingredientsJobs for meeting attendees:
Meetings run more smoothly when the organizer en-lists others to help handle the details. It’s also a good way to engage coworkers who might otherwise stare out the window or pass the time by twiddling with a Blackberry.
Timekeeper: Makes sure the meeting starts and stops on schedule, reminds facilitator when agenda items are going over their allotted time.
Note Taker: Records what was said and distributes min-utes as needed.
Whiteboard Wrangler: Writes ideas on the whiteboard during brainstorming sessions, makes sure every idea is recorded, whether or not it seems promising at first glance.
Own your meetingGoal: Take charge and keep your meeting moving forward
Good meetings are products of good leadership. Take charge and make it clear that you intend to keep the discussion timely, useful, and relevant. Begin by writing the meeting goal on the whiteboard to remind everyone
“If you want to give your team an update or a status report, e-mail will usually suffice.”
To order : 714-578-6000Fax: 714-578-6020
Low-Cost Solutions for High-Tech Industries
Complex System Integration (shown: anaerobic test chanber)
Hundreds of standard enclosures• Acrylic • Polycarbonate • Dissipative PVC • Stainless Steel • Polypropylene • More!
Mix and match standard process controls for• Temp. (-40° to 300°C) • Vacuum • Fume removal • High/low humidity • Particle filtration • Static control• Process gas generation & mixing
Gloveboxes
Economical plastic chambers start at $819
GBX_4_blue_0509_LM.indd 1 4/13/09 9:44:41 AM
18 Lab Manager May 2010 labmanager.com
LeadeRShiP & Staffing
why they’re there. If you’ve asked people to do some kind of homework and they haven’t done it, stop and reschedule the meeting. It won’t pay to continue, and meanwhile you’ll send a strong message that preparation is not optional.
Show your colleagues that you respect their time by mak-ing sure a clock or timer is visible to all. At Google, facilita-tors project a four-foot-tall timer onto the wall to enforce the idea that meetings should begin and end on time.
Of course the number-one way to get people to show up on time is to start on time. “My calendar is scheduled for the entire day,” says Catherine Smith of software company Linden Lab, makers of the online virtual world Second Life. “If someone’s not there at 8, then the meeting will go on without them. I’m not going to wait, because I can’t.”
Hank Lambert, director of business development at Cisco Systems, warns not to take this approach to extremes, however, especially in a meeting with co-workers who outrank you. “I usu-ally wait for higher-ups,” he says. “Especially if I’m trying to convince them of something.” If you have a senior VP who’s habitually late, find out where she’ll be before the meeting and escort her to the meeting place yourself.
Staying on topic is also key to maintaining a schedule. If the conversation runs off the rails, refocus the group by saying something like: “Interesting, but I don’t think we’re advancing our goals here. If I could, I’d like to return to the agenda.” This is where an agenda becomes invaluable: Without one, it’s far too easy to get side-tracked. When a tangent turns out to be important, don’t let the rest of your schedule go out the window. Decide whether it’s worth pursuing and direct the conversation accordingly: “We’re talking about a new issue—do we want to swap out one of our agenda items to continue discussing it?”
Case study: Let’s be careful out there
Meetings, and the way they’re held, can help deter-mine the culture of a business. Since 1924, UPS has held daily Pre-Work Communications Meetings at the beginning of every shift. At these highly structured three-minute meetings—held at all 1,700 UPS centers worldwide—managers deliver important information
before their drivers head out for the day: weather and road conditions, reminders about safety and customer service, and announcements like employee anniversa-ries. Implicitly, the meetings also help instill company values—particularly safety and efficiency—by reinforc-ing them on a daily basis.
Make it a meeting of the mindsGoal: Get the constructive input you need from ev-eryone present
Since the point of a meeting is two-way communi-cation, it’s crucial to get honest input from everyone. Successful companies know that disagreement and debate are healthy signs of a passionate work force. “We require
that people speak up and are chal-lenged,” says Gary Kelly, CEO of Southwest Airlines. No one should feel afraid to say what they really think, and no one person or group should dominate the discussion.
It’s the meeting leader’s respon-sibility to make sure everyone is
heard. Nudge the quiet types, curb the longwinded, reign in tangents, and control outbursts. To build consensus or come to a group decision, avoid wearing your opinion on your sleeve; it’s easy for a leader to stifle a discussion if everyone assumes the outcome is already determined. Avoid the temptation to dismiss ideas immediately—even when they’re terrible. For meeting participants, it’s embarrassing to be told “no,” and over time that kind of discouragement has a corrosive effect on brainstorming efforts. Instead, keep track of every idea, thank people for their input and praise good ideas in front of the group.
Irv Schenkler, director of management communica-tion at New York University’s Stern School of Busi-ness, says a good manager should be an active listener who encourages participation by asking “door-opening questions”—inquiries that show you’re paying atten-tion and you value your co-workers’ input. For example, when attendees are reticent or reluctant to speak, Schen-kler advises calling on them: “Sue, you seem to know a good deal about what Beth just said. What are some things you would like to raise at this point?” Likewise, you can divert a conversation dominator with a neutral comment like, “Bob has made his opinion clear. Does anyone else have something they would like to add?”
“… a good manager should be an active listener who encourages participation.”
LeadeRShiP & Staffing
“The best way I’ve found to get consensus is to make everyone feel like they had a chance to be heard,” Lam-bert of Cisco says. If people still don’t feel like their points of view are being understood or taken seriously, allow them a final opportunity to distill their disagree-ments down to one or two key points. That way, Lambert explains, a dissenter has a chance to articulate his or her rationale, and the group’s decision can be adjusted to ad-dress those concerns.
Hot tip: The eyes have it
According to A. Barbour, author of “Louder than Words: Nonverbal Communication,” only 7 percent of communication is what we say—the rest is how we say it. Pitch, volume, and rhythm carry 38 percent of a message, while body language, facial expressions, and eye movement account for a whopping 55 percent.
As a meeting facilitator, you can use non-verbal cues not only to communicate your message but to influence the group dynamic and make all attendees feel included. When people speak during meetings, often they’ll look at the facilitator. Avoid their eye contact and look at other members of the group, which will encourage the speaker to do the same.
Close with a plan of actionGoal: Make sure everyone leaves knowing the next step
Close the meeting with a review of what decisions you reached and what the next action will be. Every-one should leave knowing what’s expected of them and when—by the end of the week, the end of the cycle, or the next meeting. End by asking everyone whether they thought the meeting was useful and, if not, what could be done better next time.
It’s easy to walk out of a meeting room, go back to your desk, and immediately forget every change, deci-sion, and new idea that your group came up with. Make sure that your meeting didn’t happen in isolation by letting the right people know what was decided and what will happen next. Sending out complete meeting minutes may not be necessary, but make sure you have a system to keep track of what was decided and what assignments everyone agreed to take on, so you can follow up and keep things moving.
Technically speaking: The easy way to preserve whiteboard ideas
Say you and your colleagues had an intense white-board session and came up with a complex diagram that will solve all your problems. But copying it onto a notepad will take hours, and another group is standing outside waiting to use the conference room. What to do? Take a picture of the board with a camera phone and e-mail the photo file to [email protected]. They’ll clean up the image, improve the contrast and legibility, turn it into a PDF, and e-mail it back so you can forward it to everyone on your team (all the while securing the confi-dentiality of your file).
Used with permission of BNET.com Copyright© 2009. All rights reserved.
what you wiLL need:LoCation: Lounges and coffee shops have a better ambiance for small groups of three or four. If your meeting is large enough to require a conference room, reserve one ahead of time.
agenda: Know what you want to cover and how much time you want to devote to each topic. Set a goal for the meeting and stick to it.
viSuaL aidS: Get the most out of your gathering with a whiteboard or flip pad, and make sure to have a clock or timer visible.
LeadeRShiP: It’s your meeting, so it’s your job to keep people focused. If they’re bored, that’s your fault.
what not to do:uPdateS: If the flow of information is one way, send an email instead.
getting SLaCkeRS on tRaCk: Berating or embar-rassing people in front of their peers doesn’t improve motivation, and it wastes everyone else’s time. Have a one-on-one conversation instead.
getting eveRyone on youR Page: If there’s disagreement about a project, approach team members individually and find out what they need to move forward. In a group setting, they might gang up on you.
whiPPing uP enthuSiaSM: Motivation is a daily man-agement challenge, not a one-time fix. If your team is losing steam, find out why in private conversations and address each person’s issues separately.
19 May 2010 Lab Manager

20 Lab Manager May 2010 labmanager.com
My staff is bright, well educated, mature and motivated, and we communicate well. Still, when I try to institute a change, there seems to be a lot of resistance! Why is that?
In each of my last four articles—“Honing Your Inter-view Skills”; “Motivating 21st Century Lab Staff,” Parts 1 and 2; and “Life-Work Balance”—the underlying theme requires a change: a change in behavior, in attitude or in lifestyle. None of these changes are easy to achieve, and some seem near impossible. However, the change process can be understood, and change can be implemented more successfully and more reliably by following a few rules.
“The professional literature suggests that up to 75 percent of change efforts end in failure.” (http://www.cepworldwide.com/pdf/Conquer_02.pdf)
Resistance to changeWhy do people, even smart people, resist change?
Here are the most frequent reasons:
1. People feel awkward and uncomfortable. They are comfortable doing things the way they always have and don’t want to move out of their routine.
2. People think first about what they will lose. It may be sta-tus, routine, position, prestige or income. It takes a skillful manager to get the staff thinking about what will be gained.
3. People feel alone even when others are having the same experience. Change has a way of isolating people. They talk about rumors, they wonder about what the impact of the change will be, but they probably don’t share their concerns and anxiety, so they feel alone.
4. People can handle only so much change. Change seems to be a constant, and it is easy to move into a state of overload without even knowing it.
5. People are at different levels of acceptance. Our ten-dency is to listen to the people who agree with us and to hear what we want to hear. It takes special effort to ferret out the negative positions.
6. People are concerned that they will lack the needed resources. Does the manager really understand what the change will take? Time, space, training, physical resources, computer access, communication, con-tacts—the list is long.
7. People revert to old habits when the pressure is off (or ON!). This is one of the reasons so many change efforts fail—follow-up and reinvigoration are almost always required in order to make a significant change “stick.” (Hint: This is one of the most frequent failures of man-agers! We love to change things—we hate to follow up!)
(Incidentally, be afraid, be very afraid, if there is no resistance to a major change—it may be that you aren’t picking up on the vibes!)
(For more on resistance to change, check “Overcom-ing Resistance to Change: Top Ten Reasons for Change Resistance” by A. J. Schuler, Psy.D. www.schulersolutions.com/resistance_to_change.html.)
“Don’t manage—lead change before you have to.”—Jack Welch
Assessing readiness for change1. Do key stakeholders understand and support the initiative?
2. Are available financial and physical resources adequate?
3. Are current staff skills and experience adequate?
4. Does staff have access to the needed tools and infor-mation resources?
5. Is effective sponsorship and project management in place?
6. Are effective issue-management and decision-making processes in place?
7. Are feedback and accountability systems sufficiently developed?
8. Are there unacknowledged barriers to successful implementation?
Leading Change
LeadeRShiP & Staffing
RuLeS foR SuCCeSSfuLLy iMPLeMenting Change in youR oRganization by Ron Pickett
“… follow-up and reinvigoration are almost always required in order to make a significant change ‘stick’.”

Do it with one glove tied behind your labcoat.
Seal buckets with a simple one-handed snap. It’s just one way
Thermo Scientific centrifuges make your life easier because they’re
designed for the way you work. With superior performance, reliability
and rotor support built-in — it’s the little things that are no small
matter when it comes to keeping you happy and productive:
• Innovative and certified ClickSeal® bucket sealing system:glove-friendly, one-handed snap-on covers replace screw caps and clips.
• Easy and secure AutoLock® rotor management: exchange rotors in less than 3 seconds with the push of a button, switching fromhigh capacity to high performance.
• Thermo Scientific Fiberlite carbon fiber rotors: speed, versatilityand corrosion-resistant design to maximize performance.
Getting the max out of your centrifuge shouldn’t take extra work .
To learn more about Thermo Scientific general purpose centrifuges,
visit www.thermoscientific.com/centrifuge
© 2
010
Ther
mo
Fish
er S
cien
tific
Inc.
All
right
s re
serv
ed. A
ll tra
dem
arks
are
the
prop
erty
of T
herm
o Fi
sher
Sci
entif
ic In
c. a
nd it
ssu
bsid
iarie
s.
Moving science forward
Thermo Scientific Sorvall Legend XT centrifuges:Accelerate your research withincreased capacity in the same bench space.
Visit us at ASM, booth 517!
GPCent_LabMan_0510:Thermo 4/15/10 9:04 PM Page 1

labmanager.com
(In workshops on change management, I usually play Amy Winehouse singing “Rehab” —the best example I know of unreadiness for change.)
If you score your group low on readiness for change, you will need to spend much more time in the preparation phase, basically the first four items on the list that follows.
The most-used term in the last election, and in every election, is CHANGE! Except by the incumbents.
Successfully leading changeHere is the model from John P. Kotter’s book Leading Change.
1. Establish a sense of urgency.
2. Create a guiding coalition.
3. Develop a vision and strategy.
4. Communicate the change vision.
5. Empower broad-based action.
6. Generate short-term wins.
7. Consolidate gains and produce more change.
8. Anchor new approaches in the culture.
(See “Communicating a Vision” by Kerri Harris from Leadership and Staffing, Lab Manager Magazine, 2/8/2010.)
Let’s take a fairly common and simple example—the introduction of a new piece of equipment.
1. The purchase decision will probably provide you with most of the information you need to establish the need for the new piece of equipment. You will probably have costs, savings, improved accuracy, etc., to make a good case for the new equipment. Now the challenge is to convert your decision into a sense of urgency. Why us? Why now?
2. Who should you use in your guiding coalition, and what do you want them to do? Opinion leaders, regardless of their position, are the people you want to involve in this group. Think through the different age cohorts on your staff and ensure that each is represented. (Note: Some of the “right” people may not be the easiest to work with!)
3. How can anyone resist the new Whizbang 9300 integrated digital analyzer with Internet interface? Check the section above on over-coming resistance to change.
4. The future state. The problem here is Pollyanna! Our human tenden-cy, at least for us optimists, is to exaggerate the positives and under-estimate the negatives! The partial answer is to be realistic in your assessment, assume more problems and challenges than you hope for, and get your staff, especially the pessimists, involved in plotting the future. They will have a better sense of what is going to be required, since they deal with the foibles and idiosyncrasies of day-to-day life with high-tech equipment—the Wizbang 9100. (Hint: This is a great
LeadeRShiP & Staffing
Self- Regulating Evaporation Control
Self- Regulating Evaporation Control
DisposableUV-Cuvettesfor DNA & RNA!
Save money: no more costly, fragile quartz cuvettes Save sample: minimum sample size 70uLSave time: no more cuvette washingBetter results: ends carry-over risk of reusable cuvettes; available individually wrapped, free of DNA, DNase, RNase.
BRANDUV-Cuvettes• UV-transparent
and disposable• Use between
220-900nm • 70µL minimum
sample volume• 10mm
lightpath
Toll Free: (888) 522-2726 www.brandtech.com
Lab Rats Trust BrandTech!
FREE SAMPLES
LabMngr.BT.third.4c.cuv..indd 1 4/14/2010 3:18:07 PM

23 May 2010 Lab Manager
technique for overcoming resistance.)
5. One of the most difficult problems for managers is empowering their staff. For successful change, people must have the authority to make decisions and respond to on-site problems. They have to know what deci-sion you would make in a similar situation and to feel strong in making important decisions. Your role is mentoring, coaching and encouraging those involved. “… top performers rapidly alternate between teaching and questioning or otherwise testing. Then, when re-quired, they make immediate corrections.” (Influencer: The Power to Change Anything)
6. The route to follow. This step is more involved than simply deciding where to park the new monster. Ensure that your waypoints cover the bases that came up in your assessment of the resistance to change, capitalize on small wins and achievements, keep the guiding coali-tion involved and change your implementation strategy as new information emerges. Use numbers, cost per test, improvements in accuracy and endorsements by users to make your case for the advantages of the new equipment.
7. Establish the change as “the way we do things around here!” Many change efforts fail because managers don’t take the time to enforce—and reinforce—the new pro-cess or piece of equipment or system. Then they won-der why people revert to old habits. Reward successful examples of people performing as you want them to, and sanction poor behavior. Challenge negativity.
Short checklist for change managers: • What exactly is the change you want to institute?
Be specific.
• Whyisthischangeneeded?
• Whynow?
• Whoshouldbeinyourguidingcoalition?
• Whowillbeaffected?
• Howcanyoucommunicatethevision—theurgency?
• Whatshort-termwinscanyouexpect?
When to get formalTo many readers, this sounds great for major
changes, but they wonder what the trigger should be to signal when a change is big enough to warrant a formal approach. There is no simple answer. For example, it is unlikely you need a guiding coalition
to rearrange the workbenches in the lab. (If you do, you have much bigger problems than can be solved here!) As general guidelines: if the change will affect more than a few people, if someone’s position is threatened, if the change has impact across several work units, if this is another in a string of recent changes or if you have had difficulty instituting change recently, then you should consider the more formal approach described here.
“For change efforts to succeed, managers and change agents must develop and use power skills.”—John P. Kotter
Unintended consequences There will always be unintended consequences of any
change. Things that you didn’t expect to happen as a result of the change. (Recall that when we increased the use of etha-nol for fuel, food riots broke out in some areas of the world! I doubt that your changes will have a similar consequence.) So, good change managers expect such consequences, look for them, acknowledge them and try to ameliorate their impact; really good change managers take credit for unintended conse-quences when they are positive.
If you would like to review a PowerPoint presentation on this subject, check out www.labmanager.com/docs/Lead-ing_Change.pdf
For further discussion on this topic, visit Ron on YouTube at http://www.youtube.com/watch?v=VnsongFxWS4.
References:Kotter, John P. Leading Change, Harvard Business School Press, Boston, 1996.
Patterson, K., Joseph Grenny, David Maxfield and Ron McMillan, Influencer: The Power to Change Anything, McGraw-Hill, 2007.
Winehouse, Amy, “Rehab,” Back to Black, www.mtv.com/videos/amy-winehouse/148347/rehab.jhtml.
Schuler, A. J., “Overcoming Resistance to Change: Top Ten Reasons for Change Resistance,” www.schulersolu-tions.com/resistance_to_change.html.
Ronald B. Pickett is an organizational effectiveness consul-tant based in Escondido, Calif. He can be reached by e-mail at [email protected] or by phone at 760-738-8638.
LeadeRShiP & StaffingLeadeRShiP & Staffing
Take a minute to think about the last major change that you successfully instituted. What did you do, and what can you learn to improve the chanc-es of success in future changes? The best management skills learning comes from analysis of and generalization from our own experiences.

24 Lab Manager May 2010 labmanager.com
SteM CeLL ReSeaRCh doLLaR$
Human Embryonic,• which in 2006 received $38 million in funding, is expected to receive $126 million in 2011 (an increase of 232%)
Non-Human Embryonic,• which in 2006 received $110 million, is expected to receive $155 million in 2011 (an increase of 86%)
Adult Stem Cells,• which includes umbilical cord blood/placenta and other non-embryonic, which in 2006 received $534 million, is expected to receive $717 million in 2011 (an increase of 96%)
Stem Cell Research,• an all-inclusive category (where everything else NIH was not able to categorize more specifically was thrown), which in 2006 received $643 million, is expected to receive $1.1 billion in 2011 (an increase of 71%)
To put it simply, there has been a dramatic rise in government funding for stem cell research of all kinds since 2006.
At the beginning of his presidency in 2001, George W. Bush established embryonic stem cell research as a partisan political issue when he signed an executive order that froze funding for embryonic stem cell research and limited researchers to using existing stem cell lines. The Republicans fell into line with Mr. Bush while the Dem-ocrats voiced strong support for stem cell research, and the battle was waged along party lines in the years that followed.
Perhaps it was this restriction on embry-onic stem cell research that led American scientists to start focusing more on adult stem cells. Non-embryonic stem cells (also referred to as “adult stem cells”), such
the PoLitiCS of SteM CeLL ReSeaRChLateSt nih RePoRt PRovideS a SnaPShot of wheRe SteM CeLL ReSeaRCh SuPPoRt doLLaRS aRe going by Richard daub
“… the most volatile area of all research funding has been that of stem cell research.”
The National Institutes of Health (NIH) recently pub-lished its annual report on support levels for the funding of various research, condition, and disease categories.
The report, which included 218 research and disease areas, had data ranging from the actual 2006 totals to the estimated totals for 2011. Since the NIH is a government institution, it should come as no surprise that the biggest changes came in areas that have been the subject of fierce political debate, and perhaps the most volatile area of all research funding has been that of stem cell research.
In the report, the stem cell areas were broken into numer-ous categories that changed during the reporting period from broader to more specific categories, and some simply catego-rized at all beyond “Stem Cell Research”. Therefore, for the purposes of this article, we combined the following statistics into four basic categories:

SteM CeLL ReSeaRCh doLLaR$
as those derived from the blood in umbilical cords, began to show more promise for the treatment of a wide range of diseases. This was an encouraging sign for some, including Republican senator and presidential candidate John McCain, who eventu-ally reversed his initial opposition.
Celebrities such as Michael J. Fox and Christopher Reeve also became the faces of the issue and helped sway public opinion to the pro side.
Yet, despite the growing optimism for the potential of non-embryonic stem cell research and the gradual shift in public opinion, the term “stem cell” still has a negative con-notation for some because of its as-sociation with the word “embryonic.” Therefore, it remains a controversial sociopolitical issue, which may be due to simple misunderstanding.
“I think people most often mistaken-ly think that all stem cells are equal,” says Dr. Jack Mosher, a research assistant and lab manager at the Life Sciences Institute at the University of Michigan. “When they hear the generic term ‘stem cell,’ they assume that it can make any particular cell type. But there’s a big distinction between adult and embryonic stem cells that sometimes gets overlooked, either because the people talking about stem cells are purposely being misleading or are not being clear.”
With the election of Barack Obama, an avid supporter of embryonic stem cell research, a new era in American stem cell research has begun. One of President Obama’s first acts in
office in early 2009 was an execu-tive order to melt the freezes that George W. Bush implemented eight years earlier. However, because of the work that was being done with adult stem cells during the Bush administration—work that perhaps may not have been done if scientists
had open access to embryonic stem cells—funding for adult stem cell research is also expected to increase dramatically in 2011. Some of the new grants awarded for adult stem cell research include projects such as “Cell Therapy for Improving Cardi-ac Function,” “Cancer Stem Cells in Acute Lymphoblastic Leukemia and Ovarian Carcinoma,” and “SiRNA Gene Therapy for HIV/AIDS.”
The Burnham Institute for Medi-cal Research in La Jolla, California, was a beneficiary of one of the new grants for a project that explores the homing of stem cells in stroke therapeutics. This grant was awarded under the umbilical cord blood/placenta category, not the embryonic (human) category, and lab manager Andrew Crain says this research probably would not have been pos-sible without this new grant because of the large expense.
“We started to hire more people, form more collaborations, and increase the magnitude of the projects,” Andrew says of the grant. “We’re able to do bigger and better things.”
Although embryonic stem cells are generally considered to be more flexible than adult stem cells and to hold more potential for eventually
leading to cures for diseases, con-tinued research on adult stem cells may be pivotal to the future of all stem cell research. Another political swing to the right could once again put embryonic stem cell research on hold, and if adult stem cell research has been put on the back burner
during this period of embryonic al-lowance, it can effectively delay work that could lead to a major
breakthrough. Additionally, the most important aspect of adult stem cell research may be that if it ever catches up to or surpasses embryonic as the primary form of stem cell research, it could effectively end the controversy once and for all.
“Stem cell research is probably one of the most important types of research because you not only have that ability to model diseases, but also to exploit the properties of the stem cells to your advantage,” Andrew Crain says.
“Stem cell research has a real chance of being able to treat diseases that currently have either limited or no treatments,” Dr. Mosher says. “It allows us to look for treatments or cures for these diseases in ways that we really haven’t had the ability to do before.”
Richard Daub is a freelance journal-ist based in New York City who writes for trade publications in a variety of different industries. He can be reached by phone at 917-657-6532 and by e-mail at [email protected].
“Non-embryonic stem cells … began to show more promise for the treatment of a wide range of diseases.”
RDM Industrial Products, Inc.www.labspacesolutions.com 877.777.9130Custom Dimensions & Optional Workstation Accessories
Your One-StopSolution Shop for:Laminar Flow WorkstationsVertical HEPA Air FlowESD Control Optional
26 Lab Manager May 2010 labmanager.com
Lab managers will face an increasing challenge in the next decade—managing a rising tide of data. The amount of data generated annually is forecast to double every two years for the next decade as the cost of computing and networking declines.1 Laboratories will contribute to this data flood as the number of people and data-generating instruments connected to the Internet increases. George Gilder referred to this phenomenon as the “exaflood.” (Gilder is senior fellow at the Discovery Institute and chairman of George Gilder Fund Management, LLC.) An exabyte is equal to one billion gigabytes, or approxi-mately 50,000 times the contents of the U.S. Library of Congress. From the laboratory perspective, some research projects routinely generate terabytes and even pentabytes of data. (A terabyte is 1 trillion bytes; a pentabyte is 1,000 terabytes.) Many other projects result in smaller, hetero-geneous collections with valuable attributes. To realize the full benefit and value of these diverse and voluminous data requires effective data management techniques, insti-tutional arrangements, and policies.
Factors promoting the exafloodFrom the laboratory perspective, factors promoting the
exaflood include globalization of research, open innova-tion and the increasing use of supercomputers. Global corporations perform research in different countries scattered across the globe. For example, Dow Chemical, the largest U.S. chemical maker, has research facilities in the U.S., China, India, Saudi Arabia and other countries. Global corporations often have shared research projects performed at facilities thousand of miles apart. Data sharing required by open-innovation projects performed at two or more organizations requires sharing data and reports.2 U.S. federal laboratories license technology to the private sector. These and other activities contribute to the increasing volume of scientific and engineering data moving over the Internet.
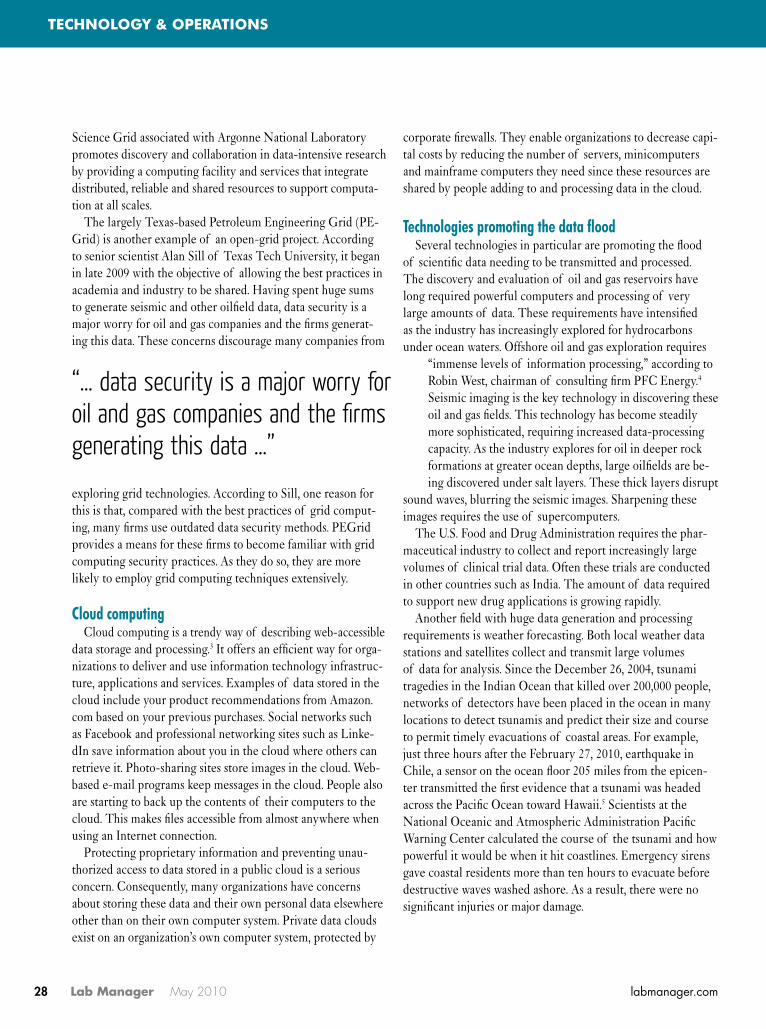
IBM Roadrunner Supercomputer. PHOTOGRAPH COURTESY OF LOS ALAMOS NATIONAL LABORATORY.
Supercomputers enable the creation and processing of large volumes of data. Supercomputing resources available on the Internet are located at http://userpages.umbc.edu/~jack/supercomputer-resources.html. The federal government’s national laboratories, including Oak Ridge National Laboratory and Sandia National Labora-tory, are the home of supercomputers that can perform astonishing numbers of calculations at amazing speed. For example, Oak Ridge’s Jaguar, a Cray supercomputer, often achieves sustained performance of over a pentaflop (a quadrillion mathematical calculations per second).
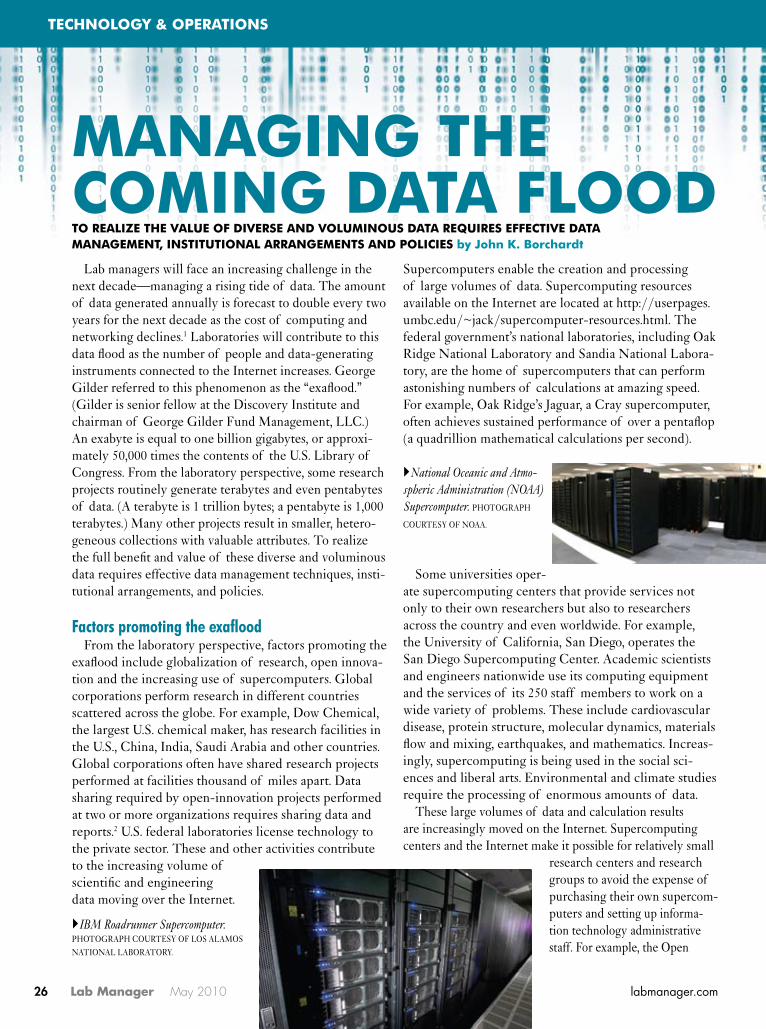
National Oceanic and Atmo-spheric Administration (NOAA) Supercomputer. PHOTOGRAPH
COURTESY OF NOAA.
Some universities oper-ate supercomputing centers that provide services not only to their own researchers but also to researchers across the country and even worldwide. For example, the University of California, San Diego, operates the San Diego Supercomputing Center. Academic scientists and engineers nationwide use its computing equipment and the services of its 250 staff members to work on a wide variety of problems. These include cardiovascular disease, protein structure, molecular dynamics, materials flow and mixing, earthquakes, and mathematics. Increas-ingly, supercomputing is being used in the social sci-ences and liberal arts. Environmental and climate studies require the processing of enormous amounts of data.
These large volumes of data and calculation results are increasingly moved on the Internet. Supercomputing centers and the Internet make it possible for relatively small
research centers and research groups to avoid the expense of purchasing their own supercom-puters and setting up informa-tion technology administrative staff. For example, the Open
Managing the CoMing data fLood
teChnoLogy & oPeRationS
to ReaLize the vaLue of diveRSe and voLuMinouS data RequiReS effeCtive data ManageMent, inStitutionaL aRRangeMentS and PoLiCieS by John k. Borchardt

Turn on the Power of OurElectronic Lab Notebook
INFORMATION-DRIVEN R&D
Explore the power of Symyx Notebook at www.symyx.com/notebook6
28 Lab Manager May 2010 labmanager.com
Science Grid associated with Argonne National Laboratory promotes discovery and collaboration in data-intensive research by providing a computing facility and services that integrate distributed, reliable and shared resources to support computa-tion at all scales.
The largely Texas-based Petroleum Engineering Grid (PE-Grid) is another example of an open-grid project. According to senior scientist Alan Sill of Texas Tech University, it began in late 2009 with the objective of allowing the best practices in academia and industry to be shared. Having spent huge sums to generate seismic and other oilfield data, data security is a major worry for oil and gas companies and the firms generat-ing this data. These concerns discourage many companies from
exploring grid technologies. According to Sill, one reason for this is that, compared with the best practices of grid comput-ing, many firms use outdated data security methods. PEGrid provides a means for these firms to become familiar with grid computing security practices. As they do so, they are more likely to employ grid computing techniques extensively.
Cloud computingCloud computing is a trendy way of describing web-accessible
data storage and processing.3 It offers an efficient way for orga-nizations to deliver and use information technology infrastruc-ture, applications and services. Examples of data stored in the cloud include your product recommendations from Amazon.com based on your previous purchases. Social networks such as Facebook and professional networking sites such as Linke-dIn save information about you in the cloud where others can retrieve it. Photo-sharing sites store images in the cloud. Web-based e-mail programs keep messages in the cloud. People also are starting to back up the contents of their computers to the cloud. This makes files accessible from almost anywhere when using an Internet connection.
Protecting proprietary information and preventing unau-thorized access to data stored in a public cloud is a serious concern. Consequently, many organizations have concerns about storing these data and their own personal data elsewhere other than on their own computer system. Private data clouds exist on an organization’s own computer system, protected by
corporate firewalls. They enable organizations to decrease capi-tal costs by reducing the number of servers, minicomputers and mainframe computers they need since these resources are shared by people adding to and processing data in the cloud.
Technologies promoting the data floodSeveral technologies in particular are promoting the flood
of scientific data needing to be transmitted and processed. The discovery and evaluation of oil and gas reservoirs have long required powerful computers and processing of very large amounts of data. These requirements have intensified as the industry has increasingly explored for hydrocarbons under ocean waters. Offshore oil and gas exploration requires
“immense levels of information processing,” according to Robin West, chairman of consulting firm PFC Energy.4 Seismic imaging is the key technology in discovering these oil and gas fields. This technology has become steadily more sophisticated, requiring increased data-processing capacity. As the industry explores for oil in deeper rock formations at greater ocean depths, large oilfields are be-ing discovered under salt layers. These thick layers disrupt
sound waves, blurring the seismic images. Sharpening these images requires the use of supercomputers.
The U.S. Food and Drug Administration requires the phar-maceutical industry to collect and report increasingly large volumes of clinical trial data. Often these trials are conducted in other countries such as India. The amount of data required to support new drug applications is growing rapidly.
Another field with huge data generation and processing requirements is weather forecasting. Both local weather data stations and satellites collect and transmit large volumes of data for analysis. Since the December 26, 2004, tsunami tragedies in the Indian Ocean that killed over 200,000 people, networks of detectors have been placed in the ocean in many locations to detect tsunamis and predict their size and course to permit timely evacuations of coastal areas. For example, just three hours after the February 27, 2010, earthquake in Chile, a sensor on the ocean floor 205 miles from the epicen-ter transmitted the first evidence that a tsunami was headed across the Pacific Ocean toward Hawaii.5 Scientists at the National Oceanic and Atmospheric Administration Pacific Warning Center calculated the course of the tsunami and how powerful it would be when it hit coastlines. Emergency sirens gave coastal residents more than ten hours to evacuate before destructive waves washed ashore. As a result, there were no significant injuries or major damage.
teChnoLogy & oPeRationS TECHNOLOGY & OPERATIONS
“… data security is a major worry for oil and gas companies and the firms generating this data …”

29 May 2010 Lab Manager
Speaking at the AAAS annual meeting, Hal Varian, on the faculty at the University of California, Berkeley, and chief economist for Google, Inc., described a new data analysis tool called Google Insight for Search. It permits the correlation and prediction of data with the number and distribution of individual Google searches. For example, by mining past data on Google searches for information on Toyota automobiles and correlating them with Toyota sales, Varian was able to predict current sales volume with a reasonable amount of accuracy before industry sales data was released.
Sciences Virtually all fields of science are increasingly performed by
researchers scattered over the globe who both generate and process increasing amounts of numeric and image data. For ex-ample, “metagenomics” is a relatively new field of research that uses the latest developments in DNA sequencing technologies to study genetic material recovered directly from environ-mental samples. The vast majority of life on earth is micro-bial. Previously, most research on microbes depended on the preparation of laboratory cultures. However, since 99 percent of microbes cannot be cultured, it is only recently that modern genetic sequencing techniques have allowed determination of the hundreds to thousands of microbial species present at any given environmental location.
The amount of data defining the metagenomics of these microbial ecologies is growing exponentially as researchers ac-quire next-generation sequencing devices, said Larry Smarr of the University of California, San Diego, who spoke at the 2010 annual AAAS meeting. As an example, he cited Community Cyberinfrastructure for Advanced Marine Microbial Ecology Research and Analysis (CAMERA), funded by the Gordon and Betty Moore Foundation. Its data repository at the University of California, San Diego, presently contains over 500 microbial metagenomics datasets plus the full genomes of approximately 166 marine microbes. Over 3,000 registered end users from 70 countries can access existing data and contribute new metag-enomics data via the Internet.
The increasing number of scientific research space probes launched by NASA and other countries requires both super-computer power and transmission around the globe for data analysis and study. Climate studies require supercomputing power to perform the complex simulations required to study global warming and other phenomena.
According to Les Cottrell, director of computer services for the Stanford Linear Accelerator Center (SLAC), high-energy physics has become a global enterprise, with data needing to be available to many sites around the world for analysis. SLAC
and other facilities are generating huge amounts of data that must be transmitted over great distances. Data is flowing into, as well at out of, the United States. For example, CERN’s Large Hadron Collider in Switzerland is providing enormous amounts of data to U.S. researchers.6
Challenges and opportunitiesThere are several unresolved issues facing lab managers.
How can research organizations ensure that data are properly archived and made available to all the researchers who might find them useful? How can the origin and accuracy of data be ensured and properly documented? What new approaches are needed to ensure that the preservation and access to data of great scientific and social value is a priority?
Despite Greer’s concern and the challenges raised in the opening paragraph of this article, symposium attendees were excited about the new possibilities for R&D offered by the ex-aflood. They felt that laboratories would surf the flood of data rather than be overwhelmed by it.
References1. B. Swanson and G. Gilder, “Estimating the Exaflood: The
Impact of Video and Rich Media on the Internet—‘A Zeta-byte’ of Data by 2015?” Discovery Institute Report (January 29, 2008), http://www.discovery.org/a/4428.
2. J.K. Borchardt, “Open Innovation Becoming Key to R&D Success,” Lab Manager Magazine (January 31, 2008), www.labmanager.com/articles.asp?ID=28.
3. K. Boehret, “Get Your Storage out of the Cloud,” Wall Street Journal (March 1, 2010) http://online.wsj.com/article/SB40001424052748704188104575083533949634468.html.
4. B. Casselman and G. Chazan, “Cramped on Land, Big Oil Bets at Sea,” Wall Street Journal (January 7, 2010), http://online.wsj.com/article/SB126264987791815617.html?mod=WSJ_hps_LEFTWhatsNews.
5. D. Leinwand, “Tsunami Alerts Help Save Lives,” USA Today (March 1, 2010), http://www.usatoday.com/tech/science/2010-03-01-tsunami-alerts_N.htm.
6. K. Dean, “Data Flood Speeds Need for Speed,” Wired (February 13, 2003), http://www.wired.com/techbiz/it/news/2003/02/57625.
Dr. John K. Borchardt is a consultant and technical writer. The author of the book Career Management for Scientists and Engi-neers, he often writes on career-related subjects. He can be reached at [email protected].
TECHNOLOGY & OPERATIONS

30 Lab Manager May 2010 labmanager.com
Today’s industrial, scientific research and production laboratories all have a common goal—to maintain a high rate of throughput, which can be measured in a number of ways. Most of these labs are highly automated, and in many cases standard systems, instruments and proce-dures are codified to meet stringent guidelines mandated by the industry and internal to the organization. This common goal drives investing in the new instruments, automated laboratory systems and techniques that lab managers are constantly seeking.
Labs that make a product or test samples run a constant cycle of lab instrument up-grades in order to maintain a high level of productivity and throughput. The logic driving the decision to update a mass spectrometer, for example, is typically based on an expo-nential increase in the number of tests that can be performed by the up-to-date instru-ment. In addition to keeping throughput at peak levels, today’s lab manager is also faced with the challenge of leaving a smaller carbon foot-print in terms of the resources a lab uses. The resources that probably come to mind are costly reagents and other essential materials required to perform these tests.
When we look at this “greener lab,” we can look at a number of layers. In the 1980s those developing com-puter networks adopted the Open System Interconnec-tion Reference Model (OSI model) to ensure that all hardware, software and internetworking elements shared common communications, hardware and other protocols so that everything could connect and operate as a single system. If, for example, we use this model to look at a lab and all the elements that give a mass spectrometer the materials it needs to perform its tests, AC power quality and reliability will be at the bottom layer of the resourc-es being acquired.
Many laboratories use a smaller UPS system at each instrument—a line-interactive, or “switching,” Smart-UPS for equipment using less than 3kVA or 2100W, mostly due to a lower cost. This approach has several advantages and a few drawbacks in terms of leaving a smaller carbon footprint.
In the June 2009 issue of Lab Manager Magazine, author Michael Stout discussed the impact of power problems affecting the precise operation of labs by focusing on a common issue that most lab managers face when they deploy one of these smaller, computer-grade
line-interactive UPS, to combat the effects of the dirty, unregu-lated AC power found in most laboratories.
The device more suited for laboratory equipment, from the perspective of output power regulation and power backup time required, is clearly one that regulates AC power continuous-ly—an online UPS. This better UPS will transfer seamlessly without switchover time and deliver the same clean sine-wave power to the instrument when
the power drops out.In addition, in endeavoring to create a greener labora-
tory, the primary impact any UPS has on the environ-ment in terms of maintenance is the battery replacement cycle. The line-interactive, Smart-UPS carbon footprint is significantly higher due to its very design.
Battery overviewAt the heart of every UPS you will find a battery, and
due to the large number of smaller UPS units typically used in laboratories of all stripes and sizes, the cost of ownership may be much higher when this element is factored into the equation. Typically the referenced UPS topologies use valve-regulated sealed lead-acid (VRLA) batteries, as they provide the highest power density at the
gReeninguPS
teChnoLogy & oPeRationS
when it CoMeS to deteRMining the enviRonMentaL footPRint of a uPS SySteM, faCtoR in the BatteRy by Ron Seredian
TECHNOLOGY & OPERATIONS
“… when UPS maintenance is viewed from the perspective of overall impact on the en-vironment, the resources re-quired to recycle batteries are significant.”

lowest cost. Until recent developments in technology, the five-year-rated VRLA battery used in a UPS typically had a four- to five-year service life if maintained in a 77°F (25°C) environ-ment and properly charged.
In addition to not maintaining the battery at the proper charge, the VRLA battery’s service life can be shortened further by high tempera-tures and too-frequent discharge and recharge cycles. Line-interactive UPS models can switch to battery mode too often if installed where utility voltage regulation is poor. This is not the case with double conversion online UPS models, as they draw power from the battery only when the utility voltage is extremely low or lost completely. As the online UPS typi-cally costs more to make, the battery chargers often are better designed and better at maintaining the battery’s
Trickle (or Float) Service Life
Serv
ice Li
fe (Ye
ars)
Temperature (˚C)
Charging Voltage2.275 V/Cell
1 Charging Voltage2.275 V/Cell
1
108
65
3
2
1
0.5
20 25 30 40 50
Cycles Service Life
Capa
city (
%)
Number of Cycles (Times)
DischargeDepth 100%
DischargeDepth 50%
DischargeDepth 30%
Ambient Temperature25˚C (77˚F)
DischargeDepth 100%
DischargeDepth 50%
DischargeDepth 30%
Ambient Temperature25˚C (77˚F)
120
100
80
60
40
20
0200 400 600 800 1000 1200
Cycles Service Life
Capa
city (
%)
Number of Cycles (Times)
DischargeDepth 100%
DischargeDepth 50%
DischargeDepth 30%
Ambient Temperature25˚C (77˚F)
DischargeDepth 100%
DischargeDepth 50%
DischargeDepth 30%
Ambient Temperature25˚C (77˚F)
120
100
80
60
40
20
0200 400 600 800 1000 1200
Trickle (or Float) Service Life
Servi
ce Li
fe (Ye
ars)
Temperature (˚C)
Charging Voltage2.275 V/Cell
1
14
12
10
8
5
21
20 25 30 40 50
Five-Year–Rated Batteries Twelve-Year–Rated Batteries
TECHNOLOGY & OPERATIONS
It’s about products that don’t end up in land lls.
With a factory rated machine life of 15,000 operating hours, Miele laboratory glassware washers last and last and last. Plus...90% of the machine is recyclable.
Call for a free quote and ask about our sustainability and service.
� 800.991.9380� [email protected]
labwasher.com
Green is not just about saving energy and water.
Laboratory Manager. 8.25 x 5.625 Horizontal.indd 1 4/7/2010 12:31:51 PM

charge, resulting in a longer service life.Though the VRLA battery’s design has changed little
in the last several years, a new VRLA battery is rated to last up to 12 years. Similar to a standard five-year-rated VRLA battery, these batteries will last their rated life when operated at room temperature and used in “stand-by service” mode, as described in the previous paragraph. In simple terms, these new batteries have a higher lead content, as well as a larger internal surface area. The result is slower overall degradation of the chemicals and internal components.
The charts outline the effect of higher temperatures on battery life. Though most labs are temperature-con-trolled, these charts show how drastically battery life is reduced at higher operating temperatures.
Lab managers who install a line-interactive Smart-UPS enjoy an overall lower cost up front. However, the total cost of ownership shows a very different picture. The typical life of a standard battery in a line-interac-tive device is two to two and a half years, so over a 10-year period the user will experience three to four battery
replacement cycles. This ends up costing the lab user more because of the need to buy and replace batteries. Also, this cost increases exponentially as the size of the UPS increases, since larger models use more batteries. Another factor that will drive this cost higher is a run-time of 20 or 30 minutes that draws on reserve battery power, which typically requires a UPS with an additional external battery pack.
When UPS maintenance is viewed from the perspec-tive of overall impact on the environment, the resources required to recycle batteries are significant, both from a recycling viewpoint as well as the number of times a battery needs to be changed out. From the time re-placement batteries are ordered, the energy required to deliver new and return old, heavy lead-acid batteries has an impact on the environment. Recycling requires the battery manufacturer to use resources when taking old batteries, recharging their chemicals, reconditioning metal and making other efforts to repackage batteries. The impact on resources such as water and energy must be taken into consideration.
A UPS that leaves a smaller footprint Recent snowstorms and correspond-
ing power outages may have caught your lab without an adequate power protec-tion “parachute” in place. In many cases lab managers who use the ubiquitous line-interactive Smart-UPS device find that it costs a lot to maintain. Many lab users give up on maintaining the device, but this is not recommended, as the batteries can swell and even leak gas if not replaced. However, an online UPS that uses internal batteries if—and only if—there is a power outage gives users a much longer battery replacement cycle. A new 12-year-rated battery will have a much smaller carbon footprint but, equally important, it will be ready to supply clean power when your instru-ment and other automated test equip-ment are exposed to utility power.
Ron Seredian can be reached at [email protected] or by phone at 800-842-6940 x105.
teChnoLogy & oPeRationS
Trademarks are owned by Mallinckrodt Baker, Inc.
The most powerful word in laboratory performance? in laboratory performance?
Quality
U LT R A P U R E B I O R E A G E N T S
Start reaching your own performance potential. To order a new catalog or download product information,visit www.mallbaker.com/lab5

think forward FT-IR
www.bruker.com/ftir
ALPHA is a compact FT-IR spectrometer that will play a big part in your daily routine. Plug & play set-up, easy-to-use software, combined with a wide variety of QuickSnapTM accessory modules assure powerful and reliable FT-IR analysis you expect from Bruker.
ALPHA FT-IR Spectrometer with QuickSnap™ Accessory Modules

34 Lab Manager May 2010 labmanager.com
Each day, scientists have the oppor-tunity to use their talents and work ethic to change the world in which we all live. Through the application of scientific principles to research ef-forts in human health, environmental and energy issues, product develop-ment, and other disciplines, scientists have the greatest opportunity to pos-itively impact society and their fellow humans in a myriad of ways.
Whether by training and education or by moving up through the ranks of their respective organizations, fortu-nate research professionals make their way into fields that offer meaningful work and the opportunity to use their skills to contribute to society. In addi-tion to good fortune however, there is one important talent that researchers and managers need to achieve success in their respective careers. That talent is the ability to network.
Through the fine art of networking, science professionals are able to reach their full potential within their fields
of work. Whether they are seeking employment in industrial laboratories, university research facilities or world-class government research centers, networking offers a powerful tool.
By continuously meeting new peo-ple and increasing their professional contacts in the scientific industry, sci-entists can learn about new opportu-nities within their fields. At the same time, some individuals might want to
consider positions outside of their current career fields.
By practicing the following four characteristics of successful net-workers throughout their careers, many science professionals may be well-prepared to not only positively impact the world around them, but also obtain exciting research and em-ployment opportunities.
Maintain an open mindAs scientists meet and interact with professionals who work in all types of industries, they may choose to develop
relationships with them. By treating each contact equally, whether or not the person is a scientist, science profession-als may be pleasantly surprised by the opportunities they are able to uncover.
The most successful networkers in the world typically have two common characteristics—an open mind and the desire to meet people within all professions. Experienced networkers know that career op-portunities arise when they least ex-pect them. By maintaining an open mind, many scientists may be able to pursue such opportunities once they are available.
Carefully consider new career opportunities Experienced networkers can learn about new positions that are not pub-licly posted. With a broad base of professional contacts, they may gain access to a variety of meaningful po-sitions and use their education, skill sets, and natural talents to positively impact the scientific industry, as well as cultures outside of their own. Some new positions can lead to higher pay and exposure to new contacts, while allowing scientists to develop new skills that will be invaluable through-out the rest of their careers.
In the past, many scientists may have turned away from new career opportu-
SCIENCE MATTERS LATEST TRENDS SHAPING THE SCIENTIFIC WORKFORCE By Diane Barker
THE FOUR CHARACTERISTICS OF SUCCESSFUL NETWORKERS
“The most successful networkers… have two common characteristics—an open mind and the desire to meet people within all professions.”

nities simply because they were afraid to take risks, fearing that the consequences of failure may outweigh the positives of success. In today’s workplace, many em-ployees are responsible for their own ca-reers. As such, some employees are tak-ing “risks” in order to attain progress.
Listen to contacts and then fol-low up with themAs scientists meet new contacts, they typically want to ask them a lot of questions. While it is important to communicate with new contacts in an efficient manner, science profes-sionals should listen to them as well, rather than bombard them with doz-ens of questions.
New contacts will feel more comfort-able conversing and networking with their fellow scientists if they are able to tell their stories first, without being interrupted. Out of cour-tesy, scientists should always listen first. They will likely receive more information by listening, rather than by con-tinuously asking questions.
Once scientists have initi-ated new relationships, they should follow up. Through continuous follow-up with professional contacts at lunches, banquets and vari-ous events, scientists will appear to be interested in not only discovering new career opportunities, but also in learning more about science in general.
Develop lifelong connectionsMany scientists acquire a variety of networking contacts, yet fail to remain in touch with them for long periods of time. In order to net-work properly, science profession-als should talk to their contacts not
only for a few months or a couple of years, but for an extended period of time. Efficient networking requires years of connections that may lead to lifelong relationships, as well as new career opportunities.
By remaining open minded, carefully considering different career oppor-tunities, listening to and following up with contacts, and maintaining lifelong connections, scientists can be successful networkers throughout their careers and lives. While meet-ing new contacts, science profession-als may encounter a variety of op-
portunities to positively impact the world and fully develop their talents and skill sets. Simply put, networking will help scientists perform to the best of their abilities in order to achieve goals they previously thought were unattainable.
Diane Barker is the director of Kelly Ser-vices’ Americas Products Group – Science. Kelly Services, Inc., a leader in providing workforce solutions, is headquartered in Troy, Michigan. For more information, visit www.kellyservices.com. Diane can also be followed on LinkedIn at http://www.linke-din.com/pub/diane-barker/0/631/499.
“Experienced networkers can learn about new positions that are not publicly posted.”
“Efficient networking requires years of connections that may lead to lifelong relation-ships as well as new career opportunities.”
ProRaman Series: PPM Sensitivity at Low Cost
Enwave Optronics, Inc. 18200 McDurmott Street, Suite B Irvine CA. 92614
MADE in USA Tel: 949-955-0258
[email protected] www.enwaveopt.com
� Semiconductor � Gas Analysis � Pharmaceuticals � Petrochemical � Gemology/Mineralogy � Forensics � Paper & Pulp
Real Solution for Your Applications
RAMAN TOOL AT ITS BEST

ASK THE EXPERTHOW TO OVERCOME CHALLENGES WITH MASS SPECTROMETRY by Tanuja Koppal, Ph.D.
Q: Are there many differences between the mass spectrometry and proteomics
core labs that you oversee?
A: There is a significant difference between the two, although they both use only
mass spectrometers. The small molecule MS core is run as an open-access instrument facility, while the proteomics core is not. Proteomics involves a relatively sophisticated and technically challenging series of measurements, and casual users like graduate students don’t necessarily gain the skills to use the instruments efficiently. Hence, it is operated as a closed-access facility where users prepare samples in their own lab and we process the samples, perform the analysis and then share the results with the investigator. The two labs also differ significantly in terms of their MS capabilities. In the small molecule core we depend mainly on triple quadrupoles and ion trap MS instruments and have limited access to high
resolution MS. We also use only conventional HPLC and do not use nano-flow HPLC. However, in the proteomics core we exclusively use nano-flow HPLC and the primary workhorse there is Thermo Scientific’s LTQ ion trap and Orbitrap instruments. We also have a MALDI-TOF-TOF instrument. Nano-flow HPLC is quite tricky and again, casual users lack the expertise to use the demanding microfluidics that is involved and to detect problems. They are welcome to do limited proteomics in the small molecule core but femto or attomole level detection of proteomic samples must be done in the proteomics core.
Q: Are there different sets of challenges due to the different instruments and
applications being pursued in the two labs?
A: Absolutely. In the small molecule core we work mainly with graduate students
and post-doctoral fellows who often do not have a lot of technical experience working with mass spectrometers and hence, they don’t work very efficiently. We do have a training program to bring them up to speed in terms of what is required to run the instrument and to optimize for a particular assay and we later also help them interpret their results. The downside is that we face more wear and tear on the instruments and they need to be cleaned more frequently, since students often tend to be less critical of sample preparation. Students also don’t immediately recognize when there is a problem and hence
they are less efficient. But I accept that as a part of the training mission at the University.
Q: What does your in-house training cover?
A: Training courses are given approximately once a month, as well as on an ad hoc
basis, as new students come in. The first half of each course consists of two to three hours of lectures covering both theory and operation. The second half is a hands-on tutorial covering instrument setup, operation and shutdown. The facility personnel then work with the user on a one-on-one basis to cover their specific experiment and application. We also review the data with them during the early stages so the user can learn to interpret it correctly. We have two or three people available every day to help out if any problems arise. We are open from eight AM to six PM and during late evenings and weekends we provide access to users, but only those who are technically proficient. Only in certain cases, when we don’t have the time or the technical expertise, we recommend that the user go to a vendor to get trained on a specific class of instruments.
Q: Any advice in terms of selection of instruments or vendors?
A: We have standardized based on a single vendor in order to have a single software
platform. The students struggle a bit if the software systems are not user-friendly and tend to get
David Hachey, Ph.D., talks to Tanuja Koppal, contributing editor to Lab Manager Magazine, about his role and responsibilities as the director of both the mass spectrometry (MS) and proteomics core laboratories at Vanderbilt University. He elaborates on how the two facilities are run and the types of services they provide. He also offers valuable insights into the common challenges users are faced with when using mass spectrometers and in running an open-access core facility.
‹‹ eXPeRt: dr. david hachey
aSk the eXPeRt
36 Lab Manager May 2010 labmanager.com

confused if they have to move across instruments using different operating systems. We have done the same for the proteomics core in order to build a continuous workflow from sample prep to the bioinformatics analysis and found it much simpler to have a single data file structure to work with. If you have the luxury to work with a single vendor then life is definitely easier for you. We also have no service contracts on any of the instruments. We have our own in-house engineer, so we do our own servicing and routine maintenance. We have had good success with Thermo Scientific and I am sure the other vendors are equally qualified. They walk you through the diagnosis of a problem without charge, which is quite a cost savings.
Q: What are some of the common problems you encounter?
A: The big one is, “I can’t see my molecule!” Well, how do you know it is present in the
sample? Have you run a calibration curve with standards and blanks? There are a number of standard protocols you use in diagnosing a problem. Sometimes it’s an instrument problem. For instance, the heated capillary in the ion source becomes clogged
and has to be cleaned or the HPLC columns go bad. Sometimes the user cannot recognize the problem and we have to go through the experiment step-by-step to determine what is going wrong.
Q: How has the field evolved in the last decade?
A: When I joined Vanderbilt in 1998 the main emphasis was on gas
chromatography/mass spectrometry (GC-MS) measurements of small molecules and that was 65 to 70 percent of the workload. The other 25 percent was liquid chromatography-MS (LC-MS) and about 10 percent was matrix-assisted laser desorption/ionization (MALDI). Today, probably 85 percent of our work depends on LC-MS. The main advantage to using LC-MS is that it has solved a lot of problems with sample prep and is less demanding than GC-MS. We
now have a total of 10 mass spectrometers in the small molecule core lab—four triple quadrupoles, three ion trap instruments, one MALDI, one GC-MS and one high resolution Q-TOF (time-of-flight). So if I were to set up a lab today I would probably get a triple quadrupole or an ion trap, a high resolution instrument like a Q-TOF or Orbitrap and finally a GC-MS. But then again, this depends very much on the user base. Our work is mostly quantitative and in the biomedical area, which is reflected in our choice of instruments.
Q: How have your own responsibilities evolved over the years?
A: Initially the biggest challenge was changing the culture at Vanderbilt. We
wanted to make the core an open-access facility and we realized that in order to do so we needed a training program in place. Over the past 10 to 12 years we have trained nearly 600 to 700 people and the expertise has now been disseminated into individual laboratories. These investigators are now taking on more responsibility for training incoming students in their lab in the various techniques. So we have been fairly successful on that front. The challenge we now face is to keep our extensive operations funded with a mix of funding from individual investigators, center grants, and from the University.
aSk the eXPeRt
David L. Hachey, Ph.D., is the professor of Chemistry, Biochemistry and Pharmacology at Vanderbilt University in Nashville, Tennessee. He has been the director of the mass spectrometry core laboratory at Vanderbilt since 1998 and in 2007 he assumed the responsibility as director of proteomics core as well. The service labs provide instrumentation and analytical expertise to Vanderbilt’s research community. They also offer an active MS training program to teach new users how to design experiments, do the sample preparation, operate the instrument and interpret the results. The MS core lab is used by about 175 investigators each year from ~75 research groups at the University. As the director, Dr. Hachey is responsible for establishing policies and procedures for the equitable use and maintenance of the facility, preparing grants for obtaining funds to support the facility and in assisting the development of new analytical methods.
0
10
20
30
40
50
60
70
Perc
ent
Quad
rupole
Mag.
Secto
r
Ion Tr
ap TOF
Quad
rupole
Mag.
Secto
r
Ion Tr
ap TOF
qq TO
F
TSQ
Quad
. ICP/
MS
MALD
I
FTICR
Instrument Types in Use
GC/MS LC/MS Other
Industry University Government
Source: Data collected from a survey of mass spectrometry service facilities conducted in 2000.
37 May 2010 Lab Manager
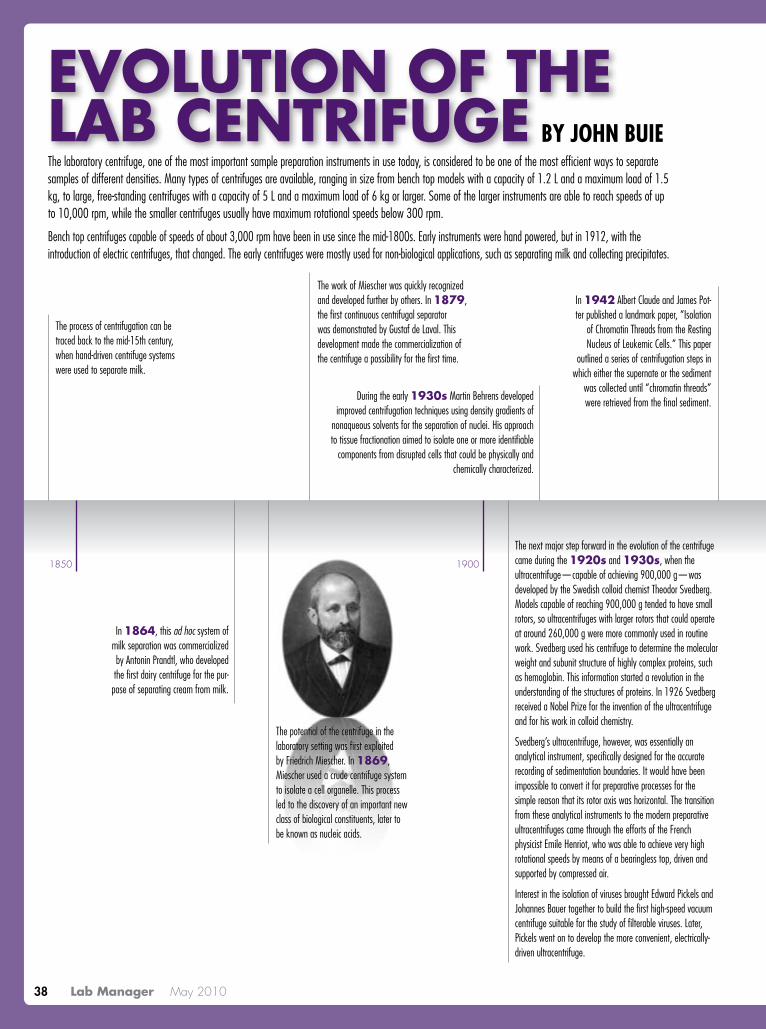
labmanager.com
EVOLUTION OF THE LAB CENTRIFUGE BY JOHN BUIEThe laboratory centrifuge, one of the most important sample preparation instruments in use today, is considered to be one of the most efficient ways to separate samples of different densities. Many types of centrifuges are available, ranging in size from bench top models with a capacity of 1.2 L and a maximum load of 1.5 kg, to large, free-standing centrifuges with a capacity of 5 L and a maximum load of 6 kg or larger. Some of the larger instruments are able to reach speeds of up to 10,000 rpm, while the smaller centrifuges usually have maximum rotational speeds below 300 rpm.
Bench top centrifuges capable of speeds of about 3,000 rpm have been in use since the mid-1800s. Early instruments were hand powered, but in 1912, with the introduction of electric centrifuges, that changed. The early centrifuges were mostly used for non-biological applications, such as separating milk and collecting precipitates.
The process of centrifugation can be traced back to the mid-15th century, when hand-driven centrifuge systems were used to separate milk.
In 1864, this ad hoc system of milk separation was commercialized by Antonin Prandtl, who developed the first dairy centrifuge for the pur-pose of separating cream from milk.
The work of Miescher was quickly recognized and developed further by others. In 1879, the first continuous centrifugal separator was demonstrated by Gustaf de Laval. This development made the commercialization of the centrifuge a possibility for the first time.
In 1942 Albert Claude and James Pot-ter published a landmark paper, “Isolation
of Chromatin Threads from the Resting Nucleus of Leukemic Cells.” This paper
outlined a series of centrifugation steps in which either the supernate or the sediment
was collected until “chromatin threads” were retrieved from the final sediment.During the early 1930s Martin Behrens developed
improved centrifugation techniques using density gradients of nonaqueous solvents for the separation of nuclei. His approach to tissue fractionation aimed to isolate one or more identifiable
components from disrupted cells that could be physically and chemically characterized.
The next major step forward in the evolution of the centrifuge came during the 1920s and 1930s, when the ultracentrifuge—capable of achieving 900,000 g—was developed by the Swedish colloid chemist Theodor Svedberg. Models capable of reaching 900,000 g tended to have small rotors, so ultracentrifuges with larger rotors that could operate at around 260,000 g were more commonly used in routine work. Svedberg used his centrifuge to determine the molecular weight and subunit structure of highly complex proteins, such as hemoglobin. This information started a revolution in the understanding of the structures of proteins. In 1926 Svedberg received a Nobel Prize for the invention of the ultracentrifuge and for his work in colloid chemistry.
Svedberg’s ultracentrifuge, however, was essentially an analytical instrument, specifically designed for the accurate recording of sedimentation boundaries. It would have been impossible to convert it for preparative processes for the simple reason that its rotor axis was horizontal. The transition from these analytical instruments to the modern preparative ultracentrifuges came through the efforts of the French physicist Emile Henriot, who was able to achieve very high rotational speeds by means of a bearingless top, driven and supported by compressed air.
Interest in the isolation of viruses brought Edward Pickels and Johannes Bauer together to build the first high-speed vacuum centrifuge suitable for the study of filterable viruses. Later, Pickels went on to develop the more convenient, electrically-driven ultracentrifuge.
The potential of the centrifuge in the laboratory setting was first exploited by Friedrich Miescher. In 1869, Miescher used a crude centrifuge system to isolate a cell organelle. This process led to the discovery of an important new class of biological constituents, later to be known as nucleic acids.
1850 1900
38 Lab Manager May 2010
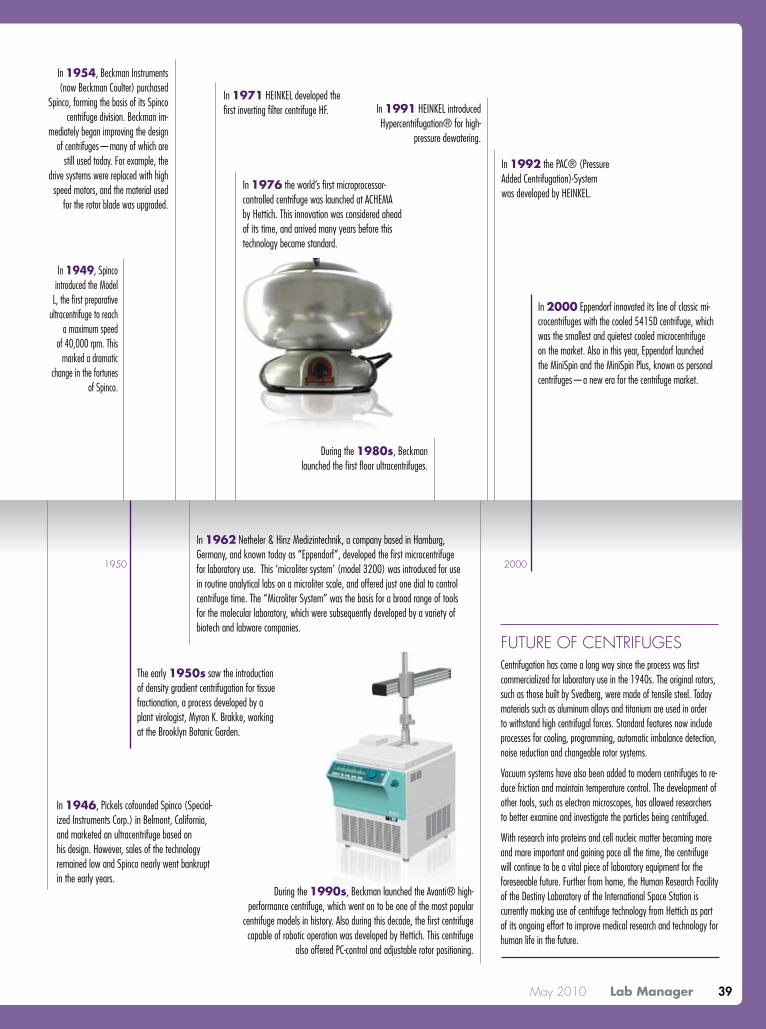
In 1946, Pickels cofounded Spinco (Special-ized Instruments Corp.) in Belmont, California, and marketed an ultracentrifuge based on his design. However, sales of the technology remained low and Spinco nearly went bankrupt in the early years.
In 1971 HEINKEL developed the first inverting filter centrifuge HF.
In 1976 the world’s first microprocessor-controlled centrifuge was launched at ACHEMA by Hettich. This innovation was considered ahead of its time, and arrived many years before this technology became standard.
In 1991 HEINKEL introduced Hypercentrifugation® for high-
pressure dewatering.
In 1992 the PAC® (Pressure Added Centrifugation)-System was developed by HEINKEL.
In 2000 Eppendorf innovated its line of classic mi-crocentrifuges with the cooled 5415D centrifuge, which was the smallest and quietest cooled microcentrifuge on the market. Also in this year, Eppendorf launched the MiniSpin and the MiniSpin Plus, known as personal centrifuges—a new era for the centrifuge market.
Future oF centriFugesCentrifugation has come a long way since the process was first commercialized for laboratory use in the 1940s. The original rotors, such as those built by Svedberg, were made of tensile steel. Today materials such as aluminum alloys and titanium are used in order to withstand high centrifugal forces. Standard features now include processes for cooling, programming, automatic imbalance detection, noise reduction and changeable rotor systems.
Vacuum systems have also been added to modern centrifuges to re-duce friction and maintain temperature control. The development of other tools, such as electron microscopes, has allowed researchers to better examine and investigate the particles being centrifuged.
With research into proteins and cell nucleic matter becoming more and more important and gaining pace all the time, the centrifuge will continue to be a vital piece of laboratory equipment for the foreseeable future. Further from home, the Human Research Facility of the Destiny Laboratory of the International Space Station is currently making use of centrifuge technology from Hettich as part of its ongoing effort to improve medical research and technology for human life in the future.
In 1954, Beckman Instruments (now Beckman Coulter) purchased
Spinco, forming the basis of its Spinco centrifuge division. Beckman im-
mediately began improving the design of centrifuges—many of which are
still used today. For example, the drive systems were replaced with high
speed motors, and the material used for the rotor blade was upgraded.
In 1949, Spinco introduced the Model
L, the first preparative ultracentrifuge to reach
a maximum speed of 40,000 rpm. This
marked a dramatic change in the fortunes
of Spinco.
The early 1950s saw the introduction of density gradient centrifugation for tissue fractionation, a process developed by a plant virologist, Myron K. Brakke, working at the Brooklyn Botanic Garden.
1950 2000
During the 1980s, Beckman launched the first floor ultracentrifuges.
In 1962 Netheler & Hinz Medizintechnik, a company based in Hamburg, Germany, and known today as “Eppendorf”, developed the first microcentrifuge for laboratory use. This ‘microliter system’ (model 3200) was introduced for use in routine analytical labs on a microliter scale, and offered just one dial to control centrifuge time. The “Microliter System” was the basis for a broad range of tools for the molecular laboratory, which were subsequently developed by a variety of biotech and labware companies.
During the 1990s, Beckman launched the Avanti® high-performance centrifuge, which went on to be one of the most popular
centrifuge models in history. Also during this decade, the first centrifuge capable of robotic operation was developed by Hettich. This centrifuge
also offered PC-control and adjustable rotor positioning.
39 May 2010 Lab Manager
40 Lab Manager May 2010 labmanager.com
PRoduCt foCuS: aa SPeCtRoSCoPy
Atomic absorption (AA) has been known since the 19th century, but it was not un-til the 1950s, thanks to efforts by Alan Walsh at Australia’s CSIRO research center, that use of AA spectrometers became routine for metals analysis.
A true Beer’s law absorbance tech-nique, AA measures ultraviolet light absorbed by hot, atomized metals. The absorbance wavelength is unique to every metal, but the signal intensity varies by concentration. Instrumenta-tion is straightforward, consisting of a light source, atomizer and detector. Atomizers are traditionally high-tem-perature flames, but graphite furnaces and various plasma sources are also used. Light sources include hollow
cathode lamps (most common) and diode lasers. Detectors are most usu-ally photomultiplier tubes.
AA handles many sample types, but operation requires that metal analytes exist as freestanding atoms in the gas state, rather than as ions in solution or solid metals or salts. Solution samples must first be dried, a process known as “desolvation,” before they are atom-ized and pumped with UV light.
AA could be considered for nearly any application that requires the identification and/or quantification of metals. For example:
•environmentalanalysis
•quality control for contaminant,ingredient, or trace metal in foods, drugs, personal care products, pa-per, materials, and other products
• forensics, archeology, mining, agriculture
•naturalscienceexperimentation
Interesting developments in AA include the introduction of the single xenon arc lamp, which permits a single light source or instrument to address all metals acces-sible by AA. Xenon lamps also provide up to ten times the sensitivity of con-
ventional AA. Similarly, the introduction of solid-state charge-coupled device detectors, improved background detec-tion, direct analysis of solids (without atomization), and the ability to detect nonmetals has extended the capabilities of modern AA spectrophotometers.
analyzer typesChuck Schneider, business unit manager for PerkinElmer’s (Shelton,
Conn.) inorganic analysis products, breaks AA instrumentation down into three categories: flame, graphite fur-nace, and dedicated analyzers. Perkin- Elmer further delineates these into entry-level systems and higher-end systems with more extensive automa-tion, software, data handling, and the ability to switch back and forth from flame to graphite furnace operation.
Graphite furnace AA spectrometers are significantly slower than flame-at-omizer instruments, but they provide several benefits. Because they concen-trate the cloud of atomized metals, graphite furnace instruments require less sample than flame AA spectropho-tometers—20 microliters vs. up to five milliliters. Sensitivity (ppb vs. ppm) is also higher in graphite furnace models.
On the business side, AA can be divid-ed into instruments serving developed countries and those in developing na-tions. “More so than other inorganic analytic techniques, AA is very much divided into the primary instrument, consumable sales into that market, and service,” Schneider explains. “There is a very large installed base of AA systems around the world, so the service component is quite large.” The Chinese drug regulatory agency, for example, has recently ordered one hundred PerkinElmer AA instru-ments, Schneider says.
SenSitive, quantitative MetaLS anaLySiSby angelo dePalma, Ph.d
“… graphite furnace instruments require less sample than flame AA spectrophotometers.”

41 May 2010 Lab Manager
Lab Manager Magazine supplier lists are generated from manufacturer lists posted on LabX. To include your company on this list, please contact assistant editor Katia Caporiccio at [email protected].
Yong Xie, product manager for AA in-struments at Aurora Biomed (Vancou-ver, B.C.), notes higher demand for AA in the environmental (particularly for heavy metal analysis) and biomedi-cal industries. The former is driven, he says, by government mandates to measure ever-smaller concentrations of metallic contaminants. AA is not typically thought of as a “life sci-ence” technique, but that is changing. Xie notes emerging applications in the pharmaceutical industry, particu-larly for measuring the function of potassium ion channels—physiologic structures in cells that allow ions to enter and leave—that are critical for cardiovascular health.
what customers look forPerkinElmer has recently completed a large survey of inorganic analysis customers and found that the top two factors entering into purchase deci-sions are customer service (includ-ing the salesperson’s knowledge and service support) and ease of use and setup for hardware and software. The
third factor is the vendor’s reputation. Price is “fifth or sixth on the list,” Mr. Schneider says. “AA has got to be dead simple to use, because instruments are used by a lot of different people who may not have specific training in the technique. Years ago a lab might have had five people operating six or seven instruments. The number of techniques has remained the same, but the number of analysts might be down to two. Lab workers need to be generalists.”
With more or less the same hardware technology accessible to all manufac-turers, Yong Xie believes that some vendors err in focusing on the hard-ware and automation alone and not
enough on the ease of use—a fac-tor noted in the PerkinElmer study. “The computer industry has made huge progress in both hardware and
software,” he says, as have advances in automation, autosampling, and unattended operation. Since these advances won’t help with detection limits or other fundamental perfor-mance factors, “they are best applied to enhancing the user experience, to provide the most convenient envi-ronment for operating the instrument and achieving desired objectives.”
Angelo DePalma holds a Ph.D. in organic chemistry and has worked in the pharma-ceutical industry. You can reach him at [email protected].
“AA could be considered for nearly any application that requires the identification and/or quantification of metals.”
“AA is very much divided into the primary instrument, consumable sales into that market, and service …”
atomic absorption (aa Spectrometers)Analytik Jena Jena, Germany 49 (0) 3641 77-70 www.analytik-jena.comBuck Scientific East Norwalk, CT 800-562-5566 www.bucksci.comGBC Scientific Hampshire, IL 800-445-1902 www.gbcscientific.comHitachi High Technologies San Jose, CA 800-548-9001 www.hitachi-hta.comPerkinElmer Waltham, MA 617-225-0400 www.perkinelmer.comShimadzu Scientific Instruments Columbia, MD 800-477-1227 www.ssi.shimadzu.comThermo Fisher Scientific Waltham, MA 781-622-1000 www.thermo.comVarian Walnut Creek, CA 800-926-3000 www.varianinc.com
42 Lab Manager May 2010 labmanager.com
PRoduCt foCuS: RaMan SPeCtRoSCoPy
Raman spectroscopy is based on the interaction of visible, near-infrared, or near-ultraviolet light on chemical bonds. When excited with light en-ergy, bonds experience short-lived, higher-energy vibrational states. As bonds relax they emit light at several wavelengths, among which are weak “Raman scattering” effects.
Raman has become the “go-to” ana-lytical method in materials science, pharmaceuticals, and homeland se-curity. Raman’s advantages are that it is nondestructive, detects analytes through packaging, and requires no sample preparation. The principal drawback is that Raman provides only confirmation, not quantitation.
Richard Larsen, Ph.D., spectroscopy products manager at Jasco (Easton, MD), divides Raman instrumentation into three categories: macro, micro, and imaging. Macro measures bulk properties in traditional “spectropho-tometer” mode, micro instruments incorporate microscopy to analyze particles or very small samples, and imaging Raman involves spectral anal-ysis of materials in 2D and 3D mode. Higher-end Raman spectrometers provide exquisite spatial and spectral resolution.
“Traditional Raman spectrophotom-
eters were bulky instruments,” says Kevin Carr, director of new business at Agiltron (Woburn, MA). “Low-cost portable instrumentation allows you to bring Raman where it needs to be.”
Portable Raman spectrophotometers come in plug-in and battery-powered formats. The latter, which are mostly handheld field analyzers, are popular for inspecting materials on loading docks, in oil exploration, for crime scene analytics, and for detection of narcotics and explosives. What makes handheld instruments possible are in-expensive 785 nm diode lasers (origi-nally developed for telecommunica-tions) that consume less than 1 amp.
The huge drop in laser prices not only enabled portable Raman, but fueled the technique for benchtop and high-end research. But price tells only part of the story.
Joe Hodkiewicz, Raman product manager at Thermo Fisher Scientific (Madison, WI), notes that Raman is spreading well beyond its original domain of high-level chemical and materials research. “The technique is moving rapidly into disciplines where it traditionally lacked presence.” Two reasons are the heightened focus on small-size domains (e.g., nanomateri-als) and the enthusiastic acceptance
of Raman microscopes, which today, according to Hodkiewicz, outsell more-traditional Raman analyzers.
Developers of products manufactured with nanoparticles increasingly turn to Raman microscopy to analyze not just chemical makeup but structural and physical phenomena such as stresses, fractures, and defects down to 500 nm dimensions. “As these materials mi-grate into applications and products, they pull Raman with them,” Hodkie-wicz says.
Imaging Raman has long been used to characterize surfaces for mechani-cal and physical phenomena such as strains, stresses or cracks. Raman can generate a three-dimensional picture, for example, when determining the homogeneity of a material or product such as a pharmaceutical tablet. “And the best part is, with Raman there is no sample prep,” Dr. Larsen says.
usability rulesMost users of Raman today view it as a tool like every other lab instrument. “To make systems appeal to these cus-tomers, vendors have to think a lot more about making self-optimizing in-struments that are easy to operate, with little or no learning curve,” Hodkiewicz explains. “This can be a challenge
StePChiLd of viBRationaL SPeCtRoSCoPy CoMeS of age by angelo dePalma, Ph.d.

LAB MANAGER
MAGAZINE’S INDEPENDENTGUIDE TO PURCHASING A UV/VIS SPECTROPHOTOMETERwww.labmanager.com
Lab Manager Magazine supplier lists are generated from manufacturer lists posted on LabX. To include your company on this list, please contact assistant editor Katia Caporiccio at [email protected].
to designers with a lot of Raman ex-perience, to whom instrumentation is second nature. Telling them they have to simplify things is a challenge.” Hod-kiewicz compares the hurdles to mak-ing Raman accessible with the rise of digital cameras that allow users to take professional-quality photographs with-out worrying about such arcane knowl-edge as exposure times, apertures, and film speed. “That’s the approach we’re taking with spectroscopy,” he says.
Another trend is the desire for flex-ibility and expandability. Users, Hodkiewicz tells Lab Manager Maga-zine, are purchasing not just for to-day but for anticipated applications that may require future upgrades, for example, the use of different ex-citation lasers, microscope and auto-mation options, specialized sample cells, and remote fiber probes.
Larsen views Raman as being at ap-proximately the same level of accep-tance and use as FTIR was 20 years ago. “Back then an FTIR cost $100,000 to $200,000. Now we’re down to sub-$20,000 FTIRs. Raman is going in the same direction. I don’t think it will ever be as widely used as FTIR, but there’s no doubt there is still plenty of room for growth.”
Raman has traditionally been viewed as an exotic, if not problematic, anal-ysis method. The main limitation, says Haydar Kustu, global marketing communications manager at Bruker Optics (Billerica, MA), was the laser which was difficult to operate. “Today, manufacturers are improving their Raman spectrometers by paying more attention to the laser.” This has led, he says, to greater adoption of Raman in labs, and notable handheld product in-
troductions as well. The signature trait of these newer systems has been reli-ability and ease of use.
Another plus has been the realization that Raman and IR are complemen-tary. “Raman doesn’t take market share away from IR,” Kustu tells Lab Manager Magazine. “Rather, users tend to add it to their existing IR capabilities.” This trend has been reflected, in recent years, by instruments incorporating both techniques. “Once people famil-iar with IR gave Raman a chance, they realized the technique was a lot more stable and easier to use than they’d an-ticipated, and definitely less exotic.”
Angelo DePalma holds a Ph.D. in organic chemistry and has worked in the pharma-ceutical industry. You can reach him at [email protected].
Raman SpectrometersAgilent SantaClara,CA 877-424-4536 www.agilent.comB&WTek Newark,DE 302-368-7824 www.bwtek.comBaySpec Fremont,CA 510-661-2008 www.bayspec.com
Billerica,MA 978-439-9899 www.brukeroptics.comDeltaNu Laramie,WY 866-301-6328 www.deltanu.comEnwaveOptronics Irvine,CA 949-955-0258 www.enwaveopt.comHORIBAJobinYvon Edison,NJ 732-494-8660 www.jobinyvon.comJASCO Easton,MD 800-333-5272 www.jascoinc.comMalvernInstruments Westborough,MA 800-932-0101 www.malvern.comOceanOptics Dunedin,FL 727-733-2447 www.oceanoptics.comPerkinElmer Waltham,MA 617-225-0400 www.perkinelmer.comRenishaw HoffmanEstates,IL 847-286-9953 www.renishaw.comShimadzuScientificInstruments Columbia,MD 800-477-1227 www.ssi.shimadzu.comThermoFisherScientific Waltham,MA 781-622-1000 www.thermo.comVarian WalnutCreek,CA 800-926-3000 www.varianinc.com
PRODUCT FOCUS: FTIR SPeCTROSCOPy
Fourier transform infrared (FTIR) spectroscopy, a subset of infrared (IR) spectroscopy, uses a mathematical al-gorithm, Fourier transform, to trans-late raw infrared data into a spectrum.
Conventional IR spectroscopy is an absorbance technique that produces spectra that are unique for every IR-absorbing compound. The spectrum from 4000-1000 cm-1, known as the “functional group” region, is diagnostic for alcohols, ketones, hydrocarbons, ha-logenated materials, and others. While functional groups may absorb at pre-cisely the same wavelength, the spec-trum below 1000 cm-1, the “fingerprint” region, is unique for every compound.
By replacing the monochromator with a single, discrete light pulse transmit-ting all IR wavelengths simultane-ously, FT represents a revolutionary improvement. FTIR generates a rep-resentation known as an interferogram, from which a computer subsequently performs an operation, known as Fou-
rier transformation, to generate the spectrum. FTIR acquires a spectrum in one pulse, or collect many pulses and adds them to improve signal-to-noise. Thirty-two one-second pulses are about average for FTIR analysis.
Like IR, FTIR is useful for the analysis of organic and inorganic compounds that exhibit changes in polarity as a re-sult of the vibration, spinning, or per-turbation of molecular bonds. FTIR methods are common in such indus-tries as foods, materials, chemicals, pharmaceuticals, forensics, and others. Advantages of FTIR over conven-tional IR are higher resolution, better signal-to-noise, easier analysis of very
small samples and poorly-absorbing species, and much more rapid analysis.
Instrumentation“FTIR instrumentation may be cat-egorized according to specific end-user and application types,” says Brian C. Smith, Ph.D., founder of FTIR training firm Spectros Associ-ates (Boston, MA).
• Routine instruments that test raw ma-terials or final products, about the size of a laptop computer, employing a sin-gle detector and costing about $20,000.
• Troubleshooting instruments that measure product impurities or de-fects, usually equipped with an IR microscope adapter for evaluating micron-sized materials. A microscope option adds $20,000-$40,000 to the cost of a basic FTIR spectrometer.
• Spectrometers that are used in pure research or high-end applications in academia or large corporations. These instruments perform sophis-ticated tasks such as IR imaging of cells, or biopsies and inspections of semiconductors. Depending on the bells and whistles, these instruments can cost more than $100,000.
“Changes in basic FTIR technology have slowed as the technique has ma-tured, but subcomponents continue to improve,” says Jerry Sellors, Ph.D., manager for FTIR at PerkinElmer (Beaconsfield, U.K.). Among these are underlying electronics, digital sam-pling, more reliable lasers, and general-ly better performance for a given price.
“Instruments are rapidly becoming turn-key solutions while getting smaller and easier to use,” observes Haydar Kustu, global marketing communications man-ager at Bruker Optics (Billerica, MA).
PICkIng UP STeam In nOnTRaDITIOnal maRkeTS by angelo DePalma , Ph.D.
FTIR spectrum of polystyrene.
LowVolumenucleicacidandproteinquantificationonmultiplesampleshasneverbeeneasier!BioTek’snewEpochMulti-VolumeSpectrophotometerSystemisdesignedforawiderangeofapplications,fromnucleicacidandproteinquantificationonamicroscaletocell-basedassaysinmicroplates,BioCellsorstandardcuvettes.WhenthenewEpoch™MicroplateSpectrophotometeriscoupledwithaninnovativedevicelikethenewTake3™Multi-VolumePlate,theresultisasystemthatallowsscientiststorunavarietyofassays,inavarietyofsamplevesselsandvolumeranges.www.biotek.com/epoch
Fromfood,forensicsandtheenvironmenttodrugdiscovery,pharmaceuticalsandmore,Shimadzucanequipyourlaboratorywithhigh-quality,rugged,cost-effectiveUVspectrophotometersforallofyouranalysisrequirements.Choosefromtheeasy-to-useUVmini-1240,thebioscience-orientedBioSpec-mini,ortheUV-1800,designedtomeetyourcomplianceneedswitharesolutionof1nm,thehighestinitsclass.Othermodelsincludethedouble-blazed,doublemonochromatorUV-2550,andourresearch-gradeUV-VIS-NIRmodels,whichincorporatethreedetectorsfortheutmostinsensitivity.Powerfulsoftwareandafullcomplementofaccessoriesensureseamless,high-performanceoperationforallusers.
Shimadzu Scientific Instrumentswww.ssi.shimadzu.com/UV
Thermo Scientific NanoDrop ProductsNanoDrop2000/2000candNanoDrop8000UV-VisSpectrophotometersaretheGoldStandardinmicrovolumequantitationforDNA,RNA,Proteinandmore.DiscoverforyourselfwhyscientistsaresopassionateaboutNanoDropproducts:It’s proven: •Morethan25,000instrumentsinlabsaroundtheworld•ThousandsofcitationsinscientificpublicationsinvirtuallyeveryfieldIt’s simple: •Samplesize0.5–2.0µL,nocuvettes•Nodilutions,evenforhighlyconcentratedsamplesIt’s versatile: •PreconfiguredmethodsforA260,A280,labeledDNA/Proteinandmuchmore•Custommethodscapabilitytorunandsharetailoredapplications
Visit www.thermo.com/nanodroptolearnmoreaboutourfreetrialprogram.
think forward
Bruker Optics

LAB MANAGER
MAGAZINE’S INDEPENDENTGUIDE TO PURCHASING A UV/VIS SPECTROPHOTOMETERwww.labmanager.com
Lab Manager Magazine supplier lists are generated from manufacturer lists posted on LabX. To include your company on this list, please contact assistant editor Katia Caporiccio at [email protected].
to designers with a lot of Raman ex-perience, to whom instrumentation is second nature. Telling them they have to simplify things is a challenge.” Hod-kiewicz compares the hurdles to mak-ing Raman accessible with the rise of digital cameras that allow users to take professional-quality photographs with-out worrying about such arcane knowl-edge as exposure times, apertures, and film speed. “That’s the approach we’re taking with spectroscopy,” he says.
Another trend is the desire for flex-ibility and expandability. Users, Hodkiewicz tells Lab Manager Maga-zine, are purchasing not just for to-day but for anticipated applications that may require future upgrades, for example, the use of different ex-citation lasers, microscope and auto-mation options, specialized sample cells, and remote fiber probes.
Larsen views Raman as being at ap-proximately the same level of accep-tance and use as FTIR was 20 years ago. “Back then an FTIR cost $100,000 to $200,000. Now we’re down to sub-$20,000 FTIRs. Raman is going in the same direction. I don’t think it will ever be as widely used as FTIR, but there’s no doubt there is still plenty of room for growth.”
Raman has traditionally been viewed as an exotic, if not problematic, anal-ysis method. The main limitation, says Haydar Kustu, global marketing communications manager at Bruker Optics (Billerica, MA), was the laser which was difficult to operate. “Today, manufacturers are improving their Raman spectrometers by paying more attention to the laser.” This has led, he says, to greater adoption of Raman in labs, and notable handheld product in-
troductions as well. The signature trait of these newer systems has been reli-ability and ease of use.
Another plus has been the realization that Raman and IR are complemen-tary. “Raman doesn’t take market share away from IR,” Kustu tells Lab Manager Magazine. “Rather, users tend to add it to their existing IR capabilities.” This trend has been reflected, in recent years, by instruments incorporating both techniques. “Once people famil-iar with IR gave Raman a chance, they realized the technique was a lot more stable and easier to use than they’d an-ticipated, and definitely less exotic.”
Angelo DePalma holds a Ph.D. in organic chemistry and has worked in the pharma-ceutical industry. You can reach him at [email protected].
Raman SpectrometersAgilent Santa Clara, CA 877-424-4536 www.agilent.comB&W Tek Newark, DE 302-368-7824 www.bwtek.comBaySpec Fremont, CA 510-661-2008 www.bayspec.com
Billerica, MA 978-439-9899 www.brukeroptics.comDeltaNu Laramie, WY 866-301-6328 www.deltanu.comEnwave Optronics Irvine, CA 949-955-0258 www.enwaveopt.comHORIBA Jobin Yvon Edison, NJ 732-494-8660 www.jobinyvon.comJASCO Easton, MD 800-333-5272 www.jascoinc.comMalvern Instruments Westborough, MA 800-932-0101 www.malvern.comOcean Optics Dunedin, FL 727-733-2447 www.oceanoptics.comPerkinElmer Waltham, MA 617-225-0400 www.perkinelmer.comRenishaw Hoffman Estates, IL 847-286-9953 www.renishaw.comShimadzu Scientific Instruments Columbia, MD 800-477-1227 www.ssi.shimadzu.comThermo Fisher Scientific Waltham, MA 781-622-1000 www.thermo.comVarian Walnut Creek, CA 800-926-3000 www.varianinc.com
PRODUCT FOCUS: FTIR SPeCTROSCOPy
Fourier transform infrared (FTIR) spectroscopy, a subset of infrared (IR) spectroscopy, uses a mathematical al-gorithm, Fourier transform, to trans-late raw infrared data into a spectrum.
Conventional IR spectroscopy is an absorbance technique that produces spectra that are unique for every IR-absorbing compound. The spectrum from 4000-1000 cm-1, known as the “functional group” region, is diagnostic for alcohols, ketones, hydrocarbons, ha-logenated materials, and others. While functional groups may absorb at pre-cisely the same wavelength, the spec-trum below 1000 cm-1, the “fingerprint” region, is unique for every compound.
By replacing the monochromator with a single, discrete light pulse transmit-ting all IR wavelengths simultane-ously, FT represents a revolutionary improvement. FTIR generates a rep-resentation known as an interferogram, from which a computer subsequently performs an operation, known as Fou-
rier transformation, to generate the spectrum. FTIR acquires a spectrum in one pulse, or collect many pulses and adds them to improve signal-to-noise. Thirty-two one-second pulses are about average for FTIR analysis.
Like IR, FTIR is useful for the analysis of organic and inorganic compounds that exhibit changes in polarity as a re-sult of the vibration, spinning, or per-turbation of molecular bonds. FTIR methods are common in such indus-tries as foods, materials, chemicals, pharmaceuticals, forensics, and others. Advantages of FTIR over conven-tional IR are higher resolution, better signal-to-noise, easier analysis of very
small samples and poorly-absorbing species, and much more rapid analysis.
Instrumentation“FTIR instrumentation may be cat-egorized according to specific end-user and application types,” says Brian C. Smith, Ph.D., founder of FTIR training firm Spectros Associ-ates (Boston, MA).
• Routine instruments that test raw ma-terials or final products, about the size of a laptop computer, employing a sin-gle detector and costing about $20,000.
• Troubleshooting instruments that measure product impurities or de-fects, usually equipped with an IR microscope adapter for evaluating micron-sized materials. A microscope option adds $20,000-$40,000 to the cost of a basic FTIR spectrometer.
• Spectrometers that are used in pure research or high-end applications in academia or large corporations. These instruments perform sophis-ticated tasks such as IR imaging of cells, or biopsies and inspections of semiconductors. Depending on the bells and whistles, these instruments can cost more than $100,000.
“Changes in basic FTIR technology have slowed as the technique has ma-tured, but subcomponents continue to improve,” says Jerry Sellors, Ph.D., manager for FTIR at PerkinElmer (Beaconsfield, U.K.). Among these are underlying electronics, digital sam-pling, more reliable lasers, and general-ly better performance for a given price.
“Instruments are rapidly becoming turn-key solutions while getting smaller and easier to use,” observes Haydar Kustu, global marketing communications man-ager at Bruker Optics (Billerica, MA).
PICkIng UP STeam In nOnTRaDITIOnal maRkeTS by angelo DePalma , Ph.D.
FTIR spectrum of polystyrene.
Low Volume nucleic acid and protein quantification on multiple samples has never been easier! BioTek’s new Epoch Multi-Volume Spectrophotometer System is designed for a wide range of applications, from nucleic acid and protein quantification on a micro scale to cell-based assays in microplates, BioCells or standard cuvettes. When the new Epoch™ Microplate Spectrophotometer is coupled with an innovative device like the new Take3™ Multi-Volume Plate, the result is a system that allows scientists to run a variety of assays, in a variety of sample vessels and volume ranges.www.biotek.com/epoch
From food, forensics and the environment to drug discovery, pharmaceuticals and more, Shimadzu can equip your laboratory with high-quality, rugged, cost-effective UV spectrophotometers for all of your analysis requirements. Choose from the easy-to-use UVmini-1240, the bioscience-oriented BioSpec-mini, or the UV-1800, designed to meet your compliance needs with a resolution of 1 nm, the highest in its class. Other models include the double-blazed, double monochromator UV-2550, and our research-grade UV-VIS-NIR models, which incorporate three detectors for the utmost in sensitivity. Powerful software and a full complement of accessories ensure seamless, high-performance operation for all users.
Shimadzu Scientific Instrumentswww.ssi.shimadzu.com/UV
Thermo Scientific NanoDrop ProductsNanoDrop 2000/2000c and NanoDrop 8000 UV-Vis Spectrophotometers are the Gold Standard in microvolume quantitation for DNA, RNA, Protein and more. Discover for yourself why scientists are so passionate about NanoDrop products: It’s proven: • More than 25,000 instruments in labs around the world • Thousands of citations in scientific publications in virtually every fieldIt’s simple: • Sample size 0.5 – 2.0 µL, no cuvettes • No dilutions, even for highly concentrated samplesIt’s versatile: • Preconfigured methods for A260, A280, labeled DNA/Protein and much more • Custom methods capability to run and share tailored applications
Visit www.thermo.com/nanodrop to learn more about our free trial program.
think forward
Bruker Optics

Author: John Buie
IntroductIon: There are many features of a high performance UV/Vis
spectrophotometer to consider before making your
final purchase. Those features include analysis speed,
ease of use, sample compartment size, flexibility and
reliability. This guide will assist you in short-listing
a few models by examining three main selection
criteria: the detection wavelength range; its stray
light measurement; and the instrument’s working
absorbance range. UV/Vis spectrophotometers
from different manufacturers come in a variety of
detection wavelength ranges, spanning from 175
nm to 3,300 nm, but as a guideline you can generally
group a UV/Vis spectrophotometer into one of the
three ranges outlined in this guide.
• Consider the applications for which you will be using this spectrophotometer to determine the detection range you require, but also consider any future applications
that may require a broader range. The NIR range is up to 3,300 nm.
JascoV-670www.jascoinc.com
Cecil InstrumentsAquariuswww.cecilinstruments.com
ShimadzuUV-3600www.ssi.shimadzu.com
VarianCary 5000 and 6000iwww.varianinc.com
Cecil InstrumentsAquaQuestwww.cecilinstruments.com
Cecil InstrumentsReflectaScan Reflectancewww.cecilinstruments.com
PerkinElmerLAMBDA XLS and XLS+www.perkinelmer.com
Cecil InstrumentsSuper Aquariuswww.cecilinstruments.com
Cecil InstrumentsAquaQuestwww.cecilinstruments.com
• Consider the applications for which you will be using this spectrophotometer to determine the detection range you require, but also consider any future applications
that may require a broader range. The Far-UV range is up to 175 nm.
Analytik Jena AGSPECORD® 40www.analytik-jena.com
PerkinElmerLAMBDA XLS & XLS+www.perkinelmer.com
Analytik Jena AGSPECORD® S 300 UV VISwww.analytik-jena.com
Cecil InstrumentsGeneQuest www.cecilinstruments.com
Analytik Jena AGSPECORD® S 600www.analytik-jena.com
Cecil InstrumentsSuper Aurius Dissolution Spectrophotometerswww.cecilinstruments.com
PerkinElmerLAMBDA 25, 35, 45www.perkinelmer.com
Cecil InstrumentsSuper Auriuswww.cecilinstruments.com
Cecil InstrumentsDietQuestwww.cecilinstruments.com
• Consider the applications for which you will be using this spectrophotometer to determine the detection range you require, but also consider any future applications that may require a broader range. The UV/Vis range is from 190 to 900 nm. the spectrophotometers below have a uV/Vis wavelength detection range of 190 to 900 nm. next, choose what range of stray light performance you are comfortable with for your application and budget.
A The degree to which the instrument eliminates stray light is an important specification for UV/Vis spectrophotometers and often dictates the purchase price. Defined as unwanted radiation picked up by
the detector, it is measured using the ASTM method. continue on this path if you are looking for a high-performance stray light measurement of less than or equal to 0.00003 %t @340 nm in a uV/Vis wavelength range of 190 to 900 nm.
• Absorbance range is another specification to consider when evaluating whether a unit will fit your needs and it also separates higher-priced units from lower-priced equipment. Think of the sample in your application: if it is a turbid or concentrated liquid or a
solid sample that is optically thick, you may require a working absorbance range between 5 A and 8 A or higher. Below is a short list of spectrophotometers that meet the following selection criteria: absorbance range of greater than or equal to 5 A, high performance stray light measurement of less than or equal to 0.00003 %t @340 nm in a uV/Vis wavelength range of 190 to 900 nm.
• Absorbance range is another specification to consider when evaluating whether a unit will fit your needs and it also separates higher-priced units from more value-based ones. For most clear liquids, measurement between
3 A and 8 A is acceptable. Below is a short list of spectrophotometers that meet the following selection criteria: absorbance range less than 5 A, high performance stray light measurement of less than or equal to 0.00003 %t @340 nm in a uV/Vis wavelength range of 190 to 900 nm.
HitachiU-0080Dwww.hitachi-hta.com
PerkinElmerLAMBDA 1050, 950, 850www.perkinelmer.com
VarianCary 4000www.varianinc.com
Analytik Jena AGSPECORD® 250 PLUS www.analytik-jena.com
Cecil InstrumentsSeries 1000 Visiblewww.cecilinstruments.com
Analytik Jena AGSPEKOL® 2000www.analytik-jena.com
HitachiU-1900www.hitachi-hta.com
Analytik Jena AGSPECORD® 210 PLUS www.analytik-jena.com
ShimadzuUVmini-1240www.ssi.shimadzu.com
VarianCary 100www.varianinc.com
BioTek Instruments, Inc.Epoch Microplate Spectrophotometerwww.biotek.com
BioTek Instruments, Inc.PowerWaveXSwww.biotek.com
Analytik Jena AGSPEKOL® 1500www.analytik-jena.com
Cecil InstrumentsSeries 1000 UV/Visiblewww.cecilinstruments.com
PerkinElmer750 and 650www.perkinelmer.com
BioTek Instruments, Inc.PowerWaveHTwww.biotek.com
B The degree to which the instrument eliminates stray light is an important specification for UV/Vis spectrophotometers and often dictates the purchase price. Defined as unwanted radiation picked up by the detector, it is measured using the ASTM method.
continue on this path if you are looking for stray light measurements greater than 0.00003 %t @340 nm in a uV/Vis wavelength range of 190 to 900 nm.
• Absorbance range is another specification to consider when evaluating whether a unit will fit your needs and it also separates higher-priced units from lower-priced equipment. Think of the sample in your application: if it is a turbid or concentrated liquid or a solid sample that is
optically thick, you may require a working absorbance range between 5 A and 8 A or higher. Below is a short list of spectrophotometers that meet the following selection criteria: absorbance range of greater than or equal to 5 A, stray light measurements greater than 0.00003 %t @340 nm in a uV/Vis wavelength range of 190 to 900 nm.
• Absorbance range is another specification to consider when evaluating whether a unit will fit your needs and it also separates higher-priced units from more value-based ones. For most clear liquids, measurement between 3 A and 8 A is acceptable. Below is a short list of
spectrophotometers that meet the following selection criteria: absorbance range of less than 5 A, stray light measurements greater than 0.00003 %t @340 nm in a uV/Vis wavelength range of 190 to 900 nm.
JascoV-660www.jascoinc.com
Thermo ScientificNanoDrop 8000www.nanodrop.com
Analytik Jena AGSPEKOL® 1300www.analytik-jena.com
Analytik Jena AGSPECORD® 200 PLUS www.analytik-jena.com
Cecil InstrumentsAurius UV/Visiblewww.cecilinstruments.com
Thermo ScientificNanoDrop 2000www.nanodrop.com
PerkinElmerLAMBDA 650www.perkinelmer.com
VarianCary 300www.varianinc.com
HitachiU-2900/2910www.hitachi-hta.com
Thermo ScientificNanoDrop 2000cwww.nanodrop.com
Independent GuIde to purchasInG a uV/VIs spectrophotometer
JascoV-650www.jascoinc.com
Cecil Instruments BioQuestwww.cecilinstruments.com
S. I. Photonics420www.si-photonics.com
PerkinElmerLAMBDA 25, 35, 45www.perkinelmer.com
Agilent8453 UV-Vis Spectrophotometerwww.agilent.com
HitachiU-3900/3900Hwww.hitachi-hta.com
Analytik Jena AGSPECORD® 50www.analytik-jena.com
AuroraUV-VIS 230www.aurorabiomed.com
Beckman CoulterDU 720/730www.beckmancoulter.com
S. I. Photonics440www.si-photonics.com
Jenway6800www.jenconsusa.com
Jenway6705www.jenconsusa.com
Jenway6715www.jenconsusa.com
PerkinElmerLAMBDA XLS & XLS+www.perkinelmer.com
ShimadzuUV-2550www.ssi.shimadzu.com
ShimadzuUV-1800www.ssi.shimadzu.com
JascoV-630www.jascoinc.com
Beckman CoulterDU 800www.beckmancoulter.com
HachDR 5000www.hach.com
PerkinElmerLAMBDA 25, 35, 45www.perkinelmer.com
STARTHERE

LAB MANAGER
MAGAZINE’S INDEPENDENTGUIDE TO PURCHASING A UV/VIS SPECTROPHOTOMETERwww.labmanager.com
Lab Manager Magazine supplier lists are generated from manufacturer lists posted on LabX. To include your company on this list, please contact assistant editor Katia Caporiccio at [email protected].
to designers with a lot of Raman ex-perience, to whom instrumentation is second nature. Telling them they have to simplify things is a challenge.” Hod-kiewicz compares the hurdles to mak-ing Raman accessible with the rise of digital cameras that allow users to take professional-quality photographs with-out worrying about such arcane knowl-edge as exposure times, apertures, and film speed. “That’s the approach we’re taking with spectroscopy,” he says.
Another trend is the desire for flex-ibility and expandability. Users, Hodkiewicz tells Lab Manager Maga-zine, are purchasing not just for to-day but for anticipated applications that may require future upgrades, for example, the use of different ex-citation lasers, microscope and auto-mation options, specialized sample cells, and remote fiber probes.
Larsen views Raman as being at ap-proximately the same level of accep-tance and use as FTIR was 20 years ago. “Back then an FTIR cost $100,000 to $200,000. Now we’re down to sub-$20,000 FTIRs. Raman is going in the same direction. I don’t think it will ever be as widely used as FTIR, but there’s no doubt there is still plenty of room for growth.”
Raman has traditionally been viewed as an exotic, if not problematic, anal-ysis method. The main limitation, says Haydar Kustu, global marketing communications manager at Bruker Optics (Billerica, MA), was the laser which was difficult to operate. “Today, manufacturers are improving their Raman spectrometers by paying more attention to the laser.” This has led, he says, to greater adoption of Raman in labs, and notable handheld product in-
troductions as well. The signature trait of these newer systems has been reli-ability and ease of use.
Another plus has been the realization that Raman and IR are complemen-tary. “Raman doesn’t take market share away from IR,” Kustu tells Lab Manager Magazine. “Rather, users tend to add it to their existing IR capabilities.” This trend has been reflected, in recent years, by instruments incorporating both techniques. “Once people famil-iar with IR gave Raman a chance, they realized the technique was a lot more stable and easier to use than they’d an-ticipated, and definitely less exotic.”
Angelo DePalma holds a Ph.D. in organic chemistry and has worked in the pharma-ceutical industry. You can reach him at [email protected].
Raman SpectrometersAgilent Santa Clara, CA 877-424-4536 www.agilent.comB&W Tek Newark, DE 302-368-7824 www.bwtek.comBaySpec Fremont, CA 510-661-2008 www.bayspec.com
Billerica, MA 978-439-9899 www.brukeroptics.comDeltaNu Laramie, WY 866-301-6328 www.deltanu.comEnwave Optronics Irvine, CA 949-955-0258 www.enwaveopt.comHORIBA Jobin Yvon Edison, NJ 732-494-8660 www.jobinyvon.comJASCO Easton, MD 800-333-5272 www.jascoinc.comMalvern Instruments Westborough, MA 800-932-0101 www.malvern.comOcean Optics Dunedin, FL 727-733-2447 www.oceanoptics.comPerkinElmer Waltham, MA 617-225-0400 www.perkinelmer.comRenishaw Hoffman Estates, IL 847-286-9953 www.renishaw.comShimadzu Scientific Instruments Columbia, MD 800-477-1227 www.ssi.shimadzu.comThermo Fisher Scientific Waltham, MA 781-622-1000 www.thermo.comVarian Walnut Creek, CA 800-926-3000 www.varianinc.com
PRODUCT FOCUS: FTIR SPeCTROSCOPy
Fourier transform infrared (FTIR) spectroscopy, a subset of infrared (IR) spectroscopy, uses a mathematical al-gorithm, Fourier transform, to trans-late raw infrared data into a spectrum.
Conventional IR spectroscopy is an absorbance technique that produces spectra that are unique for every IR-absorbing compound. The spectrum from 4000-1000 cm-1, known as the “functional group” region, is diagnostic for alcohols, ketones, hydrocarbons, ha-logenated materials, and others. While functional groups may absorb at pre-cisely the same wavelength, the spec-trum below 1000 cm-1, the “fingerprint” region, is unique for every compound.
By replacing the monochromator with a single, discrete light pulse transmit-ting all IR wavelengths simultane-ously, FT represents a revolutionary improvement. FTIR generates a rep-resentation known as an interferogram, from which a computer subsequently performs an operation, known as Fou-
rier transformation, to generate the spectrum. FTIR acquires a spectrum in one pulse, or collect many pulses and adds them to improve signal-to-noise. Thirty-two one-second pulses are about average for FTIR analysis.
Like IR, FTIR is useful for the analysis of organic and inorganic compounds that exhibit changes in polarity as a re-sult of the vibration, spinning, or per-turbation of molecular bonds. FTIR methods are common in such indus-tries as foods, materials, chemicals, pharmaceuticals, forensics, and others. Advantages of FTIR over conven-tional IR are higher resolution, better signal-to-noise, easier analysis of very
small samples and poorly-absorbing species, and much more rapid analysis.
Instrumentation“FTIR instrumentation may be cat-egorized according to specific end-user and application types,” says Brian C. Smith, Ph.D., founder of FTIR training firm Spectros Associ-ates (Boston, MA).
• Routine instruments that test raw ma-terials or final products, about the size of a laptop computer, employing a sin-gle detector and costing about $20,000.
• Troubleshooting instruments that measure product impurities or de-fects, usually equipped with an IR microscope adapter for evaluating micron-sized materials. A microscope option adds $20,000-$40,000 to the cost of a basic FTIR spectrometer.
• Spectrometers that are used in pure research or high-end applications in academia or large corporations. These instruments perform sophis-ticated tasks such as IR imaging of cells, or biopsies and inspections of semiconductors. Depending on the bells and whistles, these instruments can cost more than $100,000.
“Changes in basic FTIR technology have slowed as the technique has ma-tured, but subcomponents continue to improve,” says Jerry Sellors, Ph.D., manager for FTIR at PerkinElmer (Beaconsfield, U.K.). Among these are underlying electronics, digital sam-pling, more reliable lasers, and general-ly better performance for a given price.
“Instruments are rapidly becoming turn-key solutions while getting smaller and easier to use,” observes Haydar Kustu, global marketing communications man-ager at Bruker Optics (Billerica, MA).
PICkIng UP STeam In nOnTRaDITIOnal maRkeTS by angelo DePalma , Ph.D.
FTIR spectrum of polystyrene.
Low Volume nucleic acid and protein quantification on multiple samples has never been easier! BioTek’s new Epoch Multi-Volume Spectrophotometer System is designed for a wide range of applications, from nucleic acid and protein quantification on a micro scale to cell-based assays in microplates, BioCells or standard cuvettes. When the new Epoch™ Microplate Spectrophotometer is coupled with an innovative device like the new Take3™ Multi-Volume Plate, the result is a system that allows scientists to run a variety of assays, in a variety of sample vessels and volume ranges.www.biotek.com/epoch
From food, forensics and the environment to drug discovery, pharmaceuticals and more, Shimadzu can equip your laboratory with high-quality, rugged, cost-effective UV spectrophotometers for all of your analysis requirements. Choose from the easy-to-use UVmini-1240, the bioscience-oriented BioSpec-mini, or the UV-1800, designed to meet your compliance needs with a resolution of 1 nm, the highest in its class. Other models include the double-blazed, double monochromator UV-2550, and our research-grade UV-VIS-NIR models, which incorporate three detectors for the utmost in sensitivity. Powerful software and a full complement of accessories ensure seamless, high-performance operation for all users.
Shimadzu Scientific Instrumentswww.ssi.shimadzu.com/UV
Thermo Scientific NanoDrop ProductsNanoDrop 2000/2000c and NanoDrop 8000 UV-Vis Spectrophotometers are the Gold Standard in microvolume quantitation for DNA, RNA, Protein and more. Discover for yourself why scientists are so passionate about NanoDrop products: It’s proven: • More than 25,000 instruments in labs around the world • Thousands of citations in scientific publications in virtually every fieldIt’s simple: • Sample size 0.5 – 2.0 µL, no cuvettes • No dilutions, even for highly concentrated samplesIt’s versatile: • Preconfigured methods for A260, A280, labeled DNA/Protein and much more • Custom methods capability to run and share tailored applications
Visit www.thermo.com/nanodrop to learn more about our free trial program.
think forward
Bruker Optics
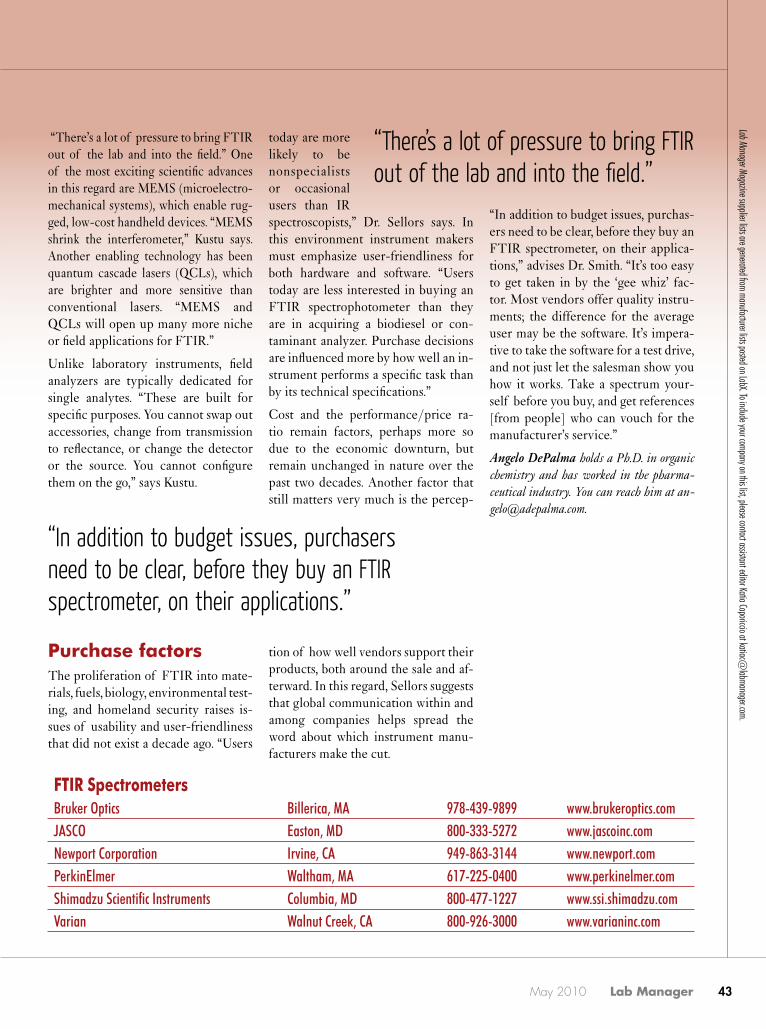
43 May 2010 Lab Manager
“There’s a lot of pressure to bring FTIR out of the lab and into the field.” One of the most exciting scientific advances in this regard are MEMS (microelectro-mechanical systems), which enable rug-ged, low-cost handheld devices. “MEMS shrink the interferometer,” Kustu says. Another enabling technology has been quantum cascade lasers (QCLs), which are brighter and more sensitive than conventional lasers. “MEMS and QCLs will open up many more niche or field applications for FTIR.”
Unlike laboratory instruments, field analyzers are typically dedicated for single analytes. “These are built for specific purposes. You cannot swap out accessories, change from transmission to reflectance, or change the detector or the source. You cannot configure them on the go,” says Kustu.
Purchase factorsThe proliferation of FTIR into mate-rials, fuels, biology, environmental test-ing, and homeland security raises is-sues of usability and user-friendliness that did not exist a decade ago. “Users
today are more likely to be nonspecialists or occasional users than IR spectroscopists,” Dr. Sellors says. In this environment instrument makers must emphasize user-friendliness for both hardware and software. “Users today are less interested in buying an FTIR spectrophotometer than they are in acquiring a biodiesel or con-taminant analyzer. Purchase decisions are influenced more by how well an in-strument performs a specific task than by its technical specifications.”
Cost and the performance/price ra-tio remain factors, perhaps more so due to the economic downturn, but remain unchanged in nature over the past two decades. Another factor that still matters very much is the percep-
tion of how well vendors support their products, both around the sale and af-terward. In this regard, Sellors suggests that global communication within and among companies helps spread the word about which instrument manu-facturers make the cut.
“In addition to budget issues, purchas-ers need to be clear, before they buy an FTIR spectrometer, on their applica-tions,” advises Dr. Smith. “It’s too easy to get taken in by the ‘gee whiz’ fac-tor. Most vendors offer quality instru-ments; the difference for the average user may be the software. It’s impera-tive to take the software for a test drive, and not just let the salesman show you how it works. Take a spectrum your-self before you buy, and get references [from people] who can vouch for the manufacturer’s service.”
Angelo DePalma holds a Ph.D. in organic chemistry and has worked in the pharma-ceutical industry. You can reach him at [email protected].
Lab Manager Magazine supplier lists are generated from manufacturer lists posted on LabX. To include your company on this list, please contact assistant editor Katia Caporiccio at [email protected].
ftiR SpectrometersBruker Optics Billerica, MA 978-439-9899 www.brukeroptics.comJASCO Easton, MD 800-333-5272 www.jascoinc.comNewport Corporation Irvine, CA 949-863-3144 www.newport.comPerkinElmer Waltham, MA 617-225-0400 www.perkinelmer.comShimadzu Scientific Instruments Columbia, MD 800-477-1227 www.ssi.shimadzu.comVarian Walnut Creek, CA 800-926-3000 www.varianinc.com
“There’s a lot of pressure to bring FTIR out of the lab and into the field.”
“In addition to budget issues, purchasers need to be clear, before they buy an FTIR spectrometer, on their applications.”

44 Lab Manager May 2010 labmanager.com
PRoduCt foCuS: ChRoMatogRaPhy-MaSS SPeCtRoMetRy
Among the “hyphenated” mass spectrometry (MS) techniques, gas chromatography-MS (GC-MS) and high-performance liquid chroma-tography-MS (LC-MS) are the most notable. These methods combine the resolving power of high-resolution chromatography with the specificity and sensitivity of MS.
GC-MS has been around since the 1950s, although the technique was impractical for routine analysis until the advent of small, inexpensive mass detectors. LC-MS came into its own later, with the introduction of “soft” ionization methods such as electro-spray (ESI) and atmospheric pressure chemical ionization (APCI).
The power of LC-MS and GC-MS derives from the orthogonality of their components. Chromatography’s principal drawback is the co-elution of different chemicals, which compli-cates their definitive identification by ultraviolet or flame ionization detec-tion, while mass spectrometry may not distinguish between isomers. To-gether, chromatography and MS prac-tically eliminate these shortcomings.
LC-MS and GC-MS are complementa-ry with respect to the types of molecule they work best with. GC is most appro-priate for small, apolar, “traditional” or-ganic compounds that volatilize easily, while LC shines with larger, polar com-pounds such as peptides, proteins, genes, and pharmaceuticals. In their native
forms, LC treats molecules more gently than GC, which is even more true when comparing LC-MS and GC-MS.
Because LC-MS employs soft ioniza-tion, it generates a molecu-lar ion peak corresponding to the molecule’s molecu-lar weight, but few frag-ment peaks. GC-MS, by comparison, tears the mol-ecule apart to provide in-formation-rich fragmenta-tion patterns. Users may apply tandem MS (referred to as MS/MS) to induce fragmentation in LC-MS, but tandem detectors are costly. Software is used to “piece” fragments together and com-pute the molecular weight.
Comparing the methodsLC-MS is extremely effective for po-lar pharmaceutical molecules, metab-olites, and smaller biomolecules. “But analysis of intact proteins is still a difficult, complex problem,” observes Lester Taylor, Ph.D., LC-MS plat-forms and program manager at Agi-lent (Santa Clara, CA). Factors such as aggregation, folding, large size, and the presence of disulfide bonds or bound membranes don’t interfere with LC, but they do confound mass analysis. Analysts can circumvent these chal-lenges through chemical treatments or by using enzymes to break the mol-ecules into manageable pieces.
“Most customers acquire LC-MS in-struments as complete systems, but piecemeal purchases are possible if a particular LC or MS instrument is
preferred. Turnkey systems,” says Dr. Taylor, “are much less likely to suffer from LC-MS interface or communi-cations issues.”
GC-MS is more predictable. “Pretty much anything that goes through a GC can be analyzed by GC-MS,” observes Ron Snelling, Ph.D., senior GC/GC-MS product specialist at Shimadzu Scientific Instruments (Co-lumbia, MD). “The bad news is that GC is innately molecular-weight lim-ited (to about 500-1000, depending on volatility). In the past, very large, polar molecules were derivatized (often by silylation), but this practice is dying out since LC-MS is so accessible.”
As many as 25 percent of GC systems today ship with MS instead of flame ionization, conductivity, or electron capture detectors. This is a relatively new development resulting from the miniaturization of and falling prices for MS instruments. Customers most
BeSt of Both woRLdS by angelo dePalma, Ph.d.
“The power of LC-MS and GC-MS derives from the orthogonality of their components.”

45 May 2010 Lab Manager
often purchase complete GC-MS sys-tems rather than components for the same reasons as for LC-MS. “In situ-ations where labs decide to upgrade to MS detection for an existing GC,” Snelling says, “they generally pur-chase a new GC-MS system instead because the cost of the GC compo-nent is fairly small. Customers con-sidering high-end GC systems with two columns and two detectors should also consider a GC-MS instead. For an additional $15,000, you can have GC-MS and only have one column and one detector to worry about.”
Common groundMass detectors have revolutionized LC and GC by providing unequivocal identification and exquisite detail to every analytical run. Iain Mylchreest, Ph.D., vice president and general man-ager for life sciences MS at Thermo Fisher Scientific (San Jose, CA), calls MS the “ultimate detection tool” that provides qualitative and quantitative information. “UV, FID, and PD tell you something is there but not what it is. MS tells you something is there and provides absolute identification.”
GC and LC labs interested in mass detectors have a range of choices. Sin-gle-stage quadrupole MS instruments return a molecule’s nominal mass for LC, and more detailed mass plus fragmentation in GC mode. More ad-vanced MS detectors utilizing tandem MS/MS are significantly more expen-sive, but provide very accurate mass to one or two parts per million, and ac-curate elemental ratios.
According to Dr. Mylchreest, dissat-isfaction with derivatization is driving customers from GC-MS to LC-MS. An exception is for EPA methods, which are based on GC-MS for historical reasons. “It would take a lot of work to revali-date those methods,” he says. Dr. Tay-lor of Agilent disagrees, attributing the perception that LC is “taking over” to
the explosion of life sciences LC-MS applications, particularly in genomics, proteomics, and metabolomics.
Regardless, both GC and LC have staunch supporters whose loyalty is magnified with the addition of MS. “There has been a huge shift toward MS being the detector of choice for LC and GC,” Dr. Mylchreest tells Lab Manager Magazine. “Mass detectors are slowly making inroads into the midpriced in-strument market. MS won’t replace UV detection for $30,000 LC systems, not for a while, but maybe some day.”
Angelo DePalma holds a Ph.D. in organic chemistry and has worked in the pharma-ceutical industry. You can reach him at [email protected].
Lab Manager Magazine supplier lists are generated from manufacturer lists posted on LabX. To include your company on this list, please contact assistant editor Katia Caporiccio at [email protected].
gC/MS SystemsAgilent Technologies Santa Clara, CA 877-424-4536 www.agilent.comApplied Biosystems Carlsbad, CA 800-327-3002 www.appliedbiosystems.comBruker Daltonics Billerica, MA 978-663-3660 www.bruker.comJEOL USA Peabody, MA 978-535-5900 www.jeol.comKonik Instruments Miami, FL 305-252-0506 www.konik-group.comLECO St. Joseph, MI 800-292-6141 www.leco.comPerkinElmer Waltham, MA 617-225-0400 www.perkinelmer.comShimadzu Scientific Instruments Columbia, MD 800-477-1227 www.ssi.shimadzu.comThermo Fisher Scientific Waltham, MA 781-622-1000 www.thermo.comVarian Walnut Creek, CA 800-926-3000 www.varianinc.comWaters Midford, MA 508-478-2000 www.waters.com
“LC-MS and GC-MS are complementary with respect to the types of molecule they work best with.”
46 Lab Manager May 2010 labmanager.com
PRoduCt foCuS: uv-viS SPeCtRoSCoPy
Ultraviolet-visible spectroscopy (UV-Vis), an absorbance-based analytical technique, measures and identifies chemicals that absorb in the contigu-ous ultraviolet and visible regions of the electromagnetic spectrum. UV wavelengths range from 10 to 400 nanometers, while the visible spec-trum—colors visible to the human eye—lie from approximately 400 to 800 nanometers.
Compounds analyzed by UV-Vis pos-sess “chromophores,” or color-absorb-ing carbon-carbon, carbon-oxygen, or carbon-nitrogen double bonds, as well as carbon-halogen single bonds. Depending on the extent and type of unsaturation, particularly whether the bonds are conjugated (alternate with single bonds), compounds may absorb in the UV or visible region of the spectrum. Chemicals such as car-otene and certain dyes, which have extensive conjugation, are brightly colored and absorb in the visible re-gion. Conjugation causes a shift in ab-sorbance to higher wavelengths (i.e., toward the visible region).
Grant Drenkow, product manager for UV-Vis at Agilent (Loveland, CO), describes UV-Vis as “the screwdriver
of the laboratory,” for its ubiquity in nearly all science- or engineering-based industries.
Because compounds have unique UV-Vis spectra, including a maximum ab-sorption wavelength (λmax or “lambda max”) and molar extinction coefficient (ε, absorbance per mole), UV-Vis can be used to identify the presence of chemicals and their concentrations. For this reason, UV-Vis is a popular technique in chemistry, foods, pig-ments, pharmaceuticals, polymers, and the life sciences, for basic or applied research as well as quality control.
For determining a chemical concen-tration, users typically scan the entire UV-Vis spectrum, although dedicated applications may only examine λmax and the absorbance. The latter ap-proach is useful in measuring kinet-ics—the appearance or disappearance of a chemical species over time. How-ever, the distinction between single-wavelength and full-spectrum analysis has become almost moot since modern instruments “scan” the entire UV-Vis spectrum in about one second.
At one time, vendors routinely offered separate instruments for UV and Vis, but today the two tend to be combined.
Some manufacturers add a third capa-bility, near-infrared (NIR), which is immediately above the visible region.
UV-Vis spectrometers come in four basic models: low-cost single-beam, dual-beam, array-based, and hand-held. Single-beam techniques must apply a correction for the loss of light intensity as the beam passes through the solvent. Dual-beam spectrom-eters use a second solvent reference cell and perform the correction au-tomatically. Single- and dual-beam benchtop instruments use a broad-spectrum lamp as the light source, and most use a photomultiplier tube as the detector. Some instruments (e.g., from Agilent) employ photo-diode array detectors.
Handheld instruments are usually dedicated to one wavelength and an-alyte, for example, for water testing in the field. Handhelds employ single-wavelength light-emitting diode light sources and photodiode detectors.
Array-based instruments use a very broad-spectrum tungsten lamp emit-ting between 200 and 1000 nm, and use a photodiode array or charge-coupled device as the detector. Array instru-ments do not scan the UV-Vis spectrum
in the traditional sense, but rath-er send and collect the entire spectrum at once. Array instru-ments are useful when spectra must be acquired quickly, for ex-
it’S aLL in the ChRoMoPhoReSby angelo dePalma, Ph.d.
“… the distinction between single-wavelength and full-spectrum analysis has become almost moot …”

47 May 2010 Lab Manager
GET A BETTER REACTION
uv/vis SpectrometersAgilent Santa Clara, CA 877-424-4536 www.agilent.comAnalytik Jena Jena, Germany 49 (0) 3641 77-70 www.analytik-jena.comBeckman Coulter Fullerton, CA 800-233-4685 www.beckman.com
Winooski, VT 802-655-4740 www.biotek.comBuck Scientific East Norwalk, CT 800-562-5566 www.bucksci.comCecil Instruments Cambridge, UK 44 122 342 0821 www.cecilinstruments.comGBC Scientific Hampshire, IL 800-445-1902 www.gbcscientific.comHach Company Loveland, CO 800-227-4224 www.hach.comHitachi San Jose, CA 800-548-9001 www.hitachi-hta.comOcean Optics Dunedin, FL 727-733-2447 www.oceanoptics.comShimadzu Scientific Instruments Columbia, MD 800-477-1227 www.ssi.shimadzu.comS.I. Photonics Tucson, AZ 520-293-6911 www.si-photonics.comThermo Fisher Scientific Waltham, MA 781-622-1000 www.thermo.comVarian Walnut Creek, CA 800-926-3000 www.varianinc.com
ample, from an HPLC trace or fast kinetics experiments.
UV-Vis instruments have become much faster, more compact, and feature-lad-en. Array instruments, in particular, provide a level of detail and through-put that was previously unavailable. “Although they may have originally been interested in just one or two wavelengths, users love capturing the entire spectrum in seconds,” Drenkow says. Other factors entering into pur-chase decisions are cost, throughput, and the reliability of data.
getting smallSample size (or lack thereof) has for some time been an ongoing issue in analytical science. “People want more from less,” notes Philippe Desjardins, scientific marketing manager at Nano- Drop (Wilmington, DE), a subsidiary of Thermo Scientific. From this need
has emerged microvolume UV-Vis, which analyzes liquid samples in the 0.5 to 50-microliter range.
Several vendors offer microvolume-only instruments or microvolume cells for conventional UV-Vis spec-trophotometers. In its most elegant configuration, a microdrop of sample is deposited atop a small pedestal and a second pedestal immediately ap-proaches to complete the optical path by contacting the sample’s meniscus. Embedded in each pedestal is an op-tical fiber—one serving as a conduit for the light source, the other for the detector. The sample stays in place due to surface tension, but the path length may be optimized by adjusting the distance between 0.05 mm and
1 mm, depending on the sample concentration. This eliminates the need, as oc-curs frequently in conven-tional UV-Vis, to remove
the cuvette and dilute or concentrate the sample.
Different models possess varying ca-pabilities to adjust the path length, spectrum acquisition time, light source, and detector. For example, in-struments from NanoDrop employ a xenon flash lamp that delivers source light across the entire UV-Vis spec-trum at once, so spectrum acquisition takes just a few seconds.
Angelo DePalma holds a Ph.D. in organic chemistry and has worked in the pharma-ceutical industry. You can reach him at [email protected].
Lab Manager Magazine supplier lists are generated from manufacturer lists posted on LabX. To include your company on this list, please contact assistant editor Katia Caporiccio at [email protected].
“Array instruments are useful when spectra must be acquired quickly …”

48 Lab Manager May 2010 labmanager.com
PERSPECTIVE ON: AN ENVIRONMENTAL LAB
STRONG MANAGEMENT SUPPORT AND SMART HIRING MAKES FOR SUCCESS by Sara Goudarzi
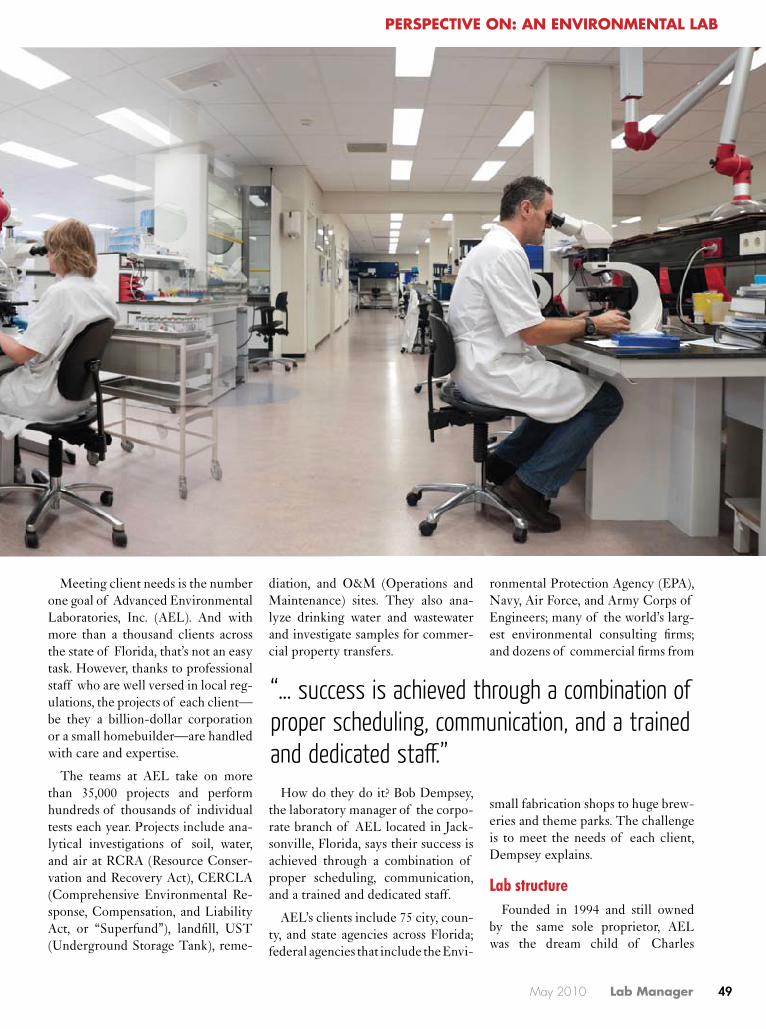
49 May 2010 Lab Manager
PERSPECTIVE ON: AN ENVIRONMENTAL LAB
Meeting client needs is the number one goal of Advanced Environmental Laboratories, Inc. (AEL). And with more than a thousand clients across the state of Florida, that’s not an easy task. However, thanks to professional staff who are well versed in local reg-ulations, the projects of each client—be they a billion-dollar corporation or a small homebuilder—are handled with care and expertise.
The teams at AEL take on more than 35,000 projects and perform hundreds of thousands of individual tests each year. Projects include ana-lytical investigations of soil, water, and air at RCRA (Resource Conser-vation and Recovery Act), CERCLA (Comprehensive Environmental Re-sponse, Compensation, and Liability Act, or “Superfund”), landfill, UST (Underground Storage Tank), reme-
diation, and O&M (Operations and Maintenance) sites. They also ana-lyze drinking water and wastewater and investigate samples for commer-cial property transfers.
How do they do it? Bob Dempsey, the laboratory manager of the corpo-rate branch of AEL located in Jack-sonville, Florida, says their success is achieved through a combination of proper scheduling, communication, and a trained and dedicated staff.
AEL’s clients include 75 city, coun-ty, and state agencies across Florida; federal agencies that include the Envi-
ronmental Protection Agency (EPA), Navy, Air Force, and Army Corps of Engineers; many of the world’s larg-est environmental consulting firms; and dozens of commercial firms from
small fabrication shops to huge brew-eries and theme parks. The challenge is to meet the needs of each client, Dempsey explains.
Lab structureFounded in 1994 and still owned
by the same sole proprietor, AEL was the dream child of Charles
“… success is achieved through a combination of proper scheduling, communication, and a trained and dedicated staff.”

50 Lab Manager May 2010 labmanager.com
PERSPECTIVE ON: AN ENVIRONMENTAL LAB
Ged, who wanted to build one of the best labs in Florida. Today, with five laboratory facilities across the state—Jacksonville, Gainesville, Mi-ami, Orlando, and Tampa—AEL is a National Environmental Labora-tory Accreditation Program certified, full-service environmental analyti-cal laboratory. The great bulk of the work performed by AEL is testing and sampling of drinking water and wastewater and monitoring of wells.
“AEL also was the very first lab in the nation to be selected and to un-dergo the Army Corps of Engineers audit/approval/review process to perform work on the Everglades Res-toration Program,” Dempsey says. “And AEL was awarded and holds a standing GSA (General Services Ad-ministration) contract with the feder-al government, allowing it to work for any federal government agency.”
The Jacksonville lab, which Dempsey now manages, started with two chemists who worked on UST sites and performed quick-turn-around remediation projects. Now with 35 employees, the lab handles about 12,000 projects each year, in-cluding wastewater analysis and in-vestigating Superfund sites. On aver-age, each project requires analysis of five to 10 samples.
The 8,400-square-foot building was custom designed by AEL and specifi-cally engineered to serve as an envi-ronmental testing laboratory and as the corporate headquarters. The site encompasses state-of-the-art labora-
tory design and instrumentation and offers sampling and courier services.
Each AEL facility has a quality as-surance officer and a lab manager who oversees department supervisors and technical staff, such as analysts and technicians.
“Most of the people that work here are degreed,” Dempsey says. “How-ever, we do have some people that aren’t but have years of experience in the environmental field.”
In Dempsey’s branch, there are two department supervisors who each lead a team of about seven. Together, with support staff, he manages 24 employees. “Our department consists of organics and inorganics for the most part,” he explains. “However, some of our labs also have microbiology supervisors.”
The supervisors schedule and co-ordinate all the analytical work in their department from the bench level. In addition to being responsible for making sure each setup is prop-erly prepped, they also perform some of the tests themselves.
“Everything we do goes through a pretty extensive review process, and the supervisors are also part of that review process,” Dempsey says.
The staff works five days a week. However, there’s a skeleton crew that comes in on the weekends, plus addi-tional staff based on clients’ needs.
“Some of our tests are what we call a short hold, meaning when their sample is collected, it has to be ana-lyzed within a matter of hours, so for
those clients that have to collect those samples on the weekend, we have a staff in place that will accept them,” Dempsey says.
Other samples, such as those that involve microbiology, may be placed in an incubator for a certain num-ber of hours. If that incubation pe-riod ends on a weekend, then a staff member must come in to take care of reading and recording the results.
Day-to-day routine, challenges, and management tips
As a lab manager, Dempsey doesn’t perform any lab work himself. Most of his day is taken up with managing his staff, tending to clients, acquiring new sales, and working on business development.
“I have an operations meeting every day with the supervisors and project management staff to communicate client due dates, any upcoming large projects, rush work, and to make sure we have enough coverage to meet our clients’ needs and any other issues they may have,” he says.
“Additionally, I answer many emails each day and communicate with our clients, our current staff, and other AEL laboratories about projects and technical issues,” Dempsey adds. “I [also] serve as project manager for a couple of our larger clients.”
Because the needs of each client vary for each project, Dempsey and his team must set up a custom-tai-lored schedule per job. For example, if a client requires a quick turnaround time, the lab must arrange to receive the samples and get them processed, analyzed, and reported quickly.
“We utilize a LIMS (Laboratory Information Management System) to log in our samples and track them
“Now with 35 employees, the lab handles about 12,000 projects each year, including wastewater analysis and investigating Superfund sites.”
51 May 2010 Lab Manager
PERSPECTIVE ON: AN ENVIRONMENTAL LAB
throughout the laboratory—from logging them in to analyzing them on the instruments to reporting them via e-mail,” he says.
It’s not easy juggling all this work, but Dempsey says he looks forward to the challenge and to coming in to work each morning.
“I truly enjoy the work I do and the people I associate with,” Dempsey says. “The owner of Advanced Envi-ronmental Laboratories is a genuine person, easy to work for, and treats me and the rest of his employees ex-tremely fairly, and that makes a dif-ference in terms of enjoying the work you do. All of this, I believe, rubs off on our clients, which is why we have been growing and expanding as a lab-oratory over the last 15 years.”
Communication is another rea-son AEL is successful, according to Dempsey. Whether it’s between the employees or with the clients, a clear understanding of what needs to be done allows everyone to utilize their time and efforts effectively. “Singly, it is probably the most important skill set we need to utilize,” Dempsey says.
“Each month, we provide what we call communication lunches—this al-lows everyone to get together in one group and talk,” he explains.
A good staff is also very important. “We have some very key staff here. I can tell them right now, ‘Hey, I’ve got some samples coming in; we’re going to have to work a little later tonight to get this stuff done,’ and they’ll do it. They work in a team like that,” Dempsey says. “I can’t do all the work myself, so if I don’t have good people working with me [things won’t get done].”
When time and resources allow, Dempsey and AEL’s owner show their gratitude to their staff by orga-
nizing functions where everyone can get together in a relaxed atmosphere.
“Last year, the owner bought Jack-sonville Jaguar football tickets for employees and their spouses for the last game of the season,” Dempsey says. “He provided transportation to and from the stadium along with a ca-tered tailgate party before the game.”
Instrumentation, maintenance, and inventory
All AEL labs follow EPA-approved methodologies. Some of the instru-ments they use regularly include gas chromatography-mass spectrometry (GC-MS), gas chromatography-elec-tron capture detector (GC-ECD), gas chromatography-flame ionization detector (GC-FID), gas chromatog-raphy-nitrogen phosphorus detec-tor (GC-NPD), inductively coupled plasma mass spectroscopy (ICP-MS), high performance liquid chromatog-raphy (HPLC), and cold vapor atom-ic absorption (CVAA).
“We actually have three pieces of equipment that are under service contracts in our metals laboratory,” Dempsey says. “All of our organics equipment we maintain ourselves.”
Department supervisors take care of inventory. When technical staff
notice that an item is running low or missing, they communicate this to their supervisors, who will place an order for the item.
“Each of our department supervi-sors is responsible for his or her spe-cific inventory and order submittal,” Dempsey says. “A lot of what we do is electronic and the approvals and purchase orders do come through me. [However,] large purchase orders have to go through the owner.”
HiringBecause staff members are such an
instrumental part of AEL’s success, Dempsey and his team take extra care when hiring. When looking for a new employee, they solicit résumés through a service, ads, or word of mouth and will ask to interview those whose work seems promising.
“I’ll be part of the interview process and so will the department supervisors, and every once in a while we pull in a senior staff person, if it’s a specialty type task that they do,” Dempsey says. “And we collaborate on the interview– ees and make a decision.”
When hired, the new AEL em-ployee undergoes a training period, which varies based on the work he or she will be performing.
“Having a solid, experienced staff working behind you is really key to a successful operation,” Dempsey says.
Sara Goudarzi is a freelance writer based in New York City. Her Web site is www.saragoudarzi.com.
“Because staff mem-bers are such an in-strumental part of AEL’s success, Dempsey and his team take extra care when hiring.”
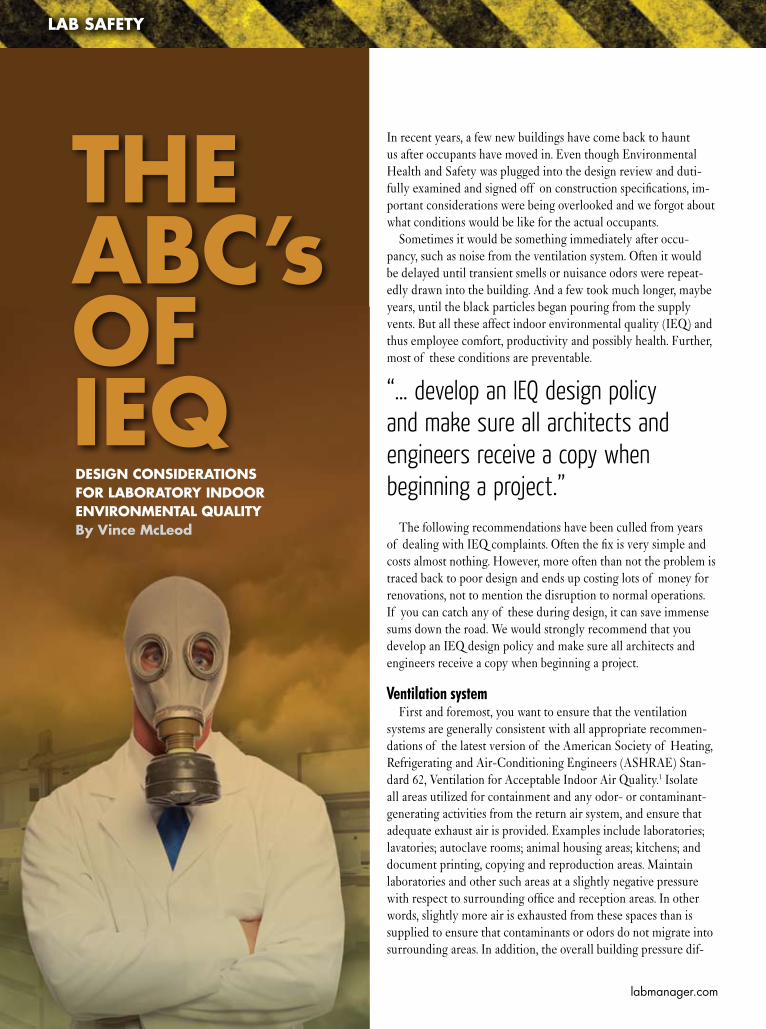
labmanager.com
LAB SAFETY
THE ABC’s OF IEQDESIGN CONSIDERATIONS FOR LABORATORY INDOOR ENVIRONMENTAL QUALITY By Vince McLeod
In recent years, a few new buildings have come back to haunt us after occupants have moved in. Even though Environmental Health and Safety was plugged into the design review and duti-fully examined and signed off on construction specifications, im-portant considerations were being overlooked and we forgot about what conditions would be like for the actual occupants.
Sometimes it would be something immediately after occu-pancy, such as noise from the ventilation system. Often it would be delayed until transient smells or nuisance odors were repeat-edly drawn into the building. And a few took much longer, maybe years, until the black particles began pouring from the supply vents. But all these affect indoor environmental quality (IEQ) and thus employee comfort, productivity and possibly health. Further, most of these conditions are preventable.
The following recommendations have been culled from years of dealing with IEQ complaints. Often the fix is very simple and costs almost nothing. However, more often than not the problem is traced back to poor design and ends up costing lots of money for renovations, not to mention the disruption to normal operations. If you can catch any of these during design, it can save immense sums down the road. We would strongly recommend that you develop an IEQ design policy and make sure all architects and engineers receive a copy when beginning a project.
Ventilation systemFirst and foremost, you want to ensure that the ventilation
systems are generally consistent with all appropriate recommen-dations of the latest version of the American Society of Heating, Refrigerating and Air-Conditioning Engineers (ASHRAE) Stan-dard 62, Ventilation for Acceptable Indoor Air Quality.1 Isolate all areas utilized for containment and any odor- or contaminant-generating activities from the return air system, and ensure that adequate exhaust air is provided. Examples include laboratories; lavatories; autoclave rooms; animal housing areas; kitchens; and document printing, copying and reproduction areas. Maintain laboratories and other such areas at a slightly negative pressure with respect to surrounding office and reception areas. In other words, slightly more air is exhausted from these spaces than is supplied to ensure that contaminants or odors do not migrate into surrounding areas. In addition, the overall building pressure dif-
“… develop an IEQ design policy and make sure all architects and engineers receive a copy when beginning a project.”

53 May 2010 Lab Manager
LAB SAFETY
ferential should remain slightly positive in relation to the outside atmosphere.
If local exhaust ventilation (LEV) sys-tems are used, such as specialized hoods or snorkel systems, their design should follow the most recent version of the American Conference of Governmental Industrial Hygienists’ (ACGIH) Indus-trial Ventilation: A Manual of Recommended Practice for Design.2 Be sure to include the exhaust stack discharge design and proper height when evaluating the LEV system.
Finally, consider the maintenance personnel and require proper roof ac-cess provided by adequate openings with stairs, not ladders, not even fixed-ladder systems. It is not easy to climb vertically with a heavy tool belt and your hands full of spare parts.
Duct systemsOne of the most important (and
potentially troublesome) components is the system of ducts that moves the ventilation around the facility. The black particles pouring from supply vents mentioned above—nine times out of ten are due to internally insulated ducts eroding over time. Therefore, all duct-work associated with the HVAC systems supply and return air distribution as well as outside air intakes (more on these later) must not have internal lining or insulation. We highly recommend only metal ducts in industrial settings; duct board is just not acceptable. Construct all ducts so that they are effectively sealed.
We recommend that flexible duct, if used at all, only connect diffusers to the main trunk duct and lengths should not exceed six feet. By all means, avoid long, convoluted runs of flexible duct, a com-mon trick used for sound attenuation.
All supply and return air runs should go through sealed ducts. Do not allow ceiling plenums (the space above ceil-ings and below the roof deck or floor above) or hallways to be used for moving supply or return air.
At the terminal ends, where supply air is pushed into the workspace, verify and test all diffusers to show that throw and mixing is adequate and drafts on occupants are minimized. Ensure enough space between supply and return grills to prevent short-circuiting.
HVAC controlsControls are becoming very sophis-
ticated and complex, with sensors and feedback loops that can call for air of a certain temperature and even the amount of outside air. However, the simpler things can still get overlooked. Make sure that thermostats are located away from drafts, direct sunlight or heat from nearby equipment. Ques-tion your mechanical contractor to guarantee that temperature control zones do not combine areas with very different heating or cooling loads.
Manual damper con-trols, still used frequently for cost savings, must have their full open and closed positions clearly and permanently marked. After final system balancing, mark their positions and lock or fix in place.
Mechanical equipmentAir handlers and filters come in
many configurations and price ranges. However, providing a few specifica-tions at the beginning can go a long way toward narrowing the field of choice and minimizing potential problems down the road. In general, system design must provide dehumidification during full occupancy as well as during partial cooling load conditions. Also, be kind to your maintenance workers and provide sufficient clearance on all sides of the equipment. If equipment is elevated, install walkways with railings for safe access. Here are our must-haves:
• Double-walledair-handlerhousingswith no internal insulation
• Well-sealedfilterbanksorcellstoprevent infiltration of bypass air
• Filterslocatedupstreamof thecool-ing coils
• Condensate pans located under the coils and made of stainless steel, also double walled (Design should be pitched, tapered and bottom drained to prevent water stagnation.)
• Drainlinesthatincludeastandardplumbing trap and discharge to the sanitary sewer (Also, provide an air gap to prevent back-drafting of sewer gases during times of low condensate flow.)
Filters and air-cleaning devicesAs we all know from maintaining our
home units, filters are critical to system performance. Better filters remove more dust, pollen, spores, etc., but they must match the system. It is harder to push air through more efficient filters. We recommend pleated, extended-surface-area filters with a minimum dust spot efficiency of 60 percent (MERV 11). Routine checking and replacing is also paramount.
New technologies continue to emerge for IEQ and HVAC systems. Ultravio-let (UV) lighting arrays for controlling microbial growth in drain pans and on coil surfaces appear to work well in our experience, but they must be specifically designed for use in air-handling units. Other devices include negative and/or positive ion generators, electrostatic precipitators, and ozone generators. We
“Make sure that thermostats are located away from drafts, direct sunlight or heat from nearby equipment.”
LAB SAFETY
strongly recommend a thorough review of all available independent data prior to choosing one of these designs.
Outside air intakesASHRAE Standard 62 recommends
minimum amounts of outside air to mix with conditioned air in order to maintain good indoor air quality.1 These are based on types of use and occupancy. Locat-ing fresh-air intakes during design must prevent introduction of pollutants into the building’s air supply. You must en-sure adequate distance between outside air intakes and all potential pollution sources. Give careful consideration to driveways, exhaust outlets, plumbing vents, hood exhausts, cooling towers, streets and highways, and garbage storage and treatment areas. In addition to keep-
ing clear of pollution sources, protect intakes from rain intrusion by installing louvers or rain hoods. Preclude birds and other unwanted animals by install-ing ¼-inch mesh screening. Modulated damper systems should account for occupancy or contain mechanical stops to ensure a minimum supply of fresh air. Finally, when planning your new build-ing design, consider outside air intakes of all adjacent existing buildings so construction activities do not impact oc-cupants in those neighboring buildings.
Comments or questions are always wel-come. Contact [email protected].
References “Ventilation for Acceptable Indoor Air 1. Quality.” American Society of Heat-
ing, Refrigerating and Air-Condition-ing Engineers (ASHRAE) Standard 62-2009. Atlanta, GA.“Industrial Ventilation: A Manual of 2. Recommended Practice for Design.” American Conference of Governmen-tal Industrial Hygienists (ACGIH). 26th edition, 2007. Cincinnati, OH.
Vince McLeod is an American Board of Industrial Hygiene–certified industrial hy-gienist and the senior industrial hygienist with the University of Florida’s Environmental Health and Safety division. He has 22 years of occupational health and safety experience at the University of Florida, and he specializes in conducting exposure assessments and health hazard evaluations for the university’s 2,200-plus research laboratories.
Discover 70 years of innovation
at www.mybuchi.com
NIR Spectroscopy
Preparative Chromatography
With the same innovative spirit that made us the market leader in evaporation, Buchi has also contributed to the advancement of many scientific processes, developing state-of-the-art instrumentation used in R&D and QC Labs across the Academic, Pharmaceutical, Environmental, and Food & Feed industries.
Spray Drying Automated Kjeldahl AcceleratedExtraction
BUCHI Corporation 1-877-MYBUCHI New Castle, Delaware Quality in your hands
Rotary Evaporation
0174 Discover Advert hlfpghorz l1 1 4/13/2010 4:34:28 PM

LAB SAFETY
SAFETY TIPHAVE A WRITTEN SAFETY POLICYThis is the cornerstone of a good safety pro-gram. It's a statement endorsed and supported by the administration that speaks to the funda-mental responsibilities for health and safety in the academic institution or company.
For example: "It is the responsibility of our (name of company or institution) and its em-ployees to ensure that our business activities (or educational programs and other activities) protect and promote the health and safety of our customers (students), our employees, and the environment."
Your department may want to draft a sample policy statement for recommendation to your administration or board of education. It is virtually impossible to have an excellent safety program without their support. Your written safety policy will provide the foundation of your safety program.
Policy statements of this type need to be signed by the highest ranking official of the organiza-tion, dated, laminated, and mounted in the entrance of every building.
Source: Kaufman, James A., Laboratory Safety Guidelines - Expanded Edition, The Laboratory Safety Institute, www.labsafetyinstitute.org
• New Ergonomic Design–The most comfortable pipettor you ever laid a hand on
• New Power Source for Uninterrupted Extended Operation–Can be charged while in use
• New Ultra Quiet Precision Pump–Great control for aspiration or dispensing
Building on the years of experience of providingstate-of-the-art tools that make your job in thelaboratory safer, easier, and more convenient, thePipet-Aid XP2 delivers more. The ergonomic designis more comfortable to handle. The new powersource enables more convenient extended operationand the new more powerful pump provides greatcontrol and quieter operations. The unit is suppliedcomplete with a power/supply charger, 4 extrafilters, a holster-type wall bracket, and a stand.
The NewPortablePipet-Aid® XP2
Advances theStandards for
Pipetting Comfort,Convenience,
and Control...Again.
The Developers of the Original Pipet-Aid
The Evolution ofPipetting Xcellence
Continues
MADE IN USA
For a copy of our new catalog or moreinformation, call 800/523-7480 or visit our
website at www.drummondsci.com
500 Parkway, Box 700Broomall, PA 19008
3183 DSC 4x10.75:Layout 1 4/6/10 2:51 PM Page 1

56 Lab Manager May 2010 labmanager.com
BUSINESS MANAGEMENT
MANAGING OBSOLESCENCE WEIGHING THE BENEFITS OF TECHNOLOGICAL IMPROVEMENTS AGAINST THE COST OF A NEW INSTRUMENT TO DETERMINE ROI by Wayne Collins
While living in my house in Houston, Texas, I man-aged to keep the original builder’s quality air conditioner, which is heavily used for approximately seven months per year, operating for nearly sixteen years. I learned to make repairs myself, replaced parts, and even did a complete rewiring when a relay fault started a fire and burned the original wiring. When the system was finally beyond repair, I grudgingly spent several thousand dollars to purchase a new high-efficiency system. It was only after I received the first electric bill after installation of this system that I realized how foolhardy I had been to preserve the original equip-ment for so long. The more than 50 percent reduction in the electric bill with the high-efficiency system means I would have saved thousands of dollars (not to mention hours of my time) if I had only replaced the old inef-ficient system years earlier—but the fact that it kept me cool in the summer heat, coupled with the expense of a new system, blinded me to the cost that I was incurring. As lab managers, how often do we make this same mistake by continuing to use lab instruments long after they are obsolete, simply because they continue to operate? These days, when budgets are shrinking and cost control is at the top of managers’ business issues, it is time to take a close look at these hidden costs of maintaining obsolescence.
While it is natural to focus on the high cost of replacing an instrument, the business benefits of updating obsolete technology might easily be overlooked. Technological improvements in instrumentation continue to bring real benefits that accrue from speed of analysis, increased capacity, labor savings, operational efficiencies, higher precision, greater ease of use, enhanced reliability, lower maintenance requirements, improved safety, reduced environmental impact, and numerous other intangibles.
It behooves lab managers to weigh these types of benefits against the cost of a new instrument, to determine if re-placement will yield a positive return on the investment. Table 1 summarizes some of the technological advantages that might come with a new instrument, as well as a few of the possible business benefits that it might deliver for the laboratory. Instrument salespeople can easily point out which technological advantages apply to their products, and the lab manager can estimate the worth of
the benefit to the business. So, let’s take a brief look at some of the advantages that might be realized by adopting these new technologies, in order to understand how they might affect lab operations.
Labs that measure customer satisfaction usually find faster sample turnaround time to be the number one improvement
opportunity, or if not number one, almost surely among the top three. This is true even for labs that most manag-ers would agree provide excellent service. Simply put, you can never get the answer back to the customer too soon. So, faster analyses are highly valued by lab customers who can use the data to solve problems or make deci-sions more quickly. In addition, faster analyses add value for the laboratory itself by extending the capacity of the instrument to allow more tests to be performed on it each day. And speedier methods may even allow testing to be consolidated onto fewer instruments, which can reduce maintenance, consumables, regulatory documentation requirements, and overall costs.
So, how much increase in the speed of analysis might a manager expect to gain by employing a new technology? Recognizing the benefits that accrue from speed, instru-ment manufacturers have developed technologies that in some cases reduce analysis time by as much as an order of magnitude. Rapid liquid chromatography and high heat-
“Manufacturers have developed technologies that in some cases reduce analysis time by as much as an order of magnitude.”
Moving science forward
Emotional reactions to instrumentation from scientists are rare.
Yet with Thermo Scientific NanoDrop Spectrophotometers, they
are becoming commonplace. That’s because scientists who
own a NanoDrop™ are passionate about its simplicity. These
instruments reduce analysis time and minimize sample waste
with fast, easy and accurate micro-volume nucleic acid and
protein sample quantitation. Just ask Dr. Shikov:
“The speed is really the best. NanoDrop really expedites the
process. That speaks to the quality of the instrument. You can
quantitate the sample, and determine its purity—in seconds.
With NanoDrop, you save time and save sample, because
no dilutions are required.”
“NanoDrop is irreplaceable in labs of biochemists and biologists.”
Try any NanoDrop instrument for free:* www.thermo.com/nanodrop
“ It’s the world’s greatest spectrophotometer!” —Sergei Shikov, Ph.D.
Thermo Scientific NanoDrop UV-Vis Spectrophotometers offer easy, reliable micro-volume analysis, with sample size as low as 0.5 µl and measurement time of less than 5 seconds—no dilutions.
© 2
010
Ther
mo
Fish
er S
cien
tific
Inc.
All
right
s re
serv
ed. A
ll tr
adem
arks
are
the
prop
erty
of T
herm
o Fi
sher
Sci
entif
ic In
c.
and
its s
ubsi
diar
ies.
*A
vaila
ble
in U
S &
Can
ada
only
.

58 Lab Manager May 2010 labmanager.com
BUSINESS MANAGEMENT
ing rate/low thermal mass ovens in gas chromatography are but two examples of technologies that can significantly increase the speed of analysis without sacrificing test quality (in fact, possi-bly improving it). For commercial labs, speed translates directly into incremental revenue through higher volume and is easily assigned a dollar value. For captive labs, speed also has a monetary value, although pricing is less transparent. For example, speed might be priced in terms of reductions in analyst labor, typically valued at approximately $80/hour, or in terms of the even more valuable time saved in regaining control of an out-of-spec plant process, which can be worth tens of thousands of dollars per hour. It is hard to imagine a lab in which speed of analysis is not highly valued.
The “green” movement, along with other practical requirements, has inspired adoption of technologies that permit much smaller sample sizes without sac-rificing measurement quality. Adoption of these technologies has both safety and environmental advantages for organiza-tions. Reduced sample requirements can significantly reduce personnel exposure to potentially hazardous chemicals during sample preparation while also reduc-ing waste disposal quantities and costs. Organizations are usually very receptive to funding these “green” initiatives, which can garner public praise for displaying so-cial responsibility in the conduct of their business while simultaneously lowering their operating costs—a double win. Technological advances that positively affect safety and/or environmental per-formance typically provide very strong business justifications for replacement and are sometimes expedited through the capital budget process.
One of the paradoxes of the laboratory instrument market is that as the technol-ogy has become ever more complex and sophisticated, the instruments have actu-ally become easier to use. Nearly every
Technological Advantage Possible Business BenefitSpeed of Analysis Allows more tests per day to increase revenues
Faster sample turnaround time increases customer satisfactionPermits consolidation of testing onto fewer instrumentsDelays or eliminates capital expenditure to increase capacity
Increased Capacity More tests per dayIncreased revenueNeed for fewer instrumentsLess maintenance, labor and expenseSimplified validation documentation
Decreased Labor Required Savings of ~$80 for each hour of technician time savedFrees time for other work or for improvement projectsShift some data interpretation from chemists to lower cost technicians
Safety Improvement Reduced exposure of personnel to solvents or other chemicalsReduced fire/explosion hazardReduced risk with latest safety devices and safeguards
Increased Precision Reduced risk of analytical errorReduced lab contribution to process capabilityReduced need for replicates to achieve required confidence levelLess risk of false positives or negativesLess risk of release of out-of-spec product due to lab errorReduced warranty claims and tech service expense due to release of faulty product
Ease of Use Reduced operator training timeLess need for expert helpFacilitates crosstraining to increase flexibility to shift resources
Higher Reliability Less down timeLower maintenance requirementsLess risk of loss of critical data
Lower Environmental Impact Supports CMA’s Responsible Care programSupports ISO 14001 initiativesReduced waste disposal volume and expenseReduced lab contribution against environmental operating permit
Enhanced Laboratory Image Improved staff morale and pride in workplace with modern equipmentHigher customer confidence in resultsReduction in retest requests and duplicate blind submissions to check test quality
Decrease in Expendable Costs Reduced chemical costs with small volume samplesLonger lasting expendables such as chromatography columns
Decrease in Operating Costs Improved energy efficiencyReduction in other services such as water, gases, or ITLess bench space required
Additional Customer Benefits Better quality and more timely results to control processesFaster resolution of customer problemsFaster time to market for new productsOpportunity to use increased capacity for additional testingQuicker decisions
Accessories Accommodates latest automated accessories for sample preparation and testing to improve precision and reduce labor requirements
Table 1. Common business benefits derived from introduction of new technology

instrument now has computer-running software that not only optimizes the performance of the instrument but also aids in the interpretation of the data. It is now possible for technicians to do material identifications using spectral libraries or to determine protein structures that required the skills of a highly trained chemist just a few years ago. Software is generally the first part of an instrument that becomes obsolete and thus become a major impediment to increasing productivity. This type of obsolescence is an especially insidious problem, becomes older instruments can lock labs into specific versions of software packages that are interfaced with other computer systems such as the LIMS, thereby limiting flexibility to upgrade. It is not uncommon to find labs that are held captive by obsolete software that severely limits their operational choices. Updating software should be a high priority because of both the advanced intelligence of newer versions and the potential reduction in the risks that are associated with maintaining obsolete versions. And lab managers can sometimes get these software upgrades funded through the IT budget rather than using lab funds.
Declining reliability is a sure sign of the impending need for replacement. As instruments age beyond a criti-cal point, it is not uncommon to experience rising mainte-nance costs, the need for more frequent calibrations, more downtime, and other problems requiring intervention. Manufacturers may halt support for the instrument, and parts availability may become problematic. Prudent lab managers heed these signs as warnings that it is time to replace the instrument. However, relying solely on this re-placement approach can be risky. First, many labs do not have an adequate data gathering and reporting structure to accurately identify the point at which reliability begins to decline, so the instrument may fail beyond repair before action is taken. Second, funding a new instrument typically requires a lead time of six months to a year in order to usher it through the capital budget process and obtain the necessary approvals. If the lab has no backup instrument, then it is best not to rely solely on conditional indicators to schedule replacement, lest customers be left without the data needed for their operations. Table 2 suggests several warning signs that should alert the lab manager to take a closer look at older instruments. These signs in and of themselves do not constitute grounds for replacement, but they should stimulate conversation about the state of obsolescence of the instrument.
Tax codes recognize the need for obsolescence in order for a business to remain competitive in the marketplace—the purpose of depreciation is to set aside funds to
replace equipment as it wears out or otherwise becomes obsolete. This does not imply that lab instruments are expected to be unfit for use beyond the time that they have been fully depreciated or that it is not good busi-ness practice to continue to use them. The depreciation schedule or rate at which assets are written off is driven primarily by financial considerations and is only loosely related to the actual useful lifetime of the item. However, full depreciation should signal the lab manager to begin looking at the business case for replacement, regardless of how well the instrument continues to function. Also, the business case must consider that the depreciation deduc-tion for the new instrument will likely recover as much as 40 percent of the initial cost in tax savings over the scheduled period.
One of the best approaches for proactively manag-ing obsolescence is to develop and maintain a multiyear capital plan that explicitly designates a specific portion, perhaps 20 percent, for instrument replacement each year. The list of fully depreciated equipment obtained from
BuSineSS ManageMent
Ready-To-Use Analytical Solutions & Standards
RICCA gives you the most accurate results for your Environmental testing
Test (APHA/EPA) Cat. No. DescriptionAlkalinity 7185-16 Sodium Carbonate, 0.0500 NormalBiomedical Oxygen Demand 3255-16 Glucose-Glutamic Acid SolutionBiomedical Oxygen Demand 5800-16 Phosphate Buffer Solution, pH 7.2Chloride 6860-16 Silver Nitrate, 0.0141 NormalColor 2230-4 Color Standard, Color=500 UnitsCyanide 2543-16 Cyanide Standard, 1000 ppm CNFluoride 3170-16 Fluoride Standard, 10 ppm FFluoride 8670-16 Total Ionic Strength Adjustment Buffer (TISAB)Hardness 1780-16 Calcium Chloride Standard, 1mL=1mg CaCO3
Hardness 2700-16 EDTA, 0.0100 MolarHardness 9200-16 Water Hardness BufferNitrogen (Ammonia) 5455-16 Nitrogen Standard, 1000 ppm NH3
Nitrogen (Ammonia) 7470-32 Sodium Hydroxide, 10.0 NormalOxygen (Dissolved) 540-16 Alkali-Iodide-Azide Reagent, AlsterbergPhosphorus 3580-16 Hydrochloric Acid, 50% (v/v) AqueousPhosphorus 5830-16 Phosphate Standard, 50 ppm P as SO4
Sulfate 8110-16 Sulfate Standard, 100 ppm SO4
Total Organic Carbon (TOC) 1847-16 Carbon Standard, Organic, 1000 ppm CTurbidity/Nephelometric Method 8830-16 Turbidity Standard, 4,000 NTU
1-888-GO-RICCA • [email protected]
FREE catalog available at www.riccachemical.com

labmanager.com
BUSINESS MANAGEMENT
the organization’s financial branch can identify candidates for this budget. Lab managers typically assign the chem-ist responsible for the depreciated instrument the task of evaluating potential replacement candidates by tabulating advantages such as those in Table 1. Assigning an approxi-mate dollar value to the business benefits for each item and comparing that with the cost of replacement will produce a prioritized list based on return on investment. All that remains is to stage replacement of the highest-priority items (that is, those with the greatest financial po-tential over a three-to-five-year period) according to the expected available funds that can reasonably be devoted to replacement for each year. This simple evaluation process has the added advantage of providing excellent input into the development of the business case that will eventually be required to justify the selected capital items based upon the value that they bring to the business. And since replacements are scheduled over several years, the process provides a mechanism for maintaining a reason-able balance between acquisition of new capabilities and
replacement of current assets within the allotted funds. Keeping the lab furnished with modern, technologically
advanced equipment not only keeps laboratory operations competitive by increasing productivity; it also provides such intangible benefits as staff pride in the workplace and enhanced stature with customers. It is understandable that one might have a special fondness for those old reli-able lab workhorses that have served so well for so many years, but lab managers must recognize that this devotion comes at a cost. And a five-year capital plan to quantify the cost and manage obsolescence is just smart business.
Wayne Collins, Ph.D., is worldwide marketing manager, Energy & Chemi-cals, Agilent Technologies, Chemical Analysis Group and serves on the Board of Directors of the Association of Laboratory Managers (ALMA). He can be reached at [email protected] or by phone at 281-750-1763.
Screening Criteria Potential Risk Point
Age Electronic instruments aged 7 years or more
Depreciation Fully depreciated equipment
State of Technology One or more generations behind current
Maintenance Trend Maintenance requirements increasing
Maintenance Support Instrument no longer supported by manufacturer
Reliability Down time increasing
Precision Order of magnitude less than current
Safety Absent current improvements
Software One or more revisions behind current
Backup Capability No backup instrument available
Serviceability Lacks convenient service features
Automation Does not support latest automation
Expendable Usage Does not support minimization strategy
Environmental Does not support waste reduction strategy
Parts Availability Declining number of sources
Service Contracts Contracts no longer available
Manufacturer’s Support Notification that support is ending
Accessories Does not support latest accessories
Competitive Declining presence in the industry
Table 2. Possible warning signs of obsolescence
DIG DEEPERDIG DEEPERDIG DEEPERDIG DEEPERThis month’s “Dig Deeper” video features Sara Goudarzi, NYC-based freelance writer and regular contributor to Lab Manager Magazine’s “Perspective On” series. Sara holds an M.A. in journalism from New York University and has published more than 300 articles. Her writing has appeared in National Geographic News, Space.com, LiveScience.com, Science World Magazine, The Christian Science Monitor, CNN.com, Scientifi c American Mind, among others.
In this month’s “Perspective on: An Environmental Lab” on page 48, Sara interviewed Bob Dempsey, the laboratory manager of the corporate branch of Advanced Environmental Laboratories, Inc. located in Jacksonville, Florida. “The Jacksonville lab started with two chemists who worked on UST sites and performed quick-turnaround remediation projects. Now with 35 employees, the lab handles about 12,000 projects each year, including wastewater analysis and investigating Superfund sites.”
To meet Sara and learn more about her interview with Advanced Environmental Laboratories’ Bob Dempsey, visit www.qorpak.com/labmanager.
Look for more “Dig Deeper” video links in upcoming issues of Lab Manager Magazine. This new online feature is designed to offer a more in-depth exploration of the ideas behind particular articles and unique information that only the authors and “experts” themselves can provide.
61 May 2010 Lab Manager
BuSineSS ManageMent
Lab managers, aided by the recent economic climate, have seen their roles expand beyond science in order to ensure that the lab is a strategic entity that runs like a business. They are charged with implementing strategic decisions to drive lab productivity and manage costs, particularly as they relate to the lab’s major capital assets: laboratory instruments.
The greater interest in capital assets correlates with a greater in-terest by procurement in how lab managers justify decisions regard-ing assets. Quantifiable data is key, and that data increasingly needs to be insightful. It’s not only how many instruments you have but also how they are being utilized and keeping track of service, the compliance program and overall cost.
When weighing redeployment, disposition and pro-curement questions, the answers are not always obvious given the potential scenarios below:
• TheHPLCassetpurchasedsevenyearsagomaynolonger be cost-effective to maintain when compared with one bought two years ago. Would it be better used in a lower-throughput research lab? Or should it be disposed of via an auction or dumpster?
• Onelabisutilizinganasset80percentof thetimewhile another asset is being utilized only 15 percent of the time. Can the second asset be put to better use elsewhere in the lab? Or at another corporate site?
• Alabneedshigh-throughputforensicanalysis.Itscur-rent instrument is meeting demand requirements, but a new instrument has come on the market that offers improved sample handling and temperature stabiliza-tion. Would the increase in throughput provide dif-ferentiation opportunities or allow additional work to be secured to justify purchase of the newer model?
• Anewprocurementdecisionisunderconsiderationfor a given technology. How does vendor A compare to vendors B and C across a variety of different criteria,
including service cost, uptime and cost of operation?
Answering these questions requires data—as does making decisions about redeployment and disposition of assets—as mergers and acquisitions, budget tightening and shifting agendas alter the landscape. Yet, at the same time, many labs do not even have an accurate inventory of instruments.
Asset data and data mining are new endeavors for many labs and for good reason: Instrument data is typ-ically inconsistent, non-standardized and stored in multiple data sources, making it difficult to mine in order to provide business insight.
Historically, asset management has been an ad hoc process in labs, and the data reflects it. Until recently, many labs deployed an OEM model for service, turning to the manufacturer of each instrument to provide the necessary work. The process, typically fragmented and disconnected, not surprisingly created a data stream with the same characteristics. Data is housed in multiple non-integrated systems and provides limited insight, frequently limited to:
• Financial data, such as purchase price and depreciation
• Servicehistory
• Servicecosts
• Servicecontracts
• Consumablescosts
• Compliancestatus
With data non-standardized and siloed asset by asset, vendor by vendor, it is difficult to pull together and analyze.
Without cohesive data, analysis of assets and costs is a rudimentary survey of service contracts, repair activities, instrument value and cost to maintain an instrument in good working order. Most likely the data will be inconsistent from OEM to OEM and from site to site and will be filled with gaps. Further-more, the information will be accurate only for the point in time when the review takes place. Rather
a MuLti-vendoR SeRviCe ModeLuSing data to dRive aSSet PRoCuReMent, RedePLoyMent and diSPoSition by gary e. grecsek
“… many labs do not even have an accurate inventory of instruments.”
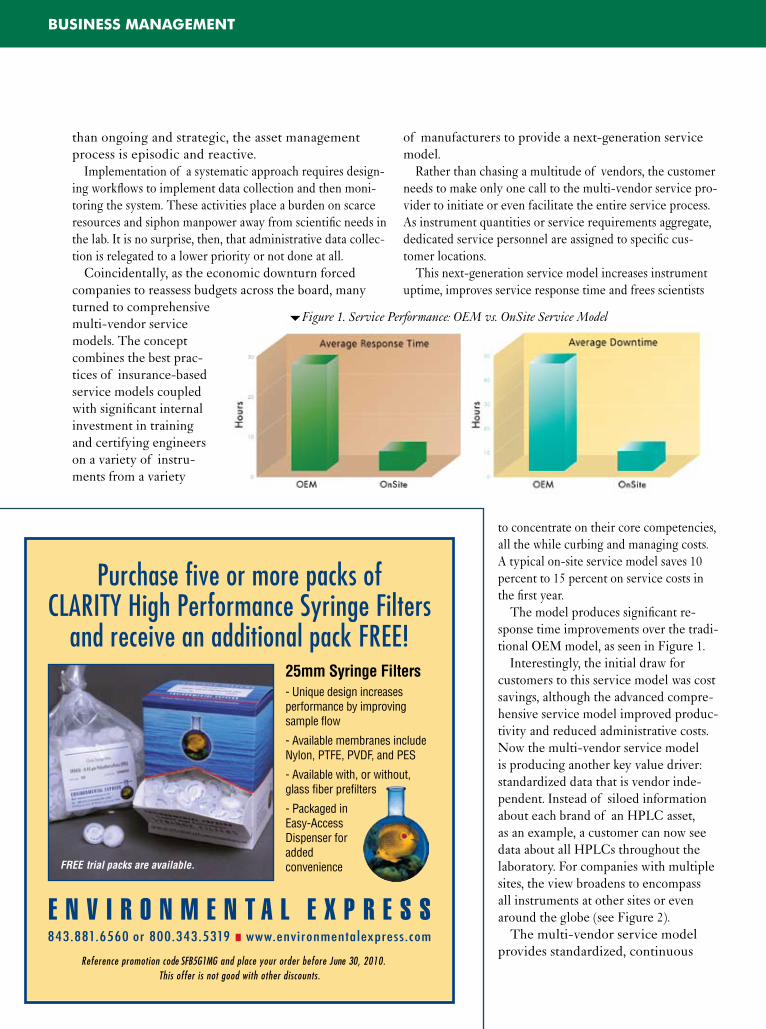
BuSineSS ManageMent
than ongoing and strategic, the asset management process is episodic and reactive.
Implementation of a systematic approach requires design-ing workflows to implement data collection and then moni-toring the system. These activities place a burden on scarce resources and siphon manpower away from scientific needs in the lab. It is no surprise, then, that administrative data collec-tion is relegated to a lower priority or not done at all.
Coincidentally, as the economic downturn forced companies to reassess budgets across the board, many turned to comprehensive multi-vendor service models. The concept combines the best prac-tices of insurance-based service models coupled with significant internal investment in training and certifying engineers on a variety of instru-ments from a variety
of manufacturers to provide a next-generation service model.
Rather than chasing a multitude of vendors, the customer needs to make only one call to the multi-vendor service pro-vider to initiate or even facilitate the entire service process. As instrument quantities or service requirements aggregate, dedicated service personnel are assigned to specific cus-tomer locations.
This next-generation service model increases instrument uptime, improves service response time and frees scientists
to concentrate on their core competencies, all the while curbing and managing costs. A typical on-site service model saves 10 percent to 15 percent on service costs in the first year.
The model produces significant re-sponse time improvements over the tradi-tional OEM model, as seen in Figure 1.
Interestingly, the initial draw for customers to this service model was cost savings, although the advanced compre-hensive service model improved produc-tivity and reduced administrative costs. Now the multi-vendor service model is producing another key value driver: standardized data that is vendor inde-pendent. Instead of siloed information about each brand of an HPLC asset, as an example, a customer can now see data about all HPLCs throughout the laboratory. For companies with multiple sites, the view broadens to encompass all instruments at other sites or even around the globe (see Figure 2).
The multi-vendor service model provides standardized, continuous
Figure 1. Service Performance: OEM vs. OnSite Service Model
25mm Syringe Filters- Unique design increasesperformance by improvingsample flow
- Available membranes includeNylon, PTFE, PVDF, and PES
- Available with, or without,glass fiber prefilters
- Packaged in Easy-Access Dispenser for added convenience
E N V I R O N M E N T A L E X P R E S S843.881.6560 or 800.343.5319 n www.environmentalexpress.com
Purchase five or more packs ofCLARITY High Performance Syringe Filters
and receive an additional pack FREE!
FREE trial packs are available.
Reference promotion code SFB5G1MG and place your order before June 30, 2010. This offer is not good with other discounts.
Lab Mgr-510:Layout 1 4/19/10 3:31 PM Page 1
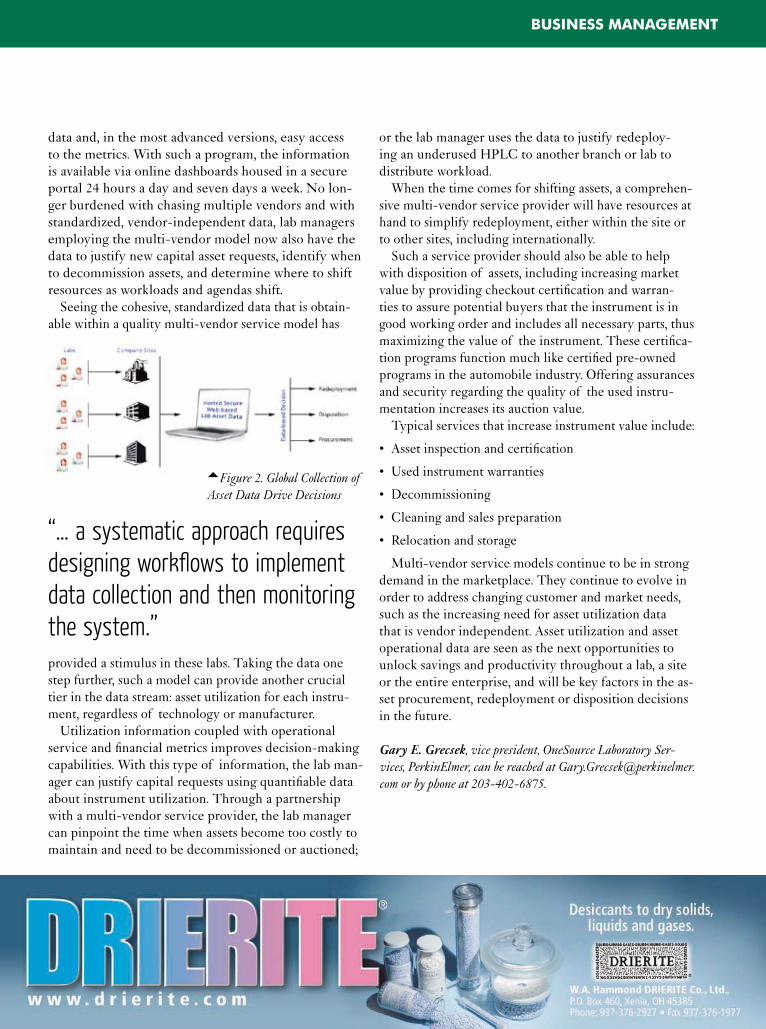
BuSineSS ManageMent
data and, in the most advanced versions, easy access to the metrics. With such a program, the information is available via online dashboards housed in a secure portal 24 hours a day and seven days a week. No lon-ger burdened with chasing multiple vendors and with standardized, vendor-independent data, lab managers employing the multi-vendor model now also have the data to justify new capital asset requests, identify when to decommission assets, and determine where to shift resources as workloads and agendas shift.
Seeing the cohesive, standardized data that is obtain-able within a quality multi-vendor service model has
provided a stimulus in these labs. Taking the data one step further, such a model can provide another crucial tier in the data stream: asset utilization for each instru-ment, regardless of technology or manufacturer.
Utilization information coupled with operational service and financial metrics improves decision-making capabilities. With this type of information, the lab man-ager can justify capital requests using quantifiable data about instrument utilization. Through a partnership with a multi-vendor service provider, the lab manager can pinpoint the time when assets become too costly to maintain and need to be decommissioned or auctioned;
or the lab manager uses the data to justify redeploy-ing an underused HPLC to another branch or lab to distribute workload.
When the time comes for shifting assets, a comprehen-sive multi-vendor service provider will have resources at hand to simplify redeployment, either within the site or to other sites, including internationally.
Such a service provider should also be able to help with disposition of assets, including increasing market value by providing checkout certification and warran-ties to assure potential buyers that the instrument is in good working order and includes all necessary parts, thus maximizing the value of the instrument. These certifica-tion programs function much like certified pre-owned programs in the automobile industry. Offering assurances and security regarding the quality of the used instru-mentation increases its auction value.
Typical services that increase instrument value include:
• Assetinspectionandcertification
• Usedinstrumentwarranties
• Decommissioning
• Cleaningandsalespreparation
• Relocationandstorage
Multi-vendor service models continue to be in strong demand in the marketplace. They continue to evolve in order to address changing customer and market needs, such as the increasing need for asset utilization data that is vendor independent. Asset utilization and asset operational data are seen as the next opportunities to unlock savings and productivity throughout a lab, a site or the entire enterprise, and will be key factors in the as-set procurement, redeployment or disposition decisions in the future.
Gary E. Grecsek, vice president, OneSource Laboratory Ser-vices, PerkinElmer, can be reached at [email protected] or by phone at 203-402-6875.
Figure 2. Global Collection of Asset Data Drive Decisions
“… a systematic approach requires designing workflows to implement data collection and then monitoring the system.”

64 Lab Manager May 2010 labmanager.com
teChnoLogynewSThe latest equipment, instrument and system introductions to the laboratory market
anaLytiCaL
Single Quadrupole LC/MS 6150B Series
Scans at 10,000 amu per second, while maintaining excellent data quality•Jet Stream technology uses super-heated sheath gas to focus the ion stream entering the •MS, resulting in enhanced sensitivityThe Jet Stream produces a stronger signal with lower relative standard deviation at the •limit of detectionMinimizes the need to rerun samples in multiple ionization modes to look for differences•
Agilent Technologies www.agilent.com
Portable FTIR Analyzer Grabner IROX Diesel
Compact mid-FTIR spectrometer features •automatic optical realignment during warm-upMeasures the complete absorbance spectrum•Predicts properties such as Cetane Number •and Cetane IndexEmploys cluster analysis and multi-linear regression•
AMETEK Petrolab Company www.petrolab.com
Sample Concentrator SampleGenie™
Concentrates samples, without loss of volatile components, into a small GC or HPLC vial•Eliminates the need for reformatting samples after drying•Enables removal of steps from a centrifugal •evaporator/HPLC fraction pooling protocolAble to handle most solvent types•
Genevac www.genevac.com
Water Purification for Ion Chromatography ICW-3000™
Produces a constant and reliable source of ultrapure water for •Dionex IC systemsProvides a continual flow of ultrapure water to the eluent •generator and regenerant lines of the suppressor, reducing carbonate content and eliminating the need for heliumPlug-and-play installation: only two tubes and one power cord to connect•
Millipore www.millipore.com
Fused Bead Sample Preparation System Eagon 2
No gas supplies, cooling water or compressed air •required—just a simple electrical connection‘Cold-to-cold’ operation cycle protects users from •hot materials and surfaces at all timesOuter doors are safety interlocked throughout the •fusion cycle to shield users from moving partsFeatures push-button optimization of tempera-•ture setting, oxidation steps, mixing and cooling
PANalytical and XRF Scientific www.panalytical.com
www.xrfscientific.com
Air Compressors and Generators Advanced Analytical Laboratory Products
Designed for LC/MS and GC•Provide a reliable, safe and high-performance solution for onsite hydrogen, nitrogen and •zero air generatorsAirComp, AirGen, NiGen and HyGen can operate as independent units and as a completely •compatible and stackable system
Proton Energy www.protonenergy.com
SuPeRCRITICAL FLuId ChRoMAToGRAPhy SySTeMTenfold Increase In sensITIvITy
The 1200 Series Analytical Supercritical Fluid Chroma-tography (SFC) System combines Agilent’s 1200 Series Rapid Resolution LC System with the Aurora SFC Fusion A5 for conversion of gaseous CO2to the supercritical state.
A tenfold increase in sensitivity is achieved by a combined Aurora and Agilent solvent delivery system, as well as a high-pressure SFC detector cell. The 1200 Series SFC uses standard-grade carbon dioxide instead of expensive liq-uid SFC-grade carbon dioxide, lowering operating costs.
Stefan Schuette, Agilent Senior Marketing Director, Liquid Chromatography Business, says SFC has several benefits over traditional HPLC, including significantly reduced consumption of organic solvent and ultrafast separation at moderate operating pressures using conven-tional particle size columns. “SFC results in high separation efficiency due to improved mass transfer,” he said. “It provides higher sensitivity compared to existing systems due to low baseline noise and pulse-free metering.”
SFC is similar to normal phase HPLC, but most of the mobile phase is replaced by liquid CO2. Also, Schuette added, the 1200 Series SFC can achieve a much shorter analysis time compared to stan-dard HPLC, “due to low viscosity and superior diffusion characteristics of supercritical mobile phase.”
In addition to significant cost savings, higher flow rates are achieved with proportional increases in numbers of samples that can be run per shift.
For more information, visit www.agilent.com and www.aurorasfc.com. Stefan Schuette, Senior Marketing Director, Liquid Chromatography Business, can be reached at [email protected].
Pr
od
uc
t SP
otl
igh
t

65 May 2010 Lab Manager
Analytical Balance PW
Measures to 0.1 mg•Bi-directional RS-232 interface enables data transfer •from the balance to computers or printersFeatures solid, durable metal construction and •internal motorized calibrationBuilt-in applications include density, percentage and •comparison weighing
Adam Equipment www.adamequipment.com
TECHNOLOGY NEWS
ultra-high Performance LC Nexera
Optimized to enable analysis at pressures up to 130 MPa•Features a 10-second injection time and 4,600-plus sample capacity•Autosampler offers fixed-loop injection for •ultra-fast separation and minimized peak widthIntelligent Heat Balancer (IHB) minimizes band •broadening during high-temperature analysis
Shimadzu Scientific Instruments www.ssi.shimadzu.com
high-Resolution ToF Mass Spectrometer FasTOF™
Provides mass resolution of 4,000 to 7,000 •FWHM at m/z 281 Th, and a full range mass spectra up to 500 HzPulsed mass calibration system compensates for •temporal drift in mass calibration parametersSensitivity at a full mass range of 100 Hz is S/N •100:1 for 1.0 pg of OFN injected on-columnSupports a range of applications including metabolomics, fuels, flavors and fragrances•
Zoex Corporation www.zoex.com
Polypropylene ductless Fume hoods E-Series
Capable of enclosing equipment up to 52” tall•Feature an upper folding sash and lower access doors for •easy ergonomic access, allowing equipment to be easily inserted or removed from the enclosureFumes, vapors and particulates are filtered via bonded •carbon and/or HEPA filtration
AirClean Systems www.aircleansystems.com
ICP-MS SPECTRO MS
Records the entire elemental spectrum between •lithium and uranium for every analysisAn electrostatic analyzer and permanent magnet •directs ions onto a focal plane without additional scanning of the ion beamA novel ion optic transports ions from the plasma •into the mass spectrometer, removing neutral particles and photons from the beam
SPECTRO www.spectro.com
GC Columns TraceGOLD Capillary Columns
Ultra-low bleed and extremely inert, ensuring that the best peak shapes are obtained and •that the risk of contamination within the mass spectrometer is minimizedProvide consistent run-to-run and column-to-column reproducibility•High sensitivity levels are obtained with low baseline noise, for improved detection limits•
Thermo Fisher Scientific www.thermo.com/columns
Gas Regulators Analytical Specialty Gas
Made from solid bar stock with a needle valve built •in the regulator body to reduce internal volumeFeature stainless steel diaphragms for consistent, •high-purity resultsCheck-valve cylinder connection option prevents •contaminants from entering gas stream during cylinder change out
Airgas www.airgas.com
BaSiC LaB
Particle Size Analyzer LS 13 320
Now allows high-resolution, reproducible measurement of samples from .017 to 2000• µmAdds Rosin-Rammler and Folk & Ward Phi methods to its analytical capabilities•Tornado Dry Powder Dispersing System keeps samples intact•Reproducibility is typically better than one percent•
Beckman Coulter www.beckmancoulter.com
66 Lab Manager May 2010 labmanager.com
teChnoLogy newS
Nitrogen Generators HPN2 and UHPN2
Transform standard compressed air into 99.99% or 99.9999% nitrogen•Produce up to 1.1 lpm of UHP nitrogen gas and up to 2.0 lpm of •research grade purity nitrogen gasPressure swing adsorption removes O• 2, CO2 and water vaporUHPN2 series features a catalyst module to oxidize hydrocarbons from •inlet air supply
Parker Balston www.labgasgenerators.com
Automated Cell handler BioCel System
Fully automates cell-based ELISA procedures, reducing •the risk of human error and contaminationFeatures automated control of intermediate plate •batches, cell medium removal and absorbance detectionProvides unattended automation of approximately 500 •plates per run in a 3-day experimentCells can be plated and stored at a rate of 1 minute per plate•
Agilent Automation Solutions www.agilent.com/lifesciences/automation
environmental Testing Chamber MIR-554
Suitable for applications requiring a -10°C to 60°C environment, with control up to ±0.1°C •Chamber temperature uniformity is ±0.5°C•Automatic Setting Temperature Alarm alerts users of a temperature deviation of more •than 1°C to 5°CIncludes a high-precision microprocessor controller combined with a heater P.I.D.•
SANYO North America www.us.sanyo.com
Smooth Flow Chemistry Pump Asia Syringe Pump
Rated to 20 bar (300 psi) and chemical-resistant using •PTFE and glassCompact size, at 23 cm wide, makes it ideal for in-lab use•Offers two flow channels, each with a pressure sensor •and flow rate range from 1.0 µl to 10 ml/minPTFE pressure sensor automatically stops pumps in case •of over pressure
Syrris www.syrris.com
Biological Safety Cabinet 1300 Series A2 BSC
Uses a smaller aperture to extend the life of the HEPA filters by 20 percent•SmartFlow™ airflow compensation system maintains a safe environment for the user•Low airflow requirements can reduce noise levels to as low as 62 dB(A)•Requires only 180 watts to operate•
Thermo Fisher Scientific www.thermoscientific.com
Shaker-Mixer TURBULA®
Additional ball milling function can be used in both wet and dry applications•Model T2 F can accommodate container sizes up to 2L•Model T10 B features a silent pendulum swing drive to control mixing basket•Model T50 A can hold up to 165 lbs in a 55-liter container•
Glen Mills www.glenmills.com
Pocket ph Meter H-Series miniLab®
Features a virtually unbreakable non-glass silicon •chip sensor that gives stable readings in secondsIncludes a replaceable reference electrode •for meter longevityOffers water-resistant operation and economical •measurement of small sample volumesThree models are available, providing 1-, 2- or •3-point calibration and pH resolution up to 0.01 pH
Hach Company www.hach.com
Low Flow Constant Volume Fume hood UniFlow SE
Made of non-metallic, unitized composite for superior chemical resistance•Available in 4’, 5’, 6’ and 8’ widths•Face opening with airfoil provides uniform airflow •into the fume chamberVaraFlow baffle system directs airflow through fume •chamber to the exhaust outlet
HEMCO www.hemcocorp.com
LaB autoMation

67 May 2010 Lab Manager
TECHNOLOGY NEWS
Automated decapper for Screw Cap Tubes ScrewCap DeCapper
Automates opening and closing of screw-•capped tubes from 0.5 to 1.4 mlOpens a row of 12 tubes simultaneously•Decaps or recaps a complete rack of 96 screw-•capped tubes in less than one minuteOperates as a standalone system or integrated •with most automated pipetting systems
Micronic Europe BV www.micronic.com
QPCR and QRT-PCR Master Mix Kits Brilliant III
Feature a newly engineered Taq to minimize non- •specific amplificationUltra-fast reagents allow the completion of real-time •experiments in less than 40 minutesSupports a variety of applications, including gene expres-•sion analysis, pathogen detection and SNP genotyping
Agilent Technologies www.agilent.com
Automation for Real-time PCR CFX Automation System
Provides walk-away, high-throughput qPCR on CFX96™ and CFX384™•Benchtop plate handler can load up to twenty 384-well plates at a time on CFX384•CFX automation software can be used to define PCR protocols for multiple experiments at once•Upon run completion, users can be sent an e-mail notification with an attached data file•
Bio-Rad www.bio-rad.com
Benchtop Automation Orbitor and Momentum™ 2.0
Orbitor benchtop mover can rotate 360 degrees and connect a broad range of devices•Features stack and random access storage, as well as re-grip and plate de-lidding•Momentum™ 2.0 software facilitates predictive •modeling of accelerated dynamic processing schedules, ensuring robust automation control
Thermo Fisher Scientific www.thermo.com/automate
Precast Gels for Protein electrophoresis Mini-PROTEAN® TGX™ Gels
Based on a modification of the Laemmli buffer system, extending the gel shelf life to •more than 12 monthsCan be run to completion in as little as 12 minutes•Proteins from the gel can be transferred onto a •PVDF or nitrocellulose membrane in as little as 15 minutes
Bio-Rad www.bio-rad.com
Automated handling of Frozen Samples Datamatrix Cryo Rack
Cryo.s freezing tubes feature an identification •number encrypted in a Datamatrix codeUp to 48 Cryo.s freezing vials, all with unique •codes, can be scanned simultaneouslyData on the origin, type and age of samples is •saved and processed automaticallyAutomatic error-correction algorithm can make •partly damaged codes readable again
Greiner Bio-One GmbH www.greinerbioone.com
Multichannel Probe head for Liquid handling CO-RE 384 Shifted Tip Pickup (STP)
Picks up one column, one row or one tip without changing heads•Ideal for performing serial dilutions in 384- and 1,536-well plates•Employs CO-RE (Compressed O-Ring Expansion) technology and air-displacement pipetting•When used with Rocket Tips, the need for a second head and arm is eliminated•
Hamilton Robotics www.hamiltonrobotics.com
Life SCienCe
Microplate Reader Anthos 2010
Includes four filters that cover wavelengths for most common absorbance assays•A choice of software packages enables the user to connect to a PC and run both endpoint •and kinetic assays with easeSingle or dual wavelength measure-•ments plus kinetic measurements maximize analysis optionsIdeal for research, quality control •and diagnostics
Biochrom www.biochrom.co.uk
68 Lab Manager May 2010 labmanager.com
teChnoLogy newS
Molecule Characterization Biacore Sensor Chip CM7
Features high signal-to-noise ratios and improved detection•Employs a carboxymethylated dextran matrix covalently attached to gold film•Capable of binding proteins, nucleic acids, carbohydrates or small molecules to carboxyl groups •on the sensor surface
GE Healthcare www.gehealthcare.com
Robotic Peptide Library Synthesizer OVERTURE™
Able to run syntheses from 0.005 to 24 •mmol scalesFeatures 6 reaction blocks capable •of holding 96 (10 ml) or 24 (40 or 45 ml) reaction vesselsIndividual dispensers do not require rinsing •between deliveriesSafe-Response feature automatically drains and rinses the resin with solvent when an error occurs •
Protein Technologies www.peptideinstruments.com
uV Sterilization Cabinet GLE-UVSC
Ideal for molecular biology laboratories carrying out PCR reactions•Provides decontamination of reagents and equipment before carrying out PCR reactions•Four timer-controlled 15-watt UV bulbs enable the user to control the exposure time and •dose of high-energy UV irradiationSafety interlocks automatically turn off •bulbs when cabinet doors are opened
Scie-Plas www.scie-plas.com
hybrid Microplate Reader Synergy™ H4
Now HTRF® certified•Cisbio Bioassays guarantees that it meets or exceeds strict performance and functional •criteria for optimal HTRF® readoutCombination of Synergy H4 and HTRF® assays provides increased productivity and •extended flexibility
BioTek www.biotek.com
Programmable Peptide Synthesizer Syro Wave™
Capable of conventional room temperature •parallel peptide synthesis and microwave assisted peptide synthesisFeatures a separate cleavage and transfer •workstationIncludes disposable polypropylene reactor vials•Features vortex mixing in microwave cavity•
Biotage www.biotage.com
PRoTeIN MoBILITy MeASuReMeNTMeasure MacroMolecular elecTrophoreTIc MobIlITes
Rather than remaking an instrument designed to measure particulates, Wyatt Technology designed Möbiuζ™ to focus on the unique measurement of protein mobilities. It’s the only laser-based device that achieves reproducible measurements of the mobilities of large particles such as liposomes and VLPs, as well as traditionally challenging protein samples including antibody formulations, bovine serum albumin and lysozyme.
Möbiuζ™ incorporates several innovations to achieve fast and reliable measurements of mac-romolecular electrophoretic mobilities. Its patent-pending detection process achieves increased detection sensitivity: 2 mg/mL lysozyme or 0.5 mg/mL BSA.
The WyattQELS option, which uses backward scattered light to determine the sample translational diffusion coefficient, simultaneously measures the macromolecular hydrodynamic radius. Samples can be introduced by manual injection, an auto-sampler, syringe pump or an auto-titrator.
Featuring a non-invasive, laser light scattering method, Möbiuζ™ can measure molecular sizes below 2 nm, while a measurement time of less than 60 seconds helps to protect protein samples.
“You don’t want to disturb fragile samples,” said Vincent Hsieh, R&D Scientist at Wyatt Technol-ogy. “People might be enticed to apply up to 150 volts to a sample… a higher velocity makes it easier to measure, but this can damage the sample.”
The device also features temperature control and can perform automated temperature studies.
For more information, visit www.wyatt.com. R&D Scientist Vincent Hsieh can be reached at [email protected] or by phone at 805-681-9009 ext. 262.
Pr
od
uc
t SP
otl
igh
t
LiMS & SoftwaRe
Spectral databases Sadtler ATR Series
Basic Polymers: Contains 503 ATR/FTIR spectra of commercially available compounds•Inorganics: Includes 269 ATR/FTIR spectra of anions and polyatomic ions•Organometallics: Includes 176 ATR/FTIR spectra compiled for organometallic compounds•Monomers & Polymers with 742 spectra for 13C NMR method of analysis•
Bio-Rad www.bio-rad.com
69 May 2010 Lab Manager
TECHNOLOGY NEWS
MS-based Lipidomics Software LipidView™ Software
Includes lipid fragment database with more than 40 lipid classes and •23,000 lipid speciesEnables identification and characterization through database searching •of MS/MS fragmentionsAllows even novice users to easily find, identify and interpret lipid •species from mass spectrometry data from complex samples
AB SCIEX www.absciex.com
Sample Tracking Software Stacy
Users can report on samples by location or study, showing exactly where they are to be found•Radioactivity stocks can be accounted for by isotope, limit, disposal route, etc.•Features RS-232 interface for collection of weight data from balances•Uses a Microsoft® Outlook-style interface to facilitate a quick and easy learning curve•
LabLogic Systems www.lablogic.com
Lab Streamlining Software OpenLAB
Brings applications, instruments and data together under a single •lab environmentConsists of three integrated solutions: Chromatography Data System •(CDS), Electronic Lab Notebook (ELN) and Enterprise Content Management (ECM)Supports virtually any chromatographic technique, providing control •of instrumentsFacilitates multi-discipline interaction and cross-team collaboration•
Agilent Technologies www.agilent.com
Informatics System KnowItAll version 8.2
New addition spectral integration application allows users to link •to additional reference information for each functional group in the Sadtler Handbook of Reference SpectraIncludes a series of new report templates for improved design and •functionHelps chemists interpret spectra by gathering a list of functional •groups at specific peak positions in a spectrum
Bio-Rad www.bio-rad.com
Laboratory Information Management Suite SAPPHIRE™ R5.1
eForms provide a configurable approach to creating and filling out forms electronically•Zero footprint configurable off-the-shelf (COTS) LIMS consolidates functionality typically •found in multiple laboratory systemsGrid Data Entry uses dynamic techniques to •allow real-time rich-data visualisation via a grid/spreadsheet-enabled interface
LabVantage www.labvantage.com
desktop Application for drug discovery StarVue™
Allows users to quickly and conveniently view compound structures and data•The free application eliminates the need for plug-ins for Microsoft Excel to examine, sort and •search chemistry data setsCompounds can be loaded from SD, •SMILES, MOL or CSV filesIncludes two ways to look at data: tradi-•tional table or proprietary “Molecule View”
Optibrium www.optibrium.com
oN-deMANd LIMSsaas-based, enTerprIse-class soluTIon
LIMS-on-Demand™ allows organizations of varying types and sizes to leverage all the benefits of an industry-leading LIMS solution without the time and cost typi-cally associated with on-premise software installation.
Offering flexibility and ease-of-use, LIMS-on-Demand helps organizations replace inefficient, error-prone manual processes with an automated data management solution. For the cost of a monthly subscription fee, users can easily and securely create workflows, map sample lifecycles, and generate automatic updates from any standard Internet connection and through any web browser.
The user-friendly interface enables connectivity with a variety of internal instruments and systems, as well as external facilities, partners and regulatory agencies.
Kim Shah, Director of Marketing and Informatics at Thermo Fisher Scientific, says too many labs around the world are still using manual processes to manage the intricacies of workflow and data collection. “There are tens of thousands of small- to medium-sized labs out there that don’t have access to databases and don’t have IT people,” he said. “All the headaches of hosting a server, maintenance, upgrading, data security—all of that stuff is now Thermo Fisher’s responsibility.”
In addition to seamless connectivity, LIMS-on-Demand touts affordable operating costs. “We have developed an lower laboratory management solution that does not sacrifice functionality,” Shah added.
For more information, visit www.limsondemand.com. Kim Shah, Director of Marketing and Informatics, can be reached at [email protected].
Pr
od
uc
t SPo
tligh
t

70 Lab Manager May 2010 labmanager.com
teChnoLogy newS
Sample Management Software Mosaic version 4.0
Incorporates enhanced modules for tracking manually accessed stores and manual opera-•tions such as pipettingSubstance Registration System handles allocation of substance identifiers and capture of •substance metadataFeatures ability to seamlessly link to external registration systems•
Titian Software Titian Software
PuMPS & vaLveS
Conductive Plastic Pumps SCP-6500
Allow users of flammable liquids to ground pumps, mak-•ing them safe for use with class 1 and class 2 flammablesAvailable in four models, the pumps are made to fit •containers and drums from 5 to 55 gallonsEnable safe and spill-proof transfer of over 850 fluids •and solventsFeature a cost-effective life expectancy of 10 to 15 years•
GoatThroat Pumps www.goatthroat.com
Advanced Syringe Pumps PHD 22/2000
Provides low flow rates, high accuracy, smooth flow and advanced programmability•Available in three pumping options: simple infusion, infusion/withdrawal or a program-•mable model that can store up to four programs of ten sequences eachAll models are available in standard force or high force versions•
Harvard Apparatus www.harvardapparatus.com
Syringe Pumps Legato 200 Series
Touch-screen interface allows users to quickly create configurations and recall them•Three basic models available: Infuse Only, Infuse and Withdraw, and Push and Pull•Works with one syringe or two, and can be recon-•figured in the field to use with multiple syringesRun screen enables the user to quickly create •configurations and recall them later
KD Scientific www.kdscientific.com
double Syringe Pump NE-4000
Includes both infusion and withdrawal capabilities with accurate delivery of nanoliter, •microliter and milliliter flow ratesInfuses and withdraws two different sized •syringes simultaneously, up to 60 mlFeatures continuous dispensing at a fixed •pumping rateProgram up to 41 pumping phases that •change pumping rates
New Era Pump Systems www.syringepump.com
Pneumatic and electric Actuated Ball Valves BVP70/BVP80 Series
Features a stainless steel external trim and FKM O-Rings as standard•Operates using an air supply of 3.5 to 8.6 bar (50 to 125 psi)•Direct valve stem coupling to actuator shaft minimizes backlash•Electric actuators feature two ½ NPT conduit ports and integral thermal overload protection•
OMEGA Engineering www.omega.com
Bioinformatics Software Qlucore Omics Explorer 2.1
Enables users to explore different hypotheses and alternative scenarios within seconds•Includes new functionality for variable list handling•Allows users to perform set operations such as union and intersection on lists•Supports direct import of data from miRNA experiments pre-processed with Agilent Feature •Extraction Software
Qlucore www.qlucore.com
Laboratory data Management System VersaLIMS™
Delivers the level of data management required for small- to medium-sized labs•Includes a PC, barcode reader, barcode printer and core VersaLIMS software•Provides sample and result management along with 30 pre-configured reports•VersaLIMS.NET™ is easily scaled by adding functional modules and user licenses•
Quality Systems International www.qsius.com

71 May 2010 Lab Manager
Foaming hand Sanitizer SCRUBS®
One 8.5 ounce pump provides 150 applications of foam to kill •99.9% of disease-causing microorganisms in secondsFDA-regulated with specific kill claims for microorganisms includ-•ing MRSA, E. coli, Salmonella, Staphylococcus and StreptococcusLightweight formula conditions and moisturizes hands•
ITW Dymon www.dymon.com
Reagent Reservoir 4-row Partitioned Reservoir Plate
Enables aspiration of up to 4 reagents into a single well space•Allows pipette tips with strippers to easily reach the bottom of the channeled reservoir•Each row holds 73 ml, providing a total volume of 292 ml•Feature pyramid bottoms to reduce reagent waste•
Porvair Sciences www.porvair-sciences.com
TECHNOLOGY NEWS
SuPPLieS & ConSuMaBLeS
Transfer Pipets for Liquid handling Plastic Transfer Pipets
Produced from special-grade, low-density polyeth-•ylene to make them non-slippery and easy to grip when wearing glovesAvailable in more than 35 different styles with a •choice of capacities, lengths and tip stylesSterile pipets are available individually wrapped or •in bags of 10 and 20 units
Globe Scientific www.globescientific.com
Polymeric Tubing PEEK and Fluoropolymers
FEP, PFA and ETFE (Tefzel®) are available in 360• µm, 1/32”, 1/16” and 1/8” ODPEEK tubing is available in a wide variety of forms •including natural, solid color-coded, dual-layer color-coded, striped, and dash-stripe codedFeatures a tolerance of ±.0005” for IDs up to .010” •and ±.001” for larger IDsAll colorants used in manufacture are RoHS compliant•
VICI Metronics www.vicimetronics.com
Conductive 384 Tips CO-RE Tips for MICROLAB® STAR
Eliminate electrostatic effects, which can be problematic with non-conductive tips•Packaged in nested tip racks providing high packing •and storing density and reduced space requirementsTwenty tip racks sit on one tray, providing access to •7,690 tips for longer unattended runsCapacitance liquid level detection (cLLD), which •improves pipetting accuracy, cannot be performed with other tips on the market
Hamilton Robotics www.hamiltonrobotics.com
Pipette disposal Container Terminal® Pipet Keeper™
Allows disposal of pipettes, swabs and other items up to 15” in length•Designed for easy use by both right- and left-handed users•Made of sturdy paperboard•Features a plastic lining and webbed corners to avoid soak-through•
Whitney Products www.whitneyproducts.com
high Pressure Fittings 360 µm
Permits direct connection of 360 micron OD fused silica, PEEK, stainless or electroformed •nickel tubing without having to use linersFeatures a leak-free connection that seals at pres-•sures well in excess of 20,000 psiAvailable with a PEEK or stainless nut•A wide range of micron bore sizes are available•
VICI Valco www.vici.com
Sample Storage Tube Locking Mechanism Snap Tube®
By applying downward pressure, sample stor-•age tubes are locked into storage rackEnsures samples in non-coded, alphanumeric •and 2D coded tubes are kept secure during transport or storageAccommodates 96 individual tubes in industry •standard configurationAvailable in sterile, RNase/DNase free and with •custom specific barcodes for automated tracking
Micronic Europe BV www.micronic.com

how it woRkS
Consistent, Stable incubator and oven temperature
Solution: Ovens and incubators that provide uniform and stable tempera-ture control are available, and so the resolution to “sweet spots” and other problems with temperature inconsistency is fairly straightfor-ward. But making a decision as to which oven or incubator is best for a specific process requires an un-derstanding of unit construction and quality control practices.
When incubators and ovens are made, units are randomly sub-jected to quality control testing. Manufacturers typically use either DIN (German Industrial Standard) or ASTM (American Society for Testing and Materials) standards to document the performance of their apparatus.
A brief comparison of the main criteria in each standard will high-light what they indicate about unit performance. The most important of these is the number and location of the measurement points used in testing. The DIN standard requires a two-hour heat-up to steady state, at which point measurements are taken at 27 points in the chamber (nine points on three lev-els) and monitored six times a minute.
Using the ASTM standard, a manufac-turer will measure 9 points in the cham-ber (four each top and bottom shelf, one in the middle) without preheating and with no defined sampling time.
Unit controller is important as well. A thermostatic device that turns heating el-ements off and on as a set point is reached is obviously useful in only basic proce-dures, such as glassware drying. Simple digital controllers provide quick time to set point, while PID (proportional inte-gral derivative) control provides the best accuracy over time at a single point.
How the apparatus is heated is a key consideration. Mechanical convection provides greater consistency than other methods, and also offers faster recovery after the door is opened when compared to gravity convection, the other common heating method. Furthermore, direct heat and gravity convection ovens suffer from direct contact of the heating coils
with the inner chamber wall, creating hot spots, and do not offer preheating.
Other factors relevant to performance in-clude the amount and type of insulation, door closing and gasketing options, and ergonomic features such as the location and design of controllers and displays.
It is worth noting that repair/remodel-ing existing units is almost always inef-fective. A technician can test an incon-sistent oven or incubator, but charges for test time alone will bring the cost of an inexpensive unit to a level above that of the most expensive product. Repair-
ing or reconfiguring the oven or incubator to offer the desired per-formance will add even more cost, if it can be done at all.
If the applications for a given incu-bator or oven will ever go beyond the most basic requirements, the most well-equipped and validated unit available will offer consistent, reliable results and will cost less over time than inexpensive models.
Incubators and ovens from Binder, Inc. are made to DIN standards, uti-lize mechanical convection, incorpo-rate PID control, and offer a number of other features to meet demanding temperature stability requirements.
For more information, visit at www.binder-world.com/us.
Problem: Many experienced lab technicians are aware of the “sweet spot” in their oven or incubator—the back right-hand corner of the middle shelf where their experiment or process always comes out right. It’s the spot where the temperature in the oven is the same as that on the unit’s temperature display. Of course, what’s really indicated is that temperature accuracy through-out the chamber, the most important factor in oven and incubator perfor-mance, is uneven.
Preheating provides uniform airflow within the chamber and consistent temperature for samples. Depicted is the Binder FD Series mechanical convection oven.
72 Lab Manager May 2010 labmanager.com

how it woRkS
Sample Prep for Phospholipid Removal
Solution: HybridSPE®-PPT technology is a simple and generic sample prep plat-form designed for the gross level removal of endogenous protein and phospholipid inter-ferences from biological plasma and serum prior to LC-MS or LC-MS-MS analysis.
Biological plasma or serum is first subject-ed to protein precipitation by adding the sample to the HybridSPE 96-well plate followed by acidified acetonitrile (pre-cipitation agent). An upper PTFE frit im-pedes premature flow of the sample before vacuum application. After a brief mixing/vortexing step to facilitate protein precipi-tation, vacuum is applied to the 96-well plate. The 96-well version contains a series of low porosity hydrophobic filters/frits. The packed-bed filter/frit assembly acts as a depth filter, facilitating the concur-rent removal of both phospholipids and precipitated proteins during the extraction process. After the protein-precipitated sample passes through the HybridSPE-PPT device, the resulting effluent is free
of phospholipids and ready for immediate LC-MS or LC-MS-MS analysis.
Mechanism Details: When a plasma/serum sample is subjected to protein precipitation via the addition of acetonitrile (containing 1% formic acid), it passes through the HybridSPE-PPT packed bed. This packed bed
consists of proprietary zirconia-coated silica particles. The zirconia sites exhibit Lewis acid (electron acceptor) properties. Structurally, phospholipids consist of a polar head group (zwitterionic phosphate moiety) and a large hydrophobic tail (two fatty acyl groups that are hydrophobic). The phosphate group—inherent with all phospholipids—acts as a very strong Lew-is base that will interact strongly with zir-conia atoms functionalized on the particle surface. Formic acid is a critical modifier used in the precipitation agent to improve the recovery of many analytes of interest (e.g., acidic compounds); it plays a critical role in preventing analyte retention with-out affecting the phospholipid retention/removal process.
In summary, the HybridSPE-PPT sam-ple prep product is a valuable tool in LC-MS analysis; it helps to eliminate ion-suppression in MS detection, as well as the need for long gradient run times to elute on-column phospholipid build-up.
For more information, visit www.sig-maaldrich.com/hybridspe-ppt.
HybridSPE is a registered trademark of Sigma-Aldrich Biotechnology LP and Sigma-Aldrich Co.
Problem: Excessive background from endogenous sample matrix components has always been of great concern in bioanalysis, and has become paramount today with the need for decreasing analytical run times. In bio-analytical mass spectrometry, the issue of excessive background contributes to the problem of ion-suppression.
Ion suppression is caused by one or more interfering components or species that co-elute with the analyte(s) of interest during LC-MS analysis, and mani-fests itself as a loss of analyte response. The co-eluting species can affect droplet formation or ionize concurrently, resulting in an erroneous decrease (suppres-sion) in analyte signal response. The end result is poor assay reproducibility, and losses in accuracy and sensitivity. Such deleterious effects are often most notable at the lower limits of quantitation (LLOQ).
One of the major causes of ion suppression in bioanalysis is the presence of phospholipids during LC-MS analysis in the positive ion electrospray mode (+ESI). Phospholipids are prevalent in extremely high concentrations in blood-based biological fluids (~1 mg/mL), and represent the second largest lipid com-ponent in biological matrices after triglycerides.
In addition to ion suppression, phospholipids tend to accumulate on the analyti-cal column, leading to potential changes in retention selectivity. They may elute uncontrollably downstream in an injection run sequence, causing unpredictable ion-suppression effects and poor reproducibility. If gradient conditions are used to elute phospholipids, this leads to longer analysis run times—while the goal is decreasing run times.
PrecipitatedProteins
RetainedPhospholipidsvacu
um
Proprietary HybridSPEZirconia Coated Silica
OZr
Zr :-O
Zr+-OH
Si-OH
Si-O
O
O
O
O
O
OOP
O
OR2
R1
N
O
OO
Precipitation schematic for HybridSPE-PPT 96-well format
Lewis acid-base interaction between Hybrid-SPE zirconia ions and phospholipids.
73 May 2010 Lab Manager

how it woRkS
Measuring Sample volume and detecting Precipitates
Solution: To improve the quality of delivered plates to screening groups and to reduce the cost of wasted screening (time, effort, reagents, missed hits, etc.), vision technology can be used to audit both volume and precipitate in racks of up to 96 tubes (without requiring de-capping).
RTS Tube Auditor™, a high-speed, high-resolution vision system, images multiple sample tubes simultaneously. The images are analyzed and the liquid meniscus detected for each tube audit-ed. Once the position of the meniscus has been determined, the volume of liquid is calculated, taking into account tube and liquid types. Further algo-rithms are used to detect the presence of a cap and any precipitate in the base of the tube.
Benefits of this approach include:
• Speed:Lessthan2minutestoaudit a 96 tube rack
• Accuracy:Volumemeasure-ment better than +/-10µl
• Precipitateandcapdetection
• Noneedfortare-weighing
• Non-contactandoperateswith capped tubes
Suitable applications:• Multipleapplicationswithin
the CM/HTS process
• Biobanking
• Samplequalitycontrolandemptytube detection
• Sampledissolutionandsolubilityquality checks
• Capdetection(toavoidliquidhandling tip damage)
In addition to CM/HTS applications, this technology exhibits good perfor-mance when auditing DNA (in buffer) and other biological fluids, requiring significantly less time than conven-tional methods. Vision technology has made it possible to provide compound managers with a high-speed, high-ac-curacy instrument for auditing sample volumes and detecting precipitates.
Tedious manual visual checks or slow automated processes can be eliminated by the Tube Auditor™ with regular monitoring of sample tubes, increasing confidence in the quality of the sample being stored, thereby reducing the im-pact of variable quality on downstream processes such as screening.
For more information, visit www.rtslifescience.com.
Problem: Significant time and effort is expended in screening chemical and biological sample libraries. However, no matter how advanced the screening system, the end results are only as good as the quality of the sample in the microplate wells.
Compound managers responsible for delivering samples in plate format to screening groups need to have confidence in the quality of their delivered product. Unfortunately, survey data suggests that up to 5 percent of mi-croplate wells may be empty, and 3 to 5 percent of wells may have samples at the wrong concentration.
Empty plate wells—or wells with samples at the wrong concentration—can have a significant impact on the end results. In particular, precipitates in compound solutions not only lead to poor quality screening results, but also result in significant cost wastage. Knowing the sample volume in the source microtube, and whether there is any precipitate, prior to plating, is thus key to improving the quality of screening output.
Scientists need to know:•Ifthereisanysampleinthesourcemicrotube
•Howmuchvolumeofsampleisinthetube
•Ifanyofthesamplehasprecipitatedoutofsolution
Existing approaches using gravimetric, ultrasonic and other liquid level sensing methods have their disadvantages and cannot determine if sample has precipitated out of solution. A visual check can help spot precipitates, but this is a tedious task if conducted regularly for all samples, especially in a large library.
RTS Tube Auditor
74 Lab Manager May 2010 labmanager.com

PRODUCTS IN ACTIONThermo Scientific Centrifuge SystemsThermo Scientific Sorvall MTX 150 Benchtop and MX Series Floor Model Micro-UltracentrifugesOur new Sorvall® micro-ultracentrifuges are worlds ahead in performance, capacity and versatility. Cutting-edge technologic innovations enable more experiments of greater capacity in less time. With g-forces up to 1,048,000 xg, our Sorvall MTX 150 and MX series micro-ultracentrifuges feature advanced functionality in a compact footprint that easily fits in the lab for: • Fasterseparations• Increasedvolume• Accessibilityfromthebenchtoporwithinthelaboratory
Thermo Scientific Fiberlite Carbon Fiber RotorsFiberlite® carbon fiber rotors offer an advanced alternative to traditional metal rotors, delivering superior performance without fatigue or corrosion for worry-free operation spin after spin.
• Enhancedproductivity:Reducerun-timesanddecreasewearonacentrifugewith carbon fiber rotors – up to 60% lighter than metallic rotors
• Unequalleddurability:Corrosion-andfatigue-resistancesecuresthestructuralintegrity of Fiberlite rotors
• Thermalstability:Naturallyinsulatingcarbonfiberensuressamplesarekeptata constant temperature
• Secureinvestment:Fiberliterotorsarebuilttolastforvirtuallyanunlimitednumber of run cycles, backed by a 15-year warranty
Thermo Scientific Sorvall Legend X1 and Legend XT Centrifuge SeriesExperience our new general purpose centrifuges for high performance processing. The new Thermo Scientific Sorvall general purpose centrifuges leverage more than
100 years of experience and leadership in centrifugation, setting new standards for benchtop processing. The 4x400 mL Sorvall® Legend® X1 and 4x750 mL Sorvall Legend XT feature unmatched productivity, outstanding performance and breakthrough Thermo Scientific technologies, including:
• ThermoScientificFiberlitecarbonfiberrotorsenablehigherg-force(upto25,000), faster speeds and increased capacity, while ensuring exceptional security and efficiency with our robust, corrosion-free design
• EasyandsecureAuto-Lock®rotormanagementfacilitatesrotorexchangeinless than 3 seconds with just the push of a button for application versatility and cleaning convenience
• CertifiedClickSeal®bucketsealingsystemprovidesglove-friendly,one-handedsnap-on covers to replace screw caps and clips
Thermo Scientific308 Ridgefield CourtAsheville, NC 28806Tel: 866-984-3766Website: www.thermoscientific.com/centrifuges
75 May 2010 Lab Manager
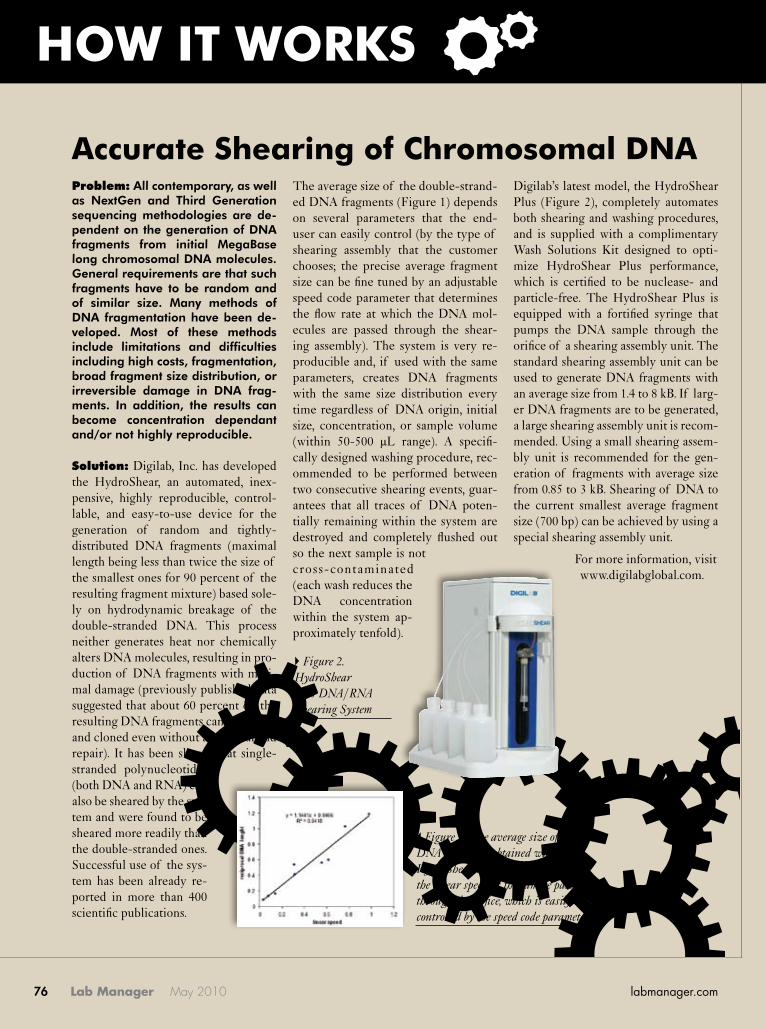
how it woRkS
accurate Shearing of Chromosomal dna
Solution: Digilab, Inc. has developed the HydroShear, an automated, inex-pensive, highly reproducible, control-lable, and easy-to-use device for the generation of random and tightly-distributed DNA fragments (maximal length being less than twice the size of the smallest ones for 90 percent of the resulting fragment mixture) based sole-ly on hydrodynamic breakage of the double-stranded DNA. This process neither generates heat nor chemically alters DNA molecules, resulting in pro-duction of DNA fragments with mini-mal damage (previously published data suggested that about 60 percent of the resulting DNA fragments can be ligated and cloned even without additional end repair). It has been shown that single-stranded polynucleotides (both DNA and RNA) can also be sheared by the sys-tem and were found to be sheared more readily than the double-stranded ones. Successful use of the sys-tem has been already re-ported in more than 400 scientific publications.
The average size of the double-strand-ed DNA fragments (Figure 1) depends on several parameters that the end-user can easily control (by the type of shearing assembly that the customer chooses; the precise average fragment size can be fine tuned by an adjustable speed code parameter that determines the flow rate at which the DNA mol-ecules are passed through the shear-ing assembly). The system is very re-producible and, if used with the same parameters, creates DNA fragments with the same size distribution every time regardless of DNA origin, initial size, concentration, or sample volume (within 50-500 µL range). A specifi-cally designed washing procedure, rec-ommended to be performed between two consecutive shearing events, guar-antees that all traces of DNA poten-tially remaining within the system are destroyed and completely flushed out so the next sample is not cross-contaminated (each wash reduces the DNA concentration within the system ap-proximately tenfold).
Digilab’s latest model, the HydroShear Plus (Figure 2), completely automates both shearing and washing procedures, and is supplied with a complimentary Wash Solutions Kit designed to opti-mize HydroShear Plus performance, which is certified to be nuclease- and particle-free. The HydroShear Plus is equipped with a fortified syringe that pumps the DNA sample through the orifice of a shearing assembly unit. The standard shearing assembly unit can be used to generate DNA fragments with an average size from 1.4 to 8 kB. If larg-er DNA fragments are to be generated, a large shearing assembly unit is recom-mended. Using a small shearing assem-bly unit is recommended for the gen-eration of fragments with average size from 0.85 to 3 kB. Shearing of DNA to the current smallest average fragment size (700 bp) can be achieved by using a special shearing assembly unit.
For more information, visit www.digilabglobal.com.
Problem: All contemporary, as well as NextGen and Third Generation sequencing methodologies are de-pendent on the generation of DNA fragments from initial MegaBase long chromosomal DNA molecules. General requirements are that such fragments have to be random and of similar size. Many methods of DNA fragmentation have been de-veloped. Most of these methods include limitations and difficulties including high costs, fragmentation, broad fragment size distribution, or irreversible damage in DNA frag-ments. In addition, the results can become concentration dependant and/or not highly reproducible.
Figure 1. The average size of DNA fragments obtained with the HydroShear Plus system depends on the linear speed as the sample passes through the orifice, which is easily controlled by the speed code parameter.
Figure 2. HydroShear Plus DNA/RNA Shearing System
76 Lab Manager May 2010 labmanager.com
31STOut of Box Solutions to Managing Today’s Laboratory
ANNUALCONFERENCE
NOVEMBER 3 - 5, 2010
Location: Hilton Scottsdale Resort Registration Deadline: October 1, 2010Program Chair: Kelly John Mason, ExxonMobil Research and Engineering Company
Inspiration and innovation comes from a vast variety of sources, which today’s laboratory manager needs to develop
and nurture. Too often laboratory staff and management are constrained by traditional strategies while the business and
performance expectations are for step-out or revolutionary solutions. Through the selection of speaker topics, workshops
and roundtable discussions, the 31st annual conference focuses on out-of-the-box solutions for improved laboratory per-
formance in the three axes of laboratory management: technology, leadership and laboratory asset management. Subject
matter experts will provide attendees with the game changing skills to embrace and engage innovation within their
organization. This conference will challenge the attendees to explore non-traditional solutions to laboratory management
problems. Your attendance at ALMA’s 31st conference will help ensure continued success of your laboratory and your management career.
Conference Highlights: • Conference Presentations:
The Economic Realities of Lab Automation, Joe Liscouski, Institute for Laboratory Automation
Getting Your Staff and Boss to Think Outside the Box, Sam Liggero, Tufts Gordon Institute
Success Stories on Implementing LEAN to Improve Lab Output, Jan Borge Jakobsen, Algeta
Networks and Lab Management: It’s All About the Beer, Mike Neag, AkzoNobel
Interdepartmental Laboratory Equipment Teams, Forum for Equipment Standardization, Process Optimization, Time Savings, and Cost Reduction, Mike Mathiesen, Dial Henkel
Managing Flexible Capacity Resources, Dave Pilosof, The Clorox Company
Keeping Capabilities Current and Running Within a Limited Capital Budget, Marina Despotopoulou, Arkema Inc. and Phil Edwards, NOVA Chemicals
• Roundtable Discussions: Out of the Box Technologies, Out of the Box Leadership, and Out of the Box Management of Assets
• Supplier Exhibits, Presentations, and Discussions
• Opening Reception and Exclusive Tour at the Dial Henkel Corporate Laboratory
• Conference Banquet with Guest Speaker Alan Cabelly, “One Leader, Four Generations: The Four Directions of Leadership”
Keynote Address: Biomimicry: Using Nature’s Stories to Spark New ThinkingDr. Mary Viola, Tufts Gordon Institute and Dr. Jeanette Eberhardy, Wiv, Inc.
Pre-Conference WorkshopsNovember 2 - 3, 2010
Introduction to Lab Automation
Unlocking Your Teams Creative Potential: Improving Productivity Using Resources You Already Have
Building Business and Technology Strategies in Your Organization
Manage Your Boss: Secrets from the Best
The Best of HRMA: Hire and Retain by Motivating and Acknowledging
Making Innovation Work in Your Organization
Applying LEAN to Laboratory Operations
Visit www.labmanagers.org for details on registration, fees and workshop dates.
Special Exhibit and Sponsorship Opportunities Available
Please contact ALMA at 505.989.4683 or [email protected] for detailed information.
Association of Laboratory Managers2019 Galisteo St., Bldg. I-1, Santa Fe, NM 87505
505.989.4683www.labmanagers.org
Program Chair: Kelly John Mason, ExxonMobil Research and Engineering CompanyInspiration and innovation comes from a vast variety of sources, which today’s laboratory manager needs to develop
and nurture. Too often laboratory staff and management are constrained by traditional strategies while the business and
performance expectations are for step-out or revolutionary solutions. Through the selection of speaker topics, workshops
and roundtable discussions, the 31st annual conference focuses on out-of-the-box solutions for improved laboratory per-
formance in the three axes of laboratory management: technology, leadership and laboratory asset management. Subject
matter experts will provide attendees with the game changing skills to embrace and engage innovation within their
organization. This conference will challenge the attendees to explore non-traditional solutions to laboratory management
problems. Your attendance at ALMA’s 31st conference will help ensure continued success of your laboratory and your management career.
Keynote Address:Dr. Mary Viola, Tufts Gordon Institute and Dr. Jeanette Eberhardy, Wiv, Inc.
Biomimicry: Using Nature’s Stories to Spark New Thinking
Biomimicry and other fi elds of inquiry are studying nature’s designs to help us solve human problems in a sustainable way. Remarkable discoveries and innovations have followed, for example:
• The scum produced on the surface of rainforest ponds contains a key nutrient for malnourished babies• The study of leaves informs solar cell development• And modeling the swarming of ants has led to breakthroughs in operational effi ciencies in organizations like Southwest Airlines
Today’s nature scientists and thought leaders are challenging our current defi nitions of resources, growth and economy. Can the study of nature’s patterns lead us to new ways of thinking and allow us to re-energize our
31STANNUAL

how it woRkS
Maintaining Sample viability
Solution: One way to improve sample integrity and alleviate contamination concerns is to ensure the application of optimal torque to each tube as well as to maintain a clean environment for the tubes when open. As such, the Thermo Scientific and The Automation Part-nership (TAP) Capit-All® IS has been designed to de-cap and re-cap an entire rack of samples in less than ten seconds, tightening each tube to its optimal torque at the push of a button. Every tube is individually sealed by its own separate clutch mechanism to a pre-opti-mized tightness, ensuring secure capping. Furthermore, a novel sealing mechanism prevents the occurrence of cross threading and over tightening, ensuring that all samples are contained within airtight tubes. The decapper is guaranteed to process over one million samples before service maintenance is required.
Distortion or damage to the caps after repeated use is prevented via the in-corporation of plastic mandrels that fit perfectly into the recesses of the cap. Particulates caused by distortion are eliminated. The lifespan of the tubes
and caps is maximized, and sample in-tegrity is effectively maintained. What is more, the Capit-All IS successfully eliminates the risk of RSI, while sig-nificantly increasing throughput. With the capability to seal all 96 tubes si-multaneously, for fast, quality capping, researchers can effectively integrate the instrument with automated liq-uid handling platforms to streamline their workflows for an efficient, high-throughput experiment.
In addition to optimally tightening caps to minimize exposure to external conditions, sample integrity is further maintained through a number of con-tamination control measures. An easy-to-clean drip tray captures and contains sample droplets, significantly reducing the potential for cross-contamination during tube entry and removal from the instrument. Furthermore, no disassem-bly is required for routine cleaning and maintenance, reducing the possibil-ity of contamination from debris and other external sources. The incorpora-tion of an extraction port also ensures that any aerosols or particulates that are present within the instrument are completely removed.
For further information, please visit www.thermoscientific.com/matrix.
Capit-All IS is a registered trademark of The Automated Partnership.
Problem: Screw cap tubes are found in the vast majority of laboratories and are commonly used for the long-term storage and cryopreservation of a plethora of sample types. Effectively maintaining sample integrity in these storage environments is of extreme importance to any researcher, and there are key factors that require consideration.
Although the tightening of these tubes may seem an insignificant process, the level of torque applied can be of paramount importance to successfully maintaining sample integrity. Tightening by hand is a slow process that can lead to repetitive strain injury (RSI) and that does not offer any measure of reproducibility. If the torque of the cap is not optimal, especially during multiple freeze-thaw cycles, samples can become exposed to external—often non-sterile—environments. Such exposure can subsequently result in attrition or contamination of the sample.
In order to circumvent potential cross contamination, slow sample process-ing and the risk of RSI, all while increasing throughput, laboratories em-ploy the use of automated cappers/decappers. However, these instruments commonly use metal mandrels, which can distort and damage the caps. Also, most automated decappers don’t define cycle limits for tube tightness and aren’t designed to control the tightness of each tube individually. Con-sequently, the potential for sample loss and contamination is increased, which can further affect sample viability and concentration, thereby com-promising the integrity of any resulting data.
The Capit-All IS automated capper/decapper.
78 Lab Manager May 2010 labmanager.com

labmanager.com
Marketplace
Fully Equipped
CHEMICAL LABfor Rent in Greenville, SC
$300,000 lab up fit—never used Located in business park with easy access to I-85 and I-385
Contact Brent FreemanBentley Commercial, LLC
(864) 704-1048—Mobile (864) 901-1901, E-mail: [email protected]
www:bentleycommercial.com
SONNTEK – “STAY FOCUSED”
Still the Best Selection ofResearch Lamps Anywhere!
2 0 1 - 2 3 6 - 9 3 0 0w w w. s o n n t e k . c o ms o n n t e k @ a o l . c o m
Refurbished & Certified Lab Equipment Since 1979
Ph: 800.438.4522 or 847.913.0777 www.ietltd.com [email protected]
Mass Specs
NMR
HPLC
International Equipment Trading Ltd.
Spectrophotometer Service - Support - SalesBased in So. Calif with national coverageNew and refurbished systemsCalibrations - PMs - Repairs Lamps - Cuvettes
CALL TODAY for a no obligation quote 619-579-0077 [email protected] www.novabiotech.com
Pre-Owned Spectroscopy Equipment
79Lab Manager Marketplace
Lab Management MattersA Blog by John K. BorchardtLab Management Matters
discussing current issues and topics in lab management.
www.labmanager.com/blogs/Lab-Management-Matters
Lab Management MattersA Blog by John K. BorchardtLab Management Matters
discussing current issues and topics in lab management.
www.labmanager.com/blogs/Lab-Management-Matters
The YGS Group is the authorized provider of custom reprints and content licensing from Lab Manager.
The YGS Group800.290.5460 x136 [email protected]/reprints
Has your company recently been
featured in an article?
smart marketingALWAYS includes positive editorialabout you or your company.
Marketing collateralEmployee relationsInvestor relationsSocial marketingTradeshows
REPRINTS PROVIDEINSTANT CREDIBILITY
Has your company recently been featured in an article?
Reprints provide instant credibility
91 Mystic St. Arlington, MA
Toll: 888-5-HARLOW Fax: 781-641-0302

labmanager.com
AdVeRTISeR INdeX
ALMA www.labmanagers.org 77
BioTek Instruments, Inc. www.biotek.com/epoch 13
BrandTech Scientific, Inc. www.brandtech.com 22
Bruker Optics, Inc. www.bruker.com/ftir 33
Buchi Corporation www.mybuchi.com 54
Buck Scientific www.bucksci.com 6
CASSS www.hplc2010.org 83
Conquer Scientific www.conquerscientific.com 79
W.A. Hammond Drierite Company www.drierite.com 63
Drummond Scientific Company www.drummondsci.com 55
Environmental Express www.environmentalexpress.com 62
Enwave Optronics, Inc. www.enwaveopt.com 35
Frankl Thomas Inc. www.bentleycommercial.com 79
Gilson Pipetman www.pipetman.com/m 7
Harlow Scientific www.harlowscientific.com 79
Horizon Technology Inc. www.horizontechinc.com/labmgr 14 & 15
International Equipment Trading, Ltd. www.ietltd.com 79
LabWrench www.labwrench.com 81
LabX www.labx.com 80
Mallinckrodt-Baker www.mallbaker.com/lab5 32
Miele, Inc. www.labwasher.com 31
Molecular Devices Corporation www.moleculardevices.com 2
Nova Biotech www.novabiotech.com 79
Nuaire Inc. www.nuaire.com 9
Qorpak www.qorpak.com 60
RDM Industrial Products, Inc. www.labspacesolutions.com 25
Ricca Chemical Company www.riccachemical.com 59
Sonntek, Inc. www.sonntek.com 79
Symyx Technologies, Inc. www.symyx.com/notebook6 27
Terra Universal, Inc. www.terrauniversal.com 17 & 84
The YGS Group www.ygsgroup.com 79
Thermo Fisher Scientific Inc. www.thermoscientific.com/plus 5, 21, 57 & 75
USA Scientific, Inc. www.usascientific.com 3
Waters Corporation www.waters.com 11
Company URL Page
BUY & SELL EQUIPMENT • ONLINE AUCTIONSNEW PRODUCT INTRODUCTIONS • GREAT DEALS
www.labx.com
Register today to run ads, bid in LabAuc-tions, or contact buyers and sellers. LabX showcases over 190,000 listings of new, surplus, pre-owned lab equipment, and supplies. Visit LabX today and get the product you’ve always wanted NOW!
fi ndexcitingdeals!


48 56
q iS foR quaLity Many laboratories are organized along in-house models or as service entities that provide an array of analytical testing for a variety of customers. Bad quality can rob a lab of good customers. Here are some key areas on which to focus to ensure a high level of quality in the lab.
Agency regulations (EPA, FDA, etc.) are binding requirements, not merely suggestions•Training should be ongoing to keep up with changing technology and new regulations•Well-trained personnel are a vital component of a well-functioning lab•When people are overworked and worn out, quality suffers•
Leading Change Changes aren’t easy to achieve. Well-educated, bright and motivated people can be resistant to change. However, the change process can be understood, and change can be implemented more successfully and more reliably by following a few rules.
Establish a sense of urgency and create a guiding coalition•Develop a vision and strategy, and communicate that vision•Empower broad-based action and generate short-term wins•Consolidate gains and produce more change, then anchor new approaches in the culture•
PeRSPeCtive on: AN ENVIRONMENTAL LAB Advanced Environmental Laboratories Inc. (AEL) performs tests for numer-ous clients including federal agencies such as the Air Force and the EPA. Bob Dempsey, lab manager of the Jacksonville branch, says their success comes from a combination of proper scheduling, communication, and a trained and dedicated staff. Here are some of Dempsey’s management tips:
Communication between employees and clients is one of the most important skills to use•When time and resources allow, show gratitude to staff with relaxed group functions•Use a LIMS to log and track samples•Treat employees fairly. When people enjoy their jobs, it rubs off onto the clients.•
20
10
26Managing the CoMing data fLood Lab managers will face an increasing challenge in the next decade—man-aging a rising tide of data. To realize the full benefit and value of these data requires effective data management techniques, institutional arrange-ments and policies. Some of the factors contributing to the flood are:
Globalization of research and open innovation•Cloud computing, which is web-accessible data storage and processing•The use of supercomputers, which enable the creation and processing of large volumes of data•
Managing oBSoLeSCenCe It is natural to focus on the high cost of replacing an old instrument, but updating obsolete technology can bring many benefits including financial savings, higher efficiency, improved safety and lower mainte-nance. Here are some of the benefits to upgrading obsolete instruments.
Faster sample turnaround time—in some cases, analysis time is reduced by as much as an •order of magnitudeSmaller carbon footprint—Newer technologies permit smaller sample sizes, reducing waste •disposal quantities and costsEase-of-use—Nearly every instrument is run by software that helps interpret data•
PaRting PointS takeaways from this month’s issue:
PaRting PointS, takeaways from this month’s issue:
82 Lab Manager May 2010 labmanager.com

June 19-24, 2010–Boston, MA USAHynes Convention Center & Sheraton Boston Hotel
35th Internationl Symposium on High Performance Liquid Phase Separations and Related Techniques
Key Topic Areas:♦ Separation Science Theory and Fundamentals♦ Advances in Separation Science Technology♦ Multi-dimensional and Hyphenated Separations♦ Miniaturized and Chip Based Separations♦ High Speed, High Pressure and High Resolution Chromatography♦ Pharmaceutical and Clinical Applications♦ Industrial, Environmental Food Safety Applications♦ Proteomics, Genomic and Metabolomics♦ Life Sciences and BiotechnologyAN INTERNATIONAL SEPARATION SCIENCE SOCIETY
CASSS
www.hplc2010.org
Chairman: Steven CohenWaters Corporation
Abstract submission deadlines:Oral consideration: December 15th, 2009Poster consideration: January 29th, 2010
Organized by

Vibration Isolation Lab & Cleanroom Storage Vacuum Chambers
Lab Apparel
Vibration-Free Platform provides a portable isolation system wherever you need it.
Starting at $2,166
Vibration-Free Workstations come in many standard sizes and top materials.
Starting at $1,704
Cleanroom supplies storage cabinets are available in several shelf and garment rod confi gurations, with HEPA fi lter module for optimal cleanliness of stored materials.
Starting at $1,388
Many standard sizes and materials.Starting at $1,255
Advanced Vi-Gard® I polyester/cotton lab coat combines durability, comfort and static control. Wide range of sizes and colors.
Starting at $29
Vacuum Cleaners
Many standard models, including the portable ULPA-fi ltered MicroVac above.
$955To order, call 714-578-6000 • Fax: 714-578-6020 Fullerton, CA
Pass-Throughs
BioSafe™ Pass-Through Chambers feature no-lip, no-seam design for easy sterilization.
Starting at $8,578
Laminar Flow Hoods
Modular Cleanrooms
Vertical Laminar Flow Station includes PLC control over motorized shield, FFU and lighting to meet Class 100 standards.
Starting at $4,937
• Total Cleanroom Solutions—Terra designs, builds and equips to your specs!
• Cleanliness to Class 10 (ISO 3), BioSafe™ all-steel designs with antimicrobial surfaces for aseptic processing
• Free-standing structures require no external bracing• Any size or fl oor plan, with pass-throughs and internal partitions• A/C, temperature and humidity control, special lighting
BioSafe™ Aseptic Cleanroom
Isolation and Barrier Rooms
Desiccators
SmartDesiccator automates N2 fl ow to maintain setpoint humidity level (ambient to 0%RH). Seconds to set up and program!
Starting at $821
Garb & Parts Dispensers
Stainless steel dispenser is ideal for loose gloves, hair nets, shoe covers.
Starting at $295
Three-bay acrylic wall-mount glove dispenser accommodates multiple glove sizes or materials.
Starting at $235
Low-Cost Solutions for High-Tech Industries
showcase_yellow_0210_LM.indd 1 1/7/10 3:30 PM