la4iv amherst dept of mechanical engineering f/s 11/2 ... · ad-aioo 4~69 massachusetts la4iv...
TRANSCRIPT

AD-AIOO 4~69 MASSACHUSETTS LA4IV AMHERST DEPT OF MECHANICAL ENGINEERING F/S 11/2STATISTICAL REPRODUCIBILITY OF THE DYNAMIC AND STATIC FATIGUE E--ETC(U)OCT 80 1 E RITTER, K JAKUS NOOOIGTS8-C-0B36
UNCLASSIFIED N
mEEE~hEEENDh

LEELKSTAT.TICAL REPRODUCEI:_TY OF THE DYtNA!C
AND STATIC FATIGUE EXPERIMENTS
O by
John E. Ritter, Jr.
Karl Jakus
TECHNICAL REPORT
ONR Contract "4'.!N00014-78-C-0836 ' z
ONR Contract Authority NR 039-170/5-15-79 (471)
for *
Office of Naval Research
Arlington, VA 22217
by
Mechanical Engineering Department
University of Massachusetts
Amherst, MA. 01003
Octobe, 1980
Reproduction in whole or in part is permitted for any purposesof the United States Government
i-ii U'nlimited ar.jeasii' 2-, -,#-,::;1,., . ! -s

S-E...' -',, Z._ S5*. Z N ,: " "-: E = H i£ ~e E$ ..nrt'c
REPORT DOC'JmENTATION PAGE F ,L !.NS-7R:17C : 5;
-_.-=-F'2. - O,-2. CZ.PL- IT, .; O E
KIATTICAL REDRODUCi.-T'7 OF TrE DYNAv:C AND Tecnica' Report-SATIC T-, E EX',FElRUlES !October ', !979-O:toei- ,.1980
E. DE r;R ZS. PES N.MSEt;
s.C~ GR Z AN- NMEERS.
jorr. El. Ritter, Lr. and Karl .akus N0O0,L-TS-C-OS3]
'ecnarI ca Encineerinc DeparTentve-s 7 Z C7 Massachusetts
Amherst. tA, CI1003Z S NG ;CcE N A mE AN - A SZ R ESS 1 Z EO- AT E
office of Naval Research October 198C800 N. Quincy Street t-IVSEMC P M AGES
Arlincton, VA 22217%4 M N C AG NZ % ;,m 8: AZd~S :lie,of -,omr Conf~olinj olhce, S Sz'2 C-ASS. 1.: :.-.)4 ,polf,
Distribution of this document is unlimited Unclassified
15.. PASSI 7A1- DOWNGRADING
16. D!S RIELIOh 57 ATM=- N (0; :h3 Reporl;
17. ZiS7RIEU" ON S7A7*--MENT (of the abstract entered in Block 2C, tf d:1fterent lozr Report,
8. SLIPO. EMENT ARY NC7E 5
19 KEY WORDS fContznte or. reverse .tde if necesaav&. a identify by blocx nu mber)
Fatigue, statistical reproducibility, delayed failure, failure predictions
ABSVkACT (Continue on reverse side 1( ne:ce..rr an Jdentify by blocA number)
The number of test samples used to characterize the fatigue constants needed forfailure predictions for ceramic materials determines the confidence in thesepredictions. The statistical reproducibility of the dynamic and static fatioueexoeriments used to measure the fatigue constants was analyzed using both sta-tistical theory and a Monte Carlo computer simulation technique. It was foundthat the statistical reproducibility depended not only on the number of testsamples but also on the other experimental test variables. It was (continued)
DO c,0,,7, 1473 E-ZTIO OFI OV, 63 IS OSSOLE-
SECU ITY C.ASSIFICATION CF TiIS OAGi 'When DLti Entred'

r7
Elock 20. Abstract (continued,
.shown that the uncertainty in the statistical reproducibility car. be largeesoecialiy for sample size less than about 100. Guidelines for selectinc:he optimur samD!e size for a civen oyraric or static fatiaue experiment areciven. It is recommended that before meanincfu; corclusions car be drawnreGardinc the effect of a test variable on fatioue, the s'atistica repvocuc-ibiltv of tne experiment be deterninec.
II
I
- - . --

Vi
FOREWORD
This report describes the results of an experimental program
oriented toward a better understanding of lifetime predictions foroptical glass fibers. Some of the progress made toward this goalis summarized in the attached technical paper comprising thisreport.

To be published Bull. Am. Cerar. Soc., 1980
STATISTICAL REPRODUCIBILITY OF THE DYIA!, IC
AID STATIC FATIGUE EXPERIMENTS
'.E. KItLer, Jr., N. Bandyopadnyay and L. JUku_
Mechanical Engineering DepartmentUniversity of Massachusetts
Amherst, MA 01003
ABSTRACT
The number of test samples used to characterize the fatigue constr:c'
needed for failure predictions for ceramic materials deterines the con,-
fidence in these predictions. The statistical reproducibility of tne
dynamic and static fatigue experiments used to measure the fatigue
constants was analyzed using both statistical theory and a Monte Carlo
computer simulation technique. It was found that the statistical reproduci-
bility depended not only on the number of test samples but also on the other
experirmental test variables. It was shown that the uncertaint., in +"he statistical
reproducibility can be large especially for sample size less than about
100. Guidelines for selecting the optimum sample size for a given dynamic
or static fatigue experiment are given. it is recommended that before
meaningful conclusions can be drawn regarding the effect of a test
variable on fatigue, the statistical reproducibility of the experiment
be determined.

1.0 iNT;ODUCTION
Methods o' dealing with design problems irvclvirc fatigue of ceranic
materias rnave been aeveloped over the past 10 years througr, :ne ipcatiDr.'
of fraci.ure mec-cnanics principles. Since these pritciples Li. be , tc
characterizt both --he conditions for suocritical crack _.roV'th anc tnc
conditions for crack instability, they can be used for purposes of desigr
to estimate the allowable stressor the expected lifetime, or tne proJ!
stress necessary to assure a minimum lifetime. Tnis is b;;Qm~; ,siec b'
estimating the initial crack size in a ceramic component dnd tre time
required for this initial crack to grow to a critical size for ,ortaneo-s
fractu-e. For example, it has been deriveo by assuming a sirpie power lav
relationship between subcritical crack velocity and stress intensity triat
the failure time (tf) under a constant applied stress (c a) is:
- -?-._ - ,,I - (1)
t-C-
where B 2/(AY2 (N-2) K ic N-2), A, !i = material/environment constants, Y :
geometric constant (about 1.2 for surface flaws), K 1C = critical stress
intensity facto-, and Si fracturE strength in an inert environment. S and
N in Eq. (1) are fatigue constants that for a given material/environment system
characterize subcritical crack growtn. The inert strength in Eq. (1) character-
izes the initial flaw size. If p;-oof testina is used to truncate the flaw
distribution, then the minimur inert strength after proof testing is equal
to the maximum proof stres ), hence, the correspondinolv minimum failure time
(tmi is:1,2
- ,, - Z ....m-n

Fro Lq. 1 and ( , it !s seen that failure irec Ltit -- .nti eitrue "
Our th e TdtI( i ,,j raieter. N and i.'. T "se p u al I l'tt u , rt: 1t.!,iIt iT ';
glve|i matern !,'einvtrorment system cind Ldn be experimeltd i y d t- Inkrd3
directly using fracture mechanics techniques, or can be irdirectlI civasureJ
2using static fatioue or dynamric fatigue experiments. LinfortunaT-v, f 6 re
predictions are extremely sensitive to the experimental uncertr, tv in: *lie
fatigue parameters. Statistical techniques for estimating tris uncertaIrt,,
in failure predictions have been developed; 4 5 however, the stat istical
reproducibility of the experimental techniques used to evclu-te the fatv:uL-
parameters N and 5 has not been previously determined. Statistical repro-
ducibility is due to random sampling errors that are inherent in every ex-
periment. In the random selection of a finite number of samples for testinc.
one would ex ,-ct to see some statistical variability in the measured propertie.,
that would be dependent on the number of samples selected. It further would
be expected that this variability in the estimation of the fatinue Darameters
would increuse as sample size decreases, however, this statitical reproducibilitv
has never been quantified although some Monte Carlo results on the re-
producibility of N as determined by dynamic fatigue tests have been previously6
reported by the present authors. Before meaningful conclusions can be drawn-
from the results of fatigue experiments, the statistical reproducibility of
these experiments must be known.
The purpose of this paper is to quantify the statistical reproducibility
of the dynamic and static fatigue experiments for measurinq the fatioue
constants N and C. Statistical reproducibility is analyzed usinn both

statistical theory and a Monte Carlo computer simulatior technique. Since
the statistical theory contains a number of critical assumotions, it is
important to inoepenoently validate the staTistical theory approach v'ith
the VMort e Carlo technique. Emphasis is placed on tne dynamic ant static
faticue techniques because they are increasingly being used to measure
the fatigue behavior of ceramics. This is because these test techniaues
can utilize samples containing flaws representative of those on actual
components. It is believed that the results of this study will leac to a
better understanding of the static and dynamic fatigue test technioues and
their statistical variability. From this information guidelines for sapDle
size reouirements in terms of optimum statistical reproducibility can be
developed.
Ij

2.0 ANALYSIS OF STATILSTICAL REPF.ODUCIEILI T
2.1 Dynamic Fatigue
Dynamic faticlue data is generated by measur'nco the fracture strenath c
a number of samoles atl several constant stressinc rates. The -Fatiaue constants
N and E can be determined from dynamicI fatigue data throucrn usin7 one o' four
analyses: medijan, homologous stress, iterative bivariant, or iterative tri-
2 7variant.' since all of these techniques analyze the same set of dynamic
fatigue data in determining N and B through a linear regression analYsis, all
are expected to result in essentially the same statistical reproducibility
for N and B. Thus, the median analysis technique was chosen for this study,
because of its simplicity and wide usage.
V.ith the median analysis the dynamic fatigue data are fitted to: 2'7
-CII
where 5zmedian fatigue fracture strength,C stressing rate, and a1, a2=
linear regression constants. The fatigue constants are then determined from.
K- - _(4a)
where S.i median inert strength.
Dynamic fatigue strength data of an "ideal' material was simulated
on a computer using a Monte Carlo technique.u~' it was assumed that the
fatigue constants N and B of this ideal material are given and that the
inert strength distribution is given by a two parameter Weibull distributionlC
m--

6.
whose slope and scale parameters, miand S0 respectively, are known. Uith
the Monte Carlo technique a Qiven number of samples at a specific stress-
ing rate were chosen by ranorY seiect4rc their fa'iure orcbat~i -:
froa, a unifor; distribution between 0 and I. The corresroncnc atlcue
fracture strengt*hs were then calculated according to the frdcture meuharics
relationshi:2
J: S " - : . .,:
A separate set of inert strength samples were chosen similarly to the fat-gue
samples, namely failure probabilities were ranoomly chosen and tne corresponciny '
inert strength were calculated from the two parameter Weibuii distribution:1
4I
Once a set of inert strength and fatigue strengths at several different
stressing rates were randomly chosen, N and B were determined from this data
using Eqs. (3) and (4). It should be noted that the median strength for a
given set of strength values was determined by ranking and fitting the strengths
to a Weibull distribution by linear least square method. The meiar strength
was then calculated as the value at F= 0.50. Alternatively, the median
strength could have been determined by choosing the actual median strength
value; however, this results in greater variability and thus was not used. By
iterating this procedure 100 times, distributions for N and B were generated
which represent the statistical reproducibility of N and B as determined
from the dynamic fatigue test. With the 100 values generated by the Monte
Carlo technique, the average values with their corresponding variances and the
covariance between N and B were calculated from the usual statistical lormrlas: 11

,,J
1 j(7b)
j - (7d
7,-, J(7e)
where n 100 for these computer calculations. For a given material/environment systemn,
i .e. f or a g iver, set of m, So , N, and B, the important tes t vari abl es s tud ied were
the number of saimples per stressing rate, the stressing rate range, and the
number of stressing rates that were used in a given test. For the case of
multi-stressing rates, the stressing rates were evenly spaced from maximum,
to minimum. Figure I gives a schematic flow diagram of the Monte Carlo
computer simulation technique for determining the fatigue corstants N arid b
by the dynamic fatigue test. Note that the same number of inert sanies were
chosen as the number of samples per stressing rate.

The va rianes and covari ance of the ner- s-renczr DE wea s w
oer vec as a function of samDle si2e Fror- s tatiticeal sieo . .:aa Ic
certain assumD,=ions (see Ao:,end4x, Eqs (.M!, (2,> and ..... The results
of this ana \s4s are as fo]ows
.- _ .. , ._
I - r
where J = number of samples and = ga, .ma function. Li--eise, the var'ances in
the fatigue constants N and E and their covariance were derivec as sihown n ne
Appendix, Eqs. (141), ( '.42), and (-4,), to be:
'K I /J j, -
V ( l-' ; -- ....
I9.
"' -"" (J'') A- ,,'U,.
* A
,L,/J)(AL ('-'J.K, /-. 2. - I & / - (9c
where J. total number of samples used in dynamic fatigue experiment. J2
number of stressing rates, L: 2. . , _, . -I,, -- -
4.f( /J '/ ." , ',
pr ." L/' 4• '"
For typica ceramic materials >". J-' ' ) -

Since these derivations made a numoer cf critical assumtions, it is o'
importance to compare these variances w'itn tnose aeneratec by trie or e rc
lecnnique to aeterr-ine zne v~iidit of the assumptions.
- .2 Static Fatioue
Static -aticue tests entai- , the reDeatec measuremen- c - azure time at
several constant appiiec stresses. Static fatigue daca car, De aralyzed
similar to dynamic fatigue data by the median, homolooous stress, iterative
bivariant, and iterative trivariant ana yses. 2 .s in the case of dnamic
fatique the median analysis was cnosen for studying the statistical repro-
ducibilitv. v'in tne meciar, analysis the data is fitted to:L,
liLi
where t = median failure time and a3 , a4 = linear regression constants.
The fatigue constants N and B are determined from:2
,, I = - ila)
' - . f "
The Monte Carlo analysis of the statistical reproducibility of IN and B
as determined from static fatigue data is similar to that used for dynamic
fatigue data. First, a given number of failure times at a specific applied
stress are selected by randomly choosing the failure probability and then
calculating the corresponding failure time from:2
-L = " 12rr,

Orce a set of failure times at several different appliec stresses an a se:
0f inert strencths are ranuomlv cnosen, IN and B are determinea fro;-, Ecs.
ard (11;. E.' iteratine tnis procedure 100 times, a distribution of I, arl
values are aenerated from which the statistical reproauoitii t o these
parame.ters car be oetermined. Similar to the case of dynawic fatigue, the
variables studied for a given material/environment svster were the riu;;,;-er cf
samples per a:)plied stress, the a:plied stress rane. and the nutDer c,
applied stresses in a given test.
The variances in the fatigue constants Nf and B and their ccvariance co !c
also be derived from statistical theory as shown in the AcDencix , Ls. (A52 ,
(A53), and (A54)) to be:
"0"-(13t)
- J :" -* ______ - -- tl~c*
where nov,: J number of samples used in static fatioue experiment, J = number
of applied stresses, Jl = number of samples tested at eachapplied stress,
, ' - - -2._ Y'.'-- - - ' .... -
- _ _ , . " .t . - * .. -f-. .. ,-_
r , - 1 ,; ' , ,.- , . ". .. -

S - -*--~-~.:For
Ada 41n it was o' interest To compare these variances to tnhcse de-te'-rine,-- bY trie-
Monte Carlo technique to determine the validity of the assumptions made in ceriv-
inc the above equations.

3.C RESULTS AND DISOUSSOIN
Doth the Weibull parameters (m and ) and the fatinue constants (! ar E0
deoend stronclv on samole size. Figures 2 and - shov, :he jeperidenck -or r an
S , resPectively or, samcle size where the coefficient cf variation is cefirec
s the standard deviation divided by the mean va'ue of tne parameter ir
question. From these figures it can be seen that there is oood agreement
between the Monte Carlo technique for estimating the statistical reprodu-
cibility and that derived from statistical theory. The fioures further
show that the statistical variability in the Weibull slope parameter m is
a function of only sample size while, for the Weibull scale parameter S0
the variability is a function of both sample size and the Weibull slope.
Since for small sample sizes the statistical uncertainty in the Weibull
parameters can be large, especially for m, important judoements and
significant analyses of strength should not be based or, small sample sizes.
From Fig. 2 ano 3 it can be seen that sample sizes of at least 30 should be
used for all but the most preliminary investigations, although for small m's
to get acceptable levels of S may require as many as 100 samples. Similar0
results and conclusions were reached in earlier Monte Carlo simulation
studies.12 , 13
Figures 4 and 5 show that the statistical reproducibility of the fatioue
parameter N and B as determined by the dynamic fatigue experiment is strongly
dependent on both sample size and the fatigue resistance cf the material
ilarge N values generally represent materials with a preater fatigue
resistance). For sample sizes of less than 100, the statistical uncertainty
in N and B can be very large, especially for the more fatioue resistant
material. Again there is good agreement between the Monte Carlo technicue for
estimating the statistical reoroducibilitv and that derived from statistical
mob",-

--.
theory; th~is, giving evidence of -he validity of the assumotions made in
deriving the equations for statistical variability (see 4ppendix).
Tne statistical variability of the fatigue parameters !1 and E as de-ermirned
by tne OYnamic fatigue experiment was also dependent on the number of stressinc
rates chosen, stressing rate range, and the Weibuil slope m. For exam-le.
Fig. , shows that for the same range of stressing rates (maximum to minimum"
and the same total number of samples, uncertainty in statistical reproducibilitv
increased as the number of stressing rates used in determininc N is increased
from 2 to 7. The best statistical reproducibility occurs for the case where
N is determined from strength measurements at two stressing rates corresponding
to the maximum and minimum. Fioure 7 shows the statistical variatiliiy of
as a function of m, keeping the other parameters constant, and illustrates
that low m values, corresponding to a greater variability in strength, re-
sult in a larger uncertainty in N. Figure 8 shows that the statistical
variability of N is quite sensitive to the stressing rate range, with the
variability inicreasing with a decreasing range of stressing rates. Finally.
it should be noted that the Monte Carlo results were left out of Fics. E, 7,
and 8 for clarity; however, these results agreed quite well with those shown in
the figures based on statistical theory.
The distributions of the fatigue parameters N and 6 as generated by the
Monte Carlo computer simulation technique for the dynamic fatigue experiment
could be approximated by a normal distribution. Finure 9 shows that a normal
distribution well represents the histogram for the fatigue parameter N.
Histoorams for the Weibull parameters m and S could also be approximated by0
normal distributions. This is important because the confidence limits of
reproducibility for a given parameter can be estimated by simply multiolinc

:ne stanc ar-. av'a --icn by z.e a ccccr4 a a r or nc--a" 3~:-.7r.
-ezresan.: ::7e 7 n-erval ,jrere a cu:- 3~ -:ie va" es -:r a : .'er -.a -;7e"z
7',~e Sccu- 7. -:: acu '-: e -5n a323s~~r e sz 0r
anc 3 as :ermine-I by 7:he s -- c. Fa zi ue ex:er menz q~ere s m, ar c
.rCSa sflc,.f -:r :ne dynamic fa-.41ue ex'per~men:. nh pa r-.4cu la r -:-,e s :a: s:c a
'i C- t 3 as *Ctera7inea b,/ -- e sza:-.4- -a:- 17ue ;--
i z -1 nrcreasing Sarrcia S d2 7 -teased 1:-,r ie~5 >yr
:ereseas -ne a2[c1ieC S~ress -ance ncreased, anc- tec.-ease: zs n
:El ~c a -amet: -7 4creas2c. -o r a ze sac, nC~e 3Es3 ra-.<e ~
D 3 s ar, c a s n amD-e , s e : ) rrc uCb c 0 oc -jrs c r :.a z aS af *r
anc a r'e oee'inec -:r'o 7: -Ie-:- -a .;re -neasuremen 7.s a z" i~~ :<ec
s-ressas ::rres-zoncing : -1~ Jaxr-r anc -~u.o :,,e :-se :-: 7U7 -
so:ressas, t~le sa.sio var4abil',ty depended miainly on thne :o number o f
sampes, noct on -. e number of samples per applied s-cress, and on'>y somewnar
on one %n-.er olr aool ,ed s--ressas used t-- deternine N and 3. "Is befsre,
:nere 4as :-occ agreefen: beo.'een one Mcnta C-arlo analysis a n 'I tne s:~ z- S
by --he Mcnte- ̂ .ar'io analys-is :-oui be approlxima :ed by nor-ra" Jisz-ibuti.-ns.
Finlally, Snhould be noted trat tone ma--n :uda of tne so:.:.a recrocuc'.:7:
-Ei

Finally, it should be noted that there was a small bias present in the
Monte Carlo generated values for m, S , N, and B, especially for small
sample sizes. It is well knw 1that when random variables are combined in a
non-linear fashion, the resulting quantity is generally subject to biases, 4;.e.
the combined effect of the random fluctuations of the individual variables
will cause the derived quantity to be systematically larger or smaller than
it would have been in the total absence of such fluctuations. Biases in m
and S 0have been previously discussed.i2 ,13 ,15 These systematic biases in the
derived parameters were quite small in comparison with the statistical
reproducibility of the parameters; hence, they were neglected in the
statistical reproducibility -.1 a given parameter.

Thnce -.ne s a:s:; -e2 r-cuZ .. ni': :-a : %'e ca rae-a n
.3 s <ncn as a -n :.n 2" sa~rc'- Sa inc r:ne ,::nee -:as7 -a--z.s-e
zrres:cncinc s a s -2an c r : a;-/ a; -re : rc::nsa: e :e
nu:e r:~~e.~ exa: 1~'c ven~ 2e~ ore :atien 3uEs -_s :3.nr
da n r-e ne'e - -' 3 - - :;:a aae:a: -. .~ ~e22
.3:in- as: :an ace z:as :S a
a i - a,. e- m S 2 a 5 a7::-a sni e :re - a S a- -
l s s .1 '4a:er :ase' a : . -P. ~:7 5.':,cwn an Zn,; c ure -e:Dresev.:
.r'e ncir,:a~~y -',e -.- 7:-- a:5 .7, :
anc 3. 7-ese - ue aarajmeers .-iere ass~re' c -o eae ra ty :
:Yn~r -u 2 ~s ecn " -u e, us-c tn re s -_r es s c e s .r n s sr s a
~~~a ~ ~ ~ AD -n': s n~ c2 r,3 . as. Te -': n n an rm eX a- .
:a rCa!-c :'a anS , :re~n>:a m c :f-:~
.2 u:-c c- : %me ames a auSec i ose a-at aMe z?-- aS
:r~~~cnen;r zan -a-i a c~~u ca m a o s ~ e- a:
- -Pa. :35C an a-a men iaA ..2a- a
-~c 5 - .- r r,-

17.
in the dynamic fatigue test. An uncertainty of + 10' requires about 140
samples to be used in the dynamic fatigue test for the stressing rate range of
0.013 to 50 MPa/s. However, it can be seen from the Fig. 12 that if the stress-
ing rate range is increased to O.0005 to 50 MPa/s, then the number of samples
required would decrease to about 75 On the other hand, if the stressing
rate range is decreased to 0.05 to 5.0 'Pa/s, the number ot salmples required
increases to about 300. This figure clearly shows that sample size require-
ments are not necessarily small and depend on the specific degree of reproduci-
bility that is acceptable.
The analysis of statistical reoroducibility can also be useful in de-
termining whether a given variable effects the fatigue benavior of a
material. For example, the fatigue behavior of soda-lime glass has been
measured as a function of test environment (6N NaOH, distilled water, and r
6N HCI) using the dynamic fatigue test with stressing rate range of ' 6 to
0.17 MPa/s and a total of 120 samples for each dynamic fatigue test.16
The effect of test environment can be seen by calculating the allowable s:ress
for samples that have been proof tested up to 1OMPa and that must survive
a minimum of one year in service. The result of these calculations are given
in Table I with the indicated + one standard deviation limits due to the
statistical uncertainty in the fatigue constants N and B. It is seen that
the three predicted allowable stresses are well outside of a standard deviation
from each other and, thus, it is likely that the test environments do have a
significant effect on the fatigue behavior of soda-lime glass. While this
conclusion seems quite straightforward, it must be remembered that before any
meaningful conclusions can be drawn regarding the effect of a oarticular
variable on the fatigue behavior of a material, it must be demonstrated tnat
the effect is larger than the statistical reproducibility of the experiment.

18.
ACKNOWLEDGEMENT
This research was supported by the Office of Naval Research, Contract
No. N00014-78-C-0836 and National Science Foundation, Contract No.
DMR 77 05647.
I;

19.
Table 1. Predicted Allowable Applied Stress for a Minimum Lifetime ofOne-Year for Soda Lime Glass Samples Proof Tested at 100 MP
Environment In 3 (MPa2. s ) :a (,Pa)
6N NaOH 19.5 H 2.81) .168 (+ 1.64) 25.95 ( 3.36
Distilled H20 13.0 (+ 1.11) 2.585 (+ 0.87) 15.92 (H. 1.58
6N HCI 25.1 (+ 4.35) -16.058 (+4.67) 13.36 (H 2.15)
+ Number in parenthesis is + one standard deviation corresponding to statist icalreproducibility of dynamic fatigue experiment.

20.
REFERENCES
1. A.G. Evans and S.M. Wiederhorn, "Proof Testing of Ceramic Materials.Analytical Basis for Failure Prediction," Int. J. Fract. Mech., 10,379-92 (1974).
2. J.E. Ritter, Jr., "Engineering Design and Fatigue Failure of BrittleMaterials," pp. 667-86 in Fracture Mechanics of Ceramics, Vol. 4, ed.by R.C. Bradt, D.P.H. Hasselman, and F.F. Lange, Plenum Pr-ss, N.Y. (1978).
3. S.M. Wiederhorn, "Subcritical Crack Growth in Ceramics," pp. 613-46 inFracture Mechanics of Ceramiscs, Vol. 2, ed. by R.C. Bradt, D.P.H. Hasselman,and F.F. Lang, Plenum Press, N.Y._(1974).
4. D.F. Jacobs and J.E. Ritter, Jr., "Uncertainty in Minimum Lifetime Predic-tions," J. Am. Ceram. Soc., 59, 481-87 (1976).
5. S.M. Wiederhorn, E.R. Fuller, J. Mandel, and A.G. Evans, "An Error Analysisof Failure Prediction Techniques Derived From Fracture Mechanics," J. Am.Ceram. Soc., 59, 403-11 (1976).
6. J.E. Ritter, Jr., N. Bandyopadhyay, and K. Jakus, "Statistical Reproduci-bility of the Crack Propagation Parameter N in Dynamic Fatigue Tests,"to be published J. Am. Ceram. Soc.
7. K. Jakus, D.C. Coyne and J.E. Ritter, Jr., "Analysis of Fatigue Data forLifetime Predictions for Ceramic Materials," J. Mat. Sci., 13, 2071-80 (1978).
8. G.J. Hahn and S.S. Shapiro, Statistical Models in Engineerinq, J. Wileyand Sons, N.Y. (1967).
9. N.R. Mann, Ray E. Schafer, N.O. Singpurwalla, Methods for StatisticalAnalysis of Reliability and Life Data, John Wiley & Sons, New York (1974).
10. W. Weibull, "A Statistical Distribution Function of Wide Applicability,"J. Appl. Mech., 18, 293-97 (1951).
11. J. Mandel, Statistical Analysis of Experimental Data, Wiley-Interscience,N.Y. (1964).
12. R.A. Jeryan, "Use of Statistics in Ceramic Design and Evaluation," po. 35-51in Ceramics for High Performance Apolications, Tied. by J.J. Burke, E.N.Lenre, and R.N. Katz, Brook Hi7 Publishing Co., Chestnut Hi1l, M0A (1978).
,3. 3.R. Thoinan, L.J. Bain, ana LE. Antle, 'Inferences )n t ,e 'araneters othe Weibu~l Distribution," Technometrics, !!, - 'P6 3).
14. ..E. Ritter, Jr., and S.A. Wul9 , "'Evauation of Proof -estn o r, AssureAgainst Delayed Failure," Am. Ceram. Soc. Bull., 57, l'31-:6-9C

21
15. K. Trustrum and A. De S. Jayatilaka, "On Estimating the 'eibull ".odulusfor a Brittle Material," J. Mat. Sci., 14, 1080-84 (1979).
16. J.E. Ritter, Jr. and R.P. LaPorte, "Effects of Test Environment on StressCorrosion Susceptibility of Glass," J. Am. Ceram. Soc., 58, 265-67 21975).
17. P.R. Bevington, Data Reduction and Error Analysis 'or the Physical Sciences,McGraw-Hill Book Co., New York ,1969).
13. D.G. Rickerby, "Further Comments on Strain-Rate-Dependent Effect ofSpeciman Volume on the Strength of Brittle Materials," J. Am. Ceram.Soc., 61, 369 (1978).
.1
4
A

F G' RE S
Fiziure 1.Flow iia-,ram :or >1onte Carlo :echnioue for evaluatino, :- e as clre or odjuc ibili41cy o -:'1a no 3 a s d e te rm-,I n ed7 from t Ynamic 'ra-,4-e2x oe r imen.
Figure 2. T-he c oeffic 4e nt o - v arari an ( C. o f .4eib L' sIatce --ar a-:e teas a function of sample size for various values -. a. T ne 'cr.:e,arto resuls are given by the data coints and Are ccmoared topredictions from statistical theory, Eq.(O'a
Figure 3.The coefficient of variation of Weibull scale :oaramete-r S fo rvarious values of mn as a function of samole size. T1he >loRte C-arloresults are cijven by the data Doints and are -comiared to :rec~cticnsfrom s ta tis t Ic a, t heo ryE.
Figure d. The coef ficient of variation of fatigue r-arameter as a fu-nctionof total number of samples used in dynamic faticue exo)er~ienr ,4itn3 stressinq rates (0.313 to 50 lPa/s). T ne lante Carlo result-s aregiven by the data, coints and are comoared to predictions rom sta:is-Cal t-heory. i nqa .. e T 9 'ebulIl and Fati que conrstants c'rosen arec yoical of soda-lim,,-e glas (m1= 15 .0', S 133.3 >D Pa, 2 and
3 C .13 ',IPa 's) and vitrified crincino ,iheel 7at-eria<,
m.=i , o.= 5 3 MtPa, '1 = 13. 2 and 3 1.1 x 10~ "Pa -*s
F-igure -5. The coefficient of variation o-f Fatigue -arameter 3 as a 7unction orFtotal number o" samples used in dynamic f7atioue ex )erlient ,Itn 3stressing rates '3.013 toa 50 !Pa,'s). The '!on--e Carlo -esu s aregiven oy toie 3aca coints and coiioared to -.recictiors -rtsa--is:'Jca
theoy, 5.(9b. Te ,ieibull and fa-icue constants ch osen are tac
of soda-im,,e glass (m-. 13.5 . 133.7" ''Pa, N 13.0 ad
3.1 >P a s and vitrified -,rinding i~heel material I m-
= 53 l~a, 03.2and 3 =1.1 x 19- 5'P~j
~iure o. ne coef-ficient of variat-ion .,f fati ue :tarameter a S a u:.ncticn atotal number of samples used in yvna m ic a ci ue ex e rim7e nt tstressing rate range of 0.313 to 50 >iPa/s. The numter orF stress-.ncrates used in determining :1 is as indicated and the arorteconstants
a re N = 13.0 3 P 0.1 'Ps, m.=j 32, and S. 133.3 !Pa.
r, ure 7. e coe-fiien rf variati-on of faticue Zara;-oecer i as a unctian :r-otal num-,ber of sa7Dles se i - n ovnaric ~t~eeo~es-ressinoi rates '].13 to SC'APas5 arc as a :unc:-'cn .;ebi t
3 oce c-ar^ameter Ti,~n tne Dtner cosa~sa~e 'I 1.0
3 )J 0.13 S!a5, a o 3 133 la

Figure 3. The coefficient of variation of fatiaue para-eter as a 'jnc-, sn :ftotal number of samples usea in dynamic 'oirue exoeriment ror 3stressing rates with rwo ranges:0.913 to 5, ano ,0.35 to . t4a, s.
'2The aopropriate constants are I= 13.a, 3 = 3.12 MPa-s, m= 3.2,and Sol= 138.0 MPa.
Figure 9. Histogram for fatigue parameter i as :etermined M.onte C:aric simula-eddynamic fatigue experiment for 3 stressing rates r'C.,'13 to -o '. Pa:s'using a total .of 150 samples. The suoerim oosec smooth curve is -heprobability density function of the normal distribution e~itn tre -amemean and variance as the Monte Carlo results.
Figure 10. The coefficient of fatigue parameter .'! as a function of total number
of samples used in dynamic fatigue ex.oeriment with 3 st7ressin, rates(0.013 to 50 MPa/s) and static fatigue experiment with 3 acolied stresses
(40 to 53.6 MPa). Experiments are typical for soda-lime class-
(N = 13.4, B = 0.13 MPa s, 'I. 3.2, and =13S.0 Pa).
Fiqure 11. Design diagram for minimum lifetime prediction after orcof testina icrM 2 .s 3. .m
soda lime glass (1 13.4, 3 = 0.18 MPas, m= 3., and S= . .. A
The 90", confidence limits are shown for 3 samole sizes -5, 20, and "sC'used in dynamic fatigue experiment with 3 stressing rates ',...13 to50 MPa/s).
:igure 12. 90 confidence limits for the proof stress to assure a minimum lifetimeof 10 years at a constant aoplied stress of 7 1'IPa for soda-lime qlass
2( = 10.4, B = 0.18 MPa 2., mi= 3.2, S .= 133.0 ,Pa) as a 'unctionof sample size used in dynamic fatigue eb. eriment with 3 stressinc ra-esin the range of 0.05 to . 0.013 to 7C, and 0.005 to 30 MPais.
- OWN

INPUT: N, B, mso
Calculation of Ideal Fatigue Population
From Eq. (5):
S= f (F)
For &I Randomly Choose S11 . S. . . kFor (Tj Randomly Choosesj. . S
Randomly ChooseSi ..... Sik100 From Eq. (6)
Calculate N and B by:
Median Stress Analysis, Eqs.(3) and (4)
[OUTPUT: N and B DISTRIBUTION
lCalculate Average, Standard Deviation, and Covariance

0.6
0.5
Eq. 8a
0.4
m=4.00MONTE CARLO M.2
0.3 RESULTS FOR5.
0.2
0.1
0 25 50 7 0
TOTAL NUMBER OF SAMPLES

3;, 26.
MONTE CARLO m=40E
RESULTS FOR M=82 00.06- =1.,
Eq. 8(b) for m=4.0
S0.04-
Eq. 8(b) for m=8.2
0,02-
25 50 75 100
TOTAL NUMBER OF SAMPLES

27.
C.V. (N)
o> 0 0r- I
<I ar0 5 -4 %
r m rz cno
CC-n ci,
(n~>0
2- < c_0 N C _
I- 0 -n >
> mn
z U>coC)UNQ(
mrLWJ

-- 28.
C.V. (B)N (AJ
0 00
00
z c~m m
m -0~
o- 01 -
m1 0 -'
m
z
zmm m
0 lb

29.
C.V. (N)
0 0 00 N('I 0
0
-I
0
z N ()J
Cwm
0~1
II-
N mC,, 0 -~
0 -
0
00

C.V. (N)
0 0 0
0
-4 0
rzCD
-n
mI

C.V. (N)
00
00IN
> b
00
00
1(- 0

32.
FREQUENCY
o L5 0 0
cDc
N N
0 0

33.
C.V. (N)
0 0
0m000
zn
o >0)
-n
a))
0
-n4
0--n>i
U) m
-. m
0
0m
m**'

34.
Ln 2Ln(tmin G)
b 0 b00 0 0 0
00
X -C0
M-
0
C)) Co Cl *
M m )MI 0l /
ai M -0
0 0 0'
00
tmin at 7MPc

% EXPECTED VALUE (G-p)
If
I-- 1 0 .i J1 0
0
co00
009M Iz 0F0- 0Im rnC1 0
r I I Io-~ . I
0-

I. Linear Recression
Linear rec<riesson !s oene,--ail usec :c arna':ze the test data ;r ce--
,ng -re tie rameers ! and .. Te variances of these fatue -a'--,---'<
ca- then be es:7-_ ec :)v uc1n tne la cf o)rozacatior of errors. commor v
known as the chain rule. If '!1 Tne chain rule is a linear approximation ano
becomes inaccurate when the coefficient of variation ratic of the standard
deviation tc the mean' o' the data is lare. !. ,anoel sives tne %C c- thumb
that tne coefficient of variation shoulc not exceed lot.
in linear regression j data values are least squares fitted to a straiaht
line wnose equation is given by:
where y is the dependent variable, x is the independent variable, a is the slope.
and b is the intercept. Assuming that all the inaccuracies occur in the
measured values of y and that tne parent standard deviation of the data, -,
is independent of x, the variances and covariance of the parameters a and bi7
can be expressed as:
f-, /,. '-
2 2where , , 5X B rearranrinc tne equation for .
"'- - -x i

t7
-S e
L;s-.a-,e ,caa K. s a n :e axz re c z:
,qners- :.n e i i C cz
-,,)E- -ct e c, nCSr
czvar-,ance~ ~~~~~~~'- -/e:a;m Ec m Bnc S znb ee--'e -F7
J' ....

-w
-V(X~
cna-rr : . one :E5:-
na~C or inetJ~ -,o :C an
tna~ :- nan, -

I
.ie c~~~i~ ~ - ~ ~ --- - --- -- . -- - --
rr De
ert "
• • . .. --
-7 7
var~anc C a~e c~e by:
- L,' 2
where V = :amr', unctior. S-nce -or :y:-ca ceraic S-crenc- :-
' Car. eE rewr.7:en •
N N
" 0 . - -" ' ''
j n = anc oXE' -n "c" 2' ,?_
-

-cn ..- z - n . - C Z , - _7 r Z V E ,.S-
'an Dv - ''-
2C - .r c7 -r, ,u ""c c -7-" --n- - -s, - ,',Z-.t
S' s -o ''E, C - S . eCn
- - ''N
/ "
",, i '' -- .
-•- %.-- -- . .s o. : a,..
,/,,,- /LL,,,,
-ns s-. .agrs;,,n .:~e -cr : r. v o~r2.~
in *' wn.o',,s ! e ,u - , :, s;... c.-- :s-?,* e , csa ,-z . -_ ,"c
".S% -e ones i in- :=. ai . Se a-: e ; z ' : :
I "

r, --:rcc.rrc .cu e 7--loc :e v a- a :c- a n c.aa c
: ' .. . c , ;: rc re ::a're -: :s. S n r
Assze or :e --ramic f C e cae ,v e : n r -
SU~~ 71E tn n.. Z. na Z vCvesu sszre .
an r, : a- eacr s-ress~nc aze numer f Crac-ure s-n - are 77easur
Te S r -nz c aZa a: each s:ressnc raEe ss r.ed rc n e ,ie-ZLi eQuacr,
zc. E :e eca n S r enct gna u e s a c :e r va r an ea
/
7u , , and (A can De wr':zer in. erms cf tre T-hn sner: tr -
,\e ouu"l siZDe, 7.,-,,ice- - c
- ~ ,...
Since n, Z oin-eenden: of s:ressinc raze, s aso nceeencen: s-
s:r,sr: '-ae, -, rCE. :hE Su:scr-- " -rcec ari:
(p- .
- ' - " - " , -

-7
-r a r - c --
e~ -r-- - ,. E n
a r c e, s E CC
".- .. aa- n-
.I
• . -- -
- -- -- - ----
a~ - z
n. -e r -
n, S E.an .. . s e n , r e =r a -n Erv r S_ E---.:e E, , E-
e ,,,- r""n ,- , e- --, E ar ee an t -er, - " e s-= r,~ e c, sa.: _ E'- n -=-.. u.. Er -a' nn -- 7 e
viner -i __ .-.- n7 e ---
n c nsa , -e ea: a : r". ,e S c - -no C: -
'.-
S-n -_a_ '_- .... . ..e: -~Mot

- :- ;c ..- -
-M. aMV
, ~~~ ~~ ,' S x ,""==-- :
-- sa sr.ar- e-C'eS~cZvr .' nZ : r.-n '
7: . - : n: e , c n a ue := me ranr _c a nr e-
,' K -c sr " es e-ve are n et r-" 7 . -.C ..' '
-- ---- .-

I
-
m-l
:re-- ;-e--- S' an ,_ z .v-s a , r n 'e
7 .-
-- - - -
, ., -. - _ - - -[ [
* - ~ .. ~ ,. .. - .. -
,. - -, '1''' .
-', ; !..P'e. ,K'. SS ,'J-z-. S ,5'S "r - -' E -. S -- : - " .'"
e ": " , : I = -- ?i - -Q *I . .N d
1< *'¢-0- -

46.
+ ()(A53)
( s (A54)-o 2-
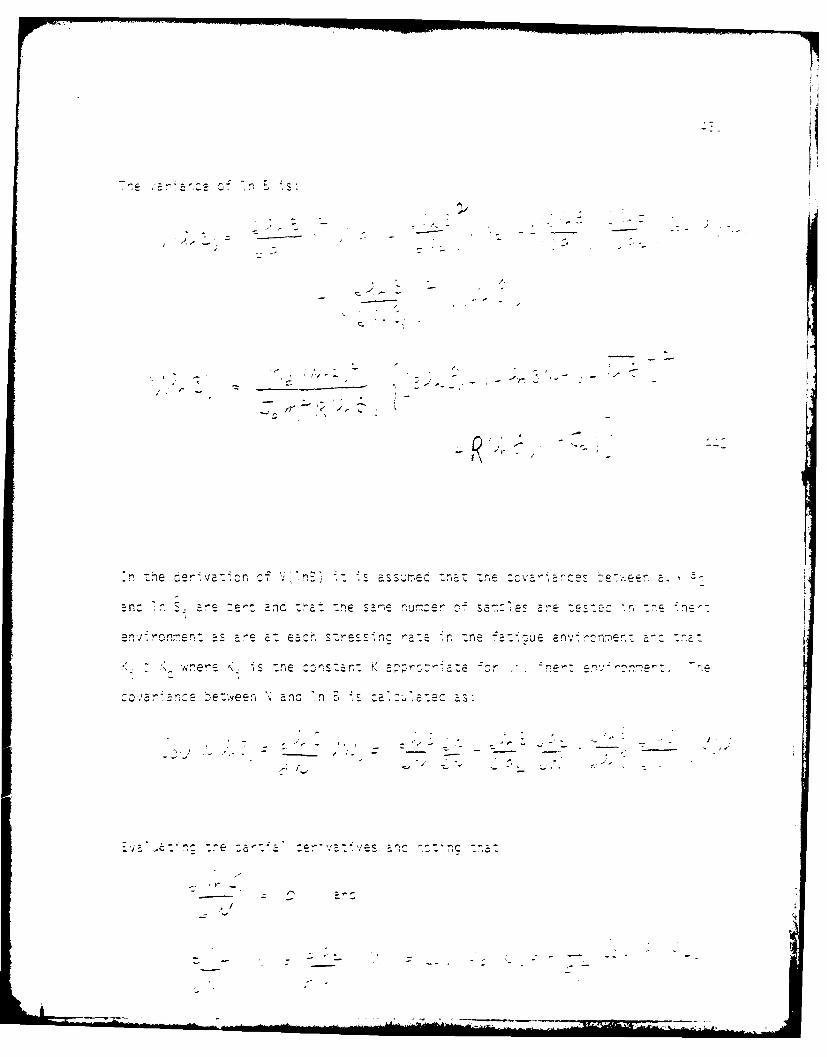
In Eqs. (A52)-(A54) it is assumed that the covariances between a3 , a4 and
In S are zero and that the number of inert strength samples is the same as the
number of samples tested in fatigue at each applied stress.
WWII