l5. choosing the right sample size sautmann 2019
TRANSCRIPT

Statistical Power and Choosing the Right Sample Size
J-PAL

I. True and Estimated Treatment Effect
II. Distribution of Treatment Effect Estimates
III. Hypothesis Testing
IV. Statistical Power and Sample Size
V. Power in Clustered Designs
VI. Calculating Power in Practice
Outline

I. True and Estimated Treatment Effect
II. Distribution of Treatment Effect Estimates
III. Hypothesis Testing
IV. Statistical Power and Sample Size
V. Power in Clustered Designs
VI. Calculating Power in Practice
Outline

Estimating the true treatment effect with an experimental sample.
Chance variation from sampling implies that the estimated effect is not always exactly equal to the treatment effect. How do we address that?
Estimates of the treatment effect from different samples
The true treatment effect: difference in outcome with and without the program.
Estimated effect
Average in control group
Average in treatment group

Estimating the treatment effect from a sample
J-PAL | CHOOSING THE RIGHT SAMPLE SIZE 6
Estimate of the treatment effect
• The best estimator of the treatment effect is the difference in the average outcomes in a randomly selected treatment and comparison group.
• A treatment effect estimate is often denoted !" (where " is the true effect).
Average in control group
Average in treatment group
Method 1: differencing Method 2: regressionUse OLS to regress the outcome variable on the variable indicating treatment (equal to 1 if treated, equal to 0 if not treated)

Randomization guarantees that treatment and control are not systematically different. They may still be different:
Sampling variation and the treatment effect estimate
J-PAL | CHOOSING THE RIGHT SAMPLE SIZE 7
Population
Comparison
Treatment
Random sampling
The treatment effect estimate will vary due to chance differences between the two groups.

I. True and Estimated Treatment Effect
II. Distribution of Treatment Effect Estimates
III. Hypothesis Testing
IV. Statistical Power and Sample Size
V. Power in Clustered Designs
VI. Calculating Power in Practice
Outline

Example: evaluate the effect of a remedial education program in urban Indian schools on test scores.
J-PAL | CHOOSING THE RIGHT SAMPLE SIZE 9
Photo: Putul Gupta | J-PAL Photo: Arvind Eyunni | Pratham

Example: the distribution of standardized school test scores in urban Indian schools.
A sample of over 23000 students shows the natural variation in standardized test scores (data from the “Balsakhi” remedial education program).
Source: Banerjee, Abhijit; Cole, Shawn; Duflo, Esther; Linden, Leigh, 2017, "Balsakhi", Harvard Dataverse,
Research publication: Abhijit Banerjee, Shawn Cole, Esther Duflo, Leigh Linden; “Remedying Education: Evidence from Two Randomized Experiments in India”, The Quarterly Journal of Economics 122(3), 1235–1264.

Different random samples from the same population lead to different treatment effect estimates.
J-PAL | CHOOSING THE RIGHT SAMPLE SIZE 11
Samples of size 200 drawn from original Balsakhi data.

-3 -2 -1 0 1 2 3 4 5 6 7 8 9 10
Frequency
Difference
Estimated impact from one experiment
J-PAL | CHOOSING THE RIGHT SAMPLE SIZE 12

Three experiments, three estimated impacts
J-PAL | CHOOSING THE RIGHT SAMPLE SIZE 13
-3 -2 -1 0 1 2 3 4 5 6 7 8 9 10
Frequency
Difference

Six experiments, six estimated impacts
J-PAL | CHOOSING THE RIGHT SAMPLE SIZE 14
-3 -2 -1 0 1 2 3 4 5 6 7 8 9 10
Frequency
Difference

Many experiments: a distribution of estimates
J-PAL | CHOOSING THE RIGHT SAMPLE SIZE 15
-3 -2 -1 0 1 2 3 4 5 6 7 8 9 10
Frequency
Difference

Many experiments: a distribution of estimates
J-PAL | CHOOSING THE RIGHT SAMPLE SIZE 16
-3 -2 -1 0 1 2 3 4 5 6 7 8 9 10
Frequency
Difference

Many experiments: a distribution of estimates
J-PAL | CHOOSING THE RIGHT SAMPLE SIZE 17
-3 -2 -1 0 1 2 3 4 5 6 7 8 9 10
Frequency
Difference

Many experiments: a distribution of estimates
J-PAL | CHOOSING THE RIGHT SAMPLE SIZE 18
-3 -2 -1 0 1 2 3 4 5 6 7 8 9 10
Frequency
Difference

Distribution of estimates if the true effect is β
Randomization guarantees that the estimated effects are normally distributed around effect β.
β Possible values of estimate !" from different experiments
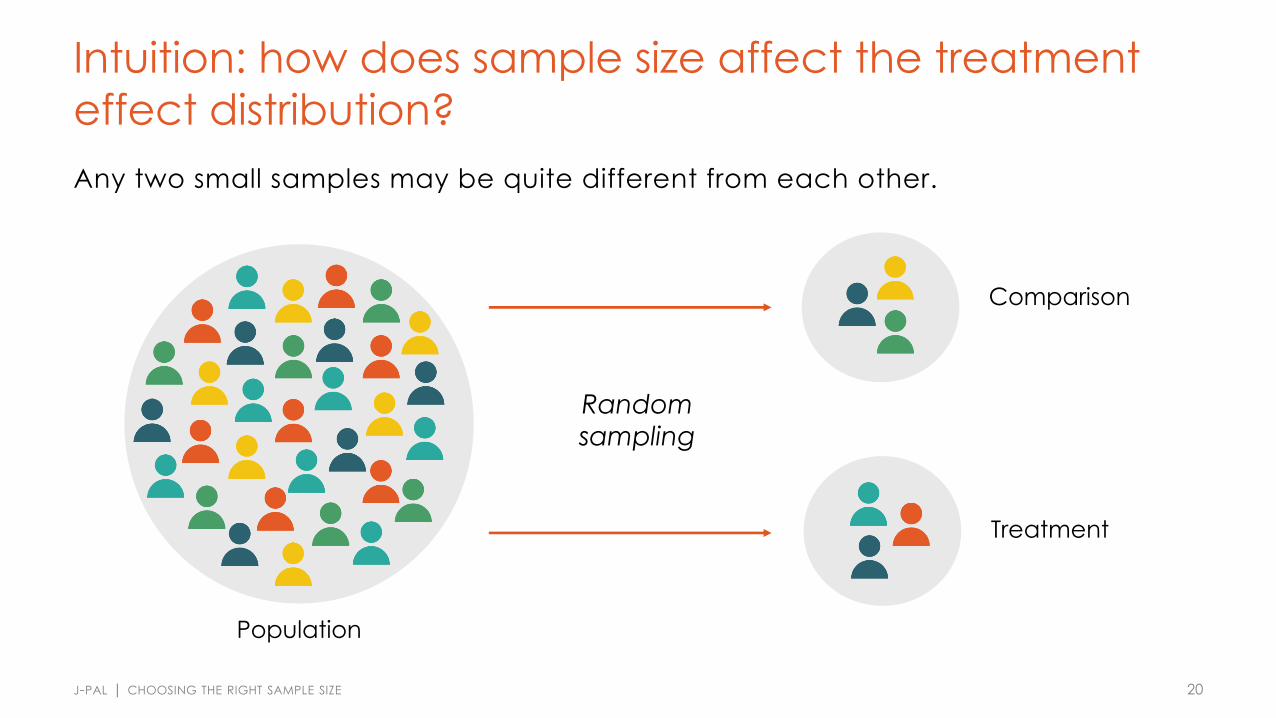
Intuition: how does sample size affect the treatment effect distribution?Any two small samples may be quite different from each other.
J-PAL | CHOOSING THE RIGHT SAMPLE SIZE 20
Population
Random sampling
Comparison
Treatment

Intuition: how does sample size affect the treatment effect distribution?Larger samples tend to be more representative of the population and more similar to each other.
J-PAL | CHOOSING THE RIGHT SAMPLE SIZE 21
Population
Comparison
Treatment
Random sampling

If treatment and control group are more representative, effect estimates from different samples vary less.
J-PAL | CHOOSING THE RIGHT SAMPLE SIZE 22
-3 -2 -1 0 1 2 3 4 5 6 7 8 9 10
Frequency
Difference

If treatment and control group are more representative, effect estimates from different samples vary less.
J-PAL | CHOOSING THE RIGHT SAMPLE SIZE 23
-3 -2 -1 0 1 2 3 4 5 6 7 8 9 10
Frequency
Difference

Intuition: how does variation in the underlying population affect the treatment effect distribution?Samples from a population with high outcome variation can look quite different.
J-PAL | CHOOSING THE RIGHT SAMPLE SIZE 24
Population
Random sampling
Comparison
Treatment

Intuition: how does variation in the underlying population affect the treatment effect distribution?Samples from a population with little outcome variation tend to be more similar to the population as a whole and to each other.
J-PAL | CHOOSING THE RIGHT SAMPLE SIZE 25
Population
Random sampling
Comparison
Treatment

Intuition: how does the sample split into treatment and control affect the treatment effect distribution?An additional subject in the smaller group – a more even split – reduces the sampling variation by more.
J-PAL | CHOOSING THE RIGHT SAMPLE SIZE 26
Comparison Treatment

β Possible values of estimate !" from different experiments
If treatment and control group are more representative, effect estimates from different samples vary less.

Larger samples, lower outcome variation, or a more even sample split: estimate distribution is more concentrated around true β.
βPossible values of estimate !" from different experiments
If treatment and control group are more representative, effect estimates from different samples vary less.

I. True and Estimated Treatment Effect
II. Distribution of Treatment Effect Estimates
III. Hypothesis Testing
IV. Statistical Power and Sample Size
V. Power in Clustered Designs
VI. Calculating Power in Practice
Outline

Problem: we only see one estimate, from the experiment at hand. What do we conclude?
The true treatment effect ! is unknown.
"!

Hypothesis testing
J-PAL | CHOOSING THE RIGHT SAMPLE SIZE 31
Null hypothesis
The null hypothesis (H0) is that there was no (zero) impact of the program on the outcome variable, i.e. ! = 0.
• Start by assuming that the program did not cause any change
• Ask: how likely is it that we would see an estimate as large as "# in an experiment, if the true effect was actually zero?
• If it is “very unlikely”, we can reject the null hypothesis.

Distribution of estimates if the true effect is zero
Assume a treatment effect of ! = 0.
Estimates as large or larger than this one are very unlikely
0 "!

Distribution of estimates if the true effect is zero
Assume a treatment effect of ! = 0.
But lower values may easily happen.0 "!

Definition: Significance Level
J-PAL | CHOOSING THE RIGHT SAMPLE SIZE 34
Type I error (false positive)
The probability of falsely concluding that there is a treatment effect.
The probability of rejecting the null hypothesis β = 0, even though the null hypothesis is true.
With any estimate, there will be some chance of a Type I error.
Significance level
The maximal probability of a Type I error we want to allow.
5% is most commonly used, but also 1% and 10%.
We say “ !" is statistically significantly different from zero at the 5% level” if an estimate this high (or low) has less than 5% probability under the null hypothesis.

Is !" statistically significantly different from zero at the 5% level?
Only #" that are large or small enough lead us to reject the null hypothesis of no treatment effect.
Reject null (< 5% likely)
Reject null (< 5% likely)
0

Is !" statistically significantly different from zero at the 5% level?
Only #" that are large or small enough lead us to reject the null hypothesis of no treatment effect.
Reject null (< 5% likely)
Reject null (< 5% likely)
0 !"

Is !" statistically significantly different from zero at the 5% level?
Only #" that are large or small enough lead us to reject the null hypothesis of no treatment effect.
Reject null (< 5% likely)
Reject null (< 5% likely)
0 !"

Critical Values for !"
The estimate #" is statistically significant at the 5% level if it lies outside the critical values.
Reject null (< 5% likely)
Reject null (< 5% likely)
Values closer to zero than the critical values have a probability of 95%, those further away have 5% probability.
0

Critical value
Variance
Sample Size
Critical value from Student t distribution for significance level α
Proportion inTreatment
Critical Values for !"
J-PAL | CHOOSING THE RIGHT SAMPLE SIZE 39
The critical value will be closer to zero with• larger sample size N• smaller outcome variance σ

Suppose the sample size is increased. For the same treatment estimate !", is it more or less likely that the null is rejected?
A. More likely
B. Less likely
C. The probability is unaffected
D. Uncertain
J-PAL | CHOOSING THE RIGHT SAMPLE SIZE 40

An increase in the sample size
Reject null (< 5% likely)
Reject null (< 5% likely)
0!"

An increase in the sample size
Reject null (< 5% likely)
Reject null (< 5% likely)
!"0

• Larger treatment estimates !" are less likely when the true treatment effect is zero. Randomization allows us to know how likely.
• If it is very unlikely (less than 5% probability) that the T-C difference is solely due to chance: – “We can reject the null hypothesis.”
– “The program has a statistically significant impact.”
• This is a conservative approach.
• Emphasis is on avoiding false positives (Type I error).
Hypothesis Testing: Summary and Conclusions
J-PAL | CHOOSING THE RIGHT SAMPLE SIZE 43

I. True and Estimated Treatment Effect
II. Distribution of Treatment Effect Estimates
III. Hypothesis Testing
IV. Statistical Power and Sample Size
V. Power in Clustered Designs
VI. Calculating Power in Practice
Outline

Definition: Type II Error and Statistical Power
J-PAL | CHOOSING THE RIGHT SAMPLE SIZE 45
Type II error (false negative)
The probability of falsely concluding that there is no treatment effect.
The probability of not rejecting the null hypothesis (H0), even though the null hypothesis is not true.
Statistical Power
The probability of a correct positive.
The probability of avoiding a Type II error.
Typically, we aim for 80% power (some aim for 90%)

If the true effect was β…
The distribution of treatment effect estimates is given by Hβ.
H0 Hβ
True effect=0
True effect=ββ
Critical value
significance α=5%

Shaded area shows power: probability that we obtain a treatment effect estimate which leads us to reject H0 (when the true effect is β).
Power
βTrue effect=0
True effect=β0
Critical value
significance α=5%
H0 Hβ
… how often would we reject the null hypothesis?

Power is lower with a smaller (true) treatment effect.
With a small β, the null hypothesis is rarely rejected.
H0
βPower
True effect=0
True effect=β0
Critical value
significance α=5%
Hβ

Power is greater with a larger (true) treatment effect.
Greater effect size (relative to estimate dispersion) means more power
H0
βPower
True effect=0
True effect=β0
Critical value
significance α=5%
Hβ

1. Effect Size: a large effect is easier to distinguish from zero than a small effect.
Power: Main Ingredients
J-PAL | CHOOSING THE RIGHT SAMPLE SIZE 50

1. Effect Size: a large effect is easier to distinguish from zero than a small effect.
2. Variance: greater variability in the outcome variable makes it harder to distinguish an effect.
Power: Main Ingredients
J-PAL | CHOOSING THE RIGHT SAMPLE SIZE 51

1. Effect Size: a large effect is easier to distinguish from zero than a small effect.
2. Variance: greater variability in the outcome variable makes it harder to distinguish an effect.
3. Sample Size: a larger sample means that treatment and control are more representative of the overall population, making it easier to distinguish an effect.
4. Sample split: an equal proportion in treatment and control makes it easiest to distinguish an effect.
Power: Main Ingredients
J-PAL | CHOOSING THE RIGHT SAMPLE SIZE 52

1. Effect Size: a large effect is easier to distinguish from zero than a small effect.
2. Variance: lower variability in the outcome variable makes it easier to distinguish an effect.
3. Sample Size: a larger sample means that treatment and control are more representative of the overall population, making it easier to distinguish an effect.
4. Sample split: an equal proportion in treatment and control makes it easiest to distinguish an effect.
Power: Main Ingredients
J-PAL | CHOOSING THE RIGHT SAMPLE SIZE 53

1. Effect Size: a large effect is easier to distinguish from zero than a small effect.
2. Variance: lower variability in the outcome variable makes it easier to distinguish an effect.
3. Sample Size: a larger sample means that treatment and control are more representative of the overall population, making it easier to distinguish an effect.
4. Sample split: an equal proportion in treatment and control makes it easiest to distinguish an effect.
Power: Main Ingredients
J-PAL | CHOOSING THE RIGHT SAMPLE SIZE 54

Minimal Detectable Effect Size
J-PAL | CHOOSING THE RIGHT SAMPLE SIZE 55
Minimal Detectable Effect (MDE)
The minimal effect size that can be detected with given statistical power (probability of correct positive, e.g. 80%), statistical significance (probability of a false positive, e.g. 5%) and sample size N.
• Ask: is it reasonable to expect effects as large or larger than the MDE?• Would I like to be able to detect effects smaller than the MDE?
• Based on the MDE, can adjust the sample size to get to a realistic experimental design.

Minimal Detectable Effect Size (MDE)
How far out must ! be so that we get κ = 80% power?
H0
True effect=0
True effect=β
Critical value
significance α=5%
0

Minimal Detectable Effect Size (MDE)
How far out must ! be so that we get κ = 80% power?
power κwanted: 80%
β
H0 HβPower
True effect=0
True effect=β0
Critical value
significance α=5%

MDE� = (t + t↵) ·
s1
P (1� P )· �
2
N<latexit sha1_base64="xAIZtvzqB8qr04sAECJCzHlqUHo=">AAACR3icbZDNaxNBGMZn41eNX9EeexkMQooYdougF6FUhV6UCKYtZNLl3cm7yZDZ3XHm3UIY9r/z4rU3/4VeelDEo5OPg7Y+MPDwPO/LzPwyo5WjOP4etW7cvHX7ztbd9r37Dx4+6jx+cuSq2kocykpX9iQDh1qVOCRFGk+MRSgyjcfZ/O2yPz5D61RVfqaFwXEB01LlSgKFKO2cfnj3PhUZEvA3QmNOPUq9mIMx0DynVIA2MxBWTWe0K+SkIuG+WPIityB90vhBL3kx2G3W1SoUTk0LON1r/MemSTvduB+vxK+bZGO6bKNB2jkXk0rWBZYkNTg3SmJDYw+WlNTYtEXt0ICcwxRHwZZQoBv7FYeGPwvJhOeVDackvkr/3vBQOLcosjBZAM3c1W4Z/q8b1ZS/HntVmpqwlOuL8lpzqvgSKp8oi5L0IhiQVoW3cjmDQIMC+naAkFz98nVztNdP4n7y6WV3/2CDY4vtsKesxxL2iu2zQzZgQybZV3bBfrCf0bfoMvoV/V6PtqLNzjb7R63oD7ngsw0=</latexit><latexit sha1_base64="xAIZtvzqB8qr04sAECJCzHlqUHo=">AAACR3icbZDNaxNBGMZn41eNX9EeexkMQooYdougF6FUhV6UCKYtZNLl3cm7yZDZ3XHm3UIY9r/z4rU3/4VeelDEo5OPg7Y+MPDwPO/LzPwyo5WjOP4etW7cvHX7ztbd9r37Dx4+6jx+cuSq2kocykpX9iQDh1qVOCRFGk+MRSgyjcfZ/O2yPz5D61RVfqaFwXEB01LlSgKFKO2cfnj3PhUZEvA3QmNOPUq9mIMx0DynVIA2MxBWTWe0K+SkIuG+WPIityB90vhBL3kx2G3W1SoUTk0LON1r/MemSTvduB+vxK+bZGO6bKNB2jkXk0rWBZYkNTg3SmJDYw+WlNTYtEXt0ICcwxRHwZZQoBv7FYeGPwvJhOeVDackvkr/3vBQOLcosjBZAM3c1W4Z/q8b1ZS/HntVmpqwlOuL8lpzqvgSKp8oi5L0IhiQVoW3cjmDQIMC+naAkFz98nVztNdP4n7y6WV3/2CDY4vtsKesxxL2iu2zQzZgQybZV3bBfrCf0bfoMvoV/V6PtqLNzjb7R63oD7ngsw0=</latexit><latexit sha1_base64="xAIZtvzqB8qr04sAECJCzHlqUHo=">AAACR3icbZDNaxNBGMZn41eNX9EeexkMQooYdougF6FUhV6UCKYtZNLl3cm7yZDZ3XHm3UIY9r/z4rU3/4VeelDEo5OPg7Y+MPDwPO/LzPwyo5WjOP4etW7cvHX7ztbd9r37Dx4+6jx+cuSq2kocykpX9iQDh1qVOCRFGk+MRSgyjcfZ/O2yPz5D61RVfqaFwXEB01LlSgKFKO2cfnj3PhUZEvA3QmNOPUq9mIMx0DynVIA2MxBWTWe0K+SkIuG+WPIityB90vhBL3kx2G3W1SoUTk0LON1r/MemSTvduB+vxK+bZGO6bKNB2jkXk0rWBZYkNTg3SmJDYw+WlNTYtEXt0ICcwxRHwZZQoBv7FYeGPwvJhOeVDackvkr/3vBQOLcosjBZAM3c1W4Z/q8b1ZS/HntVmpqwlOuL8lpzqvgSKp8oi5L0IhiQVoW3cjmDQIMC+naAkFz98nVztNdP4n7y6WV3/2CDY4vtsKesxxL2iu2zQzZgQybZV3bBfrCf0bfoMvoV/V6PtqLNzjb7R63oD7ngsw0=</latexit>
Minimal Detectable Effect Size (MDE)
J-PAL | CHOOSING THE RIGHT SAMPLE SIZE 58
Minimal detectable effect
Variance
Sample Size
Critical values from Student t for power κ and significance level α
Proportion inTreatmentThe MDE will be smaller with
• larger sample size N• smaller outcome variance σ• Even proportion in
treatment (P = 0.5)

From a research design perspective, it can be justified to choose an uneven sample split if…
A. The treatment is likely to be highly effective
B. The number of people who can be treated is restricted
C. Additional data can be collected at low cost
D. B and C
E. Unsure
J-PAL | CHOOSING THE RIGHT SAMPLE SIZE 59

I. True and Estimated Treatment Effect
II. Distribution of Treatment Effect Estimates
III. Hypothesis Testing
IV. Statistical Power and Sample Size
V. Power in Clustered Designs
VI. Calculating Power in Practice
Outline

Definition: Intraclass Correlation
J-PAL | CHOOSING THE RIGHT SAMPLE SIZE 61
Intraclass correlation (ICC)
• The intraclass correlation describes how similar – how correlated – units within the same class or cluster are.
• The ICC is also the fraction of total variation accounted for by between-class variation.
• Total variance(σ2) can be divided into within-class variance (ση2), and between-class variance (σν2).
• High ICC (close to 1): subjects in the same cluster are similar; different clusters tend to be very different from each other.
• Low ICC (close to 0): subjects in the same cluster are not particularly similar; different clusters tend to be similar to each other.

Samples with high intra-class correlation have similar individuals in each cluster, but different clusters are dissimilar.
Intuition: how does the ICC affect power?
J-PAL | CHOOSING THE RIGHT SAMPLE SIZE 62
Comparison
Treatment
Random sampling

Samples with low intra-class correlation tend to have more similar clusters, and resemble the population as a whole more closely.
Intuition: how does the ICC affect power?
J-PAL | CHOOSING THE RIGHT SAMPLE SIZE 63
Comparison
Treatment
Random sampling

Minimal Detectable Effect Size (MDE)
J-PAL | CHOOSING THE RIGHT SAMPLE SIZE 64
Minimal detectable effect
Variance
Sample Size
Critical values from Student t for power κ and significance level α
Proportion in Treatment
The MDE will be smaller with• larger sample size N• smaller outcome variance σ• Even proportion in treatment
(P = 0.5)• lower ICC
MDE� = (t + t↵) ·
s1
P (1� P )· �
2
N·p1 + (m� 1) · ICC
<latexit sha1_base64="GQ+JhfFrLfQXZtxZgNw2OLHl0CY=">AAACY3icbVFdaxQxFM2M2tat2rH6JkJwEbaULpMi6ItQXAV9UFZw28JmHe5kM7thk5kxuSOsYf6kb7754v8w+/FQWw8EDufck4+TvNbKYZr+iuJbt+/s7O7d7ezfu//gIHl4eO6qxgo5EpWu7GUOTmpVyhEq1PKythJMruVFvhis/Ivv0jpVlV9wWcuJgVmpCiUAg5QlPz6+fZfxXCLQ11zLAnuYeb6Auob2GDMOup4Dt2o2xyMuphVy982i54UF4Vnrhz12MjxqN9Za5E7NDHw9bf2ntr0SYcc9c8I2m9APg0GbJd20n65BbxK2JV2yxTBLfvJpJRojSxQanBuztMaJB4tKaNl2eONkDWIBMzkOtAQj3cSvO2rp86BMaVHZsEqka/VqwoNxbmnyMGkA5+66txL/540bLF5NvCrrBmUpNgcVjaZY0VXhdKqsFKiXgYCwKtyVijmEpjB8SyeUwK4/+SY5P+2ztM8+v+ievdnWsUeekGekRxh5Sc7IezIkIyLI72gnOoiS6E+8Hx/GjzejcbTNPCL/IH76F+XJt7w=</latexit><latexit sha1_base64="GQ+JhfFrLfQXZtxZgNw2OLHl0CY=">AAACY3icbVFdaxQxFM2M2tat2rH6JkJwEbaULpMi6ItQXAV9UFZw28JmHe5kM7thk5kxuSOsYf6kb7754v8w+/FQWw8EDufck4+TvNbKYZr+iuJbt+/s7O7d7ezfu//gIHl4eO6qxgo5EpWu7GUOTmpVyhEq1PKythJMruVFvhis/Ivv0jpVlV9wWcuJgVmpCiUAg5QlPz6+fZfxXCLQ11zLAnuYeb6Auob2GDMOup4Dt2o2xyMuphVy982i54UF4Vnrhz12MjxqN9Za5E7NDHw9bf2ntr0SYcc9c8I2m9APg0GbJd20n65BbxK2JV2yxTBLfvJpJRojSxQanBuztMaJB4tKaNl2eONkDWIBMzkOtAQj3cSvO2rp86BMaVHZsEqka/VqwoNxbmnyMGkA5+66txL/540bLF5NvCrrBmUpNgcVjaZY0VXhdKqsFKiXgYCwKtyVijmEpjB8SyeUwK4/+SY5P+2ztM8+v+ievdnWsUeekGekRxh5Sc7IezIkIyLI72gnOoiS6E+8Hx/GjzejcbTNPCL/IH76F+XJt7w=</latexit><latexit sha1_base64="GQ+JhfFrLfQXZtxZgNw2OLHl0CY=">AAACY3icbVFdaxQxFM2M2tat2rH6JkJwEbaULpMi6ItQXAV9UFZw28JmHe5kM7thk5kxuSOsYf6kb7754v8w+/FQWw8EDufck4+TvNbKYZr+iuJbt+/s7O7d7ezfu//gIHl4eO6qxgo5EpWu7GUOTmpVyhEq1PKythJMruVFvhis/Ivv0jpVlV9wWcuJgVmpCiUAg5QlPz6+fZfxXCLQ11zLAnuYeb6Auob2GDMOup4Dt2o2xyMuphVy982i54UF4Vnrhz12MjxqN9Za5E7NDHw9bf2ntr0SYcc9c8I2m9APg0GbJd20n65BbxK2JV2yxTBLfvJpJRojSxQanBuztMaJB4tKaNl2eONkDWIBMzkOtAQj3cSvO2rp86BMaVHZsEqka/VqwoNxbmnyMGkA5+66txL/540bLF5NvCrrBmUpNgcVjaZY0VXhdKqsFKiXgYCwKtyVijmEpjB8SyeUwK4/+SY5P+2ztM8+v+ievdnWsUeekGekRxh5Sc7IezIkIyLI72gnOoiS6E+8Hx/GjzejcbTNPCL/IH76F+XJt7w=</latexit>
Cluster Size
Intraclass correlation

I. True and Estimated Treatment Effect
II. Distribution of Treatment Effect Estimates
III. Hypothesis Testing
IV. Statistical Power and Sample Size
V. Power in Clustered Designs
VI. Calculating Power in Practice
Outline

1. Set desired power (e.g. 80%) and significance level (e.g. 5%).
2. Decide allocation ratio (sample split), e.g. based on cost of data collection (control and treatment) and intervention (treatment only).
3. Ask: what treatment effect can be expected? What effect sizes would you like to be able to detect? à Use to set the MDE.
4. Estimate variance & ICC.
5. Back out the sample size and estimate the resulting study budget.
Power calculations step by step
J-PAL | CHOOSING THE RIGHT SAMPLE SIZE 66

Estimating Variance and Intraclass Correlation
• MDE/ sample size for straightforward sampling designs can be calculated according to the formulas above.– For more complex sampling designs or using additional data: use simulation.
• Estimate within- and between-cluster variance of the outcome variable– Check sensitivity of power calculations to different possible ICC values
• Where to find data on outcome variance?– J-PAL and IPA DataVerses, World Bank Microdata Catalogue– National statistics– IPUMS or DHS data (large health and population household surveys)– Own data from program intervention
J-PAL | CHOOSING THE RIGHT SAMPLE SIZE 67

Thank you!

References, Reuse, and Citation
J-PAL | WHAT IS EVALUATION
J-PAL, 2019This case study is made available under a Creative Commons Attribution 4.0 License (international): https://creativecommons.org/licenses/by/4.0/