l1 retrotransposition in human neural progenitor cells
TRANSCRIPT

LETTERS
L1 retrotransposition in human neural progenitor cellsNicole G. Coufal1, Jose L. Garcia-Perez2,3, Grace E. Peng1, Gene W. Yeo1{, Yangling Mu1, Michael T. Lovci1{,Maria Morell4, K. Sue O’Shea4, John V. Moran2,5 & Fred H. Gage1
Long interspersed element 1 (LINE-1 or L1) retrotransposons havemarkedly affected the human genome. L1s must retrotranspose inthe germ line or during early development to ensure their evolu-tionary success, yet the extent to which this process affects somaticcells is poorly understood. We previously demonstrated that engi-neered human L1s can retrotranspose in adult rat hippocampusprogenitor cells in vitro and in the mouse brain in vivo1. Here wedemonstrate that neural progenitor cells isolated from humanfetal brain and derived from human embryonic stem cells supportthe retrotransposition of engineered human L1s in vitro.Furthermore, we developed a quantitative multiplex polymerasechain reaction that detected an increase in the copy number ofendogenous L1s in the hippocampus, and in several regions ofadult human brains, when compared to the copy number of endo-genous L1s in heart or liver genomic DNAs from the same donor.These data suggest that de novo L1 retrotransposition events mayoccur in the human brain and, in principle, have the potential tocontribute to individual somatic mosaicism.
The human nervous system is complex, containing approximately1015 synapses with a vast diversity of neuronal cell types and connec-tions that are influenced by complex and incompletely understoodenvironmental and genetic factors2. Neural progenitor cells (NPCs)give rise to the three main lineages of the nervous system: neurons,astrocytes and oligodendrocytes. To determine whether human NPCscan support L1 retrotransposition, we transfected human fetal brainstem cells (hCNS-SCns) (Fig. 1a)3 with an expression construct con-taining a retrotransposition-competent human L1 (RC-L1) drivenfrom its native promoter (L1RP). The RC-L1 also contains a retro-transposition indicator cassette in its 39 untranslated region (UTR),consisting of a reversed copy of the enhanced green fluorescent protein(EGFP) expression cassette, which is interrupted by an intron in thesame transcriptional orientation as the RC-L1 (refs 4–7). The orienta-tion of the cassette ensures that EGFP-positive cells will only arise if theRC-L1 undergoes retrotransposition (Supplementary Fig. 1a).
A low level of L1RP retrotransposition, averaging 8–12 events per100,000 cells, was observed in three different human fetal brain stemcell lines (BR1, BR3 and BR4; Fig. 1d). By comparison, an L1 contain-ing two missense mutations in the open reading frame 1 (ORF1)-encoded protein (JM111/L1RP)5,7 did not retrotranspose (Fig. 1b, d).Controls demonstrated precise splicing of the intron from the retro-transposed EGFP gene (Fig. 1b and Supplementary Figs 1 and 4), andindicated that L1 retrotransposition events were detectable by bothPCR and Southern blotting 3 months after transfection (Fig. 1c).Moreover, reverse transcriptase PCR (RT–PCR) revealed thathCNS-SCns express endogenous L1 transcripts and that some tran-scripts are derived from the human-specific (L1Hs) subfamily4,9,10
(Supplementary Fig. 6a, b and Supplementary Tables 4 and 5).
To determine whether L1 retrotransposition occurred in undiffer-entiated cells, we conducted immunocytochemical localization ofcell-type-restricted markers in EGFP-positive hCNS-SCns. Thesecells expressed neural stem cell markers, including SOX2, Nestin,Musashi-1 and SOX1 (Fig. 1e and Supplementary Fig. 2a, b), andsome co-labelled with Ki-67, indicating that they continued to pro-liferate (Supplementary Fig. 2c). EGFP-positive hCNS-SCns couldalso be differentiated to cells of both the neuronal and the gliallineages (Fig. 1f, g). Notably, L1RP did not retrotranspose using ourexperimental conditions in primary human astrocytes or fibroblasts,although a low level of endogenous L1 expression was detected inboth cell types (Fig. 1d and Supplementary Figs 2d, e and 6a, b).
We next used two different protocols to derive NPCs from fivehuman embryonic stem cell lines (hESCs; Fig. 2a). As in our previousstudy1, NPC differentiation led to a ,25-fold increase in L1 promoteractivity over a 2-day period, and then a decline (Fig. 2c); there was alsoa ,250-fold increase in synapsin promoter activity during differenti-ation (Supplementary Fig. 4b). H13B-derived NPCs expressed bothendogenous L1 RNA and ORF1 protein8, although the level of ORF1protein expression was less than in the parental H13B hESC lines(Fig. 2d). HUES6-derived NPCs also expressed endogenous L1 RNA(Supplementary Fig. 6a, b), and sequencing indicated that some tran-scripts are derived from the L1Hs subfamily (Supplementary Tables 4and 5). Similar studies performed with fetal brain, liver, and skinsamples showed evidence of endogenous L1 transcription(Supplementary Fig. 6c, d and Supplementary Tables 4 and 5).
RC-L1 retrotransposition was readily detected at varying efficienciesin hESC-derived NPC lines (Supplementary Table 1 and Supplemen-tary Figs 1 and 4f, g). Again, we determined that JM111/L1RP couldnot retrotranspose (Supplementary Table 1), that EGFP-positiveNPCs expressed canonical neural stem cell markers (Fig. 2b, e andSupplementary Fig. 3c, d), and that EGFP-positive HUES6-derivedNPCs could be differentiated to cells of both the neuronal andglial lineages (Fig. 2f and Supplementary Fig. 3e, f). The variability inretrotransposition efficiencies in hESC-derived NPCs probablydepended on several factors (see Supplementary Table 1 for specificdetails).
Characterization of EGFP-positive neurons showed that someexpressed subtype-specific markers (tyrosine hydroxylase (Fig. 2g)and GABA (c-aminobutyric acid; data not shown)) and whole-cellperforated patch-clamp recording demonstrated that some HUES6-derived NPCs are functional (Fig. 2h–k; n 5 4 cells). Furthermore, wedemonstrated that an RC-L1 tagged with neomycin or blasticidinretrotransposition indicator cassettes could retrotranspose in NPCs(Supplementary Figs 1 and 4c–e)5,11. Some G418-resistant foci alsoexpressed SOX3 and could be differentiated to a neuronal lineage(Fig. 2b).
1Laboratory of Genetics, The Salk Institute for Biological Studies, 10010 North Torrey Pines Road, La Jolla, California 92037, USA. 2Departments of Human Genetics and InternalMedicine, 1241 East Catherine Street, University of Michigan Medical School, Ann Arbor, Michigan 48109-5618, USA. 3Andalusian Stem Cell Bank, Center for Biomedical Research,Avda Conocimiento s/n, University of Granada, 18100, Spain. 4Department of Cell and Developmental Biology, 109 Zina Pitcher, University of Michigan Medical School, Ann Arbor,Michigan 48109-2200, USA. 5Howard Hughes Medical Institute, Chevy Chase, Maryland 20815-6789, USA. {Present address: Stem Cell Program, Department of Cellular andMolecular Medicine, University of California, San Diego, 9500 Gilman Drive, La Jolla, California 92093-5004, USA.
Vol 460 | 27 August 2009 | doi:10.1038/nature08248
1127 Macmillan Publishers Limited. All rights reserved©2009

We next characterized 19 retrotransposition events from EGFP-positive NPCs (Supplementary Fig. 7b and Supplementary Table 2).Comparison of the pre- and post-integration sites demonstrated thatretrotransposition occurred into an actual or inferred L1 endo-nuclease consensus cleavage site (59-TTTT/A and derivatives). Fiveof eight fully characterized events were flanked by target site duplica-tions, and no large deletions were detected at the insertion site5,9,12
(Supplementary Fig. 7b and Supplementary Table 2). Interestingly,16 out of 19 retrotransposition events were fewer than 100 kilobases(kb) from a gene and some occurred in the vicinity of a neuronallyexpressed gene1,12,13.
Notably, we consistently observed higher L1 retrotranspositionefficiencies in hESC-derived NPCs when compared to fetal NPCs.A Euclidian distance map on the basis of exon-array expression ana-lysis14 indicated that hCNS-SCns cluster closer to HUES6 cells,whereas HUES6-derived NPCs cluster closer to fetal brain(Supplementary Fig. 11a). Thus, hESC-derived NPCs and hCNS-SCns may represent different developmental stages in progenitordifferentiation. That being stated, we conclude that engineeredhuman L1s can retrotranspose in human NPCs.
Several studies have reported an inverse correlation between L1expression and the methylation status of the CpG island in their59 UTRs15,16. Thus, we performed bisulphite conversion analyses ongenomic DNAs derived from matched brain and skin tissue samplesfrom two 80–82-day-old fetuses (Fig. 3a, one male/one female sample).We then amplified a portion of the L1 59 UTR containing 20 CpG sitesand sequenced the resultant amplicons. Notably, the L1 59 UTRexhibited significantly less methylation in both brain samples whencompared to the matched skin sample (two-sample Kolmogorov–Smirnov test, P # 0.0079 day 80 female, P # 0.0034 day 82 male;Fig. 3b). The analysis of individual L1 59 UTR sequences demonstratedthe greatest variation between the brain and skin at CpG residues
located near the 39 end of the amplicon, and six amplicons from thebrain samples were unmethylated (Fig. 3e and Supplementary Fig. 8a,b). Restricting this analysis to ten L1s from brain and skin with thehighest sequence homology to an RC-L1 showed that 19 out of 20sequences were derived from the L1Hs subfamily (data not shown),and that one L1Hs element from the brain was completely unmethy-lated (Fig. 3c). In all cases, control experiments showed that thebisulphite conversion efficiency was .90% (Supplementary Fig. 8c).
Previous data indicated that SOX2 and MECP2 could associatewith the L1 promoter and repress L1 transcription under someexperimental conditions1,17. Two putative SRY-binding sites arelocated in the L1 59 UTR immediately 39 to the CpG island (Fig. 3aand Supplementary Fig. 11b)18. Thus, we performed chromatinimmunoprecipitation (ChIP) for SOX2 and MECP2 in hCNS-SCns, HUES6-derived NPCs, and HUES6-derived neurons. SOX2associated with the L1 59 UTR in a pattern that correlates with thedecrease in SOX2 expression observed during neural differentiation(Fig. 3d and Supplementary Fig. 4h). MECP2 expression was lower inboth hCNS-SCns and HUES6-derived NPCs than in neurons(Supplementary Fig. 4h), and both hCNS-SCns and HUES6-derivedNPCs expressed similar levels and types of L1 transcripts (Sup-plementary Fig. 6a, b). However, higher levels of MECP2 weredetected in association with the L1 promoter in hCNS-SCns thanin HUES6-derived NPCs (Fig. 3d). We propose that less L1 promotermethylation in the developing brain may correlate with increased L1transcription and perhaps L1 retrotransposition, and the differentialinteraction of SOX2 and MECP2 with L1 regulatory sequences maymodulate L1 activity in different neuronal cell types.
Although NPCs are useful to monitor L1 activity, they only allowmonitoring of a single L1 expressed from a privileged context. Bycomparison, the average human genome contains ,80–100 activeL1s, the expression of which may be affected by chromatin structure4.
+FGF2+EGF+LIF
3
2
1.6
GFPMAP2βIII tubulin
GFPGFAPβIII tubulin
a b
c
e
0
2
4
6
8
10
12
12 15 18 21 25Time (days)
GFP
eve
nts
per
100
,000
BR4 L1RP
BR3 L1RP
BR1 L1RPJM111
Astro L1RP
Fibro L1RP
d f gGFPNestinSOX2
2,547 bp
1,645 bp
CD34–5E12+CD133+ CD45–
DAPI
DAPI
1 2 3 4 5 6 7 8 9
342 bp
1,243 bp
Dissociate
Analysis, day 2–25
+ NGN retrovirus– Growth factors
Transfect withL1 pCEP plasmid
Neurons
Fetus FACS sort
Neurosphere
Green cell
50 n
g L1
RP
Ctrl
Figure 1 | L1 retrotransposition in hCNS-SCns. a, Experimental rationale.b, PCR of genomic DNA. The 1,243-bp product contains the intron, the 342-bp product indicates intron loss and retrotransposition. Lane 1, standards;lane 2, hCNS-SCns transfected with JM111/L1RP; lanes 3–5, three humanfetal brain stem cell lines transfected with L1RP; lanes 6–7, primary astrocytesand fibroblasts transfected with L1RP; lane 8, positive control; lane 9, water.c, Southern blot of hCNS-SCns (line FBR-BR3). The 2,547-bp band
represents plasmid, the 1,645-bp band is diagnostic for genomic insertion.Ctrl, control. d, Time course of L1 retrotransposition. Astro, astrocytes;fibro, fibroblasts. e, EGFP-positive cells express Nestin and SOX2. Arrowsindicate co-labelled cell body, arrowheads indicate co-labelled processes.f, EGFP-positive cells can differentiate to neurons (bIII tubulin and MAP2abpositive). g, EGFP-positive cells can differentiate into glia (GFAP-positive,bIII-tubulin-negative). Scale bars, 25 mm.
LETTERS NATURE | Vol 460 | 27 August 2009
1128 Macmillan Publishers Limited. All rights reserved©2009

Therefore, we developed a quantitative multiplexing PCR strategy toinvestigate endogenous L1 activity in the human brain, proposingthat active retrotransposition would result in increased L1 content inbrain genomic DNA as compared to other tissues (Fig. 4a).
In brief, we designed Taqman probes against a conserved 39 regionof ORF2 (conjugated with the VIC fluorophore), as well as severalcontrol probes (conjugated with the 6FAM fluorophore). Controlswere designed against the L1 59 UTR and other non-mobile DNAsequences in the genome that have copy numbers that are higher(such as a satellite19) or lower (such as HERVH and the 5S ribosomalDNA (rDNA) gene) than ORF2. Furthermore, because most L1retrotransposition events are 59 truncated9,20,21, we reasoned thatthe L1 59 UTR probes should detect a smaller copy number increasethan the L1 ORF2 probes. Each probe set amplified a single product ofthe predicted size (Supplementary Fig. 10b). Moreover, sequencingPCR products derived from both ORF2 probe sets showed enrich-ment for members of the L1Hs subfamily (Supplementary Table 3).
We next isolated genomic DNA from the hippocampus, cerebellum,liver and heart from three adult humans. We consistently observed astatistically significant increase in L1 ORF2 content in the hippocampuswhen compared to heart and liver samples from the same individual(Fig. 4b, c and Supplementary Figs 9a and 10a). Notably, two indivi-duals (1079 and 1846) showed more marked copy number differences
f
L1 5ʹ UTR-luciferase
0 1 2 7 120
5
15
25
Differentiation (days)
Luci
fera
se a
ctiv
ity
a c d
e
b
g
EB
+FGF2
Neuralprogenitor cell
ESC
Transfect withL1.3 pCEP
plasmid
60.447.2
35.1
35.1
24.9
47.235.1
47.2
35.1
Neurons
Anti-ORF1
RNPs
WCLs
Anti-S6
Anti-SOX3
Anti-SOX1
FACS analysis
Neural rosette
Analysis,day 2–25
+ Differentiationfactors,
BDNF, GDNF
GFP Nestin SOX2
L1-GFP
SOX1
BF
βIII tubulinSOX3
Hoescht
DAPI
20 mV1 s
pA
–1,000
0
1,000
2,000
3,000200 ms
mV
–80–60–40–20
020406080
200 ms
h
i
j
k
*
GFPβIII tubulin DAPI
GFPTHβIII tubulin
H13B
H7 NSCs
H13B
Figure 2 | L1 retrotransposition in hESC-derived NPCs. a, Experimentalrationale. BDNF, brain-derived neurotrophic factor; EB, embryoid body;GDNF, glial-cell-derived neurotrophic factor. b, L1 retrotransposition inH13B (top, LRE3 with EGFP reporter) and H7 (bottom, LRE3 with neomycinreporter)-derived NPCs (BF, bright field). G418-resistant foci can expressprogenitor (SOX3) and neuronal (bIII tubulin) markers. c, L1 59 UTR isinduced upon differentiation. Error bars denote s.d. d, H13B-derived NPCsexpress endogenous ORF1 protein. RNP, ribonucleoprotein particle samples;
WCL, whole cell lysates. Lane markers denote kDa. e–g, EGFP-positive,HUES6-derived NPCs express SOX2 and Nestin and can differentiate to betyrosine hydroxylase (TH) positive. Arrows indicate cell soma co-localization,arrowheads indicate co-labelled processes. Scale bars, 25mm. h, An LRE3-EGFP positive neuron. Scale bar, 10mm. i–k, Data are derived from the neuronin h. i, Transient Na1 (asterisk) and sustained K1 (arrow) currents in responseto voltage step depolarizations. j, Suprathreshold responses to somatic currentinjections. k, Spontaneous action potentials (Vm 5 250 mV).
L1
3′ UTR5′ UTR
44144
541
842
448
223
249
136
336
931
732
028
429
325
125
526
930
532
735
137
7
Methylation CpG sites
ORF1 ORF2CpG
SRY SRY
0
50
100
1 5 10 15 20
SkinBrain
Met
hyla
tion
(%)
0 50 1000
50
100
Methylated CpGs (%)
Seq
uenc
es (%
)
Brain 1Brain 2Skin 1Skin 2
P = 0.0079Brain 1 v. skin 1P = 0.0034Brain 2 v. skin 2
a
b c
d
Bra
in
1 20
Ski
n
eAnti-SOX2
Anti-MECP2
Anti-IgG
DNA input
hCNS-S
Cns
ES-NPC
Neuro
n
H 2O
CpG position in L1 5′ UTR
Figure 3 | Methylation analysis and ChIP for the endogenous human L159 UTR. a, Schematic illustrating the L1 CpG island, and SRY-binding sites.b, Cumulative distribution function plot, comparing overall methylation andcollapsing CpG sites into a single data point (two-sampleKolmogorov–Smirnov test). c, Individual methylation of sequences showinghighest sequence similarity to consensus RC-L1s. Open and closedcircles denote unmethylated and methylated CpG dinucleotides, respectively.Dash indicates mutated CpG site. d, ChIP identifying MECP2 and SOX2occupying the endogenous human L1 promoter, extracts were analysed byPCR towards the L1 59 UTR SRY-binding region (SOX2immunoprecipitation) or CpG island region (MECP2 immunoprecipitation).e, CpG dinucleotides exhibited higher methylation at the 59-end of the CpGisland; higher methylation overall was observed in skin samples.
NATURE | Vol 460 | 27 August 2009 LETTERS
1129 Macmillan Publishers Limited. All rights reserved©2009
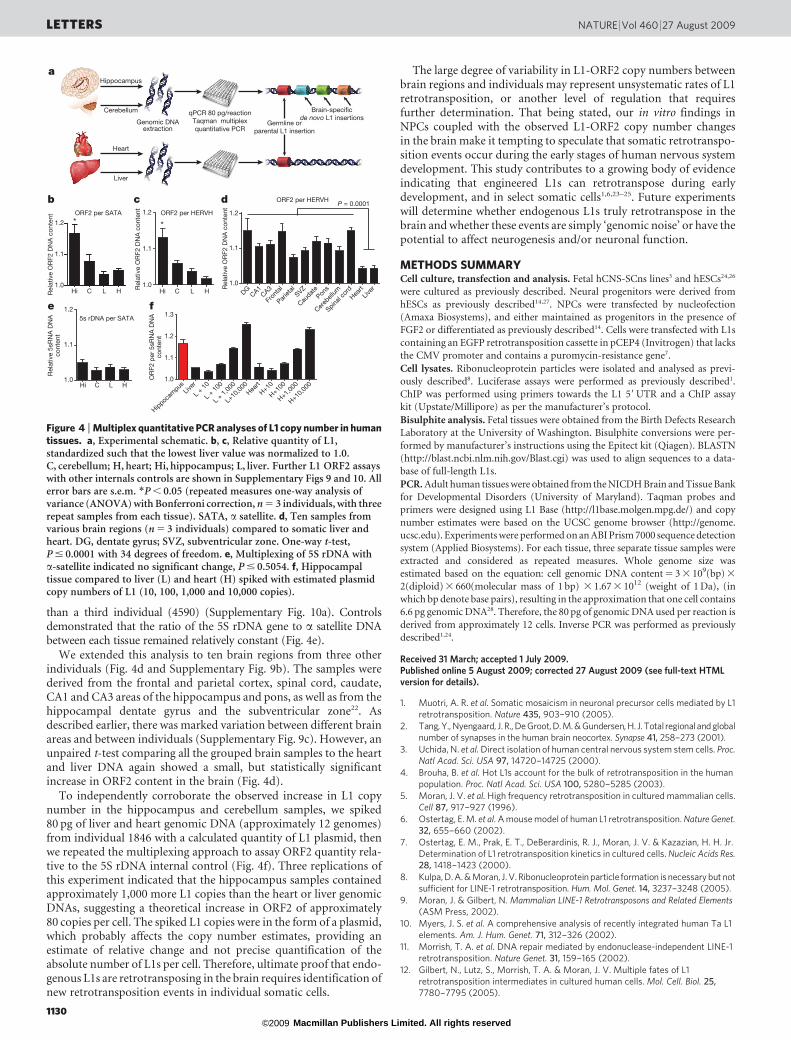
than a third individual (4590) (Supplementary Fig. 10a). Controlsdemonstrated that the ratio of the 5S rDNA gene to a satellite DNAbetween each tissue remained relatively constant (Fig. 4e).
We extended this analysis to ten brain regions from three otherindividuals (Fig. 4d and Supplementary Fig. 9b). The samples werederived from the frontal and parietal cortex, spinal cord, caudate,CA1 and CA3 areas of the hippocampus and pons, as well as from thehippocampal dentate gyrus and the subventricular zone22. Asdescribed earlier, there was marked variation between different brainareas and between individuals (Supplementary Fig. 9c). However, anunpaired t-test comparing all the grouped brain samples to the heartand liver DNA again showed a small, but statistically significantincrease in ORF2 content in the brain (Fig. 4d).
To independently corroborate the observed increase in L1 copynumber in the hippocampus and cerebellum samples, we spiked80 pg of liver and heart genomic DNA (approximately 12 genomes)from individual 1846 with a calculated quantity of L1 plasmid, thenwe repeated the multiplexing approach to assay ORF2 quantity rela-tive to the 5S rDNA internal control (Fig. 4f). Three replications ofthis experiment indicated that the hippocampus samples containedapproximately 1,000 more L1 copies than the heart or liver genomicDNAs, suggesting a theoretical increase in ORF2 of approximately80 copies per cell. The spiked L1 copies were in the form of a plasmid,which probably affects the copy number estimates, providing anestimate of relative change and not precise quantification of theabsolute number of L1s per cell. Therefore, ultimate proof that endo-genous L1s are retrotransposing in the brain requires identification ofnew retrotransposition events in individual somatic cells.
The large degree of variability in L1-ORF2 copy numbers betweenbrain regions and individuals may represent unsystematic rates of L1retrotransposition, or another level of regulation that requiresfurther determination. That being stated, our in vitro findings inNPCs coupled with the observed L1-ORF2 copy number changesin the brain make it tempting to speculate that somatic retrotranspo-sition events occur during the early stages of human nervous systemdevelopment. This study contributes to a growing body of evidenceindicating that engineered L1s can retrotranspose during earlydevelopment, and in select somatic cells1,6,23–25. Future experimentswill determine whether endogenous L1s truly retrotranspose in thebrain and whether these events are simply ‘genomic noise’ or have thepotential to affect neurogenesis and/or neuronal function.
METHODS SUMMARYCell culture, transfection and analysis. Fetal hCNS-SCns lines3 and hESCs24,26
were cultured as previously described. Neural progenitors were derived from
hESCs as previously described14,27. NPCs were transfected by nucleofection
(Amaxa Biosystems), and either maintained as progenitors in the presence of
FGF2 or differentiated as previously described14. Cells were transfected with L1s
containing an EGFP retrotransposition cassette in pCEP4 (Invitrogen) that lacks
the CMV promoter and contains a puromycin-resistance gene7.
Cell lysates. Ribonucleoprotein particles were isolated and analysed as previ-
ously described8. Luciferase assays were performed as previously described1.
ChIP was performed using primers towards the L1 59 UTR and a ChIP assay
kit (Upstate/Millipore) as per the manufacturer’s protocol.
Bisulphite analysis. Fetal tissues were obtained from the Birth Defects Research
Laboratory at the University of Washington. Bisulphite conversions were per-
formed by manufacturer’s instructions using the Epitect kit (Qiagen). BLASTN
(http://blast.ncbi.nlm.nih.gov/Blast.cgi) was used to align sequences to a data-
base of full-length L1s.
PCR. Adult human tissues were obtained from the NICDH Brain and Tissue Bank
for Developmental Disorders (University of Maryland). Taqman probes and
primers were designed using L1 Base (http://l1base.molgen.mpg.de/) and copy
number estimates were based on the UCSC genome browser (http://genome.
ucsc.edu). Experiments were performed on an ABI Prism 7000 sequence detection
system (Applied Biosystems). For each tissue, three separate tissue samples were
extracted and considered as repeated measures. Whole genome size was
estimated based on the equation: cell genomic DNA content 5 3 3 109(bp) 3
2(diploid) 3 660(molecular mass of 1 bp) 3 1.67 3 1012 (weight of 1 Da), (in
which bp denote base pairs), resulting in the approximation that one cell contains
6.6 pg genomic DNA28. Therefore, the 80 pg of genomic DNA used per reaction is
derived from approximately 12 cells. Inverse PCR was performed as previously
described1,24.
Received 31 March; accepted 1 July 2009.Published online 5 August 2009; corrected 27 August 2009 (see full-text HTMLversion for details).
1. Muotri, A. R. et al. Somatic mosaicism in neuronal precursor cells mediated by L1retrotransposition. Nature 435, 903–910 (2005).
2. Tang, Y., Nyengaard, J. R., De Groot, D. M. & Gundersen, H. J. Total regional and globalnumber of synapses in the human brain neocortex. Synapse 41, 258–273 (2001).
3. Uchida, N. et al. Direct isolation of human central nervous system stem cells. Proc.Natl Acad. Sci. USA 97, 14720–14725 (2000).
4. Brouha, B. et al. Hot L1s account for the bulk of retrotransposition in the humanpopulation. Proc. Natl Acad. Sci. USA 100, 5280–5285 (2003).
5. Moran, J. V. et al. High frequency retrotransposition in cultured mammalian cells.Cell 87, 917–927 (1996).
6. Ostertag, E. M. et al. A mouse model of human L1 retrotransposition. Nature Genet.32, 655–660 (2002).
7. Ostertag, E. M., Prak, E. T., DeBerardinis, R. J., Moran, J. V. & Kazazian, H. H. Jr.Determination of L1 retrotransposition kinetics in cultured cells. Nucleic Acids Res.28, 1418–1423 (2000).
8. Kulpa, D. A. & Moran, J. V. Ribonucleoprotein particle formation is necessary but notsufficient for LINE-1 retrotransposition. Hum. Mol. Genet. 14, 3237–3248 (2005).
9. Moran, J. & Gilbert, N. Mammalian LINE-1 Retrotransposons and Related Elements(ASM Press, 2002).
10. Myers, J. S. et al. A comprehensive analysis of recently integrated human Ta L1elements. Am. J. Hum. Genet. 71, 312–326 (2002).
11. Morrish, T. A. et al. DNA repair mediated by endonuclease-independent LINE-1retrotransposition. Nature Genet. 31, 159–165 (2002).
12. Gilbert, N., Lutz, S., Morrish, T. A. & Moran, J. V. Multiple fates of L1retrotransposition intermediates in cultured human cells. Mol. Cell. Biol. 25,7780–7795 (2005).
c
aHippocampus
Cerebellum
Genomic DNAextraction
qPCR 80 pg/reactionTaqman multiplexquantitative PCR
Brain-specificde novo L1 insertions
Heart
Liver
Germline orparental L1 insertion
ORF2 per HERVHP = 0.0001
5s rDNA per SATA
Hi C L H1.0
1.1
1.2
Rel
ativ
e 5s
RN
A D
NA
cont
ent
d
e
Hippocam
pusLiv
er
L + 10
L + 10
0
L + 1,
000
L+10
,000Hea
rtH+10
H+100
H+1,000
H+10,00
01.0
1.1
1.2
1.3
OR
F2 p
er 5
sRN
A D
NA
cont
ent
f
b
*
ORF2 per HERVH
DGCA1
CA3
Fron
tal
Pariet
alSVZ
Caudat
ePon
s
Cereb
ellum
Spinal c
ordHea
rtLiv
er1.0
1.1
1.2
Rel
ativ
e O
RF2
DN
A c
onte
nt
Hi C L H1.0
1.1
1.2
Rel
ativ
e O
RF2
DN
A c
onte
ntORF2 per SATA
Hi C L H1.0
1.1
1.2
Rel
ativ
e O
RF2
DN
A c
onte
nt *
Figure 4 | Multiplex quantitative PCR analyses of L1 copy number in humantissues. a, Experimental schematic. b, c, Relative quantity of L1,standardized such that the lowest liver value was normalized to 1.0.C, cerebellum; H, heart; Hi, hippocampus; L, liver. Further L1 ORF2 assayswith other internals controls are shown in Supplementary Figs 9 and 10. Allerror bars are s.e.m. *P , 0.05 (repeated measures one-way analysis ofvariance (ANOVA) with Bonferroni correction, n 5 3 individuals, with threerepeat samples from each tissue). SATA, a satellite. d, Ten samples fromvarious brain regions (n 5 3 individuals) compared to somatic liver andheart. DG, dentate gyrus; SVZ, subventricular zone. One-way t-test,P # 0.0001 with 34 degrees of freedom. e, Multiplexing of 5S rDNA witha-satellite indicated no significant change, P # 0.5054. f, Hippocampaltissue compared to liver (L) and heart (H) spiked with estimated plasmidcopy numbers of L1 (10, 100, 1,000 and 10,000 copies).
LETTERS NATURE | Vol 460 | 27 August 2009
1130 Macmillan Publishers Limited. All rights reserved©2009

13. Symer, D. E. et al. Human L1 retrotransposition is associated with geneticinstability in vivo. Cell 110, 327–338 (2002).
14. Yeo, G. W. et al. Alternative splicing events identified in human embryonic stemcells and neural progenitors. PLoS Comput. Biol. 3, e196 (2007).
15. Bourc’his, D. & Bestor, T. H. Meiotic catastrophe and retrotransposon reactivationin male germ cells lacking Dnmt3L. Nature 431, 96–99 (2004).
16. Takai, D. & Jones, P. A. The CpG island searcher: a new WWW resource. In SilicoBiol. 3, 235–240 (2003).
17. Yu, F., Zingler, N., Schumann, G. & Stratling, W. H. Methyl-CpG-binding protein 2represses LINE-1 expression and retrotransposition but not Alu transcription.Nucleic Acids Res. 29, 4493–4501 (2001).
18. Tchenio, T., Casella, J. F. & Heidmann, T. Members of the SRY family regulate thehuman LINE retrotransposons. Nucleic Acids Res. 28, 411–415 (2000).
19. Lee, C., Wevrick, R., Fisher, R. B., Ferguson-Smith, M. A. & Lin, C. C. Humancentromeric DNAs. Hum. Genet. 100, 291–304 (1997).
20. Pavlicek, A., Paces, J., Zika, R. & Hejnar, J. Length distribution of long interspersednucleotide elements (LINEs) and processed pseudogenes of human endogenousretroviruses: implications for retrotransposition and pseudogene detection. Gene300, 189–194 (2002).
21. Grimaldi, G., Skowronski, J. & Singer, M. F. Defining the beginning and end of KpnIfamily segments. EMBO J. 3, 1753–1759 (1984).
22. Gage, F. H. Mammalian neural stem cells. Science 287, 1433–1438 (2000).23. Prak, E. T., Dodson, A. W., Farkash, E. A. & Kazazian, H. H. Jr. Tracking an
embryonic L1 retrotransposition event. Proc. Natl Acad. Sci. USA 100, 1832–1837(2003).
24. Garcia-Perez, J. L. et al. LINE-1 retrotransposition in human embryonic stem cells.Hum. Mol. Genet. 16, 1569–1577 (2007).
25. van den Hurk, J. A. et al. L1 retrotransposition can occur early in human embryonicdevelopment. Hum. Mol. Genet. 16, 1587–1592 (2007).
26. Thomson, J. A. et al. Embryonic stem cell lines derived from human blastocysts.Science 282, 1145–1147 (1998).
27. Zhang, S. C., Wernig, M., Duncan, I. D., Brustle, O. & Thomson, J. A. In vitrodifferentiation of transplantable neural precursors from human embryonic stemcells. Nature Biotechnol. 19, 1129–1133 (2001).
28. Forslund, O. et al. Nucleotide sequence and phylogenetic classification ofcandidate human papilloma virus type 92. Virology 312, 255–260 (2003).
Supplementary Information is linked to the online version of the paper atwww.nature.com/nature.
Acknowledgements We thank J. Simon for excellent schematic drawings,M. L. Gage, J. Kim and H. Kopera for editorial comments, B. Miller and R. Keithleyfor cell culture assistance, C. T. Carson for hESC advice, D. Chambers and J. Barriefor flow cytometry assistance, L. Randolph-Moore for molecular advice, B. Aimonefor statistics advice, T. Liang for microarray assistance, and Y. Lineu and J. Mosherfor helpful comments. We also thank T. Fanning and M. Klymkowsky for the ORF1protein and SOX3 antibodies, respectively. F.H.G. and N.G.C. are supported by thePicower Foundation, G. Harold and Leila Y. Mathers Charitable Foundation,Lookout Fund (MH082070), and the California Institute for RegenerativeMedicine (CIRM). J.L.G.-P. is supported by Plan Estabilizacion Grupos SNS ENCYT2015 (EMER07/56, Instituto de Salud Carlos III, Spain) and through theIRG-FP7-PEOPLE-2007 Marie Curie program. K.S.O. was supported by grantsGM069985 and NS048187 from the National Institutes of Health (NIH). J.V.M.was supported by grants GM082970 and GM069985 from the NIH and by theHoward Hughes Medical Institute. Work in the laboratories of K.S.O. and J.V.M.only used NIH-approved stem cell lines.
Author Contributions N.G.C. and F.H.G. directed the project. J.V.M. and J.L.G.-P.directed aspects of the project conducted at Michigan. N.G.C., J.L.G.-P., J.V.M. andF.H.G. designed experiments and drafted the manuscript. N.G.C., F.H.G., J.L.G-P.and G.E.P. performed the experiments. G.W.Y. and M.T.L. carried outbioinformatics data analysis. Y.M. performed electrophysiology experiments.M.M. and K.S.O. provided hESC culture and NPC differentiation assistance. Allauthors commented on or contributed to the current manuscript.
Author Information Reprints and permissions information is available atwww.nature.com/reprints. Correspondence and requests for materials should beaddressed to F.H.G. ([email protected]).
NATURE | Vol 460 | 27 August 2009 LETTERS
1131 Macmillan Publishers Limited. All rights reserved©2009