l william l. halläuer e eric $7 johnson · automated design of composite plates for improved...
TRANSCRIPT

AUTOMATED DESIGN OF COMPOSITE PLATES FOR IMPROVED DAMAGETOLERANCE
Zafer Gürdal
Dissertation submitted to the Faculty of the
Virginia Polytechnic Institute and State University
in partial fulfillment of the requirements for the degree of
DOCTOR OF PHILOSOPHY
in‘
Aerospace Engineering
Q APPROVED:
Raphael T. Haftkat
„ LI
—- ‘“ . . •— iV' L/ 'William L. Halläuer E Eric $7 Johnson/
·
7 Robreräyy 'Joges Heßyyl ·Kelley 7
January, 1985Blacksburg, Virginia

ii

NOMENCLATURE
a half crack length
aij coefficients of laminate compliance matrix
b stiffener blade width
c half thickness of matrix between adjacent fibers
d stiffener flange width
e stiffener spacing
g a typical constraint
gSIF stress intensity factor constraint
go lamina stress constraint . ‘
h fiber thickness
k1,k2 defined in Eqs. (15), and (17) respectively
2 fiber length for the microbuckling model
q ratio of the fiber shear force to the fiber axial load
r radial distance ahead of the crack tip
s load scaling factor
si complex roots of the characteristic equation, Eq. (ll)
tb ·stiffener blade height
tf stiffener flange thickness
tp panel section thickness
u longitudinal end displacement under loading
v transverse fiber displacement
w plate out-of-plane deflection
x longitudinal coordinate axis
iii

y transverse coordinate axis
A cross sectional area of the plate
Ef fiber Young's modulus
Em matrix Young's modulus
Ex laminate longitudinal modulus
Ey laminate transverse modulusGm matrix shear modulus
Gxy laminate shear modulusI unit boundary displacement vector
If fiber area moment of inertia
KI crack opening mode stress intensity factor
KII in-plane shearing mode stress intensity factor
Kaa
Kad}. submatrices of the partitioned form of the stiffness matrix
KddKC critical value of the opening mode stress intensity factor
L plate length
P applied longitudinal load
Pf axial force on the fiber for microbuckling model
Pflc critical fiber load
PCR buckling load of plate
PI load achieved under unit displacement at the boundary
Qc general fracture toughness parameter
RI force vector under unit boundary displacement condition
Sf shearing force on the fiber
iv
[T] transformation matrix, Eq. (3)
U vector of nodal displacements under actual loading
UI vector of nodal displacements under unit boundary displ.
Vf fiber volume fraction
W total plate width
T Wg total plate weight
X vector of design variables
XL,XU vector of lower and upper bounds on design variables
Z adjoint variable vector
Zi -see Eqs. (10)
a orientation of the principal load carrying ply
[B] matrix of constitutive properties, Eq. (2)
81i
sz engineering strains in the principal material directions
XIZ
zutf ultimate tensile strain of fiberssx far field failure strain
:CR local strain at buckling
8 orientation of the plies from the x axis
vxy laminate Poisson'sratiocnormal stress
cf fiber axial stress
cf max maximum fiber stress under bending and compressioncf’C critical fiber stress
V

cxcy crack tip stresses
1 XY1 shear stress
w rotational coordinate at the crack tip
A adjoint variable vector, Eq. (33) ‘
< )' d( >/dx
vi

TABLE OF CONTENTS
ACKNOWLEDGEMENTS .................... ii
NOMENCLATURE ..................... iii
Chapterpage
I. INTRODUCTION ................... 1
Designing for Damage Tolerance ......... 2Damage Tolerance and Composites ........ 4Scope of this Investigation .......... 7
II. FAILURE CRITERION FOR CRACKED PLATES IN TENSION . . 10
Review of Literature .............. 10Fracture Toughness ............... 13
III. FAILURE CRITERION FOR CRACKED PLATES IN COMPRESSION 18
EXPERIMENTAL WORK ............... 18Test Specimens and Apparatus ........ 19Results and Discussion ........... 21
Prebuckling and Buckling Response .... 21Postbuckling Response .......... 24Failure characteristics ......... 28
Summary ................... 31ANALYTICAL CRITERION .............. 32
Review of Literature .........‘. . . 33Damage Model for Cracked Plates in
Compression .............. 39Crack tip stresses ............ 41Fiber-beam model ............. 43Fiber-beam deformation under loading . . . 47
Failure Model ................ 48Fiber stresses .............. 48Failure prediction for cracked plates . . 51Failure prediction for plates with holes . 53
IV. ANALYSIS AND DESIGN ................ 57
Stress Intensity Calculations ......... 58Automatic Mesh Generation ........... 60Problem Formulation and Optimization Method . . 63Design Sensitivity Derivatives ......... 66
vii

V. DESIGN STUDIES .................. 71
Plates Loaded in Tension ............ 72Uniform Thickness Plates .......... 72Stiffened Plates .............. 75
Plates Loaded in Compression .......... 81Uniform Thickness Plates .......... 81Stiffened Plates .............. 86
VI. CONCLUDING REMARKS ................ 90
REFERENCES ....................... 93
TABLES ........................ 102
FIGURES ........................ 105
VITA ......................... 150
viii

LIST OF TABLES
Tablepage
1. Experimental results................ 103
2. Typical properties of unidirectional graphite/epoxysystems..............·....... 104
ix

LIST OF FIGURESFigure _a e
1. Damage tolerant structural concepts........ 106
1. Concluded..................... 1072. Broken 0° fibers at the slot tip for a [145/OZIS
A Boron/Aliminum laminate, Poe [31]. ...... 108
3. Crack-tip coordinates............... 109
4. Typical test specimen...............1105.
Slot locations. ................. 1116. Load shortening responses of the 24-ply plates. . 112
7. Load shortening responses of the 16-ply plates. . 113
8. Postbuckling membrane strains at the plate centerfor 24-ply specimens.............. 114
9. Moire-fringe pattern of specimen S1, P=62 kN. . . 115
10. Shear failure of specimen C5. .......... 116
11. Damage of specimen C2 after failure........ 117
12. Shear crippling failure of specimen with a hole,from Ref. 47.................. 118
13. Failure of specimen S2. ............. 119
14. Composite material model considered by Rosen [48]. 120
15. Extensional and Shear modes of microbucklingdeformations.................. 121
16. Kinking mode of compressive failure........ 122
17. Magnitude of a typical crack-tip shear stressdistribution in a quasi-isotropic plate,KI=2500 MPaJmm................. 123
x
18. Deformation mode of the fibers at a point around thecrack—tip. .................. 124
19. Beam on an elastic foundation model of a fiber underq combined axial and side forces......... 125
20. Fiber end (x=l) deformation for different q values. 126
21. Maximum compressive fiber stress (combined bendingand normal stress at x=0 or x=l) for different qvalues..................... 127
22. Failure prediction for Quasi-Isotropic plates with acrack. .................... 128
23. Failure prediction for Quasi-isotropic and i45°dominated plates with a hole.......... 129
24. Comparison of failure predictions of the presentwork (Rosens model and model developed) '
with..... . .................. 130
25. Stiffened plate geometry. ............ 131
26. A typical quarter—plate finite element mesh for astiffened plate. ............... 132
27. A typical quarter-plate finite element mesh for anunstiffened plate. .............. 133
28. Unstiffened plate designs under tension, (P=l22 kN,W=76.2 mm, 2a/W=0.2, L/W=3.0). ........ 134
29. Unstiffened plate designs under tension, (P=l22 kN,W=76.2 mm, 2a/W=0.6, L/W=3.0). ........ 135
30. Effect of crack length on unstiffened plate designfor ply combinations similar to[0 /145/0 /90/0] ............... 1362 2 S
31. Plates with side stiffening strips under tension,(P=l22 kN, 20% shear force, W=76.2 mm,L/W=3.0..... . ................ 137
32. Plates with four stiffening strips under tension,panel section with only optimum i9° plyorientations,..... . ............. 138
xi

33. Effects of panel angle and length on weight, (onlyiS° plies in the panel,..... . ........ 139
34. Effects of panel angle and length on weight, (0°/iG°panel, 0.28 mm 0° plies, 0.84 mm i0° plies,..... 140
35. Effect of added angle plies to O° panel section of astiffened plate under tension,..... . ..... 141
36. Weight penalty due to blade stiffeners, (P=600 kN,b=5 mm, d=30 mm, e=75 mm). .......... 142
37. Unstiffened plate designs under compression,(P=500kN, W=l27 mm, L/W=3.0).......... 143
38. Unstiffened plate designs under compression, (P=500kN, W=127 mm, 2a/W=O.2, L/W=3.0)........ 144
39. Unstiffened plate designs under compression, (P=500kN, W=127 mm, 2a/W=0.4, L/W=3.0)........ 145
40. Comparison of different models for unstiffened(0°/i45°) plates under compression (P=500 kN,2a/W = 0.2). ................. 146
41. Weight saving due to stiffeners for compressionplates, (P=500 kN, b=12.7 mm, e=25.4 mm).... 147
42. Plates with four stiffening strips under~ compression, (P=500 kN, W=255 mm, L/W=1.6). . . 148
43. Weight penalty due to blade stiffeners undercmpression, (P=500 kN, b=5 mm, d=30 mm, e=75mm). ..................... 149
xii

Chapter I
INTRODUCTION
Laminated composite materials are recognized as an
attractive replacement for metallic materials for
aeronautical applications because of their high strength—to—
weight and stiffness-to—weight ratios. If composite
materials are to be used in aircraft structural components,
they must be designed to satisfy several structural
requirements. For example, fuselage and skin panels must be
designed to include geometric discontinuities in the form of
cutouts (cabin windows, doors, access holes, etc.), and
certain provisions must be made for sufficient damage
tolerance (see, for example, Refs. [1,2]).
Damage tolerance is actually one of the most important
performance constraints that must be considered in the
design of modern aircraft. Airworthiness regulations
require that catastrophic structural failure due to damage
must be avoided throughout the operational life of an
airplane. One form of damage which is a serious threat for
survivability of metallic aircraft structures is cracks.
Cracks often initiate from material defects or existing
holes and cutouts under cyclic loadings. Advanced fibrous
composite materials, which are prime candidates for aircraft
1 .

2
applications, exhibit good fatigue properties and have been
shown to be resistant to fatigue crack growth. However,
they present other problem areas that are not common to
conventional materials. Experimental studies have shown
that holes and cutouts can cause a severe reduction in
tensile strength of composites. The lack of ductile
behavior of composites at the points of high strain
concentrations around cutouts results in localized
failures. Unlike metals, composites have also been shown to
be extremely notch sensitive under compressive loadings.
Manufacturing defects and accidental damage during
maintenance are also problem areas that can degrade the
performance of the structure. Low—velocity impacts such as
tool drops or runway debris have been shown to result in
serious damage in composites [3,4], and degrade both
compression and tension strength of a composite plate. In
contrast, in homogeneous metallic plates no strength
reduction occur due to such effects.
1.1 DESIGNING Qgg DAMAGE TOLERANCE
Damage tolerance can be studied at two levels, global
and local damage tolerance. Global damage tolerance implies
that catastrophic failure or excessive structural
deformations are not probable after partial or total failure

3
of a single principal structural component. Examples of the
global approach are Refs. [5-7] in. which structures are
designed to be capable of carrying redistributed loads
following failure of a single component or multiple
components. Local damage tolerance, on the other hand,
implies that the structural component can carry the design
loads in the presence of local failures such as cracks that
may develop during the service life of the component. The
present study is concerned with design for local damage
tolerance of composite plates.
Early work on structures tolerant to local damage was
on metallic panels with cracks. For example, the design
philosophy for a fuselage shell with crack-stopping straps
was considered in Ref. [8]. Developments in cracked
structure analytical methodology resulted in rigorous damage
tolerance design procedures for metallic structures. Linear
elastic fracture mechanics has been judged to be a useful
tool in predicting residual strength and crack growth
behavior of damaged metal aircraft panels [9], and several
researchers have incorporated it into the design of minimum
weight, damage tolerant stiffened panels.
Design charts developed for stress intensity factors
for panels with riveted stiffeners [10] were used, for
example, by Kruse [ll] to perform detail design of box beam
4
structures. A nonlinear programming technique was used for
finding efficient panel designs with various stiffener
geometries under multiple constraints including fatigue life
and static strength. Similarly, Davis [12] designed
integrally stiffened two—panel box beams by using available
analytical solutions. An optimality criteria method was
used by Dobbs and Nelson [13] for designing cracked metal
panels for which analytical solutions for stress intensity
factors are not available. Strain, energy release rates,
obtained by a finite element analysis, were used to obtain
the stress intensity factors. An analytical approach was
used for response gradient calculations.
1.2 DAMAGE TOLERANCE AND COMPOSITES
In contrast to metal plates where local damage can
successfully be represented by cracks, damage definition for
composite materials is complicated. The number of possible
modes of local failure is large, and they are usually
micromechanically governed and complex. Fiber breaking,
matrix cracking, fiber matrix debonding, and separation of
individual layers can result in cracks, splits and
delamination that can degrade the load—carrying capacity of
a composite plate. Microbuckling and shear failures are
also common types of failures under compressive loadings. A

5
local damage condition may be due to accumulation of these
failures, and the final failure may be governed by several
of them. Furthermore, the response of the plate can be
different to the above local damage conditions depending on
the physical properties of each constituent (fiber and
matrix properties) in a lamina and depending on the layup
(i.e., orientation and stacking sequence of the laminae) of
the laminate. —
The complexity of the problem also offers a variety of
research areas. Damage tolerance concepts that can be
pursued, for example, against impact damage are categorized
under two main approaches [14]. The first approach, called
the materials approach, is aimed at understanding the damage
mechanism and improving the material response to achieve
damage tolerance. For example, using graphite fabric
material instead of unidirectional tape material improved
the impact damage behavior through mechanical linking of the4
cross plies and reduced the delaminations. Similarly,
transverse reinforcement in the form of through-the-
thickness stitching suppresses delaminations and causes the
plate to fail in a higher energy failure mode. It is also
found that impact damage tolerance can be improved by matrix
material modifications. For example, the use of higher
fracture energy matrix material leads to a better response
to impact damage.

6
The second approach, which is widely used for early
metallic plate designs, is to achieve efficient structural
configurations which are capable of arresting or limiting
the growth of local damage and redistributing the applied
loads. Structural configurations considered in Ref. [14]
are shown in Fig. 1. Mechanically fastened plate
configurations, see Fig. 1-a, proved to be effective in
containing the damage in a controlled region and
redistributing the loads, but with a penalty of increased
weight, and cost of fabrication and assembly. The concept
of arresting compression failure by introducing
discontinuities in the form of bonded, plate sections as
shown in Fig. 1·b was partially effective to contain
delaminations. However, this configuration failed to
prevent the damage propagation by transverse shear failure
mode which caused crippling of the load carrying O° plies.
One of the promising structural concepts that are
considered in Ref. [14] is to isolate the portions of the
plate to high and low axial stiffness regions, see
Fig. 1-c. Preliminary experimental investigations cited in
Ref. [14] indicated that the low stiffness regions of the[
plates are tolerant to impact damages. It has also been
shown that in some cases low stiffness regions are capable
of arresting the damage propagation due to impact inflicted

7 .
on the high stiffness region. Although the idea is somewhat
different, similar geometries obtained by using buffer
strips have been shown to arrest and increase the residual
strength of plates with cracks under tension loadings [15].
The buffer strips in Ref. [15] are made by interrupting and
replacing strips of certain plies in the laminate by another
material or layup.
1.3 §QQ§§ QF Tglg INVESTIGATION
The nature of most of the design approaches mentioned
in the previous section are experimental (except for a
limited application of analysis techniques in case of
tension loaded plates). A more rational approach to design
requires sound analysis techniques which can be applied
under both tensile and compressive loadings. However, the
definition of a single damage condition that can be used
under both compressive and tensile loading is difficult, and
at present there is no single criterion for the failure of
composites to account for all different damage conditions.
Therefore, as a first step in an effort to automate the
design process, the present work is limited to only one
aspect of failure, simulating the local damage condition by
a central through-the-thickness crack. Failure is
characterized by the propagation of the crack with fiber
failures under loading.

8
Through—the-thickness cracks are not a common type of
damage in fibrous composite materials. Nevertheless, cracks
are often used to estimate the residual strength of damaged
structures [16]. Designing for crack damage can provide
useful information because aircraft composite structures
usually contain notches and holes. Common experience with
composites indicates that holes have the same effects as
equal size cracks. Moreover, a method frequently applied to
the analysis of cracked composite components, namely linear
elastic fracture mechanics is found to be useful to simulate
impact damage [17-20] and may be used for designing for such
a damage condition.
The next two chapters are devoted to establishing a
failure criterion that can be used in an automated design
procedure. Because of the significant differences in
failure modes, the tension and compression cases are treated‘
in separate chapters. Failure of plates with a central
crack under tensile loading is considered first, because of
a substantial body of previous research in that area.
Seeking a failure criterion for cracked ~plates under
compression, on the other hand, presents difficulties due to
the paucity of both ”experimental and analytical
information. The first part of Chapter 3 describes an
experimental work intended to provide better understanding

9
of compressive behavior of composite plates with simulated
cracks. In the second part of the chapter, the literature
is reviewed and an analytical failure criterion is
formulated that can be used for cracked plates under
compression.
An automated design procedure requires the integration
of an analysis procedure with an optimizer. In the present
work, analyses of cracked plates are performed with a finite
element program. The first section of Chapter 4 describes
the crack finite element program. Integration of the finite
element program with the optimizer requires automatic mesh
generation which is the subject of the second section. The
formulation of the design problem and the optimization
package is explained in the third section. The efficiency
of the design optimization is enhanced by using analytical
sensitivity ‘derivatives which are derived in the last
section of the chapter.
The design procedure is demonstrated in chapter 5.
Various examples are presented for both compression and
tension loaded unstiffened and stiffened plates for the
purpose of gaining insight into the process of designing
with damage tolerance constraints.

Chapter II
FAILURE CRITERION FOR CRACKED PLATES IN TENSION
2.1 REVIEW QF LITERATURE
Even though the damage condition isnsimplified by
Cassuming that a th£¤ugh the thickness crack represents the
damage, the direct application of available tools, such as
linear elastic fracture mechanics, to the analyses of
cracked structural plates made of composites is limited.
The two main factors that contribute to the limited use are
the anisotropy and inhomogeneity of composites.
For certain configurations of a crack in a
unidirectional composite material, it was experimentally
shown by Wu [21] that the effect of anisotropy can be
eliminated and the fracture problem can be treated by the
theory of classical fracture mechanics for isotropic
materials. Waddoups et al. [22] extended the application to
notched laminated composites using a material model which is
macroscopically homogeneous but anisotropic. They
incorporated the effect of the plastic zone at the crack tip
into a fracture toughness model and predicted the notch size
dependence of failure strength.
Whitney and Nuismer [23] did not use fracture
mechanics, but developed their well-known point-stress and
1O

ll
average—stress criteria. The point-stress criterion
stipulates failure when the stress at some distance away
from the notch exceeds the strength of the unnotchedA
laminate. The average—stress criterion, on the other hand,
predicts failure when the average stress over some distance
ahead of the notch equals the unnotched laminate strength.
Good correlation of the flaw—size dependence of the laminate
strength with experimental values was observed for both
criteria.
The direct use of the point-stress and average—stress
criteria in a design process is, however, limited. In orderI
to use the point-stress criterion one needs the values of
two independent parameters, namely the ultimate strength of
I
the material and the value of the distance ahead of the
notch where the stress level is compared with the ultimate
strength of the unnotched laminate. Two approaches are used
in the literature. The first one is to consider the
distance ahead of the notch as a umterial constant while
varying the material strength with the laminate layup, Ref.
[23}. The second approach is to vary the distance ahead of
the notch and hold the ultimate strain of the material
constant. Whichever approach is used, the designer faces
the problem of determining a variable parameter as the layup
of his laminate changes during the design process.

12
The material modeling approach was developed by Zweben
[24] and Rosen et al. [25], where the region around the
notch tip was characterized by discrete regions of different
behavior. The advantage of their model was the capability
of predicting damage for more than one failure mechanism.
Local stress distributions on individual fibers were
considered by Hedgepeth and Van Dyke [26] in a microscopic
approach. Fracture was assumed to be controlled by fiber
stresses and fiber fracture. In-depth reviews of various
approaches and their ranges of applicability are given in
Refs. [27-30].
In the present work, a model that uses an extension of
linear elastic fracture mechanics to composites under
tensile loads is utilized [31,32]. The stress field around
the crack tip, based on fracture mechanics, was used by Poe·
[31] together with classical lamination theory to obtain
strains in the principal load-carrying ply. Fiber strains
at failure were then correlated with experimental results,
and the fracture toughness of a laminate was related to a
basic fiber property and layup of the laminate.
The two key phases of the application of the Poe's [32]
criterion are the calculation of the stress intensity factor
(SIF) which indicates the distribution of the stress field
around the crack tip, and the critical value of the SIF
13
which is the resistance of a material to crack growth. A
linear finite element code [33], which utilizes a special
anisotropic crack—tip element, is used to determine the
stress intensity level in a tension loaded panel containing
a crack. The details of the code are given in Chapter 4.
The procedure for the evaluation of the fracture toughness
[31] is presented in the next section.
2.2 FRACTURE TOUGHNESS
The measure of fracture toughness of composite
laminates used in the present work is the maximum allowable
value of the SIF (SIF is defined for the laminate by
assuming the material to be homogeneous and anisotropic).
The fracture toughness of a composite laminate is a strong
function of the laY¤P [29]. For a laminate with a given
layup, it is possible to determine the fracture toughness
experimentally for a given crack length, and use it for the
design of panels with different allowable crack lengths.
However, the design of a minimum weight panel with ply
thickness design variables requires the consideration of
panels with many different layups, and testing to determine
the fracture toughness of each layup would be prohibitively
expensive.

14
A recent analytical procedure developed by Poe and Sova
[31,32] was employed to overcome the above difficulty.
Experimental observations [31] showed that, for specimens
with slits, tensile failure of fibers ahead of the slits is
responsible for the final fracture. Furthermore, fiber
failures occur mostly in O° plies for laminates with both O°
and i45° plies. A radiograph of the slit tip area is shown
in Fig. 2 under two load levels for a Boron-Epoxy laminate
tested in Ref. [31]. Broken O° fibers are indicated by
black circles. It is clear from the figure that just prior
to the failure there is an increase in the number of fiber
failures ahead of the crack tip collinear with the crack.
In laminates with both O° and t45° plies the O° plies carry
more of the applied longitudinal load per ply than the i45°
plies, and hence are referred to as lthe principal load-
carrying plies. For laminates with only i45° plies, the
number of broken fibers ahead of the slit ends was as large
as the number of broken O° fibers in laminates with O° and
i45° plies. For any angle-ply laminates, the i8° plies with
the smallest angle would be the principal load-carrying
plies, and would sustain most of the broken fibers. It was
concluded, therefore, that the laminates with a crack-like
slit fail near the ends of the slit when the principal load-
.carrying plies reach their ultimate strain.

15
It is possible to get strains in the principal material
directions for each ply by using the linear elastic fracture
mechanics approach together with classical lamination
theory. From Ref. [31], the engineering strains in the
principal material directions for the ith ply of a symmetric
laminate along the y axis (¢=O in Fig. 3) are
$1 1KI
[cz = [T]i[ßl (1)
where KI is the mode 1 stress-intensity factor, Ex and Ey
are the laminate elastic moduli in the x and y directions,
and r is the distance ahead of the crack tip. The matrix
[B] is the matrix of constitutive properties for the
laminate
1/Ex —vxy/Ex O
[B] = —vxy/Ex 1/Ey 0 (2)
O O 1/Gxy
with Gxy and vxy being the laminate shear modulus andPoisson's ratio respectively, and the matrix [T]i is the
transformation matrix for the ith ply given by
cosza sinza sin2¤
» [Tli = sinza cosza -sin2a (3)
-1/2 sin2¤ 1/2 sin2¤ cos2¤

16
where a is the fiber orientation angle from the x—direction
(Fig. 3). Using the expressions for the two matrices, the
longitudinal fiber strain for the ith ply can be written as
K1 2. . 2zwi) = ] [cos ¤ sm ¤] (4)
With the stated assumption that the laminate fails when the
fiber strains in the principal load-carrying plies reach
their critical value, it was argued by Poe that s1JZT? is a
constant at failure. This constant was called the general
fracture toughness parameter and denoted by Qc.
The value of Qc was verified to be a material constantin Ref. [31} for boron/aluminum composite specimens with a
centrally located slot, regardless of ply orientation. The
same approach was extended to specimens made from
graphite/epoxy, boron/epoxy, E-glass/epoxy, S-glass-
graphite/epoxy, and graphite/polyimide materials with
various [Oi/i45j/90k] layups in Ref. [32]. It was further
verified that the values of Qc/sutf, where sutf is the
ultimate tensile strain of the fibers, was reasonably
constant and equal to 1.5 JET for all layups made with
different. materials except for those that delaminated. or
split extensively in the O° plies at the crack tips.
The critical value of the SIF, KC, is proportional to
Qc and can. be calculated from Eq. (4). The constant of

17
proportionality depends only on the elastic constants of the
laminate and the orientation of the principal load-carrying
fibers. Hence, once the value of Qc is known for a given
material, it is possible to predict the critical value of
the SIF for any layup of that material. Material properties
representative of graphite/epoxy are used throughout the
present work and a value of 0.015 »/mm' (corresponding to
sutf=0.01) is used for Qc.

Chapter III
FAILURE CRITERION FOR CRACKED PLATES INCOMPRESSION
3.1 EXPERIMENTAL EQRE
The failure of center-notched composite plates under _
tensile loadings has been the focus of many experimental
investigations. The effects of different material and
geometry parameters on the failure loads and modes are
generally well understood. Recent experimental
investigations have also concentrated on the compressive
strength of notched plates. For thick, strength-critical
plates, experimental studies have shown that impact damage,
delaminations, machined cracks and cutouts can cause a
severe reduction in the compressive load carrying capacity
of the plates (see, for example Refs. [3,4 and 34-36]).
Unlike plates under tensile loading which deform in the
plane of the plate, compressive loads can cause a plate to
buckle and result in significant out—of-plane deformations
depending on the plate thickness, geometry and boundary
conditions. Following a common design practice of using[
metal aircraft plates in the postbuckling range, some
researchers have been interested in the postbuckling
behavior of composite plates. Early analytical work (e.g.,
18

19
Refs. [37-43]), followed by experimental investigations
(e.g., Refs. [44-46]) have shown substantial postbuckling
strength for compression loaded graphite/epoxy plates.
The influence of circular holes on the postbuckling
response of flat rectangular graphite/epoxy plates was
investigated in Ref. [45]. It was found that circular holes
located along the longitudinal centerline of a plate do not
have a significant effect on the postbuckling response of
the plate. No experimental work is available, however, for
the effect of notches, as opposed to holes, on the
postbuckling performance of composite plates. Stress
concentrations introduced by notches are far stronger than
those introduced by holes and may interact with the out-of-
plane deformations of the plate to alter the failure mode
and cause early failure.
The purpose of the present experimental investigation
is to find the effect of notches or simulated through-cracks
on the buckling and postbuckling behavior_ of unstiffened
composite plates.
3.1.1 Test Specimens seg Apparatus
Nine test specimens, similar to those studied in a
previous experimental study [45], were used in the present
investigation. Five of the nine specimens were 16-ply

20
quasi-isotropic laminates with a [i45/O/90125 stacking
sequence, and the remaining four were 24-ply quasi-isotropic
laminates with a [i45/0/9O]3S stacking sequence. All
specimens were 50.8 cm long and 22.9 cm wide except for
three of the 16-ply laminates which were 10.2 cm wide.
Average thicknesses for the 24-ply and 16-ply laminates were
0.32 cm and 0.20 cm, respectively. '
Six pairs of back-to—back strain gages were used to
monitor longitudinal strains for each specimen. Direct
current differential transformers were used to monitor
longitudinal end-shortening and out-of-plane deflections at
different locations on the specimens. Out-of-plane
deformation patterns, monitored by the moire-fringe
technique, were recorded photographically. All electrical
measurements obtained from the tests were recorded on
magnetic tape.
All tests were performed with a 1.33-M hydraulic
testing machine at NASA Langley Research Center, Structural
Mechanics Branch. The unloaded edges of the specimens were
simply supported by knife-edge restraints, and the loaded
ends were clamped. A typical test specimen mounted in the
support fixture is shown in Fig. 4.
A lateral slot approximately 0.04 cm wide and either
2.5 cm or 5.1 cm long was machined into each of the nine

21
plates at different locations (see Fig. 5). Results of Ref
‘[45] for plates without cutouts and without impact damage
indicate that failure occurs along a nodal line of the
buckling mode. Therefore, slots were machined close to an
expected nodal line in seven of the test specimens to
determine their effect on failure loads. For the remaining
two specimens, slots were located close to a point of
maximum out-of-plane deflection to determine if a high level
of bending stresses would affect the mode of failure.
The result of the impact-damage experiments [45]
suggested that the lateral location of slots may affect the
postbuckling strength. Consequently, the slots were
centrally located for five of the test specimens (C1 through
C5), and were offset with respect to the longitudinal center
line for the remaining four specimens (S1 through S4). The
offset slots were located in regions of high postbuckling
strains which were expected to affect the failure.
3.1.2 Results ang Discussion
3.1.2.1 Prebuckling and Buckling Response
The prebuckling responses of most of the plates with
slots were similar to the prebuckling responses of the
unslotted specimens of Ref. [45]. The initial buckling
loads and the number of longitudinal halfwaves of the

22
buckling mode are presented in Table 1 for each plate. The
measured failure loads are also included in the Table as
_ well as corresponding results from Ref. [45]._ Comparison of
buckling loads in Table 1 with the corresponding analytical
buckling loads of the control specimens of Ref. [45]+
· indicates that there is almost no effect of the slot on the
buckling load of the plates. However, local deformations
caused by the slots affected the buckling mode shapes.
End-shortening results for the 24- and 16-ply plates
are shown in Figs. 6 and 7, respectively, as a function of
the applied compressive load. The end-shortening
deflections, u, are normalized by the plate length, L. The
applied loads, P, are normalized by the product EXA where A
is the cross sectional area, and Ex is the laminatelongitudinal modulus for specimens without slots given in
Ref. [45]. End-shortening response of control specimens,
obtained from Ref. [45], are also included in Figs. 6 and 7
(as solid lines) for each plate type. The failure load of
each plate is indicated by a symbol on the appropriate
curve.
+Experimental buckling loads were not reported in Ref.[45]; The reported analytical results are consistent withthe stiffness changes shown on the load-deflection curves.

23
Longitudinal stiffness change. The prebuckling slopes for
all specimens with slots, as shown in Figs. 6 and 7, are
observed to be slightly smaller than the corresponding
prebuckling slopes of the control specimens. This
difference reflects a slight reduction in the axial
stiffness of the slotted plates compared to the unslotted
specimens. Calculated slopes for a representative 24-ply
plate and a 16-ply plate, specimens Sl and S3, respectively,
are also included in Figs. 6 and 7. A linear finite element
program [33] for analyzing cracked orthotropic plates was_
used for the prebuckling stiffness calculations. Calculated
slopes agree well with the corresponding experimental
values. However, for specimens C3 and C4, the slopes of
prebuckling paths are about 15% smaller than the calculated
values.
Strain distribution. The strain versus load curves, in all
cases, were similar to those obtained in Ref. [45] except
for strain gages either located close to the slot or located
close to the line collinear with the slot. For example, the
strain gage located at the center of specimen S3, close to
the line collinear with the slot, indicated higher strains
than the control specimen. The strain gage located just
below* the‘ slot indicated a lower strain compared to the
control specimen.

24
3.1.2.2 Postbuckling Response
Comparison of the postbuckling end-shortening results
for plates with slots and for the control specimens
indicates no major differences in response up to failure
(see Figs. 6 and 7). But, some effects of the slots on the
local strains, deformations, and failure loads were
observed.
Postbuckling strains ggg deformations. The average strains
obtained from back-to-back strain gages located at the
center of the plate are shown in Fig. 8 for the 24-ply
specimens. The applied load and corresponding strains are
both normalized with respect to their analytical buckling
values for each specimen so that postbuckling strains at the
strain gage location can be compared for plates with
_ different slot locations. Postbuckling strain response at
the center of the plate was not affected significantly in
the case of a slot located at some distance from the plate
center. For example, for specimen C5, where the slot
located longitudinally far from the strain gage location,
the postbuckling strain response is similar to the response
of unslotted control specimen of Ref. [45] (see Fig. 8).
For the control specimen, bending strains at the
_ corresponding strain gage location increased with loading in
the postbuckling range, but membrane strains attained their

25
maximum value at the buckling load and became very small at
failure. For specimens with a slot located close to the
plate center, the slot had a significant effect on the
strains. For example, membrane strains for specimens Cl and
C2 not only diminished in magnitude, but also changed sign
to become tensile (see Fig. 8). For specimen C2, which had
a longer slot compared to Cl, the magnitude of the tensile
strain prior to failure was almost as large as the maximum .
compressive strain experienced during buckling (However, the
maximum value of the compressive strain for specimen C2 was
small at the plate center compared to the other specimens).
The postbuckling strain response of specimen S1 was similar
to that of the control specimen except that specimen Sl
failed at a lower load.
Moire-fringe patterns indicate some effect of the slots
on buckling mode shapes. Longer slots reduce the stiffness
of the plates and allow larger out-of-plane deformations to
occur. Increased out—of-plane deformations close to the
slot location were observed froux measurements and fringe
patterns especially for specimens C2, C3 and C4. Specimen
C4, which is the most flexible plate (it has small thickness
and long slot) buckled into a three longitudinal halfwaves
with the slot located at the maximum amplitude of the middle
halfwave. The unslotted control specimen buckled into two
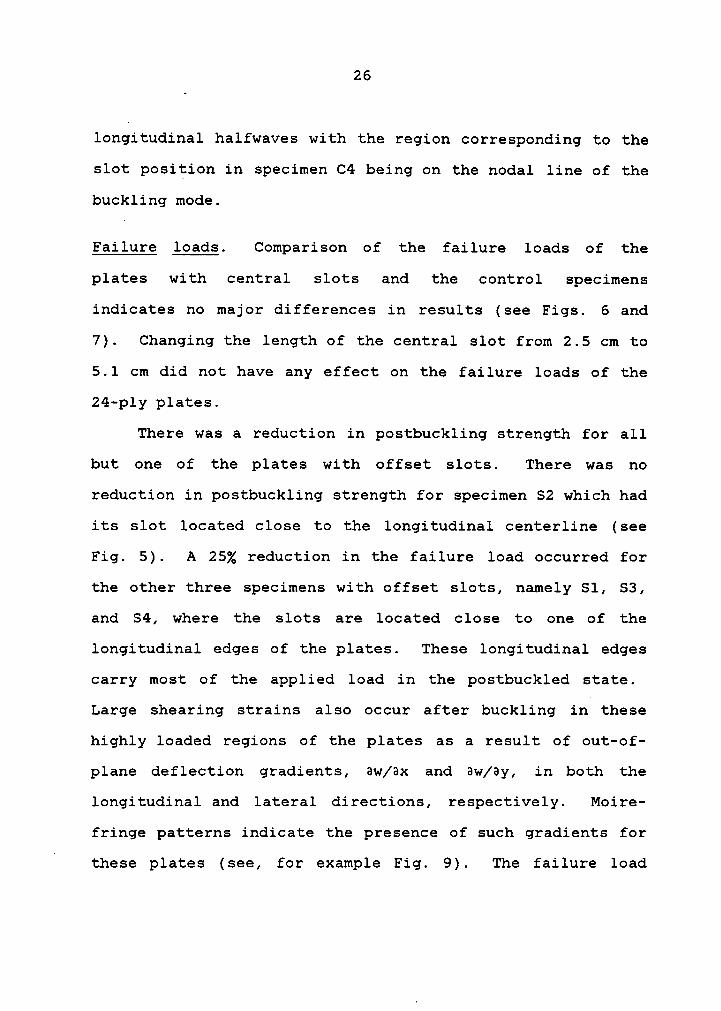
26
longitudinal halfwaves with the region corresponding to the
slot position in specimen C4 being on the nodal line of the
buckling mode.
Failure loads. Comparison of the failure loads of the
plates with central slots and the control specimens
indicates no major differences in results (see Figs. 6 and
7). Changing the length of the central slot from 2.5 cm to
5.1 cm did not have any effect on the failure loads of the
24·ply plates.
There was a reduction in postbuckling strength for all
but one of the plates with offset slots. There was no
reduction in postbuckling strength for specimen S2 which had
its slot located close to the longitudinal centerline (see
Fig. 5). A 25% reduction in the failure load occurred for
the other three specimens with offset slots, namely S1, S3,
and S4, where the slots are located close to one of the
longitudinal edges of the plates. These longitudinal edges
carry most of the applied load in the postbuckled state.
Large shearing strains also occur after buckling in these
highly loaded regions of the plates as a result of out-of-
plane deflection gradients, aw/ax and aw/ay, in both the
longitudinal and lateral directions, respectively. Moire-
fringe patterns indicate the presence of such gradients forl
these plates (see, for example Fig. 9). The failure load

27
is, therefore, reduced by the combined effects of the high
values of shearing strains due to out-of-plane deflections
and the stress concentrations at the slot tip, interacting
with the high stresses at the longitudinal edges.
In addition to the interaction of the stress
concentrations caused by the slot with the high postbuckling
stresses at the plate edges, it is also possible that the
slot tip and the plate boundary interact to influence the
prebuckling stresses. The results of a linear-elastic
finite element study of the effect of slot location on the
fracture behavior of composite plates loaded in tension
indicate that such a boundary interaction occurs. Thel
stress intensity factor used to obtain the strength of the
stress concentration around the slot tip was calculated with
the finite element program of Ref. [33] for plates similar
to the test specimens. For offset slots, the stress
intensity factors at the slot-tip located. closer to the
boundary were substantially larger than those obtained for
central slots of same length. The effect of the slot
location on the stress intensity factor indicates that there
is an effect of the boundary on the prebuckling stress
distribution.

28
3.1.2.3 Failure characteristics
Central slots. The failure mode for the plates with central
slots was similar to the failure mode of the control
specimen of Ref. [45]. The coupling of the increased
membrane strains near the specimen edges with the out-of- .
plane deflection gradients at the nodal lines introduced
sufficient transverse shearing loads to fail the plate in a
shear failure mode, which was accompanied by extensive“
delamination. For example, specimen C5, which had a slot
machined close to its maximum out-of-plane deflection
location, failed along a nodal line leaving the slot
location undamaged (Fig. lO).
When the central slots were located close to a nodal
line (specimens C1 through C4) visual inspections after
failure indicated that delamination damage extended from the
nodal line to the closest slot surface. The moire—fringe
pattern for specimen C2 in Fig. 11, recorded by applying a
small amount of load to buckle the delaminated area,
indicates the extent of damage after failure. Apparently,
interlaminar stress concentrations, associated with a free
edge of the slot, interacting with the delaminations along
the nodal line during the failure caused this behavior.
Further inspection (C-scan) did not indicate significant
damage to the upper portion (with respect to the slot in
Fig. 11) of the plate even at distances close to the slot.

29
Offset slots. When the slots were located close to the edge
of a plate, there was extensive damage in the area between
the slot and the closest plate edge. The failure
characteristics were similar to those reported previously
[36,47] for strength—critical plates with large holes. In
these earlier studies, a shear crippling failure mode, see
Fig. 12, was observed in some O° plies which is believed to
be initiated by local microbuckling of the O° fibers in
regions of high strain concentrations. These crippled or
failed O° fibers may have caused subsequent delaminations to
occur, and the combination of shear—crippled fibers and
subsequent delaminations is suspected to be the cause of the
local damage propagation that failed the plate below its
unnotched strength. It is suspected that the high strain
concentrations at the slot tip combines with the shear
strains to cause a similar type of failure for the offset
slots in the present work. Slot surfaces did not have
significant damage except for some local delaminations which
were mostly‘ due to bearing of the slot surfaces on one
another at failure.
Specimen S2, with a slot only slightly offset from the
center (see Fig. 5), had a third type of failure mode which
is apparently due to differential out-of-plane deformations
of the slot surfaces interacting with the right slot tip.

3O
The failure seemed to propagate from the right tip of the
slot to the plate edge (see Fig. 13) even though the left
tip of the slot is closer to the boundary. Inspection
indicated a minimal amount of delamination along the entire
width. of the specimen. compared to the other plates with
offset slots. Furthermore, unlike the other plates, the A
strain versus load curve for the strain gages right below
the slot tip near the longitudinal center line of the plate
indicated a strain reduction for both the front and back
strain gages at about 85% of the failure load. The
simultaneous strain reduction in both back-to-back strain
gages indicates a reduction in the axial load carried at the
strain gage location. This reduction can occur when the
slot extends laterally as a result of slot tip <iamage.
However, axial strains are too low in the central region of
the specimen to cause failure in the postbuckling range. It
is suspected, therefore, that the out-of—plane deflections
of the slot surfaces relative to one another combined with
the axial strains to initiate failure at the slot tip
possibly by microbuckling or crippling of the fibers
locally. Damage at the slot tip allowed larger out-of—planeA
deformations of the slot surfaces which, in turn, caused the
damage to propagate to the specimen edge.

31
3.1.3 Summary
For the slot and plate geometries selected, the overall
prebuckling and buckling behavior of the notched plates was
not significantly different than that of unnotched plates.
The postbuckling strength and failure mode were not
affected by centrally located slots, and plates failed along
a nodal line of the buckling mode in an induced shear
failure mode. This type of failure is typical of plates
without slots loaded into the postbuckling range. Slots
located close to an edge of the plates, where high
postbuckling membrane strains exist, reduced somewhat the
load level at failure and the plates failed in a mode
similar to that of strength-critical plates with large
holes, see Fig. 12. The failure mode induced by the strain
concentrations near the slot tip was characterized by
extensive damage in the region between the slot tip and the
plate edge.
The results indicate that for buckling-critical plates
the effects of central cracks are not important, and can
probably be ignored by the designer. The rest of this work,
therefore, is focused on strength-critical plates. The
second half of this chapter is devoted to seeking a failure
criterion for designing strength—critical notched plates in
compression.

32
3.2 ANALYTICAL CRITERION
While the state of the art in predicting the strength
and damage development of composites has progressed rapidly
during the past decade, there are still some unresolved
problems. One such problem is the analytical prediction of
the compressive strength of unidirectionally reinforced
composites, and even more so the compressive strength of
composite plates with cracks. The literature of compressive
failure models is reviewed in the next sub-section.
Although some of the approaches discussed are reported to
agree with the experimental results, their application is
limited to cases where the stress state is simple (usually
only uniaxial compression). Even if a cracked plate is
loaded with simple uniaxial loads, stresses around a crack
tip are complex. Therefore, the direct application of
approaches developed in the literature for uncracked plates
is not possible. Therefore, damage tolerance methodology
that can be used in an automated design process for
compression loaded composite plates with a crack does not
exist. The purpose of this section is to develop a failure
model based on microbuckling followed by breaking of the
fibers under the combination of normal and shear stresses
around a crack tip for use in the design of cracked plates
under compressive loading.i

33
3.2.l_ Review gf Literature
Early work on the compressive failure of fiber-
reinforced composite materials has considered buckling of
stiff fibers in a relatively flexible matrix [48,49]. Rosen
[48] considered the composite material to consist of
alternate layers of reinforcement and matrix materials (see .
Fig. 14). For his two—dimensional model, the two possible
types of microbuckling failure are shown in Fig. 15. For
the mode shown in Fig. 15-a, fibers may buckle in opposite
directions, and the matrix is extended or compressed in a
direction transverse to the fibers. This mode is called the
extension mode. In the other mode, called the shear mode,
the fibers buckle in phase with one another subjecting the
matrix material to shear deformation (see Fig. 15-b).
Assuming the buckling displacement v of individual fibers in
the transverse direction to be in the form of sine waves
v=mä1
am (5)
Rosen used an energy approach to calculate the critical
fiber stress for extension and shear modes respectively as
°£,cE = 2 lg (6*)Gm

34
where Em, Ef are the extensional moduli of the matrix andfiber material, respectively, Gm is the matrix shear
modulus, and Vf is the fiber volume fraction. The samemicrostability failure analysis was performed by Schuerch
[49], who called the elastic failure of the stiffening‘
constituent crippling failure, and extended the application
of the model into inelastic microbuckling. Noting that the
crippling failure occurs mostly at strain levels exceeding
the yield point of his metal matrix, he suggested replacing
the extensional and shear moduli of the matrix material with
tangent moduli corresponding to the compressive strain level
in the matrix. Reasonable agreement of limited test results
with the inelastic analysis is reported in Ref. [49] for
Boron/Magnesium composites.
Another approach, called macroscopic shear instability
formulation, is proposed for cases where the flexural
rigidity is large compared to the shear rigidity of the
structure [50,51]. In case of a shear instability, buckling
accompanying shear deformation will take place, and the
buckling load will be governed by the shear rigidity of the
structure rather than the bending rigidity. Early
applications of this concept to two—dimensional orthotropic
solids, as well as discretized beam and frame structures,
are given by Hayashi [50]. For a two—dimensional solid, the

35
shear instability is expected to occux· when the applied 1
stress level, c, reaches the shear modulus, Gxy, of thematerial [50].
Foye [51] has reached the same conclusion by
considering a unit element of material taken out from a
continuous two-dimensional orthotropic sheet. Using an
energy approach, he obtained the modified stress—strain law
under combined compressive and shear loading as,
rxy = ( Gxy + o ) Kxy (7)
Eq. (7) indicates that the effective shear modulus of the
material, (Gxy + o), decreases as the stress o increases in
compression until, at the limit, the material loses its
effective shear stiffness and becomes susceptible to
crippling in a shear mode. Expressing the composite shear
modulus in terms of its constituents, the critical fiber
stress, of = c/Vf, can be written as
1Gm
°f·<= ' ‘8’
If the ratio of the matrix to fiber shear modulus is
negligible, Eq. (8) reduces to critical fiber stress given
by Rosen, Eq. (6-b). An advantage of Eq. (8) over Eq. (6-b)
is that it remains bounded for values of fiber volume
fraction close to l.O.

36
Early experimental works [52-54] do not correlate with
the available two-dimensional models. Buckling of fibers in
a three-dimensional helical pattern [53] instead of the two-
dimensional modes assumed in the models was claimed to
account for the 40% lower compressive stress observed in
Ref. [52,53]. In order to close the gap between
experimental and theoretical results and to aid better
understanding of factors involved, several researchers have
concentrated on different aspects of the compression failure
of composites.
Herrmann [55] performed microbuckling analysis of a
single, round fiber imbedded in a matrix. Three-dimensional
elasticity was used by Herrmann to characterize the matrix
behavior, but the interaction between the adjacent fibers
was neglected. Additionally, in a real composite material,
fibers may have initial curvatures due to imperfections in
the manufacturing process. The crookedness of fibers is
· considered to lower the compressive strength of
unidirectional composites [55-57]. Beside microbuckling,
fiber-matrix separation has been investigated, by several
researchers [57-59]. Prebuckling separation between fiber
and xnatrix has, for example, been shown to decrease the
buckling load of the fiber [58]. Broad reviews of early
‘analytical and experimental work on microbuckling of

37
composites and further references can be obtained in Refs.
[60-62]. .
More recent investigations [63-67] suggest another type
of compressive failure mechanism, called fiber kinking
failure which is characterized by a band of buckled,
fractured fibers that has undergone both shearing and
compressional deformations as seen in Fig. 16. Experimental
investigations have shown that localized fiber rotations due
to microbuckling are associated with the kinking process
[64]. Fiber fracture strength is viewed as a primary
property governing the kink formation [64-67]. Weaver [65]
concluded that the kinking process is initiated by the
transverse fracture of buckled fibers in the composite
laminate. Kink formation is assumed to nucleate at a
material defect point such as a region with poor fiber
alignment [63] or at a notch that acts as a stress
concentrater [68]. The propagation of kinking through the
composite is preceded by a process of successive buckling
and fracture of adjacent fibers to form the kink band. The
nature of this process is essentially the same as the crack
propagation from a notch under tensile loading that causes
fibers to break successively. Indeed, Chaplin [68]
postulated that the prediction of compression failure of
composites is a classical fracture mechanics problem that

38
requires the determination of the extent of the degradation
in compressive load carrying capacity of a given defect.
Based on the observations of References given in the
previous paragraph, it is conceivable that the strength
failure of' composite plates with, a crack is governed by
fiber kinking. Compressive fatigue tests by Berg and Salama
[69] and static tests by Parry and Wronski [70] of notched
specimens indicate that microbuckling in the form of kink
band formation at the tip of the notches is the principal
mechanism of compressive notch extension and failure. Also,
the shear crippling failure observed by Rhodes et al. [47]
in compressive specimens with a hole (see Fig. 12) is
believed to be initiated by local microbuckling of 0° plies
followed by fiber kinking.
Some of the failure criteria developed for strength
prediction of plates with holes and notches under tensile
loadings have also been used for predicting compressive
fracture strengths [47,71,72]. Rhodes et al. [47] and
Haftka and Starnes [72] have used the point-stress criterion
due to Whitney and Nuismer [23] for flat plates with holes.
Nuismer [71] used the average—stress criterion. A
description of these criteria is given in the previous
chapter. It is claimed in Ref. [47] that the point-stress
V failure criterion can be an effective tool for predicting

39
and. understanding the failure of graphite/epoxy* composite
laminates with holes and provides insight in predicting
failure of panels with other flaw types. However, direct
use of the criterion in a design process is limited. The
point-stress criterion does not provide insight into the
local material behavior and does not relate the local
behavior to the failure process. Also, the stress state
close to a. notch or· other types of cut-outs is ‘usually
complicated. The point-stress and average-stress criteria,
like the previous microbuckling criteria [48,51,65],
consider failure as a. result of only the unidirectional
compressive stresses and, therefore, are not suitable for
the failure of compressively loaded notched plates.
3.2.2 Damage Mpggl fp; Cracked Plates ip Compression
As discussed previously, shear crippling of the
principal load-carrying fibers is one of the most common
damage mechanisms that are observed in compressively loaded
composite laminates [73]. Such a mechanism can be activated
by the microbuckling of the fibers within the laminae. In
addition to high compressive stress concentrations, which
may be the main cause of microbuckling of the fibers,
significant in—plane shearing stress concentrations exist
near the tips of a crack. Transverse shear deformations

4O
were shown analytically to have a detrimental effect on the
compressive strength of composites [74]. The experimental
findings discussed in the first part of this chapter verify
that claim. Also, Shuart and Williams [75] suggested that
failure of plates with. central holes is affected by' the
presence of such shearing stresses around the edges of the
hole.
The objective of this section is to include those "
shearing stresses around a crack in a model for predicting
the failure of composite plates under compressive loadings.
An important issue in the development of a failure criterion
for cracked plates is the singularity of the stress field at
the crack tip. The magnitude of stresses near the crack tip
is inversely proportional to the square root of the distance
from the crack and, therefore, becomes infinitely large at
the crack tip. The model developed must be capable of
accounting for this stress singularity. Two main approaches
are used in the literature. One approach is to combine some
of the terms that multiply the singularity term and assume
that these have an upper value which is a material constant
at failure. This is done mostly in classical fracture
mechanics applications. Also the criterion used in chapter
2 is based on a variation of this approach. Another
approach is to associate the failure with what is happening

41
at (or within) a specified distance from the crack tip. The
classical examples of this latter approach are the point-
stress and average—stress criteria. The two approaches of
avoiding the singularity are equivalent and either one of
them can be used. In the present work, the latter approach
will be utilised.
3.2.2.1 ~ Crack tip stresses
The strain components of Eq. (1) along the principal
material direction of a ply with an arbitrary orientation
are based on the stress field given by
¤ 1x
- K1 J?°y ‘
rz? Ey/Ex (9)1 OXY
The stresses given in Eq. (9) are restricted to the points
along the y axis, ¢ = O (see Fig. 3), and neglect the mode
II, in-plane shearing mode, stress intensity factor. The
more general case of Eq. (9) for the analytical solution of
stresses around the crack tip [76] is ‘
„ K1 K11 -Gx = Gx * $***21 > + 7:%**9 Z= > <l°·¤)z )+ ilaq z ) (lO-b)cy - y «/21rr 3 ¢21rr' 9
z z ) (10-c)xy- xy /2nr 9 ¢2nr' 9
where

42
Z1 = ..l..(....JäL....-VC + 525 VC + 515
1 1 1Z2 = **—' ‘**·)1 2 JC + sZS JC + slS
Z3 =.Jä§EL( ...E£....- ...äL_..)S1" S2 Jc + S26' Jc + sls‘
$1-52 Jc + s2S Jc + slS
ZS = SISZ ( 1 _ 1 )S1- S2
VC + S15 vC + S25
Z_ 1
(51 $2
)6 — ——:—· ————————-'-————————S1 S2 Jc + sls' Jc + s2S'
where C = cos w and S = sin ¢. sl, sz and their complex
conjugates in the above equations are the roots of the
characteristic equation given by
all S1 + 2a16 S3* (2a1z + 866) $2 ‘ Zazs S * azz = O (11)
where the aij are the elements of the laminate compliance
matrix.
Analysis of the plates considered in this work is
limited to symmetric plates with balanced laminates. This
restriction eliminates the mode II stress intensity factor
leaving only the first two terms in Eqs. (10-a,b, and c).
However, for w ¢ O, considerable shear stresses can be
obtained with Eq. (10) in contrast to Eq. (9). A typical
shear stress distribution around the crack tip is given in
43
Fig. 17 for a quasi-isotropic plate under uniaxial loading
in x-direction that produce a stress intensity factor of
2500 MPaüEF.
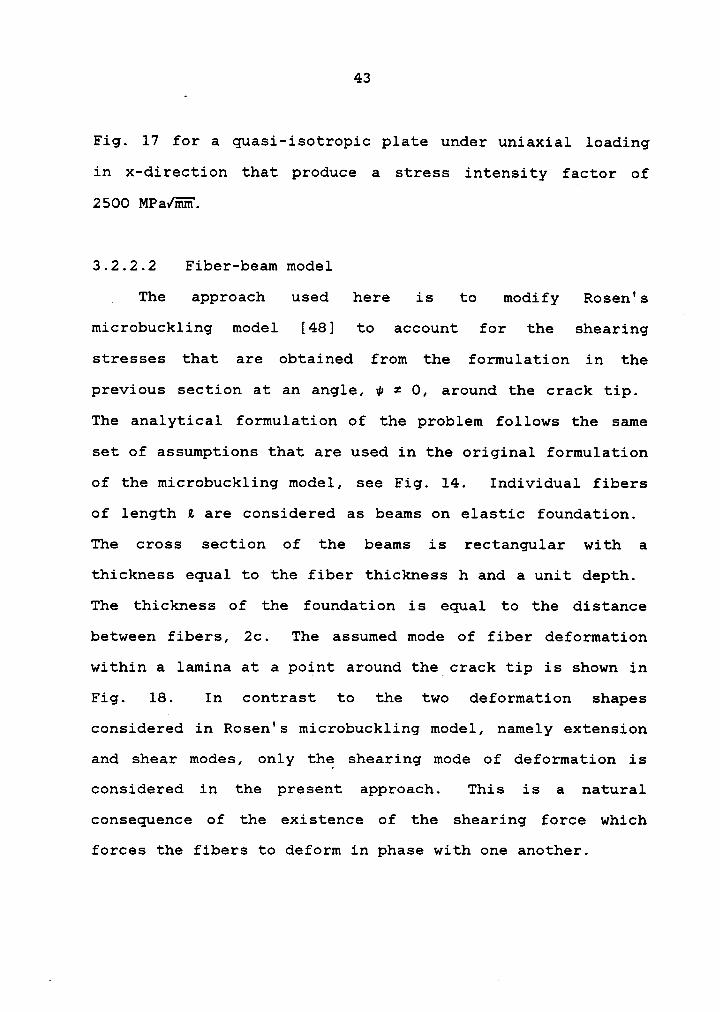
3.2.2.2 Fiber-beam model
The approach used here is to modify Rosen's
microbuckling model [48] to account for the shearingI
stresses that are obtained from the formulation in the
previous section at an angle, w = O, around the crack tip.
The analytical formulation of the problem follows the same
set of assumptions that are used in the original formulation
of the microbuckling model, see Fig. 14. Individual fibers
of length ß are considered as beams on elastic foundation.
The cross section of the beams is rectangular with a
thickness equal to the fiber thickness h and a unit depth.
The thickness of the foundation is equal to the distance
between fibers, 2c. The assumed mode of fiber deformation
within a lamina at a point around the crack tip is shown in
Fig. 18. In contrast to the two deformation shapes
considered in Rosen's microbuckling model, namely extension
and shear modes, only the shearing mode of deformation is
considered in the present approach. This is a natural
consequence of the existence of the shearing force which
forces the fibers to deform in phase with one another.

44
An energy approach is used for the formulation of the
equilibrium equation and boundary conditions. Neglecting
the shearing deformations of the fiber and the extensional
deformations of the matrix, the strain energy of the system
can be written as
1 2 1 2 ·U =-E—°f EfIf( V")Z dx +·ir°f 2c Txyxxy dx (12)
where 1 = G X , K = ( 1 +-Q- ) V', and thexy m xy xy 2c
prime denotes differentiation with respect to x (the
coordinate along the fiber in Fig. 19).
In addition to the potential energy of the axial force
Pf which is considered in previous model, there is also the
potential energy due to the side force Sf which is applied
at the free end of the beam as shown in Fig. 19.
Q =-E-P f£(V')2 dx + Sf£v'
dx (13)2 f Q f Q
The side force Sf is assumed to be the result of shearing
stresses at the point of interest.
Taking the first Variation of the total energy and
equating it to zero, the equilibrium equation for the fiber
can be obtained as
"
'h(Eflf V") + [ Pf - 2c Gm( 1 +-EE
)2] V" = O (14)
and general boundary conditions at x = O and x = 2 as,
I - either v=O or —(EfIfV")'+[2cGm(1+§E)2—Pf]V'—qPf= O

45
II- either v'=O or EfIfv" = O
where q =—§§ . Since the ratio of the axial force to
the shearing force stays constant at any point around the
crack tip as the applied load is increased, it is ladvantageous to use a new variable q as defined above.
V
Assuming that the fiber ends remain straight during the
deformation, (see Fig. 19), the general boundary conditions
given above reduce to
at x = O i- v = O ii- V' = O qpfat x = ß 111- v = O iv- Vf
f
The loading on the fiber is symmetric with respect to the
midpoint of the fiber (the uniform shear stress field along
the length of the beam is nmdeled as two equal opposite
concentrated forces at two ends). Therefore, symmetric end
conditions are preferred and zero slope clamped-clamped end
conditions are selected. A more realistic set of end
conditions would have been to let the ends to rotate under
loading by using rotational springs at the ends. But, the
determination of elastic constants for such rotational
springs is complicated and therefore not used in the present
work.

46
Applying the above boundary conditions to the
equilibrium equation, (14), yields three independent
solutions depending on the value of the axial force Pf,
I — For Pfs 2c Gm( 1 + ääy)a
Vqpf
[smhk x - kx·EfIf(k1) 1 1 Sinhk,2 1
where (k1)a = [2c Gm( 1 +·%E-)a - Pf] / Eflf
II - For P = 2c G ( 1 +ll-)af m 2c
¤Pfxa „ Xv =i——(— -—) (16)2EfIf 2 3
III- For P 2 2c G ( 1 +lL-)af m 2c
qPf_ . (C kaz—1)V - [S1I‘1kzX · kzx + gänkzß (Coskzx-1)] (17)
where (k2)Z = [ Pf- 2c Gm( 1 +-gg )Z ] / Eflf
Note from the above solutions that the value of the
side displacement v is unbounded for Sin kzß = O which gives
a critical load of
P =2cG(1+—L)2+“ZEI (18)f,C m 2c_IE
f f
and substituting
- h —£ -vr ‘ h+2c If ‘ 12 and P£,c ’ °£,c n
47
— in Eq. (18), we obtain the critical value of the stress for
shear mode of the microbuckling model given by Rosen [48],
see Eq. (6-b). The second term in Eq. (18) is neglected by
Rosen by assuming the buckling wave length 2 to be much
larger than the fiber width h. For the wave lengths
considered in the present work, the contribution from the
second term is comparable to the first one and, hence, will
be retained. ~
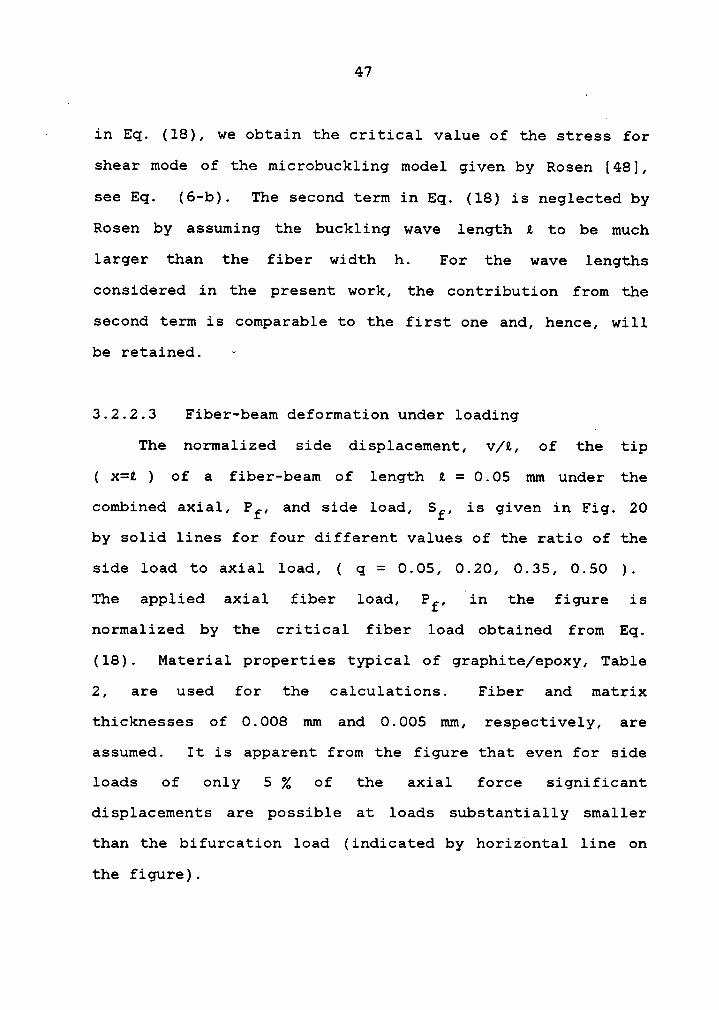
3.2.2.3 Fiber-beam deformation under loading
The normalized side displacement, v/2, of the tip
( x=2 ) of a fiber-beam of length 2 = 0.05 umx under the
combined axial, Pf, and side load, Sf, is given in Fig. 20
by solid lines for four different values of the ratio of the
side load to axial load, ( q = 0.05, 0.20, 0.35, 0.50 ).
The applied axial fiber load, Pf, [in the figure is
normalized by the critical fiber load. obtained from Eq.
(18). Material properties typical of graphite/epoxy, Table
2, are used for the calculations. Fiber and matrix
thicknesses of 0.008 mm and 0.005 umg respectively, are
assumed. It is apparent from the figure that even for side
loads of only 5 Z of the axial force significant
displacements are possible at loads substantially smaller
than the bifurcation load (indicated by horizontal line on
the figure).

48
The dashed lines in the figure are obtained by
considering the change of the effective shear modulus of the
material according to Eq. (7) as the compressive load is
increased. It is assumed that the decrease in the effective
laminate shear modulus is due to a decrease in the matrix
shear modulus Gm only. The change in Gm with the loading is
calculated by assuming that the shearing stresses on the
fiber and the matrix are the same [77].
3.2.3 Failure Model
The failure model developed in the present work is
based on the fact that large fiber bending stresses can be
induced due to microbuckling of the fibers of the principal
load-carrying plies around the crack tip.
3.2.3.1 Fiber stresses
For a fiber of unit depth and a thickness h, the
maximum bending stress at a cross section is
_ 6 M°b @9)
where the bending moment, M, is given in terms of the fiber
deformation by
- IIM — EfIfv M(2O)

49
The maximum compressive stress in a fiber is the sum of the
normal compressive stress due to Pf and the maximumcompressive bending stress. The maximum bending stresses
are achieved at both ends of the fiber, at x=O and x=ß.
Depending on the value of the axial fiber force, the
expressions for the fiber deformation from Eqs. (15), (16),
or (17) can be used to find the maximum compressive stress
at the fiber as ‘
I - For P S 2c G ( 1 +-ä- )2f m 2c
f,max h h kl Slnhklß
II — For P = 2c G ( 1 +-E- )2f m 2c
°f,maxzäi (21-b)
III- For P 2 2c G ( 1 +lL—)Zf m 2c
¤ =i- (21-c)f,max h h kg Slhkzß
The maximum fiber—stresses for the same four q values
used in the previous figure are plotted in Fig. 21 with
solid lines as the fiber load is increased. The fiber
stress is normalized by the critical fiber stress, and the
applied axial fiber load is normalized by the critical fiber
load. As in the case of the Fig. 20 curves given by the

50
A
dashed lines are obtained by considering the softening of
the_shear resistance of the material under the compressive
load. The fiber compressive stress in the absence of
bending, q = 0, increases linearly with the load. But, even
a small amount of shearing load causes a large increase in
the stress and induces slight nonlinearities. It is
proposed here that these large compressive stresses, which
are the result of bending of the fibers, may be the cause of
breaking of the fibers and lead to crippling of the load
carrying plies.
The value of the maximum stress that can be carried by
a fiber is not well established in the literature. Fiber
manufacturers report strength values in the range of 2500
MPa to 4000 MPa under tensile loadings, but values for the
compressive strength are qnot available. Based on
experimental results, calculated values for the fiber
compressive failure stress are reported to be around 3000
MPa in Ref. [65] for carbon fibers. This value is used for
the implementation of the model in the following sections.
Note from Fig. 21 that for stress levels below 3000 MPa the
effect of shear softening is small. Therefore shear[
softening is not included in the failure model. The value
of the fiber length assumed for the model is Z = 0.05 mm.
This is a representative value for the length of fiber
breaks observed in Ref. [65].

51
3.2.3.2 Failure prediction for cracked plates
As with the point-stress criterion, the implementation
of the proposed model calls for determination of the
distance ahead of the crack tip ·where the maximum fiber
stress is compared to the allowable fiber stress value. The
maximum fiber stress is a function of both the axial and
shearing forces that change their relative values depending
on the angular orientation of the point around the crack
tip. For the present work, it is assumed that the radial
distance r to the failure check point is a material constant
which is independent of the ply combinations and stacking
sequence of the laminate. However, for a given distance r
it is necessary to search for a point on a circle with
radius r, where the combination of axial and shear forces
that maximizes the fiber stress for the principal load-
carrying lamina is obtained.
To determine the ‘value of r, experimental values of
far-field failure strain for quasi-isotropic plates with
machined cracks of different lengths fron1 Ref. [47] are
used. A finite element program with a special crack tip
element [33] is used to relate the stress intensity factor
at failure to the far-field failure strain and Eq. (10) is
used to define the stress field in the immediate
neighbourhood of the crack tip. Once the stresses are

52
obtained, the longest distance, r, to the point at which
combination of axial and shear stresses causes breaking of
the fiber is calculated for each of' the quasi—isotropic
specimens of Ref. [47]. The average of the distance r for
all those specimens with different crack lengths is.
calculated to be 1.5 mm. A prediction curve based on the
average value of r = 1.5 mm is shown in Fig. 22 with a solid
line. Another prediction curve based on an average value of "
r = 0.05 mm is also generated, shown by the dashed line in
Fig. 22, by excluding the effect of shearing force and using
the microstability failure criterion of Rosen [48] given by
Eq. (6-b). Both predictions seems to be in good agreement
with the experimental values (circular symbols) in
representing the failure behavior of the plate as the crack
aspect ratio changes. Only at small crack aspect ratiosdo]
the two predictions give slightly different results. A
slightly less steep prediction curve obtained with the
present approach agrees better with the experimental results
in this case.
The real challenge for the model is to match
experimental failure loads of plates with various ply
compositions and stacking sequences that introduce a
‘ different degree of orthotropy. Unfortunately, no
experimental data have been found i11 the literature for

l53
orthotropic plates with cracks. For plates with holes, on
the other hand, some experimental data are available. The
finite element mesh generator used in the present work is
limited to plates with cracks, and the focus of this work is
limited to designing plates with cracks that simulate a
damage condition. However, because of the availability of
such data, an attempt is made next to test the model for
plates with holes assuming that analysis of cracked plates
will give us some idea of the failure of plates with holes.
3.2.3.3 Failure prediction for plates with holes
For the analyses of plates with holes, the crack finite
element program is used with a crack size equal to the hole
diameter. First, a value of the radial distance ahead of
the crack tip for each of the experimental quasi-isotropic
plates with holes in Ref. [47] is determined so that the
combined bending and axial stress in the fiber is equal to
the fiber failure stress. The average of the distance r for
those quasi-isotropic specimens is calculated to be 2.5 mm.
Experimental values of the far field failure strain for
those quasi-isotropic plates are given in Fig. 23 by
circular symbols together with some experimental values for
i45° dominated plates shown by triangles and squares.
Predictions made using the present model with r = 2.5 mm are

54
shown with the solid lines in the figure. Dashed lines are
obtained by using Rosen's [48] microbuckling criterion with
r = 0.08 mm. For the quasi-isotropic specimens, both models
show good agreement with the experimental results. As in
the case of cracked plates, the present model seems to have
a slight advantage over the classical microbuckling model
for small values of the crack aspect ratio. However, both
predictions seem to confirm that analyses made with cracks
can be used to represent the hole size effect for specimens
with holes. Based on the same values of the distance r,
predictions are also made for two :45° dominated layups,
namely or [(i45/¥45)6]S and
see Fig. 23.
The predictions obtained by the present model seem to
capture the essential trend of the experimental results and
show a reasonable agreement, while the Rosen's microbuckling
criterion predicts far field failure strains which are too
high. This is expected because the failure of i45°
dominated layups are affected more by shearing stresses [75]
than 0° dominated layups.
The proposed model is also checked against a recent
experimental investigation, Ref. [72], of the effect of
degree of orthotropy of layup on failure loads.
Experimental results are for 127 mm wide graphite/epoxy

55
specimens with a 25.4 mm hole. Specimens are all 78 plies
thick with a fixed number of 90° plies. Four different
layups were tested,
and
Oothicknessesconstituting O°, 15%, 31%, and 46% of the total
thickness. Experimental values of the failure loads are
shown with circular symbols in Fig. 24. Predictions made by
the present model (r = 2.5 mm) and Rosen's model are
(r = 0.08 mm) presented by the square and rectangular
symbols, respectively. Although both predictions are at
least 40% higher than experiments, the present model seems
to agree with the trend of the experiments better than the
microbuckling model without the shear. Predictions made in
Ref. [72] are also included in the figure as indicated by
pluses. They are obtained by using a point-strain criterion
so that the fiber strains in the 0° plies will not exceed
1.4% (2.4% in the i45° plies for the [i451„/903]S specimen)
at a distance around the hole. The distance r = 0.5 mm is
obtained to give a best fit for experimental results in Ref.
[72]. But, the trend of the prediction is equivalent to the
trend of the Rosen's model.
I It is interesting to note in Fig. 24 that present
predictions made for percent of 0° plies higher than 50%
indicate a drop in the load-carrying capacity of the plates,

56
whereas the microbuckling model without the shearing
y stresses predicts increased load carrying-capacity. No
experimental work that investigates the compression failure
of laminates with such a high percentage of O° plies have
been found in the literature. It is hoped that the present
investigation may motivate some activity in that direction.

Chapter IV
ANALYSIS AND DESIGN
As explained in Chapter 2, the failure criterion for
tension-loaded plates requires the evaluation of the stress '
intensity factor and the critical value of the stress °
intensity factor for a given plate. The failure criterion
developed in Chapter 3 for compression—loaded plates is, on
the other hand, based on the fiber stress in the principal
load—carrying lamina at a certain distance from the crack
tip. But, the stresses in the immediate surroundings of the
crack tip are obtained in terms of the value of the stress
intensity factor. Therefore, the stress intensity factor is
also needed for the implementation of the compression
failure criterion.l
Analyses of plates for the stress intensity factor are
performed with a finite element program which is driven by
an optimization algorithm. The interface between the
analysis and the optimization programs is fully automated.
Any change in the plate geometry at any stage of the design
process is transfered to the analysis program without need
of intervention by the user. A more detailed explanation of
the analysis and design techniques, and design capabilities
is given in the following sections.
57

58
4.1 STRESS INTENSITY CALCULATIONS
The SIF, which is a function of loading and plate
geometry, is evaluated by a finite element computer program
developed by Chu et al [33]. The program is suitable for a
two-dimensional elastostatic analysis of plane anisotropic
homogeneous sheets with a through—the-thickness crack. The
program employs two special crack-tip elements that account
for the singular stress field associated with two crack-tip
displacement modes. An 8-node element capable of
representing mode I (the opening mode) displacements, in
which the crack surfaces separate, is restricted to
symmetric problems. The other element has 10 nodes and is
also capable of representing mode II (the sliding mode)
displacements in which the crack surfaces slide over each
other in a direction perpendicular to the line of the crack
front. In the present application of the program, only
symmetric plates with a central crack under symmetric
loading are considered so that only one quarter of the plate
need be modeled. The program is capable of analyzing only
membrane action so that bending can not be included.
Therefore, only balanced symmetric laminates with symmetric
stiffeners subjected to in-plane loading are considered.
A typical stiffened plate geometry is shown in Fig.
25. The plate is composed of plies with various

59
orientations. The flanges and the stiffeners are obtained
by specifying additional thicknesses of material on top of
the basic panel material. An automatic mesh Vgenerator,
which is described in the next section, was developed to
permit better utilization of the analysis program during the
design process. A typical quarter—plate finite element mesh
for a stiffened panel is given in Fig. 26. The mesh
generator can model a crack which partially enters the
flanges, but not a crack which goes through the stiffener
blade. The stiffener is assumed to be perfectly bonded to
the panel, and a single layer of finite elements is used for
both the stiffener and the panel, by calculatingy the
combined material properties.
The boundary conditions applied at the loaded edge of
the finite element model simulate static test loading
conditions. In a typical loading apparatus, the load is
transmitted to the specimen through rigid components which
can be simulated by applied uniform displacements at the
boundary of the model. However, the magnitude of the
applied load can not be controlled with such a model. The
static test boundary conditions are achieved by employing a
two-stage process. First, unit displacements in the
direction of the load are applied along the boundary. The
SIF and the total reaction force at the boundary are

60
calculated. Next, the ratio between the actual desired load
and the total reaction force due to unit displacements is
calculated and the SIF and other plate response quantities
are multiplied by that ratio.
4.2 AUTOMATIC Mgäg GENERATION
A special mesh generation program is developed to
interface the analysis progrmn mentioned i11 the previous
section with the optimization package that drives the
design. The interface program serves two purposes. First,U
for a given initial plate geometry, the program discretizes
the plate into trianqular elements and a rectangular element
at the crack tip, and initializes the material properties
and thickness of elements. The second purpose of the
interface program is to modify the finite element mesh as
the design variables which control modeling parameters
change during the design process. The modifications that can
be made on the model of the plate include geometry of the
plate (stiffener width and spacing, and crack length to a
certain extent) as well as the thicknesses and material
properties of elements. The capability of modifying
geometry allows the use of shape parameters as design
variables. However, no attempt has been made in the present
work to use shape design variables.

61
For unstiffened plates, the parameters that define the
model are plate width (W), plate length (L), total crack
length (2a), and number of rows of elements desired along
both the half-width and the half-length of the plate away
from the crack. For example, the quarter—plate finite
element mesh shown in Fig. 27 has four rows of elements
along the half-width and twelve rows of elements along the
half-length. The number of rows of elements along the half-
length of the plate remains constant along the width of the
plate. The number of rows along the half-width doubles
twice at prescribed distances (built into the program) from
the loaded edge before reaching the crack, and conforms with
the crack tip finite element which has a three to one aspect
ratio, Fig. 27.
The thicknesses and material properties of all the
elements in a model are same for unstiffened plates. The
input parameters required to obtain the element thicknesses
and material properties are the number of plies, the
thickness and orientation of each ply that constitute the
layup, and the unidirectional material properties.
The mesh generation program permits modelling of a
stiffened plate with up to four stiffeners, see Fig. 26.
Stiffened plates discretizations are obtained using the
unstiffened plate discretization as a starting base. The

62
middle bay of the plate (the section of the plate between
the middle two stiffeners) is modelled exactly the same way
as an unstiffened plate. For example, the middle bay of the
mesh shown in Fig. 26 is obtained by using two rows of
elements along the half-width and sixteen rows of elements
along the half—length. Additional rows of elements are used
to model the rest of the plate. The number of additional
· rows of elements is related to the dimensions of the
remaining sections (stiffener blade width and flange width)
of the plate and the number of rows of elements in the
middle bay. A somewhat coarse mesh is used for the rest of
the plate to keep down the number of total elements in a
reasonable range. The parameters that are required, besides
the number of rows of elements in the middle bay, for the
complete definition of a stiffened plate are plate length
(L), stiffener spacing (e), stiffener blade width (b), and
stiffener flange width (d).
The thicknesses and material properties of the elements
in the stiffener blades and flanges are obtained by adding
plies on top of the plies that constitute the middle bay of _
the plate. All sections of the plate (stiffener blades,
stiffener flanges, and bays of the plate) are uniform along
the length of the plate.

63
The design variables that are used in the present work
are the thicknesses and orientations of plies in different
sections of the plates. Therefore, once the initial mesh is
generated, the portions of the mesh generation that relate
to the plate discretization are skipped during the design
and only element thicknesses and material definitions are
modified for successive design iterations.
4.3 PROBLEM FORMULATION ggg OPTIMIZATION METHOD
The design problem is formulated as a typical weight
minimization problem stated as
Minimize C Wg( X )
such that gSIF = 1 - [KI / KC] 2 O(22)
go 2 O
XL S X S XUwhere X is the vector of design ·variab1es, Wg(X) is thef
weight, C is a convenient normalizing constant,gSIF is the
stress intensity factor constraint, KI and KC are the SIFand its critical value respectively, and XL and XU are
vectors of lower and upper bounds, respectively, on the
design variables. The form of the stress intensity factor
constraint given in Eq. 22 is used for both tension-loaded
and compression—loadad plate designs. For tension—loaded
plates, the KI value is compared with the critical value of

64
the stress intensity factor which is called the fracture
toughness. For the compression case, the process of finding
the stresses for a given stress intensity factor is reversed
to find a value of the stress intensity factor that
corresponds to a maximum allowable fiber stress at a
predetermined distance. This value of the stressintensityfactor,
which is a function of both the layup and the
material properties, is used for the critical stress
intensity factor KC under compression. Beside the stress
intensity factor constraint, stress constraints, gc, based
on the Tsai-Hill failure criterion applied to each layer of
the laminate, are also used for some designs. Classical
lamination theory is used to calculate the ply stresses.
The design variables may include all the parameters defining
the geometry of the plate in Fig. 25 as well as thicknesses
and orientations of each ply of the laminate in each section
of the plate, (i.e., panel, stiffener flange, stiffener
blade). No constraints were used for the thickness design
variables to maintain integer number of plies in the final
designs.
General purpose mathematical optimization programs,
NEWSUMT [78] and its modified version NEWSUMT-A [79], are
used to obtain minimum weight plates. NEWSUMT employs the
Sequential Unconstrained Minimizations Technique with an
65
extended interior penalty function formulation [80] for
converting the constrained problem into a sequence of
unconstrained problems. This type of penalty function has[
the advantage, over exterior and interior penalty functions,
of being able to start with an infeasible design and stay in0
the feasible design space for subsequent designs. Newton's
method is used for solving the unconstrained minimizations.
The second derivatives of the penalty function are
approximated by using expressions involving only first
derivatives of the constraints. Additionally, NEWSUMT-A
employs constraint approximations and has a move limits
strategy. Computational time savings of up to 70%-80%,
depending on the number of design variables, were achieved
by using NEWSUMT-A instead of NEWSUMT with comparable
results.
An analytical approach is used to obtain the first
derivatives of the constraints with respect to the design
variables (often called design sensitivity derivatives).
The special nature of the boundary conditions used at the
loaded edge of the plate required a modification of the
standard adjoint method for sensitivity derivatives. The
details of the sensitivity derivative calculations are
discussed in the next section.

66
4.4 DESIGN SENSITIVITY DERIVATIVES
The adjoint variable technique (known also as the dummy
load technique, Ref. [81]) is widely used for calculating
sensitivity derivatives of stress and displacement
constraints in structural optimization applications. It is
more efficient than the direct method for obtaining these
derivatives when the number of design variables is larger
than the number of active displacement or stress
constraints.
The application of the method is straight-forward for
simple displacement or stress boundary conditions. For more
generalized boundary conditions, it requires specialized
treatment. Hsieh and Arora [82], for example, employ
Lagrange multipliers to extend the method to general
displacement boundary conditions. This section is concerned
with the application of the adjoint variable method under
the special combination of displacement and stress boundary
conditions which occurs when static test conditions are
simulated.
As it was discussed previously, the static test loading
boundary conditions are achieved by using a two-step
approach. First, a unit displacement vector I (in the
direction of the load) is applied to those nodes at the
loaded end of the finite element model. Algebraically, the

67
calculation of the internal stresses and displacements, as
well as the forces at those displaced nodes, can be shown by
using the partitioned form of the equilibrium equation for a
structure discretized by a finite element
IKaa IKad UI O
--.-I--—— --:——KT
K 1 Rad‘dd 1
where Kaa, Kad and. Kdd are submatrices of the stiffnessmatrix, UI is the unknown displacement vector per unit
applied boundary displacements, RI is the reaction force
vector under the unit applied displacement and O is a null
vector.
Once the system in Eq. (23) is solved, the total load
applied to the specimen, when the displacement vector I is
specified, can be obtained by
_ TPI — I RI (24)
If the required applied load is P, then the displacement
vector U under the actual required loading is
U = s UI (25)
where
s =—ä—PI (26)

68
Now, assume that the derivative of some function g of
the displacement field (e.g., a stress component) with _
respect to a design parameter x is required. The function
can also depend explicitly on the design parameter so that g
= g(x,U). The derivative of g with respect to x may be
written as
dg _ £g_ T dUdx-- ax + Z dx (27)
where Z denotes a vector with zi = gg-. Using Eq.i
(25), we obtain
dU21:11 T ds ..1dx 8x + Z (dx-UI + S dx ] (28)
dUIFor EE- differentiate Eq. (23) with respect to x to
obtain
IUaadx dx dx IT
(30)dx dx I ad dx dx
Finally, to obtain gg differentiate Eqs. (24) and (26):
dRds _ dP _ _jL T IPI I dx (31)
The direct method for obtaining gg- starts by
dUI dRIsolving Eq. (29) for EE-, then obtaining
EE-from Eq. (30) and ää-from Eq. (31), and finally using
Eq. (28). The direct method has a disadvantage that the
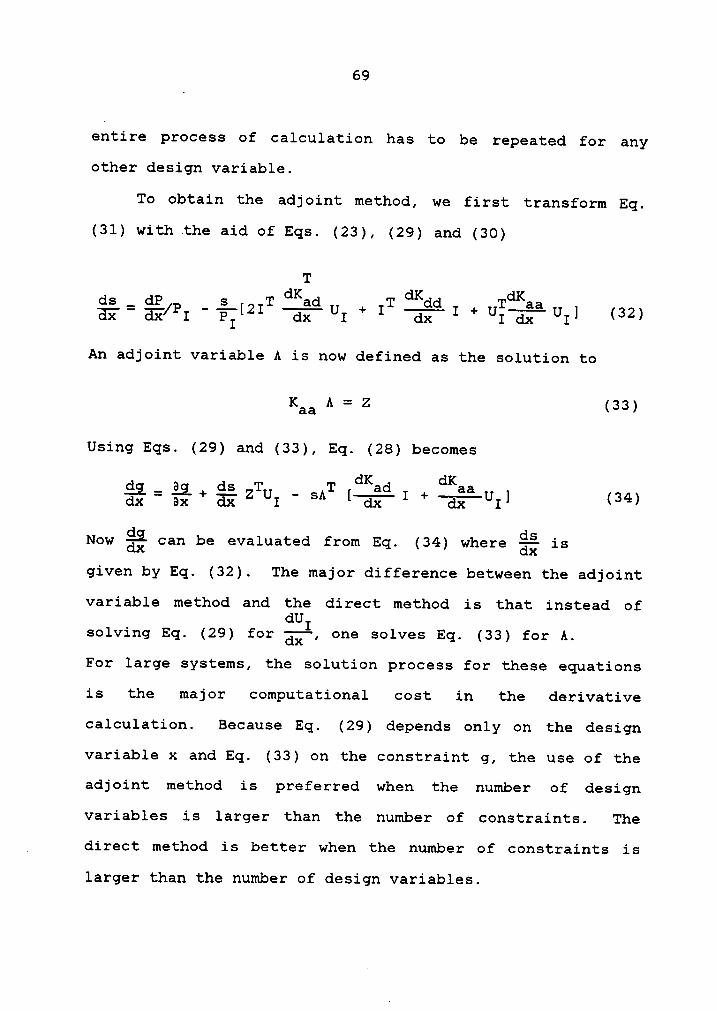
69
entire process of calculation has to be repeated for any
other design variable.
To obtain the adjoint method, we first transform Eq.
(31) with the aid of Eqs. (23), (29) and (30)
TdK dK dKds _ dP __§_ T ad T dd T aa§‘$E/P1 1¤I(2I dx U1+I dx I+U1dx U1) (32)
An adjoint variable A is now defined as the solution to
Kaa A = Z (33)
Using Eqs. (29) and (33), Eq. (28) becomes
dK dKT - T ._¤d __¤¤dx ax + dx Z UI SA [
dx I + dx UI] (34)
gg ds .Now can be evaluated from Eq. (34) where —— isdx dxgiven by Eq. (32). The major difference between the adjoint
variable method and the direct method is that instead ofdU
solving Eq. (29) for ägl, one solves Eq. (33) for A.
For large systems, the solution process for these equations
is the major computational cost in the derivative
calculation. Because Eq. (29) depends only on the design
variable x and Eq. (33) on the constraint g, the use of the
adjoint method is preferred when the number of design
variables is larger than the number of constraints. The
direct method is better when the number of constraints is
larger than the number of design variables.

70
All the design cases considered in the present work
involved more design variables than the number of
constraints. Therefore, utilization of the adjoint variable
technique is favored. For the implementation of the
technique, note that the vector Z is sparsely populated
because the only displacements that affect the SIE are the
ones associated with the nodes of the crack-tip element.
Those nonzero terms of the vector Z are calculated by
analyzing an isolated crack-tip element, and applying a unit
displacement to a single node while restraining the other
nodes. The derivatives of the submatrices of the global
stiffness matrix are calculated by finite differences.
The analytical sensitivity derivative formulation
resulted in computational time savings of 40-60 Z over
- finite difference calculations for problems with 3-6 design
variables.

Chapter V
DESIGN STUDIES
The automated design procedure described in the
previous Chapter is used in conjunction with the failure
criteria, described in Chapters 2 and 3, for designing
plates with cracks that simulate structural damage. The
unified strain criterion [32] of Chapter 2 is used to ensure‘
that furthex· propagation of a crack; with fiber failures
ahead of the crack tip is prevented under tensile loadings.
For compressively loaded cracked plates, the failure model
developed i11 Chapter 3 is used. The compression failure
mechanism which is covered by the model is fiber kinking
that involves microbuckling of stiff fibers in a relatively
soft matrix followed by fiber breaking. This kind of
failure is observed experimentally for plates with holes and
cracks under static and cyclic loadings.
Design studies for plates loaded in tension and
compression are presented in the next two sections. The
design studies have a dual purpose. First, they demonstrate
the methodology which is described in the present work.
Second, they provide insight into the effect of using damage
tolerance constraints in the design process. No attempt has
been made within the content of this work to combine the
71

72
damage tolerance constraints for tension- and compression—
loaded plates to achieve designs that are capable of
handling load reversals. In each section, design studies
are presented first for plates with uniform thicknesses.
Next, plate designs with regions of additional thickness of
materiali are presented. Those regions with additional
thickness of material have a constant cross section along
the length of the plate and are placed symmetrically with
respect to the central crack, see Fig. 25. Main purpose of
the thick regions is considered to be containing the crack
in a controlled region and maybe providing some bending
stiffness to the plates. They are referred as stiffeners in
subsequent sections of this Chapter.
5.1 PLATES LOADED IN TENSION
5.1.1 Uniform Thickness Plates
Uniform thickness, 76.2 mm wide plates having length to
width ratio, L/W , of 3 were designed. Three design
variables which are the thicknesses of the O°, 90°, and i45°
plies were used. For all the combinations of crack length,
2a, and load level, the optimization algorithm eliminated
the 90° and i45° plies leaving the plate with only O° plies
when the damage tolerance was the only constraint.

73
Considerations like transverse strength requirements
and biaxial load conditions usually require significant
thicknesses of 90° and i45° plies. Also, crack-like slits
in O° unidirectional plates and plates with large amount of
0° plies fail due to matrix damage [20,31]. That is, high
shear strain at the ends of the slit causes matrix cracks
parallel to the fibers. The failure criterion used in this
work assumes breakage of the fibers ahead of the crack—tip
collinear with the crack, and therefore is not adequate for
designing predominantly 0° ply plates.
To obtain more practical designs, the thickness of 0°
plies was limited to certain percentage of the total
thickness. With this constraint, the optimizer eliminated
the 90° plies. Besides the designs obtained by the
optimization procedure, plates with fixed ratios of 90° and
i45° plies were analyzed. The thicknesses of plates with
such constraints are shown in Figs. 28 and 29 as a function
of the percentage of O° plies in the laminate for crack
aspect ratios, 2a/W, of 0.2 and. 0.6, respectively. The
different curves represent different proportions of the 90°
and i45° plies. The designs in Figs. 28 and 29 were
obtained for a load level of P = 122 kN, but the thicknesses
may be linearly scaled for any load level. Experimental
results (scaled to a load level of 122 kN) for plates with

74
similar proportions of 0°, i45°, and 90° plies from Ref.
[16] are included in Fig. 28 for comparison.
The thickness penalty associated with the reduction of
percentage of 0° plies in the laminate is a strong function
of the orientation of the plies that are used to replace 0°
plies. For example, the reduction of 0° plies from 95% to
60% (see Fig. 28) causes a 60% increase in thickness for
0°/90° laminates but only an increase of about 10% for the
0°/t45° laminates. A comparison of 0°/i45° designs in Figs.
28 and 29 shows that, for larger cracks, the thickness
increases faster as the amount of 0° plies is reduced. For
the 0°/90° designs, the increase in thickness, compared to
the optimum design, due to the reduction in 0° plies, though
large, is not sensitive to the crack aspect ratio.
As an example of a requirement which may call for 90°
or t45° plies, a shear load of magnitude of 20% of the axial
load was assumed to act on the plate. It was assumed that
the structure has to carry the combined load when it is
undamaged. The Tsai-Hill failure criterion was used for the
stress constraints with stress allowables typical of
graphite/epoxy. The resulting design, indicated by a filled
triangle in Figs. 28 and 29, favours a laminate with a 0°
and t45° ply combination similar to that of an [06/$45]
layup for the crack aspect ratio of 0.2. For a crack aspect

75
ratio of 0.4 we have a combination similar to that of an
[O1,/:45] layup. Further increases in the crack length makel
the stress intensity factor highly critical and pushes the
designs to have more and more O° plies.
The dependence of the thickness of designs on the crack
aspect ratio is given in Fig. 30 for a plate with a
combination of 0°, i45°, and 90P plies similar to that of an
[02/$45/02/90/0]S layup. Experimental results [16] for
uncracked plates and plates with different crack lengths are
also indicated in the figure by open squares.
5.1.2V Stiffened Plates
Stiffeners perfectly bonded to the plate symmetrically
with respect to the crack, and composed of a flange and a
blade section were used (see Fig. 25). Both the flange and
the blade were considered to have 0°, i45°, and 90° plies.
Although cracks entering the flanges can be used to model a
partly damaged stiffener, results presented in this section
include only a mid—bay panel crack running from one
stiffener flange to the adjacent flange. When the fracture
constraint is the only constraint, the thicknesses of plies
in the panel section. were reduced to their minimum gage
values, so that the load was carried mostly by stiffeners.

76
Having a very thin panel section is undesirable because
V of two reasons. First, stiffened plates used in aircraft
structures are often subject to load reversal and must be
designed to resist some compressive loads. Stiffened plates
with thin panel sections might fail prematurely due to local
buckling. Second, plates designed to carry the applied l—
loads mostly by the stiffeners can fail catastrophically due
to stiffener damage. To prevent thin panel sections, stress
constraints with additional shear loading or increased lower
bounds on the design variables were used (constraining the
amount of material in the panel section to be a certain
fraction of the total material of the plate was also another
possibility).
With these additional constraints, the panel sections
had more i45° plies than O° plies, and no 90° plies. Also,
the blade part of the stiffeners was eliminated and. the
flange was left with O° plies only. The preference for more
t45° plies than O° plies in the panel section may be
explained by the displacement patterns of loaded plates.
For panel sections with predominantly O° plies, additional
crack opening is observed due to a Poisson's effect.
Because of the low stiffness of the panel section in the
lateral direction, the stiffeners are pulled in at the
section along the crack line resulting in a reduced

77
restraining effect of the stiffeners on the crack opening.
The i45° plies provide the necessary lateral stiffness and
(unlike 90° plies) contribute also to the longitudinal
stiffness of the panel.
Plate designs with two edge (stiffeners without the
blade are given in Fig. 31 for a varying stiffener width.
The total width of the plates was kept constant at 76.2 mm.
as the stiffener width was varied. The cracked plate was
designed to carry an axial load of P = 122 kN. As done for
some of the unstiffened plate designs, a shear load of
magnitude 20% of the axial load was applied, and the panel
was required to carry the combined loading when undamaged.
Laminates with only O° and i45° layers were used for the
panel section, and the stiffeners were made up of only 0°
plies. Three design variables, which are the thicknesses of2
afore mentioned plies, were used. The resulting* designs
indicated a minimal effect of stiffener width on the weight
(proportional to total area) of the plate, with a slight
decrease in area for increasing stiffener width.
Similar results are also obtained for plates with four
stiffeners, two on each side of the crack compared to one in
the previous case, designed under similar loading conditions
and with a same set of design variables. But when the 0°
plies are removed from the panel section and the orientation

78
of the angle plies, :9 from the x axis, used as a design
variable, a somewhat stronger effect of the stiffener width
on the weight of the plate is observed. Results for such
plate designs are shown in Fig. 32 for axial load of 600 kN
and no shear loading. Also, no stress constraints are used,
but the thickness of angle plies (referred as :9 plies from
now on) is set to a constant value of 1.12 mm to prevent the
panel section from being eliminated by the optimizer. As
was the case in the previous set of results shown in Fig.
31, the crack is assumed to run from one stiffener to the
other, but only in the middle panel section of the plate.
For some values of the total strip width to plate width
ratios, i.e. Z strip width, two designs are presented in the
figure. They are obtained by using two different finite
element meshes for the same plate geometry (the ones with a
larger cross sectional area are obtained by using a refined
mesh). The dashed line shows the decreasing trend of the
weight as the stiffener width is increased. For all the
designs, the value of optimum angular orientation of the
panel section are obtained to be between 45° and 50° without
any obvious trend.
The effect of changing the angular orientation of the
:9 plies of the panel section on the weight of the plate is
shown in Fig. 33 for a plate with stiffener width of 22.5

79
mm, and spacing of 77.5 mm (which gives a total stiffener
width to plate width ratio of about 0.35). The three
different symbols are for three different ·values of the
total plate width to plate length ratios. Minimum plate
weights are achieved for panel angles of 45°-55° regardless
of the plate aspect ratio, W/L. For panel angular
orientations greater than 40%, the weight of the plate seem
to be insensitive to the plate aspect ratio, and is almost
constant. Using angles smaller than 40° introduces large
weight penalties which are higher for long plates than short4plates.
For the design examples of Fig. 33, only i8° plies with
a total thickness of l.l2 mm are used in the panel section
of the plate. The trend of the weight changes significantly
if a portion of those i6° plies is replaced by O° plies.
Designs shown in Fig. 34 are obtained by replacing 25% of
the i6° plies in the panel used in the previous figure by 0°
plies. Minimum plate weights are achieved for an
orientation range of about so°-so° for the angle-ply
laminates. But, the minimum weight for this combination of
O° and i6° plies in the panel section is 30% heavier than
the all i9° panel section with same total thickness.
Moreover, for panel angles greater than 50°, there is a‘
large increase in the plate weight as opposed to previous
examples where the weight remained almost constant.
80
If, for some reason, it is important to keep a certain
amount of 0° plies in the panel section regardless of the
additional thickness of the i6° plies, depending on the
amount of 0° plies that we want to preserve in the panel,
additional thickness of angle plies may or may not improve
the total weight. The three horizontal lines in Fig. 35
indicate three designs with only 0° plies in the panel
section for a plate with the same planar geometry as the
ones used in Figs. 33 and 34. From the lower to upper lines
they have 0.28, 0.56, and 1.12 mm of 0° plies in the panel
section. Designs obtained by allowing additional thickness
of iB° plies in the panel section are indicated by open
symbols. When angle-ply laminates with less than l5° or
greater than 60° plies are included in the design, they are
eliminated by the program, leaving the panel section with
only 0° plies. Adding 0.51 mm of i36° plies to the 0.28 mm
panel improved the weight 15% by decreasing the stiffener
thickness from 11.02 mm to 7.82 mm. But, for the 1.12 mm
thick 0° panel, adding 0.42 mm of t38° plies reduced the
weight only 3%.
As mentioned previously, buckling may also be a
consideration in the design of aircraft plates. Buckling
resistant plates do require stiffeners with deep blades.
Such designs can be achieved by imposing a blade with

81
uspecified waidth and thickness and redesigning the plates
with this new geometry. A blade width of 5 mm composed of
only O° plies was used for this purpose. A plate with four .
stiffeners was utilized. The stiffener flange widths were
30 mm, and they were spaced 75 mm apart from each other.
The plate was designed to carry an axial load of 600 kN. A
minimum gage thickness of 0.28 mm was used for all plies.
The minimum weight design without the blades had a total
cross sectional area of 892 mmz. The weight penalty due to
the blades for various blade heights is shown in Fig. 36
The cross sections of the half plate without the blades and
the cross sections of the stiffeners for some blade
stiffened designs are also shown in the figure. Significant
blade heights are possible with less than a 15% weight
penalty. This provides considerable flexibility for the
designer.
5.2 PLATES LOADED LN COMPRESSION
5.2.1 Uniform Thickness Plates
Plates 127 mm wide and with a length to width ratio,
L/W, of 2 were designed using the compression failure
criterion developed in Chapter 3. Three design variables
which are the thicknesses of the O°, 90°, and i45° plies
were used to find the minimunu weight design for· a given

82
crack length and load level. For all the combinations of
crack length and load level considered, the optimization
algorithm eliminated the 90° plies. In contrast to the
tension case however, minimum weight designs consisted of
combination of a 0° and i45° plies. For a plate with a
crack aspect ratio of 2a/W = 0.1 under 500 kN of
compression, for example, 51% of the total thickness
(ttOt= 9.52 mm) was 0° plies. Changing the crack aspect
ratio altered the optimum ratio of O° to i45° plies only
slightly. As the crack aspect ratio increased, the
percentage of' 0° plies decreased steadily. For a crack
aspect ratio of 0.8, the percentage of 0° plies was 45% ofA
the total thickness.
When plates were designed with only 0° and 90° plies, a
higher value for the optimum percentage of 0° plies,
compared to the percentage of 0° plies for 0°/i45°
combination, was obtained. For a crack aspect ratio of 0.1,
78% of the total thickness (ttOt= 9.91 mm) was 0° plies.
„ The optimum ratio of 0° to 90° plies was again insensitive
to crack aspect ratio.
The total thicknesses of designs with 0°/i45° and
0°/90° ply combinations are given in Fig. 37 as the crack
aspect ratio changes. As in the case of plates under
tension, there is a significant increase in the total

83
thickness of the plates with increasing crack aspect ratio.
However, the increase is not as steep as in the tension
case. For example, increasing the crack aspect ratio from
0.2 to 0.6 increased the thickness by 90% for compression
plates with 0°/i45° plies, see Fig. 37, whereas for similar l
plates under tension (with the same percentage of 0° and
i45° plies) the increase was 120%.
In order to understand the effect of using combinations —
of non—optimum ply thicknesses on the weight, plates with
various fixed proportions of 0°, i45°, and 90° plies are
presented in Figs. 38 and 39 for crack aspect ratios of 0.2
and 0.4. The designs in Figs. 38 and 39 were obtained for a
load level of P = 500 kN, but the thickness may be linearly
scaled for any load level. Three curves in each of the
Figs. 38 and 39 are, from top to bottom, for 0°/90°,
0°/i45°/90° with t(i45°)=2*t(90°), and 0°/i45° ply
combinations. The optimum design for each of the three
groups is indicated by a solid circular mark on appropriate
symbol in the figures. No stress constraints were used for
the designs in Figs. 38 and 39. However, the optimum design
for each of the three ply combinations was checked and did
not prove to be stress critical.
The optimum plate design with the 0°/i45°/90° ply
combination was 25% thicker than the optimum plate design

84
with the 0°/i45° ply combination for both crack aspect
ratios. Eliminating the i45° plies increased the thickness
penalty significantly. The optimum design for the o°/9o°
plate was 85% thicker for both crack aspect ratios than the
0°/i45° plate, Figs. 38 and 39. Increasing or decreasing
the percentage of 0° plies from their optimum value also
caused significant thickness penalties. For example,
decreasing the percent of the 0° plies in the O°/90°
laminate from 79% (optimum value) to 20% increased the total
thickness by 70%. The thickness of the plate with 100% 0°
plies was twice the thickness of the optimum 0°/r45° plate
design. Note that for the plate designs with the tension
fracture constraint, 100% 0° p1y‘ designs were always the
optimum designs, see Figs. 28 and 29. Also comparison of
Figs. 38 and. 39 indicated that, in contrast to tension-
loaded plates, changing the crack aspect ratio did not
affect the thickness penalty associated with non-optimum ply
thickness combinations.
When the effect of shearing forces ahead of the crack
tip was excluded, the design trends changed. completely.
Designs obtained by rising three different approaches for
plates with only 0°/i45° ply combinations are given in Fig.
40 for comparison. The curve indicatad by asterisks is
taken from Fig. 38 and was obtained. by using the model
85
developed in this work. The other two curves do not include
the effect of shearing force. The one indicated by square
symbols was obtained using Rosen's microbuckling model at a
point r = 0.05 mm away from the crack tip. The other curve,
indicated by triangular symbols, was obtained by using the
point—strain criterion with a 1.4% ultimate strain of the
fibers at a distance r = 2.0 mm from the crack tip. The
distance r for this latter model was obtained as a best fit
to experimental results for quasi-isotropic plates. The
plate designs obtained by using the models that do not
include the effect of the shearing force indicated a
behavior similar to the plates designed for tensile loads.
The optimum design is the one with 100% 0° plies and is 70%
thinner compared to the design obtained by the present
model. This result seems implausible because it is
experimentally observed [83] that plates with all 0° plies
do not have a good compressive behavior. Even if the actual
failure mode observed for all O° plates may be different
than the shear crippling failure mode assumed in the present
model, the present. model can successfully eliminate such
unrealistic designs.

86
5.2.2 Stiffened Plates
Plates having the same external size as the unstiffened
plate designs presented in the previous section are
considered. Four 12.7 mm wide stiffeners placed
symmetrically with respect to the central crack (two on each
side) were included. The crack runs from one stiffener to
the adjacent stiffener in the mid-bay panel which produces a
crack length to total plate with ratio of 0.2. Six design
variables which are the thicknesses of O°, i45°, and 90°
plies in the panel section, and additional thicknesses of
similar plies in the stiffeners were used. When the crack
tip fiber kinking constraint is the only constraint, the
plies in the panel section were eliminated, and the
resulting plate had stiffeners with only 0° plies. When the
Tsai—Hill stress constraints were used, a 0.21 mm thick
panel section was obtained with mostly O° plies. Stiffeners
were all 0° plies, and the ratio of the thickness of the
stiffeners to the total thickness (stiffener thickness plus
the panel thickness) was 98%. This design had a total
cross—sectional area (560 mmz) less than half of the
unstiffened optimum plate with 0°/i45° plies (l200mm2) with
the same crack aspect ratio.
Having a very thin panel section is undesirable because
stiffened plates with thin panel sections might fail

87
prematurely due to local buckling of the panels. One easy
way to obtain thicker panel sections is to constrain the1amounts of material in the panel and the stiffener
sections. Designs obtained by using an upper bound on the
stiffener thickness that may be allowed are given in Fig.
41. Fig. 41 shows the ratio of the total cross—sectional
area of the stiffened plate to the cross-sectional area of
the unstiffened plate with same dimensions and crack length
versus the ratio of the stiffener thickness to the total
plate thickness. Using an upper bound of 8 mm on the
stiffener thickness, the optimum design is obtained to have
a panel tickness of 2.27 mm (of which 1.19 mm was 0° plies
and 1.08 mm was i45° plies) which gives a stiffener
thickness to total thickness ratio of 0.78. The stiffened
design was some 43% lighter than the unstiffened plate and
was checked to be free of panel buckling. The rightmost
design point in Fig. 41 is the one obtained in the previous
paragraph by using stress constraints and proved to have a
buckling critical panel section.
Plate designs with four stiffeners without blades are
given in Fig. 42 for a varying stiffener width. The total
width of the plates was kept constant, 255 mm., as the
stiffener width was varied. The plate was designed to carry
an axial load of' P = soo kN. As done for some tension

88
design cases, a shear load of magnitude 20% of the axial
load was applied, and the panel was assumed to carry the
combined loading when undamaged. Laminates with only 0° and
i45° layers were used for the panel section, and the
stiffeners were made up of only O° plies. As in the case of
stiffened plate designs under tension in Fig. 31, the
resulting designs indicated a minimal effect of stiffener
width on the weight of the plate, with a slight decrease in
area for increasing stiffener width.
Designs with deep blades are achieved, as done before
for tension case, by imposing a blade with specified width
and height and redesigning the plate with this new
geometry. A blade width of 5 mm composed of only 0° plies
was used for this purpose. A plate design with flange
widths of 30 mm and spaced 75 mm apart from each other is
used from the previous figure. The plate was designed to
carry an axial load of 500 kN. A minimum gage thickness of
0.28 mm was used for all plies. The minimum weight design
without the blades had a total cross sectional area of 881
mmz. The weight penalty due to the blades for various blade
thicknesses is shown in Fig. 43. The cross sections of the
half plate without the blades and the cross sections of the
stiffeners for some blade stiffened designs are also shown
in the figure. It is observed that the weight penalty duel

89
to blade height is small, even smaller than the penalty in
the tension case.

Chapter VI
CONCLUDING REMARKS
An optimization procedure for designing stiffened
composite plates subject to a local damage constraint under
tensile and compressive loadings has been developed. A
centrally located, through—the-thickness crack was used to
simulate the damage condition. For tension—loaded plates,
failure was characterized by the propagation of the crack
with tensile fiber failures.
Results of an experimental study conducted to evaluate
the effect of slots (simulated cracks) on the buckling
response, the postbuckling response, and the failure
characteristics of flat rectangular graphite/epoxy plates
loaded in compression were presented. Centrally located
slots did not affect the failure loads or failure modes of
the buckling-critical plates. Therefore, attention was
focused on the failure of cracked strength-critical plates.
A fiber kinking mechanism is assumed to be responsible for
the failure of such plates. An analytical failure model for
the kinking mechanism was developed. The model was based on
microbuckling followed by breaking of the fibers under
combined compressive and shear stresses.
A 90

91
A finite element program based on linear elastic
fracture mechanics for calculating the stress intensity
factor(SIF) at the crack tip was incorporated in the design
cycle. Only symmetric balanced laminated plates under
symmetric loading were considered. Values of the critical
stress intensity factor, which was used as a measure of the
fracture toughness, under tensile loadings were calculated
by using a unified strain criterion due to Poe. Values of
the critical stress intensity factor for compressive plates
were based on the model developed.
Weight minimizations were performed by general purpose
mathematical optimization programs, NEWSUMT and NEWSUMT-A,
based on the extended interior penalty function approach.
An automatic mesh generator was used to generate finite
element models of the plates during the design process. The
computational efficiency of the optimization procedure was
improved by utilizing analytical sensitivity derivatives.
The adjoint variable technique, modified to handle the
static test loading boundary conditions, was used for that
purpose.
Unstiffened plate designs loaded in tension tended to
have only O° plies in the laminate regardless of the crack
V length. More realistic designs were obtained by imposing
restrictions on the relative amounts of various ply

92
orientations or using stress constraints. Stiffened plate
designs tended to eliminate the panel section. Using stress
constraints or minimum thickness constraints for the panel
section resulted in designs with mostly i45° plies in the
panel section and only O° plies in the stiffener flange
eliminating the blades of the stiffeners. But addition of
significant blade thicknesses was possible without a
considerable weight penalty. —
Unstiffened plate designs loaded in compression
eliminated only the 90° plies in the laminate. But, there
was an optimum thickness of O° plies and t45° plies. When
90° plies were forced into the design, a higher value of the
optimum O° ply thickness with respect to the total thickness
was obtained together with increased· plate weight. The
optimum thickness of the O° plies was seem to be insensitive
to crack aspect ratio.

REFERENCES
1. Davis, G. W., and Sakata, I. F., "DesignConsiderations For Composite Fuselage Structure ofCommercial Transport Aircraft," NASA CR-159296, March,1981.
2. Dickson, J. N., and Biggers, S. B., "Design andAnalysis of a Stiffened Composite Fuselage Panel,"NASA CR-159302, August, 1980.
3. Rhodes, M. D., Williams, J. G., and Starnes, J. H.,Jr., "Low Velocity Impact Damage in Graphite FiberReinforced Epoxy Laminates," Proceedings of the 34thAnnual Conference of Reinforced Plastics/CompositesInstitute, The Society of the Plastics Industry, Inc.,New Orleans, Louisiana, January 29 - February 2, 1975.
4. Sharma, A. V., "Low-Velocity Impact Tests on FibrousComposite Sandwich Structures." Test Methods andDesign Allowables for Fibrous Composites, ASTM STP734, C. C. Chamis, Ed., American Society for Testingand Materials, 1981, pp. 54-70.
5. Arora, J. S., Haskell, D. F., and Govil, A. K.,"Optimal Design of Large Structures for DamageTolerance," AIAA Journal, Vol. 18, May 1980, pp.563-570.
6. Starnes, J. H. Jr., and Haftka, R. T., "Preliminary_ Design of Composite Wing-Box Structures for Global
Damage Tolerance," AIAA Paper 80-0755, presented atthe AIAA/ASME/ASCE/AHS 21st Structures, StructuralDynamics and Materials Conference, Seattle,Washington, May 1980.
7. Haftka, R. T., Starnes, J. H. Jr., and Nair, S.,"Design for Global Damage Tolerance and AssociatedMass Penalties," Journal gf Aircraft, Vol. 20, No. 1,January 1983, pp. 83-88.
8. Combes, R. C., Jr., "Design for Damage Tolerance,"Journal gf Aircraft, Vol. 7, No. 1, January-February1970, PP- 18-20.
9. Toor, P.M., "A Review of Some Damage Tolerance DesignApproaches for Aircraft Structures," EngineeringFracture Mechanics, Vol. 5, 1973, pp. 837-880.
93

94
10. Poe, C.C., Jr., "Stress—Intensity Factor for a CrackedSheet With Riveted and Uniformly Spaced Stringers,"NASA TR R-358, May 1971.
11. Kruse, G. S., "An Automated Procedure for PreliminaryDesign of Primary Structure for Transport Aircraft,"ASME 76-WA/Aero-9, American Society of MechanicalEngineers, 1976.
12. Davis, C. S., "Automated Design of Stiffened PanelsAgainst Crack Growth and Fracture Among Other DesignConstraints," Flaw Growth and Fracture, ASTM STP 631,American Society for Testing and Materials, 1977, pp.416-445.
13. Dobbs, M. W., and Nelson, R. B., "Minimum WeightDesign of Stiffened Panels with Fracture Constraints,"Computers Q Structures, Vol. 8, No. 6, 1978, pp.753-759.
14. Rhodes, M. D., "Damage Tolerance Research on CompositeCompression Panels." Selected NASA Research ipComposite Materials and Structures, NASA ConferencePublication 2142, August 11-13, 1980, pp. 107-142.
15. Poe, C. C. Jr., and Kennedy, J. M., "Assessment ofBuffer Strips for Improving Damage Tolerance ofComposite Laminates." Journal pg Composite MaterialsSupplement, Vol. 12, 1980, pp. 57-70.
16. Chu, C. S., and Freyre, O. L., "Failure StressCorrelation of Composite Laminates Containing aCrack," Journal pf Aircraft, Vol. 19, No. 2, 1980.
17. Olster, E. F., and Roy, P. A., "Tolerance of AdvancedComposites to Ballistic Damage," Composite Materials:Testing and Design, ASTM STP 546, American Society forTesting and Materials, 1974, pp. 583-603.
18. Dorey, G., Sidey, G. R., and Hutchings, J., "ImpactProperties of Carbon Fibre/Kevlar 49 Fibre HybridComposites," Composites, January 1978, pp. 25-32.
19. Avery, J. G., Bradley, S. J., and King, K. M.,"Fracture Control in Ballistic-Damaged Graphite/Epoxy ·Wing Structure," Fracture Mechanics: ThirteenthConference, ASTM STP 743, Richard Roberts, Ed.,American Society for Testing and Materials, 1981, pp.338-359.

95
20. Dorey, G., "Fracture of Composites and DamageTolerance," Practical Considerations gg Design,· Fabrication ggg Tests Egg Composite Materials: AGARD-
* LS-124, September 1982, paper 6.
21. Wu, E. M., "Application of Fracture Mechanics toAnisotropic Plates," Journal gg Applied Mechanics,December 1967, pp. 967-974.
22. Waddoups, M. E., Eisenmann, J. R., and Kaminski, B.E., "Macroscopic Fracture Mechanics of AdvancedComposite Materials," Journal gg Composite Materials,Vol. 5, October 1971, pp. 446-454.
23. Whitney, J. M., and Nuismer, R. J., "Stress FractureCriteria for Laminated. Composites Containing StressConcentrations," Journal gg Composite Materials, Vol.8, July 1974, pp. 253-265.
24. Zweben, C., "Fracture Mechanics and CompositeMaterials: A Critical Analysis," Analysis gg ggg TestMethods ggg High Modulus Fibers ggg Composites, ASTMSTP 521, American Society for Testing and Materials,1973, pp. 65-97.
25. Rosen, B. W., Kulkarni, S. V., and McLaughlin, P. V.,Jr., "Failure and Fatigue Mechanisms in CompositeMaterials," Inelastic Behavior gg Composite Materials,AMD Vol. 13, American Society of Mechanical Engineers,1975, pp. 17-72.
26. Hedgepeth, J. M«, and Van Dyke, P., "Local StressConcentrations in Imperfect Filamentary Composite
g Materials," Journal gg Composite Materials, Vol. 1,No. 3, 1967, pp. 294-309.
27. Tsai, S. W., and Hahn, H. T., "Recent Developments inFracture of Filamentary Composites," Proceedings of anInternational Conference on: Prospects of FractureMechanics, Eds. Sih, G. C., van Elst, H. C., andBroek, D., June 1974, pp. 493-508..
28. Kanninen, M. F., Rybicki, E. F., and Brinson, H. F.,"A Critical Look at Current Applications of FractureMechanics to the Failure of Fibre-ReinforcedComposites," Composites, January 1977, pp. 17-22.

96
29. Yeow, Y. T., Morris, D. H., and Brinson, H. F., "ACorrelative Study Between Analysis and Experiment onthe Fracture Behavior of Graphite/Epoxy Composites,"Journal pg: Testing ggg Evaluation, Vol. 7, No. 2,1979, pp. 117-125.
30. Tirosh, J., Mast, P., Beaubien, L., Mulville, D.,Sutton, S., and Wolock, I., "Fracture Criteria ofFibrous Laminated Composites Under In—PlaneMultidirectional Loading," Journal pg AppliedMechanics, Vol. 47, September 1980, pp. 563-569. .
„ 31. Poe, C. C., Jr., and Sova, J. A., "Fracture Toughnessof Boron/Aluminum Laminates with Various Proportions¤£ o° and i45° Plies," NASA TP-1707, 1980.
32. Poe, C. C., Jr., "A Unifying' Strain Criterion forFracture of Fibrous Composite Laminates," EngineeringFracture Mechanics, Vol. 17, No. 2, 1983, pp. 153-171.
33. Chu, C. S., et al, "Finite Element Computer Program toAnalyze Cracked Orthotropic Sheets," NASA CR-2698,July, 1976.
34. Knauss, J. F., Starnes, J. H., Jr., and Henneke, E.G., II, "The Compressive Failure of Graphite/EpoxyPlates with Circular Holes," VPI-E-78-5, InterimReport Number ll, NASA-VPI&SU Composites Program NASAGrant NGR 47-004-129, February 1978.
35. Starnes, J. H., Jr., Rhodes, M. D. and Williams, J.G., "Effect of Impact Damage and Holes on theCompressive Strength. of a Graphite/Epoxy Laminate,"ggg Destructive Evaluation ggg Flaw Criticality jpgComposite Materials, ASTM STP 696, R. B. Pipes, Ed.,Amer. Society of Testing and Materials. 1979, pp.145-171.
36. Starnes, J. H., Jr., and Williams, J. G., "FailureCharacteristics of Graphite-Epoxy StructuralComponents Loaded in Compression," In Mechanics pgComposite Materials, Recent Advances, Proceedings ofthe lst IUTAM Symposium on Mechanics of CompositeMaterials, Held at Blacksburg, VA, August 16-19, 1982,Z. Hashin and C. T. Herakovich , Eds., Pergamon Press
_ Inc., 1983, pp. 283-306.
37. Chan, D. P., "An Analytical Study of the Postbucklingof Laminated, Anisotropic Plates," Ph.D. Thesis, CaseWestern Reserve University, 1971.

97
38. Turvey, G. J., and Wittrick, W. H., "The LargeDeflection and Postbuckling Behaviour of SomeLaminated. Plates," Aeronautical Quarterly, Vol. 24,1973, pp. 77-84. _
39. Harris, G. Z., "Buckling and Post-Buckling ofOrthotropic Laminated Plates," AIAA Paper No. 75-813,1975. _
40. Harris, G. Z., "The ‘Buckling and Post-BucklingBehavior of Composite Plates Under Biaxial Loading,"International Journal pf Mechanical Sciences, Vol. 17,1975, pp. 187-202.
41. Banks, W. M., "The Post Buckling Behaviour ofComposite Panels," Proceedings pf php 1975International Conference Q2 Composite Materials, ICCMVol. 2, 1976, pp. 272-293.
42. Stein, M., "Postbuckling of Orthotropic CompositePlates Loaded in Compression," AIAA Journal, Vol. 21,No. 12, December 1983, pp. 1729-1735.
43. Arnold, R. R., and Mayers, J., "Buckling,Postbuckling, and. Crippling of' Materially NonlinearLaminated Composite Plates," Journal pf Solids ghgStructures, (forthcoming).
44. Spier, E. E., and Klouman, F. L., "Post BucklingBehavior of Graphite/Epoxy Laminated Plates andChannels," Composite Materials: Th; Influence pfMechanics pf Failure ph. Design, Proceedings of theArmy Symposium on Solid Mechanics, AD-AO29 735,September 1976, Army Materials and Mechanics ResearchCenter, Watertown, Massachusetts.
45. Starnes, J. H., Jr., and Rouse, M., "Postbuckling andFailure Characteristics of Selected Flat RectangularGraphite-Epoxy Plates Loaded in Compression,"Presented at the AIAA/ASME/ASCE/AHS 22nd Structures,Structural Dynamics and Materials Conference, Atlanta,‘Georgia, April 6-8, 1981.
46. Starnes, J. H., Jr., Knight, N. F., Jr., and Rouse,M., "Postbuckling Behavior of Selected Flat StiffenedGraphite-Epoxy Panels Loaded in Compression,"Presented at the AIAA/ASME/ASCE/AHS 23rd Structures,Structural Dynamics and Materials Conference, NewOrleans, Louisiana, May 10-12, 1982.

98
47. Rhodes, M. D., Mikulas M. M. Jr., and McGowan, P. E.,"Effects of Orthotropy and Width on the CompressionStrength of Graphite-Epoxy Panels with Holes." AIAAJournal, Vol. 22, No. 9, 1984, pp. 1283-1292.
48. Rosen, B. W., "Mechanics of Composite Strengthening,"Fiber Composite Materials, American Society of Metals,Metals Park, Ohio, October 1964.
49. Schuerch, H., "Prediction of Compressive Strength inUniaxial Boron Fiber—Metal Matrix CompositeMaterials," AIAA Journal, Vol. 4, No. 1, 1966, pp.102-106.
50. Hayashi, T., "On the Shear Instability of StructuresCaused by Compressive Load," Presented at the JointMeeting of the American Institute of Aeronautics andAstronautics, Royal Aeronautical Society, and theJapan Society for Aeronautics and Space Science,Aircraft Design and Technology Meeting, Los Angles,California, November 1965. AIAA Paper No. 65-770.
51. Foye, R. L., "Compression Strength of UnidirectionalComposites," AIAA Paper No. 66-143.
. 52. Lager, J. R., and June, R. R., "Compressive Strengthof Boron-Epoxy Composites," Journal pf CompositeMaterials, Vol. 3, January 1969, pp. 48-56.
53. Moncunill de Ferran, E., and Harris, B., "Compressivel
Strength of Polyester Resin Reinforced with SteelWires," Journal pf Composite Materials, Vol. 4,January 1970, pp. 62-72.
54. Chung, Wen-Yi, and Testa, R. B., "The ElasticStability of Fibers in a Composite Plate," Journal pfComposite Materials, Vol. 3, January 1969, pp. 58-80.
55. Herrman, L. R., and Mason, W. E., "Response ofReinforcing Wires to Compressive State of Stress,"Journal pf Composite Materials, Vol. 1, 1967, pp.212-226.
S6. Hanasaki, S., and Hasegawa, Y., "Compressive Strengthof Unidirectional Fibrous Composites," Journal pfComposite Materials, Vol. 8, July 1974, pp. 306-309.

99
57. Davis, J. G., Jr., "Compressive Strength of Fiber-Reinforced Composite Materials," CompositeReliability, ASTM STP 580, American Society forTesting and Materials, 1975, pp. 364-377.
58. Lanir, Y. and Fung, Y. C. B., "Fiber Composite ColumnsUnder Compression," Journal pg: Composite Materials,Vol. 6, July 1972, pp. 387-401.
59. Kulkarni, S. V., Rice, J. S., and Rosen, B. W., "AnInvestigation of the Compressive Strength of Kevlar49/epoxy Composites," Composites, September 1975, pp.217-225.
60. Davis, J. G., Jr., "Compressive Strength of LaminaReinforced and Fiber Reinforced Composite Materials,"Ph.D. dissertation, Virginia Polytechnic Institute andState University, Blacksburg, VA., May 1973.
61. Greszczuk, L.? B., "Compressive Strength and FailureModes of Unidirectional Composites," Analysis pf theTest Methods for High Modulus Fibers and Composites,ASTM STP 521, American Society for Testing andMaterials, 1973, pp. 192-217.
62. Greszczuk, L. B., "Microbuckling of Lamina-ReinforcedComposites," Composite Materials: Testing and Design(Third Conference), ASTM STP 546, American Society forTesting and Materials, 1974, pp. 5-29.
63. ·Argon, A. S., Fracture of' Composites," Treatise _gpMaterials Science and Technology, Academic Press, NewYork and London, pp. 79-114, 1972.
64. Hancox, N. L, "The Compressive Strength ofUnidirectional Carbon Fibre Reinforced Plastic,"Journal _gf Materials Science, No. 10, pp. 234-242,1975.
65. Weaver, C. W., and Williams, J. G., "Deformation of aCarbon-epoxy Composite under Hydrostatic Pressure,"Journal pf Materials Science, No. 10, pp. 1323-1333,1975.
66. Evans, A. G., and Adler, W. F., "Kinking as a Mode ofStructural Degradation in Carbon, Fiber Composites,"Acta Metallurgica, Vol. 26, p. 725-738, 1978.

100
67. Hull, D., "Strength of Unidirectional Laminae:Longitudinal Compressive Strength," Ag Introduction ppComposite Materials, Cambridge University Press, pp.154-162, 1981.
68. Chaplin, C. R., "Compressive Fracture inUnidirectional Glass-reinforced Plastics," Journal pgMaterials Science, Vol. 12, pp. 347-352, 1977.
69. Berg, C. A., and Salama, M., "Fatique of GraphiteFiber-reinforced Epoxy in Compression," Fiber Scienceggg Technology, Vol. 6, p 79, 1973.
70. Parry, T. V., and Wronski, A. S., "Kinking andCompressive Failure in Uniaxially Aligned Carbon FibreComposite Tested Under Superposed HydrostaticPressure," Journal gf Materials Science, Vol. 17, pp.893-900, 1982.
71. Nuismer, R. J., and Labor, J. D., "Application of theAverage Stress Failure Criterion: Part II-Compression," Journal gf Composite Materials, Vol. 13,pp. 49-60, January 1979.
72. Haftka, R. T., and Starnes, J. H., Jr., "Use ofOptimum Stiffness Tailoring to Improve the CompressiveStrength of Composite Plates with Holes," To bepresented at the AIAA/ASME/ASCE/AHS 26th Structures,Structural Dynamics, and Materials Conference,Orlando, Florida, April 1985.
73. Hahn, H. T., and Williams, J. G., "Compression FailureMechanisms in Unidirectional Composites," NASATechnical Memorandum 85834, August 1984.
74. Chou, Tsu-Wei, and Kelly, A, "The Effect of TransverseShear on the Longitudinal Compressive Strength ofFibre Composites," Journal pg Materials Science, Vol.15, pp. 327-331, 1980.
75. Shuart, M. J., and Williams, J. G., "CompressionFailure Characteristics of :45°-Dominated Laminateswith a Circular Hole or Impact Damage," Presented atthe AIAA/ASME/ASCE/AHS 25th Structures, StructuralDynamics, and Materials Conference, Palm Springs,California, May 14-16, 1984. AIAA Paper No:84-0848.
76. Sih, G. C., and Liebowitz, H., "Mathematical Theoriesof Brittle Fracture," Fracture, Vol. 2, pp 68-188, Ed.Liebowitz, H., Academic Press, New York, 1968.

101
77. Jones, R. M., Mechanics pf Composite Materials,McGraw-Hill , 1975, pp. 94-96.
78. Miura, H., and Schmit, L. A., Jr., "NEWSUMT: A FortranProgram for Inequality Constrained FunctionMinimization - Users Guide," NASA-CR-159070, June1979.
79. Grandhi, R. V., Thareja, R. R., and Haftka, R. T.,"NEWSUMT-A: A General Purpose Program for ConstrainedOptimization using Constraint Approximations,"Presented at the ASME International Computers inEngineering Conference, August 7-11, 1983, Chicago,Illinois.
‘
80. Haftka, R. T., and Starnes J. H., Jr, "Application ofa Quadratic Extended Interior Penalty Function forStructural Optimization," AIAA Journal, Vol. 14, June1976, pp. 718-724.
81. Haug, E. J., and Arora, J. S., Applied Optimal Design,John Wiley and Sons, 1979.
82. Hsieh, C. C., and. Arora, J. S., "Structural DesignSensitivity Analysis with General BoundaryConditions," University of Iowa Technical Report, CAD-SS-83.5, March 1983.
83. Starnes J. H., Jr, personal communication, November,1984.

TABLES
102

103
I6II EIII OII I I
II I 0: III
II I H ~ I II •'¤
II I3 I EIS ' III III CD " IIIIII 0 I ·I-I oä I ow cn <I• SI g IBgII•—I I IUI-I I II . MII ID I LI-I I II c'~ _¤II I I II UII I TJ I II
°’II ·-Q I II-I Q In I II I"II
I-’I O·•·I I: I II 0:
°’II "" I *0 :> I II LI II ·II 3 I LI 3 I5 I .Q II 0:
“’
H I I N N N In N N RO In LO IH "III In I
I2 ¤I«—I I II IZII+’
II ¤ I 3 Q IU I ll 3
H Ip I 23:1 I II E -9II S : : II E :~_ II 3 I UI I II I-III
¤_I Q ~ I II In InII II UI I I <I• <I• m 0 <II LD 0
HI-I'Q II Ad oä I In In I—I In cn N O ·•-IIII II °”' I II Z S‘”
II‘I
I II I-: TI/ I" II III \~ I II 5I M II In "
I ° II o 3I IJ V; II Q I IR I II ,q EI ¤¤ II " II I S I II I: ~I g I HX I N N In In N N co co oo II 3 I3_, Il U I -I-I 0 \ I 0 0 <I• <I• 0 0 cn In In II·_
gl II"' I " " " " II S 3\ II I I II I.:‘” II >I
¤Iz\‘~I 3
mIIB‘Ii’I§^"‘·I"QIÜ
‘II LI I I-II-I ~ I In In m ON In In Q Q Q
“I
II -I-I I >•Ad'U I In In In cn I-I I-I I-I II ¤'I 'CIII·~--I Q I I-I 0 In I II InII 0 I·¢II-U.-OV I II E ··*II ° I S*°'I I II S SII I II Q ‘·‘*II LI I II 3 'UII ID In I II Z5II .2II-I 0: I <I• <I• LO LO <I• <I• LO KD LO II LI 4-*II O·r·I I N N I—I «—I N N «-I I-I I-I II O ·I·III 3 ·—I I II IH ¤‘
II Z °* I II II SII Q I II I-: ·—III 0: I II I-III E I II 3 0:II ~I-I I I-I N In <I• In I-I N In <I* II III I>II 0 I 0 0 L: U I.: In In In In II 0: ·-III S. I "
I„°‘ ‘“H In I Q
I

104
TABLE 2
Typical properties of unidirectional graphite/epoxy systems.
Longitudina1 compression strength, GPa 1.45
Longitudina1 compression modu1us, GPa 131.0
Transverse modu1us, GPa 13.0
Shear modu1us, GPa 6.4
Poisson's ratio (major) .38
Short beam shear strength, MPa 131.0
Fiber vo1ume fraction 0.71
Neat resin e1ongation to fai1ure 0.010
» Average p1y thickness, mm 0.14

_ FIGURES
105

106
@ @
@@
®@
@@
@ @
@@
@ @
® ®
®®
®®
®
®Figure1.
a)M€Cha_p_ica1
f8.St€I1ing

107
b) Bonded plate section.
c)Discrete stiffness design.
‘ Figure 1: Concluded.l

97%
FAI
LING
LOA
D
RADIO
GRAP
HS, 2
a= 15
.2 mm
Fig
ure
2:
Bro
ken
0°
fib
ers
at
the
slo
t ti
p f
or
a [±
45
/02
]8
Bor
on/A
lim
inum
lam
inat
e,
Poe
[3
1].
f-'
0 ())

109
·
O‘1
” . yCrack al\2
Figure 3: Crack-tip coordinates.

110
Figure 4: Typical test specimen.

lllÄ
I·——22.9cm—•II
I I II I I
°I-I-I"'2•SCm I I I•-5.Icm I-—I—-I-——-— -;-7: · so.4cIII ;
2.Scm I 2.5cm I SLOT II I I
I lr._Spec1men C1 and C3 Specimen C2 and C4
I I‘II 12.7cm I
·•I 5.Icm •·I
II•-5_·IcIII
1-+-I-I
_ ··- 4.4cm2.5cm
I I
I II I
Specimen S1 Soecimen C5
L.. I Io.2¤II-·I I _
I I 3.0CIII _ I 7 ,.2.5cTI
I
I I*11 -„DCITI I
ILI I"] Ä 2.5cm
TI- + I I.2 I
IL
I 2.SCmII 1.sc I‘
I II
I ISpecimen S2 Soecimen S3 Snecimen S4
Figure 5: Slot locations.

112
0.004
mmol Slope Of Colculoted initiolControl Specimea slope for specnmen S1.
Q 0.003 iqä/1G-•
IX __ ‘
Q 0.002”
a
5 0.001 , ’4 ’/ ——§CONTROL SPECIMENE „' ·-—-——-0 SPECIMEN C1, 2.5 cm SLOT ’2;
X, ——-··—EISPECIMEN C2. 5.1 cm SLOTZ --——-—ASPECIMEN C5. 5.1 cm SLOT
·----—OSPECIMEN S1. 5.1 cm SLOT0.000
0.000 0.001 0.002 0.003 0.004 0.005 0.006NORMALIZED END SHORTENING. u/L .
Figure 6: Load shortening responses of the 24-ply plates.

113
0.004
Initiol slope of 10.2—cm—widecontrol specimen. ,.0
*1 0.003 _ _ _Colculoted inutiol slopefor specimen
S3.0.002_,Fl]
0-00* ————•00NrROL SPECIMEN.-" ·—-—---0 SPECIMEN S2, 2.5 cm SLOT
Z --—--—E] SPECINEN S3. 5.1 cm SLOTg -—-—--©SPECIMEN S4. 5.1 cm SLOT
·-·—--VSPECIMEN C3, 5.1 cm SLOT—--——-ASPECIMEN C4- 5-1 cm SLOT
0.000
0.000 0.00l 0.002 0.003 0.004 0.005 0.006
NORMALIZED END SHORTENING, u/L .
Figure 7: Load shortening responses of the 16-ply plates.

114
¤> ä· u
oooo ÜAJA;mmmw ÜEEEE
“Iioooo O lfZ~¤"t•1*t ' °·5Nmmm " Ümooomm uzzzz m ßJwwmm _
ܤzZZZ‘ O _H
b-OOOO 45zwwmm 2 uommmm uowmmm 5 w_ O q; .• (Ü CU)
°\ 25nswoE8.
ln wm·
C
° SS' „¤CQ•
•—· UIIm vw
I
23-m- .. _„ 'QI ul 2 di; E
v> 2' äV I') (V •— Q | ·r-1

115
Figure 9: Moire-fringe pattern of specimen S1, P=62 kN.
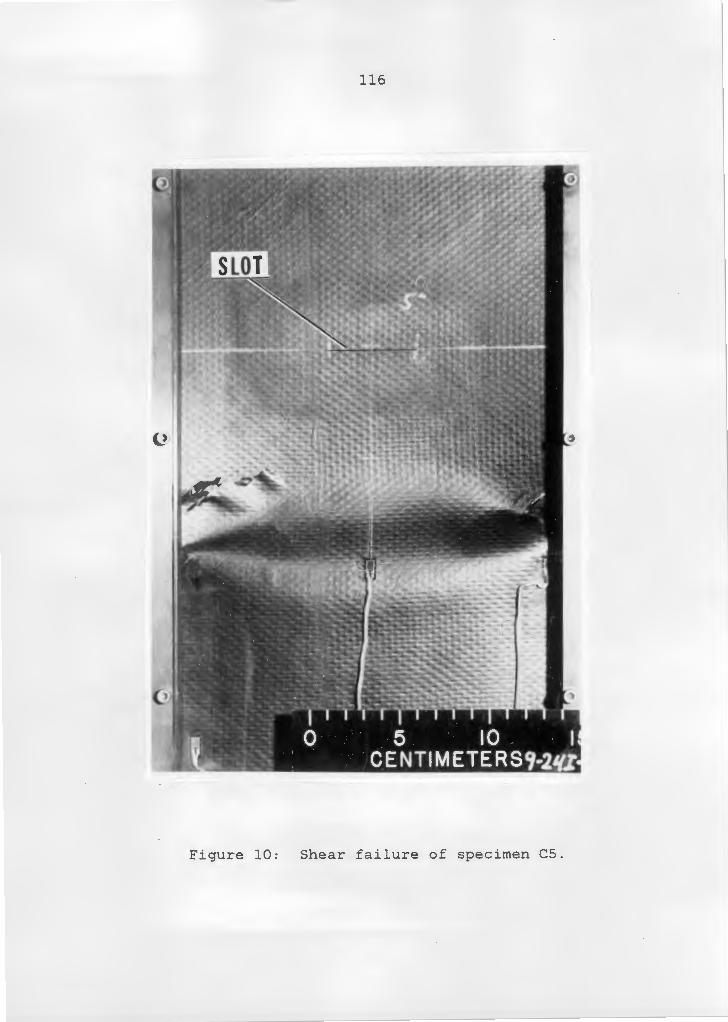
116
Figure 10: Shear failure of specimen CS.
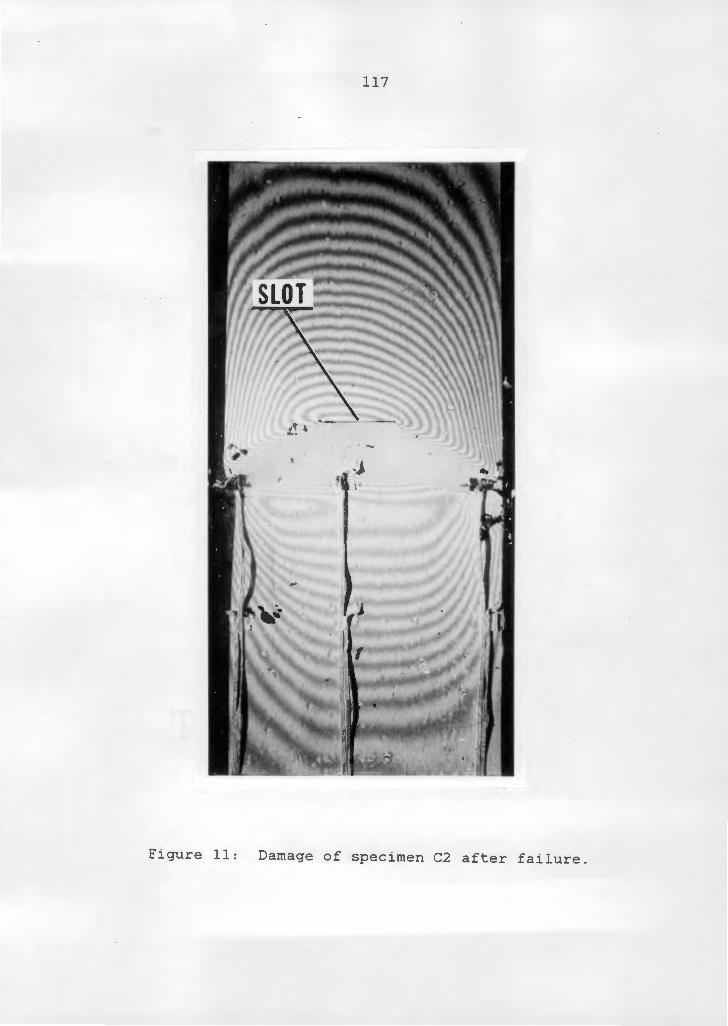
117
Figure 11: Damage of specimen C2 after failure.

Fig
ure
12
: S
hea
r cri
pp
lin
g f
ail
ure
o
f sp
ecim
en w
ith
a
ho
le,
from
R
ef.
47.
I-'
I-' en

119
Figure 13 : Failure of specimen S2.

-2
120
Ilfibermatrix
O' Ü
Figure 14: Composite material model considered by Rosen[48].

11I
\’
1\ 1 .1 I \\ 1 \ *
1\ 1 1
'\
11 11 I1 *1 1111 11 I1 *1 11II 11 I1 *1 11I1 11 I1 *1 11II 11 I1 *1 IIII 11 I1 *1 IIII 11 I1 *1 IlII 11 I1 *1 II .II 11 I1 *1 IIII 11 1 *1 II
1 1 1‘
11 1 1
‘1
I 1 I * 11 1 1
‘1
1 * 1
1 { 1 1. 1_ I 1 1
1 I 1 1‘'1
III11 111 {1 *1 II11 I1 *1 II11 I1 *1 II11 I1 *1 I111 I1 *1 II11 I1 *1 II11 I1 *1 I1
1 11 I1 *1 II11 I1 *1 11 ‘·
I I 1 11 I 1 1
1 I 1 1I1 1‘
1 1
a)Extens1o11 mode.
I1l II I
1 1 I II1 I I I111 {1 *1 ll11 I1 *1 II11 I1 *1 Il11 I1 *1 ll11 I1 *1 II11 I1 *1 ll11 I1 *1 Il11 I1 *1 II -11 I1 *1 II11 I1 *1 11. I I \‘ 1\ 1 I
\\ 1 I
"
1 1 I I
1 11 1 1 1 11 1 1 1 11 1 1 1 11 1 1 1 1
11 11 I1 *1 I111 11 I1 *1 1111 11 I1 *1 11Il 11 I1 *1 IIII 11 I1 *1 II
' II 11 I1 *1 IIII 11 I1 *1 IIII 11 I1 *1 IIII 11 I1 *1 IIII 11 1 *1 II
1 I· 1 1 11 1 1 1 1
1 1 1 1 11 1 1 1 1
1 1 1
b)Shea.rmode.
F1gure 15. Extens1onal and Shear modes of m1crobuckl1ngd€fOImätlOHS.

122
uu
AuxuxxuF uuuuxxmv Öcs
mmuAxxxxxw 2
·r·|
«\\\\\\\\\Y l_Q2cz.Eou
mxxxxxx‘“
""““\\\\\\ \\\\“‘
Q _
n Q QQ

I 7.*2,„
C 4 1 I
••-,
I
•9••4494
::
•°_•«*•:
‘
••:‘•••-
‘fI!IJffI!I::::
*·
·'·‘-‘: -'-·—'-· ·'*
JP:
:J:·JJ
-1,,
1/
•:-:•,:•,,:••,
·• *
,,,•»»¢
,1¢1/ /
--
—-••,
••-
·••
••••¢•
,,¢1
I
, -
•4
e-,
•
4904*
40'
’
-
••,
••
‘•,
•·
’IffI••··•*f:-ev"
—‘£-:-::·•I:••:-
,,„-•••••
"::‘:::•::•,:::•,——‘ :3
3-:::--:::••
‘ n
••
•••
‘••
IlIl||fi-„...„,
IIIll1
1
··
1
O;¢
VN,I
'—:,‘
••‘:_—':_-1_
·’/ 1*
e"•¢**
•••••••¢••••••
••_ ·-_
„_•,_-
_—
4
4
••9
:•
-,;—-,_---
,·;_44.-,,::I
••4
-«•
4490044
·:·JJ--
""
~--···:
:§:::I:::::::::-
::;;,--
::;,-;_·:4---
;;;;;;;
—
-:::.---„--•-----
--.-
·-·:;-*3:::
’*
,4
,•„••»•••••••••••••••,-
I .
'5 -
··
° °03•
°°I;
Imm
1 Q'11
°
7q¤a
Cra
1
S S

124
N[— ·¤-——-—-- Sta 3Eb ’°‘‘‘··JJC---___ b ·•-J
---___:"*—~--__ O>~N ,„
JJ' ai
....ZZZI“""·~~ mL.
·¤
GJJZJJ
Q-JO
<D'UO .E CL·•-JC JJO uJJ U
S E$— :>„ U UO‘~•-•
0"‘ 8 S><m
s oö_L «-•n" <DM s-•
O Z5gf EQ tu
Q

125
P füii
Srl. Sr I"-‘ f
.¤ X f ÄQ 1 ra V
*1V f»·· xä ,#"" 1 /
1X .¤ 1 1J3 ·' 1\cu I yE J f .
1 fElastic shear9 h
° 1 ffoundation
Pf qPr
Figure 19: Beam on an elastic foundation model of a fiberunder combined axial and side forces.

126
6sf
B-4 q : i'•¤•
g' 1.0q = 0.0
:55* 0.6 -.-1¤=‘•
Eä 026 cl — 0.05in q = 0.20
0. 4.'f_'fff[ÄÄÄQ
0_ 2Q'? 0.35 _ 0 50:-1 q ‘ ‘
0_0 ---——- Effect of shear softeningc2: 0.0 0.I 0.2 0.3 0.4 0.5
NORMALIZED SIDE DISPLACEMENT, v/L
Figure 20: Fiber end (x=l) deformation for different qvalues.

127
.
····Effect of shcar softeuinggf
. 0-8 = ————Cl
q'Pf<}
vg,0
0.6 406%E sk- gpß·-1 pb
-0-4 *0 0 ‘ 005®° q = 0.20 1 _
¤ 9 1 _------··"" ·E 40 A 0 „____,-—·N 0.2 0, Q = 0.353 _ ...--—-——-—······M
— _ ---·‘ "' - - ·-----··"iT’‘ V0.0 Q = 0-500.0 0.2 0.4 0.6 0.8 1.0
NORMALIZED FIBERSTRESS,Figure
21: Maximum compressive fiber stress (combinedbending and normal stress at x=O or x=l) fordifferent q values.

128
oo.·-7 Q
-2 E2Ü SQ
·~z .,,8 6Q/'\ •¤°
$2;*3* ig „ .„Alm u·-· w 3" D°&°"" Ä . . cuE/2¤"’ *··g‘g_ 6 _ g_¤¤° -7,6 FGGS
\j»Ä"'°uns ÜBauma-«Q •Sz°° ‘Z EÖ °c5 ¤¤oW·-•¤mu
E-« ·—·2‘*'¤E°°¤>'¤ <¤ '°'° OOm¤.>¥·• wp: E¤¥•H·:¤•—•®m _ M¤\;gQs«¤ op ¤gg @6::: 6 °‘:::3 ¤„ : W 3· 5 „ ä =~
II ~§ B3.' 6 32,1 00
,' umr 5·— $15¢00 • __x”O Ö;
ǤiQ N
Ö 2V (\l Ö @ (D V GI G j•- •— ·— O O O O O cn.Q Q Q Q Q Q Q Q 5;6 6 6 6 6 6 6 6°x3 ‘NIVH„LS IEIHHTIVJ (”I'IHI„2I HVJ

129
U; ¤'^.2 ^ S E7M
°?
2 E ES ··* ¤ 2 5 ¤= 51-1 I mn" "‘ \ \:> ·3 -1 • E" *+ ro ¤¤
2 ~V2 2 V 2 2* ~. H- * ·
,.;-•»°°
c> CA -« 6
¤.> NE" c 3 ·
Q 0x Q +·
§ IO rd g 1 ° ° - 5·— Ü. ä
1, 1, g ä
ns H-¢>$’„?:> 1
Q- Q- 1'I" an C3 ~-1
Q 0°‘
H- H- V? „· ·' -7 5 8ää
1, · G.) $4I,
"UI3l l EO
[_l 0
/1 ,1€,,1
l1' Ekl 6 {Q *{ gg _;l ls1
° Qß
I,]I/I1
’ •p| U :1-C
x 1* II ·-• 2:1 <><l1’ ,’ ux ¤‘ H
(U
/ Cl ay I"°
P'? rn 0,::
» , . 1'J · 4 we +>1’ 1 1- lg 0 ·1-1
'1 O ¤ 2
1, l'PU ä
0m
,1/ 1 Q"'I
·[l11O <D Q,
ev J3Ix'; ¤ A 0 ·j· gg
Ü6
°-•G 6 :,*2*
’” 6 6 { {:.8
0 I
6IM2
Q- N C) ¤¤ 0N
2 5 5 6 2 2 2200 0 0 6 CQ C; C; C; E
°x2 ‘NIVH„LM
S HHHTIVJ (I'IEII„:{ HVJ

130
_ t000—0 EXPERIMENTAL RESULTS {A
HAFTKA and STARNES, (1984) d.«""
800{„··’”-e,
_ 600 { "I
—J K4 ’_
Q 400 {,,/’
'·
+"F‘•.200 Predictions· ¤ PRESENT MODEL, r = 2.5 mm.
A ROSENS MICROBUCKLING MODEL, r = 0.08 mm.O
‘+ POINT—STRAIN MODEL, r = 2.0 mm.
0 20 40 60 80A I00ZERO DEGREE PLIES, % .
Figure 24: Comparison of failure predictions of the presentwork (Rosens model and model developed)withthe experiment and point strain predictions ofHaftka and Starnes. (Experimental values are for
a¤dlayups; Point-strain criterion
assumes 2-4%aallowable strain for i45° plies and1.4% for O° plies).

131
61:61111 .1-1.
d
A AL CRACK J
I4- 2a —>i1.
I'
·•———— e —> —v <—b ·<—————————-——— _W ———-——————«-———•-
Figure 25: Stiffened plate geometry.

WVYllllljMlkmumuugylqlvlllllä

MMMMÄllllllllällllllllä
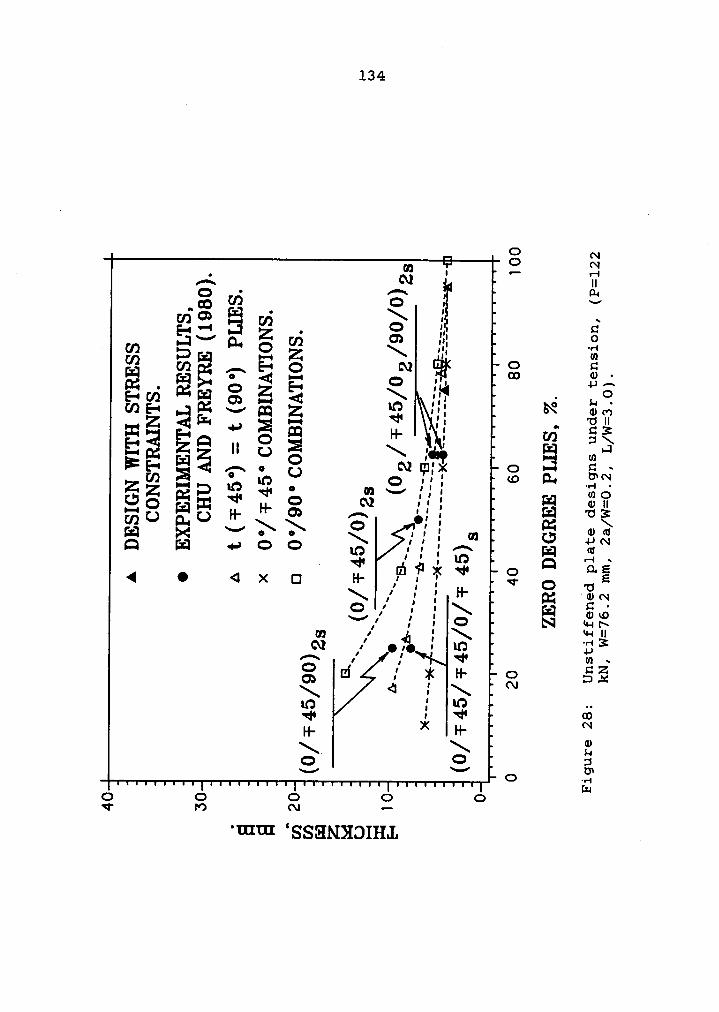
134
1 rnvig
W U; \ Ä .•= M ¤A ::1. cn°°:>G 2 z \ ·:· 2Q VJ A; 0 m Q o ¤
m mg?. • -:2 G . ¤¤ 31ms-• ¤¤ H? N
’;,"=“ gg: ¤ 2 »+ = m 22gw
$5 3 2*** 0 ¢‘!¤,¤!z< g¤__ 5,,;
Z·z···::·¤$· ,,,8:5: ·—·-ßcßm ‘*' G cu ,'5· ra
H- H' ¢¤ ws Ö}: Erl vzan $3 ~—·>> Q ,:5 ,„ Q; 2}II,4
I 4 >< 1:1 H- SEg ; gl g *3*%‘·’/
I 5 G N JB?U! /1 A:\CQ/1 •;•: [Q
1d
1,
*H' Ö
<¤ : \*‘*
mo ; nn ..Q r mH- * H- "'\. \ 20 8 ¤‘“
0 F,
2 2 2 2 2 ”'“

viMZi°*
ui
U3{\U)
¤*U}
F
O
C)
Z„
I'
C)
gn
IIS
.-
(AU)4-*E-•
4 Q
I,
Q
l;Il
S4
EEHl|zvi
U-O Q
,·'¢H
36
'5,'¢«1·
noH-
"‘ ·¤· .
¢'·¤
. S
.
Q -·H' H- :3
NU;SQ
4
Q•
I!,;'{
o
EW
+
c
I,;I, X
eoSä
X
dl,I", :
¤'|
(,Q"']
Ü’,
¤~‘
z"},
I/I 1/
ik
,' ·,'
MM?
ll,
Ill
IU,
'1
II; I,
I,IIQ-.;
E
X
Q
UE
Ngoa
2
ßé
2TSM
U3
1:*
o‘
gi
6;
•-
N
XM
G
H1.
3Ei:=EJbi
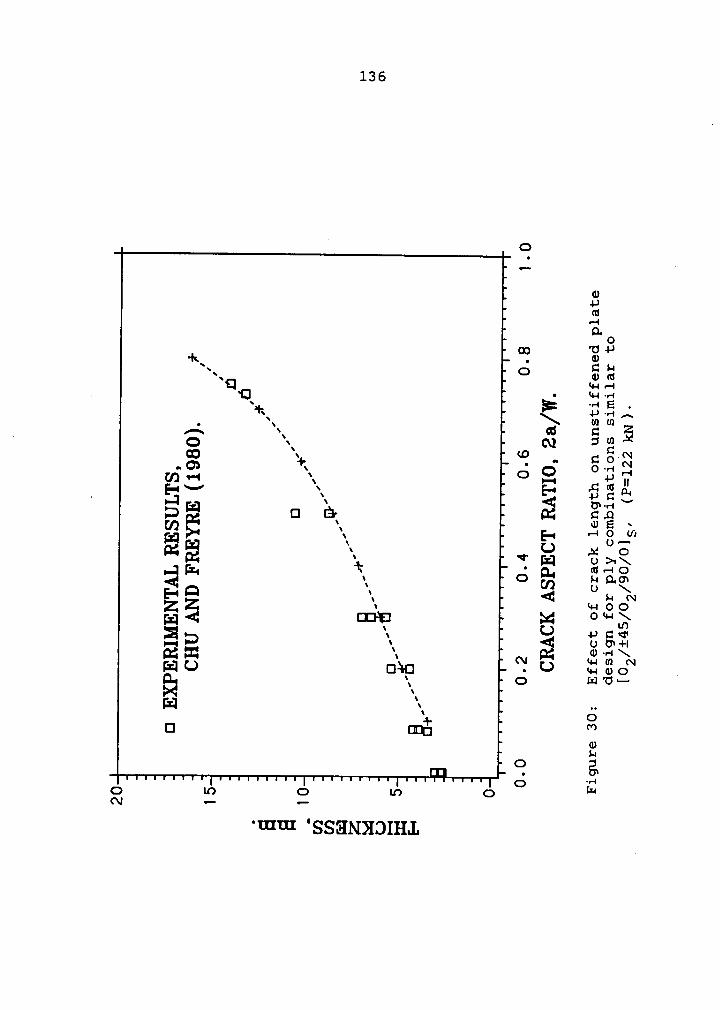
136
0
eviä•—«¤'o
-«_ °? Qt‘¤ 82·¤ 55-s \ **
‘~‘°„U3+1m"‘‘~
1:1 Q cx: äéJC O;1¤— E 6§—,° äää
&·¤ x <¤M °"",}
2:) \ U +>¤<r••-•~ < UU‘+I
gsm \sNum NHU
0‘\0
zuun
E EE “* ¤ ““
'mm °SSEIN}IDIH„L

137
0 éN
— Ü E-¤
'N Q I-tgpÜ 1 GIID-•
2*; Q : Q 'é3°L‘0 3 ¤¤ ¤ ¤ ~~
• n v-I Q,$.1qJlÜ O ÜÜÜ'
«|» -1-1oC} A LIU-IOI g UJMEoÜ] ¤· \ mg?}, ,.¤ ¤,¤«•«
f gz 'Emm
Iwxc:
·-“ 312%*
II
• 'H ¤
: S ¤ tägßÜ
F .¤c><„ Q ev ev,
•-< Um
: Q $2%·
— um·é= Q Q sea;
·U}N u$Ü?°
: 3ää“Ü Q mung
$40)
O $1
8 ° °O 0 Ü:
eo Q (0l lu• Izmm VHHV‘IVNOI„LOES SSOHO .
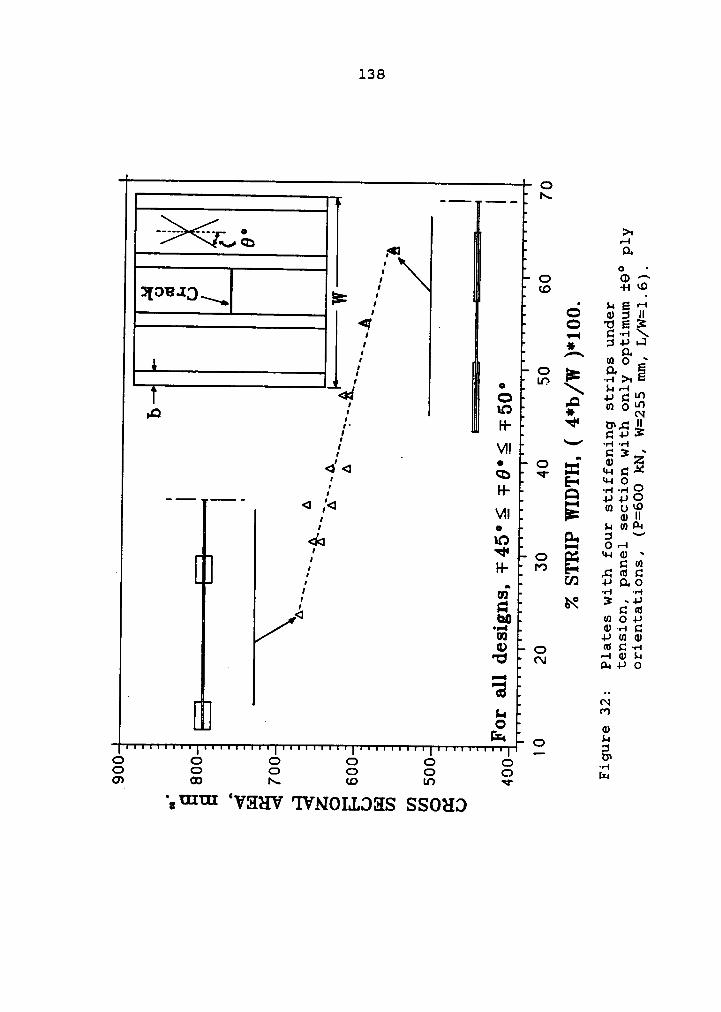
138
oN—" "“'
>••--•—· ~-•• O>·<Ä»<1: zu 3.—· ¤ ’_;
3 3 ~<z}{OU•IQQ· ,1I§
Q E 'g_§§, Q ¤·• „, U] O«’
. 3 3 ÜSEqd Q +1 cg„¤
"‘°
inin OW
I1/- H-
%34
IEV E' ääo' Q ' ' o·* "*' q'
V1! ev ||1,6*
3 E 2.: ~V,1,
H"ä
Q;
ai N§‘ܧ
A = „„ 2:2.29 cv·«-1 ct°’TS 220 Q ‘
'¤ ~ $8*5Iä ÄV). Q Q,In E äQ Q O O O CJ --1o c> Lu3 3 3 3 m ~r
'gmm °VHHV 'IVNOLLOHS SSOHO

139
O
er G
Q
os
.5zI
—
x
.____
llQI ·’>< ä °
1 oo S
— *
1 H
I
_Vj
‘ S DI
; { E SEI—
3‘“‘
°•111¤> ° -1
0 ,c: II•| 11 co H- +1 ¤,·
=1¤ 2·· 2q'
„ E
.
'§,‘ um
I1/IO ·-O ¤ LO
I 1 IV7
ä ä (U
Q
°* Z
=Q <¤ ~1·
>— 3 2 —gp"
" "
.·°?7"A „, E “?
O ’¢
¤= > =,46-’¤
“"2 3 {I
\\\,,_;,•
O 11;.,., II
•Ä_]
hg *4+}
V; n'ga <D
Ü ¢
11-1 ~
CI,v O B +1 m
lÜ
(\I L) >, —
1 '1
Q) ,-4 N
56°‘
"
E S W
I1 E} EQ
[:1 V „Q
fp 1E --
1 1 1
M
u 01
M
0
‘0
C>O 0
0 #1
0E T . E S S ¢>
Lu
IVNOLLOHS SSOHQ

140
_ _ A 0„ vI Q) ,•4
’°‘\ l Q• 0 0 E\‘• “? °‘!
"f ~¤ mElx \ -4 G GQ
‘~ ‘— 2 n u n °‘"E3“‘¤i~ äää ¤> 3 **ä
·s: co..1 .-1 -1 "o—
‘°~I·I- °° WT
ä -94 0" -4 1-4
·¤¤‘E
<¤ sz, EX
Q g Z **2jfät>·• E oo M(5 (\]•·Q
W 3 3 *2 2g QE ~*x
* E ai 1-4A E ¤- gg- II
Q *4-4 ru ¥°[mf[4) Q1Oll,Il0 ~•-4 -’1¤ 1,C\|
:14 äqä,'1,
., QI1 [ ..ml ;' E 3;1/: Q)*' : ä
1, ‘U2 ·.. 00
0 3 g g 0<¤ j E 2 °° °°°; mm ‘VHHV IVNOLLOHS SSOHO ‘
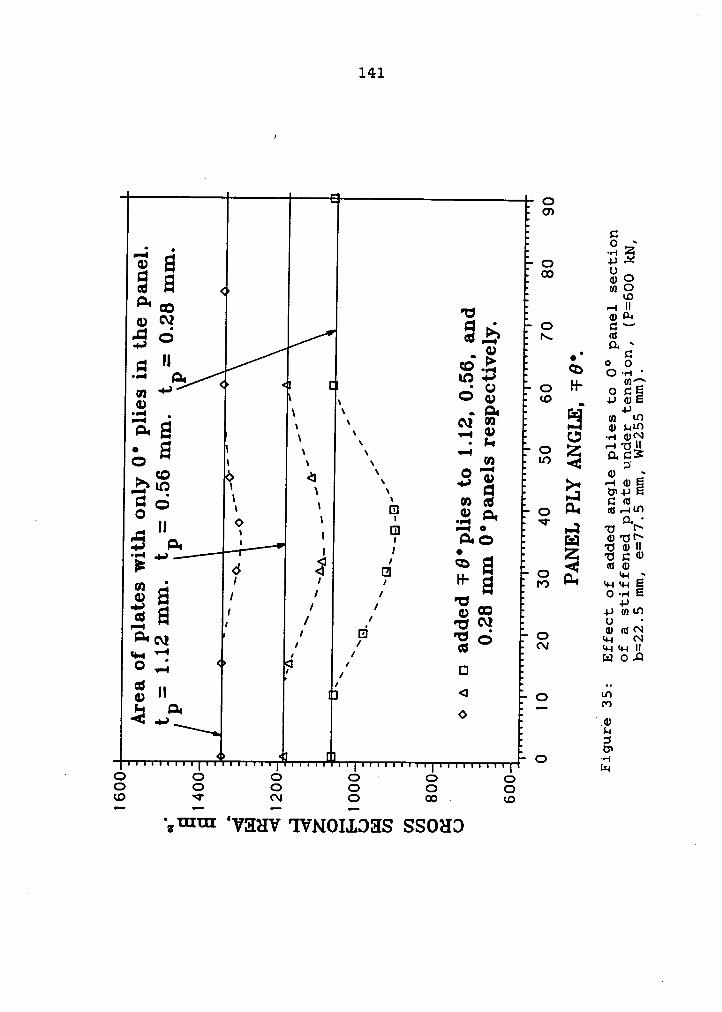
141
= 0os1::. ¤ ‘
IE
S gg *6FE
°’°• mo
¤"@ -111)q) N • O gg-5 6 cu.? ·~ 3.¤ II 6} og
-1-4 I O
gg „ ¢ 0 eo _ 8436·
\ \\U) Ln
¤·S x ~-• gg C, .2%
° E‘ \‘ -;
°Egg;
cw Ä,‘~•
vZMQ » X "">‘ E-‘3E
cc ‘ Ö W E3 ggw. O
I IQ·•
la II l m •-J gv;I
1 llä2F6 2 E E C, ch wg „
gg • ’' / H‘
E FO u-1u-1E
"" 1’ ’
Q wwwN E [ 1 Q .""‘' ' Ua! 8mN
*2»’ F 'ä=> 3 ::.62
Hu 1 /
SIIQ II < O<> C2
ä-‘ O O Q Q · o 0
3 3 3 3 3 3°zmm ‘VHHV 'IVNOLLDHS SSOHD

142
2.00
1;/2ä 1.76
EE¤ cnjp 1.50EE:1:EE,1.26S
___,„-EI
ä_______B_------1a--··"'B'”-‘-‘EB
53 Ü 1.00 = —-
EE “;0.761
0.600 10 20 30 40
BLAUE HEIGHT (tb), mm.
Figure 36: Weight penalty due to blade stiffeners, (P=6OOkN, b=5 mm, d=3O mm, e=75 mm).
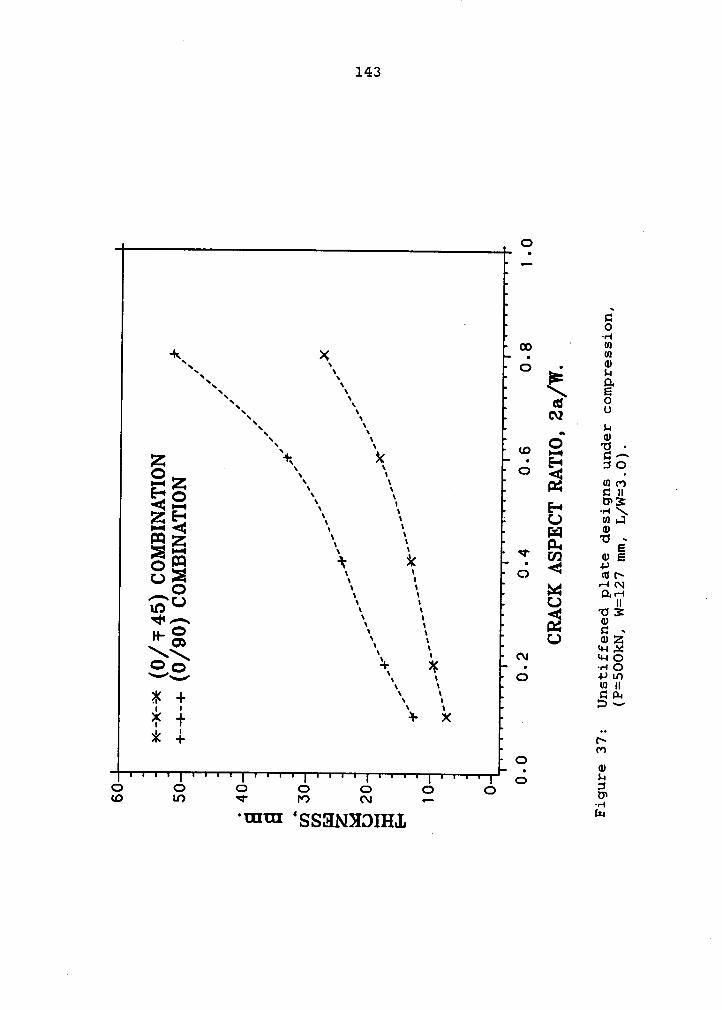
143
·k\‘
X
0
><
D
\\
\
\
·
\\
‘
Z
‘
\~
C
\~
‘
I-1 Z
x \~
‘
C
4Q
Z
3
zuQ
Ü
~~
No
‘
‘
40
Q
/-5Q
\\
\Q
(D·¤
0
‘·.
C; ·-3
3
**‘,.„
Q
‘.
ZE -
ig
„
‘„
_V-°‘°•
” o
¤\
\‘‘\
‘I
px;
g
\
Q
Q
"‘
.
\
q' ¤*
LJ
I+
‘Q
‘\
C;
'U
X '
Q
Q
¢
~
I +
~·
<v ä
*4
‘„ \
M*,1}
Z‘„
2
REI,
‘\,€
M·c
Q\an‘
‘,.
„
.
<*'(
O
I
¤II
SSEHm O
D Ü
Hl
00
Ä
Z!_¤~ri]

144
• O
z°‘ 3
4vg
2 G S·z„·
E; G Z„ 4,
l vwl
Z E, *" °O 29
•-• ·•J
Qmv
¤¤ ·· E $4E N G
6 ux
Q U
Ä •.1
UII
°
_ä
»- gpW UG;
ö :0 ¢ " -gl
wh I·I-
O II
> H- \‘°
°·· Ei
a -r °ta
UHU
·•·*Q
nEN
CE „g ‘
CD
v 2. E BE
4$2 ° 32
E°‘ä
E E Ei,3;:
··..
B8ä’· EEDv
E
O oO ä
‘* v> 3 ¤ O ,9;
um ‘SS3N>IOIH.L
‘“

.
146
:15I
Ä
4 "" vi
3 6
us E z
” ¤
z °* o ‘° E
ä<‘EÄ äc?
O Z
,_
C-km
z Fi ·—·‘
SS
E r Q
¤ °6®
ä N 8EJ
° Ä ib
“ S?
u
U;
—1· H·‘
EJ _g‘(;l¤
• H*
O W
¢> ‘:»’ Q
‘°; Sgä $$6
$„
cs gg?
I
Q 3
2Q
G)ä TEEN
jJ|_n
In·
..2
-(DH
” 5
I-O
Eu
°UIT1I‘N E c>
SSHNHDIHL1

146
O
g ** E3 5 155‘ E * ::6
*° 13*5°* 22:.
äf
ll•.,_2
°° 8.9.na R ID3Q •-•<D
· gg? vi 2*61 .cm ::1 gg
S24: ¤ E „°la tbnn-*2*1
==* 52:34-J an we:II B2 ~4-4MQ U GW
Ägc 4 g B.4nc:§?;Z
rg ä„"fE V100
"UV
OUICEIE01 N° 226 ··
11 *13{5*
IIS
S E °'mm ‘SSHN}IOIH„L
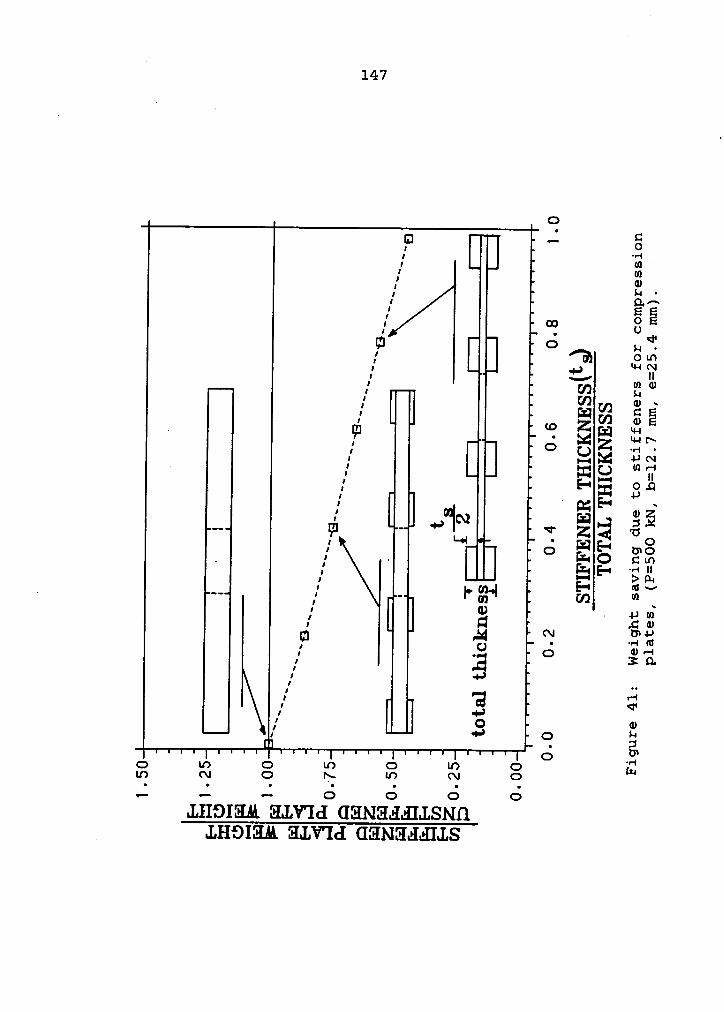
147
’6
F 7 8I, la;
I,I,
E
1 °? 8 EE9 o
21 m GJ;' % m S „/ FF rn ä E2 *¤ Z Q•
ü LH l\{ Ö U Z .,-q „I pg N{ E U
'”T{ E4 E B .¤
{ · pg; E—• —{ cu rr:
‘”5**
‘°"m|___'7 z Ä ää1,O E" E' UO
· - W O ¤ an„'E
E-• ··· M1 ü ä F4. I1,
P U)\§
/ 8 1 ,2 2¤
·“ ‘X‘E ii}1,
.2 O Ü ""1'¤ Z Q-•I1,4-*
1,,u
. Z!O
Uxc> uv 6 mo 6 mo 6 {Qno cu 6 :4 no cu oL .1 J 6 ci 6 6
LHDIHM, HLVIJ GHNHJMLSNH. LHSIHM H„LV°1cI GHNHHIHLS

148
0__ _" rx
O ,‘°.
g 4:‘ ~“*^ ’
- - sz ä jss? Erg‘*‘
3wr mm
-og}
0U:"E EE P}?
EsunSi 5; gsN .::;-5
3.9.302
<=>$,213
N 4-•¤„· mE·-eomu
AiO <2•
0 0 0 0 0 0 Q_
E0Ai 9 3 3 3 E 3 Si'UIUI‘z
VEHV 'IVNOILOHS SSOHZ)

149
2.00tb2
fg] .
cnEm I . 50
E•Qä XB
Em1.26EE"TP"Q 1 .00 = = = -—-····‘‘‘
—<C9ggIL
10-
750.50O IO 20 30 40 S0
BLADE HEIGHT (tb ), mm.
Figure 43: Weight penalty due to blade stiffeuers undercmpression, (P=5OO kN, b=5 mm, d=3O mm, e=75mm).

The vita has been removed fromthe scanned document

Automated Design of Composite Plates
Improved Daägäe Tolerance
by .
_ Zafer GürdalCommittee Chairman: Raphael T. Haftka
Aerospace and Ocean Engineering
~(ABSTRACT)
An automated procedure for designing minimum—weight
composite plates subject to a local damage constraint under
tensile and compressive loadings has been developed. A
strain based criterion was used to obtain fracture toughness
of cracked plates under tension. Results of an experimental
investigation of the effects of simulated through-the-thick-
ness cracks on the buckling, postbuckling, and failure char-
acteristics of composite flat plates are presented. A model
for kinking failure of fibers at the crack tip was developed -
for compression loadings. A finite element program based on
linear elastic fracture mechanics for calculating stress in-
tensity factor (SIF) was incorporated in the design cycle. A
general purpose mathematical optimization algorithm was used
for the weight minimization. Analytical sensitivity deriva-
tives of the SIF, obtained by employing the adjoint variable
technique, were used to enhance the computational efficiency
of the procedure. Design results for both unstiffened and
stiffened plates are presented.