l-plastin ser5 phosphorylation is modulated by the pi3k
TRANSCRIPT

Machado et al. Cell Commun Signal (2021) 19:22 https://doi.org/10.1186/s12964-021-00710-5
RESEARCH
L-plastin Ser5 phosphorylation is modulated by the PI3K/SGK pathway and promotes breast cancer cell invasivenessRaquel A. C. Machado1, Dunja Stojevski1, Sébastien De Landtsheer2, Philippe Lucarelli2,3, Alexandre Baron1,4, Thomas Sauter2 and Elisabeth Schaffner‑Reckinger1*
Abstract
Background: Metastasis is the predominant cause for cancer morbidity and mortality accounting for approxima‑tively 90% of cancer deaths. The actin‑bundling protein L‑plastin has been proposed as a metastatic marker and phos‑phorylation on its residue Ser5 is known to increase its actin‑bundling activity. We recently showed that activation of the ERK/MAPK signalling pathway leads to L‑plastin Ser5 phosphorylation and that the downstream kinases RSK1 and RSK2 are able to directly phosphorylate Ser5. Here we investigate the involvement of the PI3K pathway in L‑plastin Ser5 phosphorylation and the functional effect of this phosphorylation event in breast cancer cells.
Methods: To unravel the signal transduction network upstream of L‑plastin Ser5 phosphorylation, we performed computational modelling based on immunoblot analysis data, followed by experimental validation through inhi‑bition/overexpression studies and in vitro kinase assays. To assess the functional impact of L‑plastin expression/Ser5 phosphorylation in breast cancer cells, we either silenced L‑plastin in cell lines initially expressing endogenous L‑plastin or neoexpressed L‑plastin wild type and phosphovariants in cell lines devoid of endogenous L‑plastin. The established cell lines were used for cell biology experiments and confocal microscopy analysis.
Results: Our modelling approach revealed that, in addition to the ERK/MAPK pathway and depending on the cellular context, the PI3K pathway contributes to L‑plastin Ser5 phosphorylation through its downstream kinase SGK3. The results of the transwell invasion/migration assays showed that shRNA‑mediated knockdown of L‑plastin in BT‑20 or HCC38 cells significantly reduced cell invasion, whereas stable expression of the phosphomimetic L‑plastin Ser5Glu variant led to increased migration and invasion of BT‑549 and MDA‑MB‑231 cells. Finally, confocal image analysis combined with zymography experiments and gelatin degradation assays provided evidence that L‑plastin Ser5 phosphorylation promotes L‑plastin recruitment to invadopodia, MMP‑9 activity and concomitant extracellular matrix degradation.
Conclusion: Altogether, our results demonstrate that L‑plastin Ser5 phosphorylation increases breast cancer cell invasiveness. Being a downstream molecule of both ERK/MAPK and PI3K/SGK pathways, L‑plastin is proposed here as a potential target for therapeutic approaches that are aimed at blocking dysregulated signalling outcome of both pathways and, thus, at impairing cancer cell invasion and metastasis formation.
© The Author(s) 2021. Open Access This article is licensed under a Creative Commons Attribution 4.0 International License, which permits use, sharing, adaptation, distribution and reproduction in any medium or format, as long as you give appropriate credit to the original author(s) and the source, provide a link to the Creative Commons licence, and indicate if changes were made. The images or other third party material in this article are included in the article’s Creative Commons licence, unless indicated otherwise in a credit line to the material. If material is not included in the article’s Creative Commons licence and your intended use is not permitted by statutory regulation or exceeds the permitted use, you will need to obtain permission directly from the copyright holder. To view a copy of this licence, visit http://creat iveco mmons .org/licen ses/by/4.0/. The Creative Commons Public Domain Dedication waiver (http://creat iveco mmons .org/publi cdoma in/zero/1.0/) applies to the data made available in this article, unless otherwise stated in a credit line to the data.
Open Access
*Correspondence: [email protected] Cancer Cell Biology and Drug Discovery Group, Department of Life Sciences and Medicine, Faculty of Science, Technology and Medicine, University of Luxembourg, CAMPUS Belval, BT1, 7, avenue des Hauts‑Fourneaux, 4362 Esch‑sur‑Alzette, LuxembourgFull list of author information is available at the end of the article

Page 2 of 22Machado et al. Cell Commun Signal (2021) 19:22
BackgroundCells respond to intra- and extracellular changes by triggering intracellular signalling events, which are necessary for eliciting and regulating normal cell pro-cesses. Aberrant signalling can lead to disease [1] and cancer is commonly considered as a cell signalling dis-order [2]. In particular, the ERK/MAPK and the PI3K pathways are two of the most commonly dysregulated signal transduction pathways in breast cancer [3] and harbour cancer driver genes that are associated with many cancer types [4]. Among other stimuli, both path-ways are activated in response to growth factor bind-ing to their respective receptors endowed with tyrosine kinase activity (RTKs) and their role in the control of cell proliferation, survival, differentiation, metabolism and invasion/migration has long been established [5]. Increased signalling often occurs as a result of muta-tion and/or amplification of key components of the pathways, which commonly lead to hyper-activation of downstream effectors. Moreover, there exists an exten-sive crosstalk between the two pathways and inhibition of one pathway may be compensated by activation of the other pathway, thus leading to attenuation of tar-geted therapeutic efficacy and contributing to drug resistance [6].
The actin-bundling protein L-plastin or fimbrin is encoded by the LCP1 gene and has been initially detected in leukocytes where it plays a role in the immune response [7]. In addition, L-plastin is often ectopically expressed in malignant cells of non-hemat-opoietic origin [8, 9]. As both leukocytes and cancer cells are capable of moving, the expression of L-plas-tin seems to be characteristic for motile cells and the involvement of L-plastin in immune cell motility is well established [10]. In the cancer context, our group has previously described that L-plastin is highly enriched in actin-based structures playing a role in cell migra-tion, such as ruffling membranes, microspikes, and filo-podia-like structures [11–13]. Notably, L-plastin also localizes in structures involved in cell invasion such as podosomes in cells of the immune system and invado-podia in cancer cells. Indeed, L-plastin localization to podosomes has been reported in macrophages [14, 15], in monocyte-derived osteoclasts [16, 17] and in neutro-phils [18]. Moreover, a recent report has provided evi-dence for the recruitment of L-plastin to invadopodia [19], which are structures that mediate dissemination
and metastasis of cancer cells [20]. Importantly, phos-phorylation of L-plastin on its residue serine-5 (Ser5) contributes to protein activation and increases its actin-bundling activity [11, 12]. In this regard, several studies have shown that not only L-plastin expression, but mostly L-plastin phosphorylation should be consid-ered when linking L-plastin to tumor progression [21]. Therefore, the elucidation of the signalling network upstream of L-plastin Ser5 phosphorylation is of high interest.
In our recent work, we have shown that ERK/MAPK signalling leads to Ser5 phosphorylation of L-plastin and that this phosphorylation can be directly mediated by the ERK/MAPK pathway downstream kinases RSK1 and RSK2 [13]. Notably, our in vitro kinase screening assays pointed to a potential role of additional kinases including SGKs and p70S6K, all of which are located downstream of PI3K. Since the PI3K pathway is also commonly dysregulated in breast cancer [3] and given the existence of an extensive crosstalk between the ERK/MAPK and PI3K pathways in addition to their prominent role in a large plethora of cancer-associated processes [6], we sought to extend our investigations and assess the involvement of the PI3K pathway in L-plastin Ser5 phosphorylation in breast cancer cells. Taking a computational modelling approach, followed by experimental validation, we found that the PI3K pathway, in addition to the ERK/MAPK pathway, plays a role in L-plastin Ser5 phosphorylation predominantly through its downstream kinase SGK3. Of note, the con-tribution of the PI3K/SGK3 axis to L-plastin Ser5 phos-phorylation strongly depends on the cellular context.
In order to explore the functional outcome of L-plas-tin expression and, in particular, of L-plastin Ser5 phos-phorylation, we have investigated their role in invasion/migration processes, invadopodia formation and extra-cellular matrix (ECM) degradation. To this end, we have taken two parallel approaches: first, we have silenced L-plastin expression in two breast cancer cell lines ini-tially expressing endogenous L-plastin and, second, we have neoexpressed L-plastin wild type or the phospho-rylation variants L-plastin Ser5Ala (S5A, non-phospho-rylatable) or L-plastin Ser5Glu (S5E, phosphomimetic) in breast cancer cells expressing only a low level or no endogenous L-plastin. Our results indicate that L-plas-tin expression and especially L-plastin Ser5 phospho-rylation enhances invasion/migration of breast cancer cells. Furthermore, Ser5 phosphorylation increases the
Keywords: L‑plastin, Actin‑bundling, PI3K pathway, ERK/MAPK pathway, SGK, RSK, Invasion, Invadopodia, Extracellular matrix degradation, Metastasis
Page 3 of 22Machado et al. Cell Commun Signal (2021) 19:22
recruitment of L-plastin to invadopodia as well as ECM degradation.
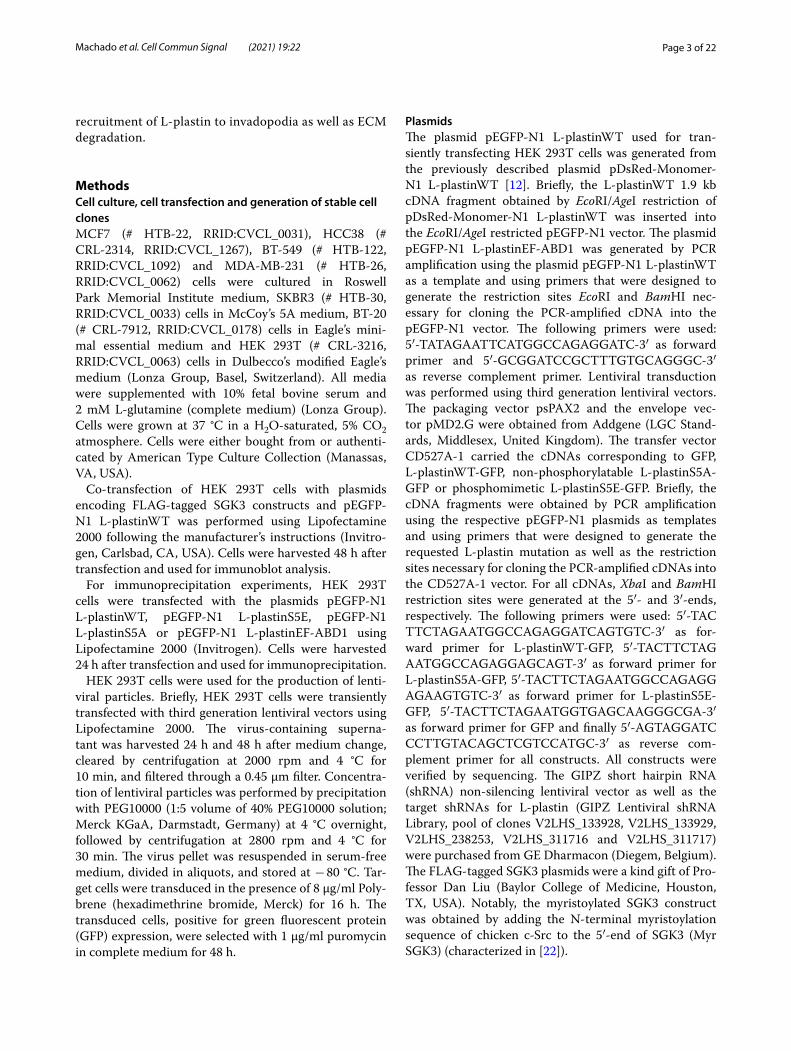
MethodsCell culture, cell transfection and generation of stable cell clonesMCF7 (# HTB-22, RRID:CVCL_0031), HCC38 (# CRL-2314, RRID:CVCL_1267), BT-549 (# HTB-122, RRID:CVCL_1092) and MDA-MB-231 (# HTB-26, RRID:CVCL_0062) cells were cultured in Roswell Park Memorial Institute medium, SKBR3 (# HTB-30, RRID:CVCL_0033) cells in McCoy’s 5A medium, BT-20 (# CRL-7912, RRID:CVCL_0178) cells in Eagle’s mini-mal essential medium and HEK 293T (# CRL-3216, RRID:CVCL_0063) cells in Dulbecco’s modified Eagle’s medium (Lonza Group, Basel, Switzerland). All media were supplemented with 10% fetal bovine serum and 2 mM L-glutamine (complete medium) (Lonza Group). Cells were grown at 37 °C in a H2O-saturated, 5% CO2 atmosphere. Cells were either bought from or authenti-cated by American Type Culture Collection (Manassas, VA, USA).
Co-transfection of HEK 293T cells with plasmids encoding FLAG-tagged SGK3 constructs and pEGFP-N1 L-plastinWT was performed using Lipofectamine 2000 following the manufacturer’s instructions (Invitro-gen, Carlsbad, CA, USA). Cells were harvested 48 h after transfection and used for immunoblot analysis.
For immunoprecipitation experiments, HEK 293T cells were transfected with the plasmids pEGFP-N1 L-plastinWT, pEGFP-N1 L-plastinS5E, pEGFP-N1 L-plastinS5A or pEGFP-N1 L-plastinEF-ABD1 using Lipofectamine 2000 (Invitrogen). Cells were harvested 24 h after transfection and used for immunoprecipitation.
HEK 293T cells were used for the production of lenti-viral particles. Briefly, HEK 293T cells were transiently transfected with third generation lentiviral vectors using Lipofectamine 2000. The virus-containing superna-tant was harvested 24 h and 48 h after medium change, cleared by centrifugation at 2000 rpm and 4 °C for 10 min, and filtered through a 0.45 μm filter. Concentra-tion of lentiviral particles was performed by precipitation with PEG10000 (1:5 volume of 40% PEG10000 solution; Merck KGaA, Darmstadt, Germany) at 4 °C overnight, followed by centrifugation at 2800 rpm and 4 °C for 30 min. The virus pellet was resuspended in serum-free medium, divided in aliquots, and stored at − 80 °C. Tar-get cells were transduced in the presence of 8 μg/ml Poly-brene (hexadimethrine bromide, Merck) for 16 h. The transduced cells, positive for green fluorescent protein (GFP) expression, were selected with 1 μg/ml puromycin in complete medium for 48 h.
PlasmidsThe plasmid pEGFP-N1 L-plastinWT used for tran-siently transfecting HEK 293T cells was generated from the previously described plasmid pDsRed-Monomer-N1 L-plastinWT [12]. Briefly, the L-plastinWT 1.9 kb cDNA fragment obtained by EcoRI/AgeI restriction of pDsRed-Monomer-N1 L-plastinWT was inserted into the EcoRI/AgeI restricted pEGFP-N1 vector. The plasmid pEGFP-N1 L-plastinEF-ABD1 was generated by PCR amplification using the plasmid pEGFP-N1 L-plastinWT as a template and using primers that were designed to generate the restriction sites EcoRI and BamHI nec-essary for cloning the PCR-amplified cDNA into the pEGFP-N1 vector. The following primers were used: 5′-TAT AGA ATT CAT GGC CAG AGG ATC -3′ as forward primer and 5′-GCG GAT CCG CTT TGT GCA GGGC-3′ as reverse complement primer. Lentiviral transduction was performed using third generation lentiviral vectors. The packaging vector psPAX2 and the envelope vec-tor pMD2.G were obtained from Addgene (LGC Stand-ards, Middlesex, United Kingdom). The transfer vector CD527A-1 carried the cDNAs corresponding to GFP, L-plastinWT-GFP, non-phosphorylatable L-plastinS5A-GFP or phosphomimetic L-plastinS5E-GFP. Briefly, the cDNA fragments were obtained by PCR amplification using the respective pEGFP-N1 plasmids as templates and using primers that were designed to generate the requested L-plastin mutation as well as the restriction sites necessary for cloning the PCR-amplified cDNAs into the CD527A-1 vector. For all cDNAs, XbaI and BamHI restriction sites were generated at the 5′- and 3′-ends, respectively. The following primers were used: 5′-TAC TTC TAG AAT GGC CAG AGG ATC AGT GTC -3′ as for-ward primer for L-plastinWT-GFP, 5′-TAC TTC TAG AAT GGC CAG AGG AGC AGT-3′ as forward primer for L-plastinS5A-GFP, 5′-TAC TTC TAG AAT GGC CAG AGG AGA AGT GTC -3′ as forward primer for L-plastinS5E-GFP, 5′-TAC TTC TAG AAT GGT GAG CAA GGG CGA-3′ as forward primer for GFP and finally 5′-AGT AGG ATC CCT TGT ACA GCT CGT CCA TGC -3′ as reverse com-plement primer for all constructs. All constructs were verified by sequencing. The GIPZ short hairpin RNA (shRNA) non-silencing lentiviral vector as well as the target shRNAs for L-plastin (GIPZ Lentiviral shRNA Library, pool of clones V2LHS_133928, V2LHS_133929, V2LHS_238253, V2LHS_311716 and V2LHS_311717) were purchased from GE Dharmacon (Diegem, Belgium). The FLAG-tagged SGK3 plasmids were a kind gift of Pro-fessor Dan Liu (Baylor College of Medicine, Houston, TX, USA). Notably, the myristoylated SGK3 construct was obtained by adding the N-terminal myristoylation sequence of chicken c-Src to the 5′-end of SGK3 (Myr SGK3) (characterized in [22]).

Page 4 of 22Machado et al. Cell Commun Signal (2021) 19:22
Antibodies and reagentsAntibodies mouse anti-Src (L4A1, #2110, RRID:AB_10691385), rabbit anti-EGFR (#2232, RRID:AB_331707), rabbit anti-IGF-IRβ (D23H3, #9750, RRID:AB_10950969), rabbit anti-phosphoSrc (pTyr416, #2101, RRID:AB_331697), rabbit anti-phos-phoAKT (pSer473, D9E, #4060, RRID:AB_2315049) and rabbit anti-phosphoSGK3 (pThr320, D30E6, #5642, RRID:AB_10694357) were from Cell Signaling Technol-ogy (Danvers, MA, USA), goat anti-AKT (N-19, #sc-1619, RRID:AB_671713), mouse anti-phosphoERK (pTyr204, E-4, #sc-7383, RRID:AB_627545), mouse anti-SGK3 (C-6, #sc-166847, RRID:AB_2188556) and rabbit anti-cortactin (H-191, #sc-11408, RRID:AB_2088281) from Santa Cruz Biotechnology, Inc. (Dallas, TX, USA), rabbit anti-ERK (#M5670, RRID:AB_477216), mouse anti-cort-actin (4F11, #05-180, RRID:AB_309647) and mouse anti-β-actin (#A5441, RRID:AB_476744) from Merck, rabbit anti-HGFR (22H22L13, #700261, RRID:AB_2532310) and mouse anti-L-plastin (LPL4A.1, #MA5-11921, RRID:AB_10979969) from Thermo Fisher Scientific (Waltham, MA, USA), mouse anti-MDM2 (2A10, #ab16895, RRID:AB_2143534) and rabbit anti-phospho-MDM2 (pSer166, #ab170880,) from Abcam (Cambridge, United Kingdom). The GFP-Trap_A antibody used for the nanotrap assays (#gta-20, RRID:AB_2631357) was from Chromotek (Planegg, Germany). The rabbit anti-body specifically recognizing L-plastin phosphorylated on Ser5 (anti-Ser5-P) was raised against a peptide encod-ing L-plastin residues 2–17 where Ser5 was phospho-rylated [ARGS(P)VSDEEMMELREA] (characterized in [11]).
The stimulators phorbol 12-myristate 13-acetate (PMA), human epidermal growth factor (EGF), human hepatocyte growth factor (HGF) and human insulin-like growth factor 1 (IGF) were purchased at Merck. The inhibitors FAK inhibitor II and RSK inhibitor II (Bi-D1870) were from Merck and AKT inhibitor VIII was from VWR (Oud-Heverlee, Belgium). The MEK inhibitor Trametinib and the dual PI3K/mTOR inhibi-tor Apitolisib were purchased at CliniSciences (Nanterre, France). Recombinant human full-length MDM2 protein was obtained from Abcam. Human tissue microarrays (TMAs) were purchased at AMS Biotechnology (Cam-bridge, MA, USA).
Treatment of cells with pharmacologic agentsCells were cultured in the absence of serum for 16 h and then treatment was performed at 37 °C as follows: 0.1 µM PMA for 1 h, 1 ng/ml EGF for 15 min, 40 ng/ml HGF for 20 min, 100 ng/ml IGF for 20 min, 20 µM AKT inhibitor VIII for 1 h, 5 µM FAK inhibitor II for 1 h, 5 µM RSK inhibitor Bi-D1870 for 30 min, 5 nM Trametinib
(Mekinist) for 1 h or 500 nM Apitolisib for 1 h. When activators and inhibitors were combined, the incubation with the inhibitors was performed first and their pres-ence was maintained during the incubation with the activators.
Immunoblot analysisIn situ cell lysis was performed with a cell scraper in ice-cold lysis buffer (50 mM Tris–HCl pH 7.5, 150 mM NaCl, 0.1% SDS, 5 mM EDTA, 1% Nonidet P-40, 1% Triton X-100, 1% sodium-deoxycholate, 1 mM Na3VO4, 10 mM NaF, 100 mM leupeptin, and 100 mM E64D) contain-ing a cocktail of protease inhibitors (Roche Diagnostics GmbH, Mannheim, Germany). Lysate clarification was done by centrifugation at 13,200 rpm for 15 min at 4 °C and total protein concentration was determined by Brad-ford assay (Bio-Rad, Hercules, CA, USA). Proteins (50 µg per lane) were resolved by SDS-PAGE in a 10% NuPAGE Tris-Base gel (Invitrogen) under reducing conditions, and transferred to a nitrocellulose membrane (GE Healthcare, Chicago, IL, USA) by semidry transfer. Membranes were saturated in Tris-buffered saline containing 1% bovine serum albumin and 0.1% Tween for 1 h at room tempera-ture, then incubated with primary antibodies overnight at 4 °C and with secondary antibodies IRDye 680 RD donkey anti-mouse (#926–68,072, RRID:AB_10953628, Thermo Fisher Scientific) and IRDye 800 CW goat anti-rabbit (#926–32,211, RRID:AB_621843, Thermo Fisher Scientific) for 1 h at room temperature. Each antibody incubation was followed by at least three wash steps in Tris-buffered saline supplemented with 0.1% Tween. Sig-nal intensities were quantified using the Odyssey Infrared Image System (LI-COR Biosciences, Lincoln, NE, USA). The ratio between the intensities obtained for phospho-rylated protein versus total protein was calculated to make individual samples comparable and then normal-ized to the mean of all the ratios calculated for one blot to make blots comparable by accounting for technical day-to-day variability. For representative purposes, data were scaled to the controls present on each blot and are represented as means ± SEM of three independent exper-iments. Raw images of the immunoblots are shown in the Additional file 1: Figure S1.
ModellingThe candidate signalling network upstream of L-plas-tin was derived from the literature as follows. The Ras/MAPK and PI3K/AKT pathways as well as cross-talk and compensation of the two pathways were derived from [5, 23, 24]. SGK, FAK, Src, PKA and PKC were integrated in the obtained network mainly based on [13, 25–32]. The experimental data were obtained by immunoblot analysis as described above and the ratios of P-LPL/LPL, P-ERK/

Page 5 of 22Machado et al. Cell Commun Signal (2021) 19:22
ERK, P-AKT/AKT and P-Src/Src were used for model contextualization as follows. Within the FALCON tool-box, Dynamic Bayesian Networks are used to quanti-tatively simulate the logic of signalling pathways [33]. Briefly, networks are initialized in a random state and the activity of ‘input nodes’ is fixed according to the experi-mental conditions (presence or absence of growth factors and inhibitors). The signals are then propagated accord-ing to the laws of probability until convergence, when the activities of the ‘output nodes’ are compared with the measurements. A gradient descent algorithm is used to optimize the weights of the edges controlling the relative contributions of upstream nodes to downstream nodes in order to minimize the mean squared error (MSE) between the simulations and the measurements.
Regularized optimization was then used to put in evi-dence the specific differences in signalling between the cell lines. Two types of regularization were applied to the parameter space during joint optimization of the individual cell line-specific models. Firstly, we sought to decrease the influence of experimental noise on the results by including a group partial-norm term penaliz-ing the concurrent activation of a node by more than one activator. The effect of such regularization is to prune the network of edges that are not well supported by experi-mental evidence. Secondly, uniformity regularization [34] was applied across the four cell lines for each parameter. This density-based regularization term stems from the biological assumption that differences between the cell lines are more likely due to a small number of differences than to large-scale rewiring, and its effect is to remove small differences between cell line-specific models unless they are well supported by the data. The combined effect of these two regularization terms is to reduce the size of the model and point to the signalling pathways that are differentially activated among the cell lines.
Regularized optimization with the FALCON tool-box was performed on the full dataset, after which the optimal model size was determined using the Bayes-ian Information Criterion [35] and the topology of the final multi-cell line model was fixed by removing edges with low (< 0.01) flux and merging similar (< 0.01 stand-ard deviation) edges. This final model was re-optimized on the full dataset, using unregularized optimization, to retrieve unbiased estimations for the activity of the dif-ferent signalling proteins and the strength of the inter-actions between them. To estimate the error on the parameters, we optimized 20 models with synthetic data-sets by applying random Gaussian noise on the measure-ments proportionally to the measurement error. Files containing the data used for the modelling can be found in the Additional file 2: Figure S4, Additional file 3: Figure S5, Additional file 4: Figures S6, Additional file 5: Figure
S7, Additional file 6: Figure S8, Additional file 7: Figure S9, Additional file 8: Figure S10, Additional file 9: Figure S11, Additional file 10: Figure S12, Additional file 11: Fig-ure S13, Additional file 12: Figure S14.
In vitro kinase assays of full‑length recombinant L‑plastinThe in vitro kinase assay was carried out as described before (Lommel, 2016). Briefly, full-length recombinant L-plastin (10 µg) or full-length recombinant MDM2 (2 µg) were incubated with 50 µM ATP and 100 ng recombinant kinase SGK1, SGK2, SGK3 or RSK1 pur-chased at SignalChem (Richmond, BC, Canada) in a reaction volume of 25 µl, according to the manufacturer’s protocol. For the negative control, the respective kinase was omitted. For full-length L-plastin, a positive control reaction was performed using the kinase RSK1. Follow-ing an incubation of 1 h at 30 °C, Laemmli buffer was added, and the samples were boiled at 100 °C for 5 min and then subjected to immunoblot analysis.
ImmunoprecipitationFor immunoprecipitation, 6 × 10⁶ HEK 293 T cells were transiently transfected with expression vectors encoding GFP, L-plastinWT-GFP, L-plastinS5A-GFP, L-plastinS5E-GFP or L-plastinEF-ABD1-GFP. 24 h after transfection, cells were homogenized in 500 µl lysis buffer (50 mM Tris–HCl pH 7.5, 150 mM NaCl, 0.5 mM EDTA, 1% Tri-ton, 1% glycerin, 1 mM PMSF, 1 mM sodium orthovana-date) containing a cocktail of protease inhibitors (Roche Diagnostics) and incubated on ice for 30 min. After a cen-trifugation step at 13,200 rpm and 4 °C for 10 min, total protein concentration was determined by Bradford assay (Bio-Rad) and sample concentrations were adjusted with dilution buffer (10 mM Tris–HCl pH 7.5, 150 mM NaCl, 0.5 mM EDTA, 1 mM PMSF, cocktail of protease inhibi-tors). 50 µl were added to SDS-containing sample buffer and used for SDS-PAGE (referred to as input). 25 µl of GFP-nanotrap beads (#gta-20, RRID:AB_2631357, Chro-motek) were added and incubated for 2 h on an end-over-end rotor at 4 °C. After a centrifugation step of 5 min at 3000 rpm at 4 °C, the supernatant was removed, and 50 µl of the supernatant were used for SDS-PAGE (referred to as non-bound). The bead pellet was washed four times with 300 µl dilution buffer. After the last washing step, the beads were resuspended in 2 × SDS-containing sam-ple buffer and boiled for 10 min at 95 °C (referred to as bound). The obtained samples were submitted to immu-noblot analysis.
Transwell migration and invasion assaysFor the transwell assays, cells were washed in phosphate-buffered saline (PBS) and resuspended in serum-free medium. A cell suspension containing 50,000 cells was

Page 6 of 22Machado et al. Cell Commun Signal (2021) 19:22
added to the upper well of transwell migration inserts (pore size: 8 μm, BD Biosciences, San Jose, CA, USA) or 100,000 cells to BD BioCoat™ Matrigel™ invasion cham-bers (pore size: 8 μm, BD Biosciences). In the lower well, complete medium (700 μl) was used as chemoattractant. Cells were incubated for 24 h at 37 °C and 5% CO2, fixed in 4% PFA for 10 min and stained with DAPI for 10 min. Cells that did not migrate to the lower compartment were removed with a cotton swab. Inserts were mounted on glass slides and five random fields at a magnification of 20 × were counted per sample.
ImmunofluorescenceCells were plated on 0.1% gelatin-coated glass coverslips. Following incubation, cells were washed with PHEM buffer (2 mM HEPES, 10 mM EGTA, 2 mM MgCl2, 60 mM PIPES, pH 6.9) and fixed for 20 min with cold PFA 4%. Next, cells were permeabilized with 0.1% Triton X-100 for 10 min, blocked with 1% bovine serum albu-min in PHEM buffer for 30 min, and then incubated with mouse anti-cortactin (1:200, #05–180, RRID:AB_309647, Merck) and rabbit anti-Ser5-P-L-plastin (1:50) at 4 ºC overnight, followed by incubation with Alexa Fluor 405-conjugated goat anti-mouse IgG (1:250, #A31553, RRID:AB_221604, Thermo Fisher Scientific), Alexa Fluor 488-conjugated GFP booster (1:200, #gb2AF488-10, RRID:AB_2827573, Chromotek), Alexa Fluor 594-conjugated goat anti-rabbit IgG (1:250, #A11037, RRID:AB_2534095, Thermo Fisher Scientific) and Alexa Fluor 633-conjugated phalloidin (1:50, #A22284, Thermo Fisher Scientific) or Alexa Fluor 568-conjugated phal-loidin (1:50, #12380, Thermo Fisher Scientific) at room temperature for 1 h. Coverslips were mounted using Vectashield Anti-fade Mounting Medium (#H-1000, RRID:AB_2336789, Vector Laboratories, San Francisco, CA, USA) and image acquisition was performed using the Andor Spinning Disk Revolution system (CSU-W1; Andor Technology, Belfast, United Kingdom) based on a Nikon Ti microscope (Nikon, Tokyo, Japan) with an Andor iXon Ultra EMCCD camera.
Invadopodia quantificationTo quantify invadopodia formation, MDA-MB-231 cells were plated at low density on top of 0.1% gelatin-coated coverslips and cultured for 24 h. All samples from the same replicate were stained simultaneously as described above. Four random fields at a magnification of 40 × were counted per sample using single confocal slices of the ventral surface of the cells. Image analysis was performed using ImageJ software (RRID:SCR_003070, National Institutes of Health, Bethesda, MD, USA). Firstly, the threshold “moments” was applied to the images of cells stained for F-actin and cortactin. To identify invadopodia,
the tool “image calculator” was used to show dot-like structures that were present in both images. The GFP-positive invadopodia were determined in the same way using the result image obtained from the calculation of F-actin and cortactin, which was then compared with the GFP signal. Particle frequency was determined using the “analyze particle” command. A cut-off of 0.5–20 µm2 was set as the size range and a value of 0.2 as the minimal cir-cularity shape.
Gelatin degradation assayThe gelatin degradation assay was adapted from a previ-ously described protocol [36]. Firstly, 0.2% gelatin solu-tion (#9000-70-8, Merck) was labeled using the Alexa Fluor 568-gelatin labeling kit (#A10238, Thermo Fisher Scientific) and aliquots were stored at − 20 °C. To coat glass coverslips, the fluorescent gelatin stock was mixed in a proportion 4:1 with non-labeled 0.2% gelatin solu-tion and kept at 50 °C. A volume of 100 µl of this mix-ture was given on top of each coverslip and incubated for 5 min. The coverslips were lifted and submerged in PBS in separate wells in a 12-well cell culture plate. When all coverslips were coated, PBS was aspirated and cover-slips were incubated for 15 min on ice with pre-chilled 0.5% glutaraldehyde solution. After washing, the cover-slips were incubated for 3 min at room temperature with freshly prepared sodium borohydride solution (5 mg/ml). Finally, the coverslips were extensively washed and stored at 4 °C in PBS for up to two weeks, protected from light.
To quantify the gelatin degradation ability, 80,000 MDA-MB-231 cells were plated on top of Alexa Fluor 568-labeled gelatin-coated coverslips in 12-well cell cul-ture plates and allowed to attach for 6 h. Coverslips were then submitted to immunofluorescence and six random fields at a magnification of 60 × were examined per sam-ple using single confocal slices of the ventral surface of the cells. The cell area was determined by the F-actin staining, using the “ROI manager” tool of ImageJ soft-ware. To determine degraded area, a threshold was applied to make visible the dark areas of degraded fluo-rescent gelatin and quantification was performed using the “analyze particle” command. Relative degradation area was determined as total degradation area divided by total cell area, normalized to the value obtained for MDA-MB-231 GFP control cells.
ZymographyTo analyze the activity of matrix metalloproteinases (MMPs), cells were cultured in complete medium until 70–80% confluence. Cells were then washed with PBS and cultured in serum-free medium for 24 h. The condi-tioned medium was collected, cleared by centrifugation and stored at − 80 °C. Zymography acrylamide gels (10%)

Page 7 of 22Machado et al. Cell Commun Signal (2021) 19:22
were prepared according to standard procedures with gelatin added to a final gelatin concentration of 1 mg/ml. The cell-free supernatant was mixed with 5 × non-reduc-ing sample buffer, incubated at room temperature for 10 min, and a volume of 25 µl of the mixture was loaded on the gels. After electrophoresis, the gels were incubated in washing buffer (50 mM Tris–HCl pH 7.5, 5 mM CaCl2, 1 µM ZnCl2, 2.5% Triton X-100) for 30 min. Finally, the gels were kept at 37 °C with gentle agitation in incuba-tion buffer (50 mM Tris–HCl pH 7.5, 5 mM CaCl2, 1 µM ZnCl2, 1% Triton X-100) for at least 24 h. Gelatinase activity was visualized by staining the gels with Coomas-sie Brilliant Blue G250 (Merck) with subsequent destain-ing in acetic acid–methanol–H2O (1:3:6). To visualize the amount of protein loaded, a parallel 10% polyacrylamide gel was loaded with the same volume of each sample and stained with Roti-blue (Carl Roth, Karlsruhe, Germany) for 1 h. Areas of protease activity and Roti-blue stained gels were analyzed using the Odyssey Infrared Image Sys-tem (LI-COR Biosciences).
StatisticsAll statistical analyses were carried out using Prism 5 (GraphPad Software, RRID:SCR_002798, San Diego, CA, USA). Results are expressed as means ± SEM of three independent experiments. Statistical significance was assessed by performing unpaired Student’s t-test or ANOVA for multiple comparison tests.
ResultsAnalysis of growth factor‑stimulated signalling in breast cancer cell linesA candidate network of the regulatory signalling path-ways upstream of L-plastin was assembled by manually curating signalling pathways from literature (Fig. 1a). Based on this network and in order to assess the interplay between ERK/MAPK and PI3K/AKT signalling pathways in regulating L-plastin Ser5 phosphorylation, we submit-ted four breast cancer cell lines to growth factor stimula-tion, with or without prior inhibition of key components of the two signalling pathways. Using MCF7, SKBR3, HCC38 and BT-20 cells, we first analyzed the expression level of different growth factor receptors. As verified by immunoblotting, the four cell lines express insulin-like growth factor 1 receptor (IGF-IR), although the level of expression is very low for SKBR3 cells. With the excep-tion of MCF7 cells, the receptor for epidermal growth factor EGFR and the receptor for hepatocyte growth fac-tor HGFR (or c-met) could be detected in all the investi-gated cell lines (Fig. 1b).
The RSK inhibitor II Bi-D1870 (BID) and the AKT inhibitor VIII were chosen to selectively block the ERK/MAPK and PI3K/AKT signalling pathways, respectively.
As a more central player connecting both pathways, FAK was inhibited using FAK inhibitor II. Following treat-ment, cells were lysed and the ratio of the phospho-rylation level versus the total protein level for different output nodes was determined as an indicator of their activation status. The investigated output nodes were ERK and AKT, which are commonly used as readouts for ERK/MAPK and PI3K/AKT signalling pathway activity, respectively. Additionally, we assessed the activation of the central player Src as well as L-plastin activation as the final output node. Growth factor stimulation was carried out based on the expression of the corresponding recep-tor by the respective cell line, as illustrated in Fig. 1b. In summary, we assessed the activation of four different output nodes in 20 different experimental conditions for the cell lines SKBR3, BT-20 and HCC38 and in 12 differ-ent experimental conditions for MCF7 cells. An example of the immunoblotting and the respective quantification of the ratios between Ser5-P-L-plastin and L-plastin for HCC38 cells is shown in Fig. 1c. The quantification of all output nodes activation in the four cell lines is shown in the Additional file 13: Figure S2 and these results are summarized as a heatmap indicating the activity level of the nodes in each condition (Fig. 1d).
Modelling of the signalling network upstream of L‑plastinThe averaged, normalized protein measurements were mapped to the corresponding network nodes, and the FALCON toolbox was then used to contextualize this network and retrieve, for each cell line specifically, the activity of the remaining nodes, the specific wiring of the signalling network and the flow of information for each experimental condition. Optimized regularization was performed to find the model that fits best the experi-mental data taking into account the cell-line specific parameters (Fig. 2a). The model with the lowest Bayesian Information Criterion (BIC) is considered the most ade-quate to represent the data (Fig. 2b), which corresponds to a model in which 63 of the 69 network parameters can be parametrized identically for all cell lines. Nota-bly, interactions relating to the PI3K/AKT/mTOR axis showed relatively high heterogeneity compared to the crosstalks between them. The goodness-of-fit was similar for all cell lines (Fig. 2c), with MSE values ranging from 0.008 to 0.017 for individual cell lines, 0.032 for the single model and 0.018 for the final model. It should be noted that, in our final model, RSK, SGK, PKA and PKC appear as the kinases able to phosphorylate L-plastin on its resi-due Ser5, with RSK and SGK being the most prominent kinases (Table 1). Importantly, SGK as a downstream kinase of the PI3K pathway was pointed out as a novel kinase involved in this process.

Page 8 of 22Machado et al. Cell Commun Signal (2021) 19:22
The optimized parameter values for the different models are expressed as the strength of the interaction from the parent node to the child node, relative to the total (= 1). Indicated is the value of the parameter for the best of all fits. The indicated error is the standard deviation (SD) of 20 rounds of re-sampling.
PI3K is involved in the process of L‑plastin Ser5 phosphorylationIn an effort to experimentally validate the involve-ment of the PI3K pathway in the process of L-plastin Ser5 phosphorylation, we verified the phosphoryla-tion level of L-plastin upon pharmacological inhibition
Fig. 1 Literature‑derived L‑plastin signalling network and activation state of the output nodes. a A candidate network for the signalling pathways upstream of L‑plastin Ser5 phosphorylation was built based on literature information. Green indicates the stimulators used, red the inhibitors, blue the output nodes and yellow the kinases upstream of L‑plastin Ser5 phosphorylation. The dashed arrows represent the interactions that are under investigation. b Characterization of the investigated breast cancer cell lines. Determination of the expression of different growth factor receptors in MCF7, SKBR3, HCC38 and BT‑20 cells. 50 µg of total cell extract were loaded per sample and β‑actin was stained as a loading control. c Example of an immunoblot analysis for L‑plastin Ser5 phosphorylation (Ser5‑P‑LPL) and total L‑plastin (LPL). The graph shows the ratio between Ser5‑P‑L‑plastin and L‑plastin. The values are represented as means ± SEM of three independent experiments. d The heatmap represents the activation states (scaled between 0 and 1) of the four output nodes in four different cell lines for all the conditions tested

Page 9 of 22Machado et al. Cell Commun Signal (2021) 19:22
of the ERK/MAPK pathway and the PI3K pathway, either individually or combined, by treating the cells with the MEK inhibitor Trametinib and/or the dual PI3K/mTOR inhibitor Apitolisib. In BT-20 cells, the
combined inhibition of both pathways consistently led to a synergistic reduction of HGF-stimulated Ser5-P-L-plastin levels (Fig. 3a). In SKBR3 cells, Apitolisib treatment reduced L-plastin Ser5 phosphorylation by
Fig. 2 Computational modelling approach. a Inference of the cell line‑specific parameters: (1) input data consist of a generic network topology and measurements of the activation state of output nodes (ratio phosphoprotein/total protein) for four cell lines, each cell line being represented by a different colour. (2) Without any regularization, model parameters are independent across cell lines, which might result in overfitting of the dataset. (3) When, in contrast, model parameters are forced to be equal across all cell lines, the phenotypes of the different cell lines are smoothed out and only the average behavior can be inferred. (4) By applying various levels of regularization (penalizing model size), the sparsity of the model, i.e. the number of model parameters allowed to vary across cell lines, can be controlled. (5) The Bayesian Information Criterion (BIC) is a measure of adequacy of the model, balancing model fitness and model size. The model configuration with the lowest BIC, evidencing the most crucial differences in signalling between the cell lines, was chosen for the final analyses. b Regularization landscape. Heatmap of the BIC values for each regularized model. Optimal model parametrization was obtained by screening values of the lambda_Pruning and lambda_Uniformity regularization parameters and computing the BIC for each resulting model. The model with the lowest BIC is considered the most adequate to represent the data and is obtained with log2(lambda_Pruning) = − 10 and log2(lambda_Uniformity) = − 4. c Best fit. Comparison of the simulated activity of the different measured proteins (output nodes) with the measurements. X‑axis: different experimental conditions. Y‑axis: normalized activity. Green: average of experimental measurements. The error bars represent 1 standard deviation. Blue: activity as simulated with the FALCON toolbox under the optimized final model topology

Page 10 of 22Machado et al. Cell Commun Signal (2021) 19:22
Table 1 Optimized parameter values for the different models
Single modelParameter value (± SD)
BT‑20 modelParameter value (± SD)
HCC38 modelParameter value (± SD)
MCF7 modelParameter value (± SD)
SKBR3 modelParameter value (± SD)
Final modelParameter value (± SD)
p70S6K‑ > LPL 0.02 (± 0.03) 0.01 (± 0.04) 0.01 (± 0.01) 0.00 (± 0.02) 0.01 (± 0.06) 0.00 (± 0.00)
PKA‑ > LPL 0.02 (± 0.04) 0.01 (± 0.05) 0.08 (± 0.05) 0.13 (± 0.07) 0.08 (± 0.02) 0.13 (± 0.07)
PKC‑ > LPL 0.02 (± 0.04) 0.01 (± 0.05) 0.08 (± 0.05) 0.13 (± 0.07) 0.08 (± 0.02) 0.13 (± 0.07)
RSK‑ > LPL 0.50 (± 0.15) 0.72 (± 0.20) 0.79 (± 0.08) 0.74 (± 0.10) 0.35 (± 0.12) 0.28 (± 0.05)
SGK‑ > LPL 0.43 (± 0.14) 0.25 (± 0.16) 0.05 (± 0.09) 0.00 (± 0.18) 0.49 (± 0.16) 0.46 (± 0.14)
Fig. 3 The PI3K pathway is involved in L‑plastin Ser5 phosphorylation through the PI3K/SGK3 axis. a BT‑20, SKBR3 or HCC38 cells were treated with Apitolisib (A) or Trametinib (T) or with both inhibitors (A + T), with or without subsequent HGF stimulation. Following treatment, residual L‑plastin Ser5 phosphorylation and total L‑plastin were determined by immunoblot analysis. The graphs show the ratio between Ser5‑P‑L‑plastin and L‑plastin. Three independent experiments were performed for each cell line. Data were scaled to the highest signal obtained (= 1) and results are expressed as means ± SEM. Statistical analysis was performed doing one‑way ANOVA, relative to the control (CTRL) condition with or without HGF stimulation, respectively (*p < 0.05, **p < 0.01, ***p < 0.001, ****p < 0.0001). b In vitro kinase assay. A total of 10 μg recombinant full‑length L‑plastin was incubated with 100 ng recombinant kinase and with 50 μM ATP in a reaction volume of 25 μl. RSK1 was used as a positive control kinase and a negative control (CTRL) was performed by omitting a kinase. L‑plastin Ser5 phosphorylation and total L‑plastin were determined by immunoblot analysis. c HEK 293 T cells were co‑transfected with GFP‑fused L‑plastinWT and FLAG‑tagged SGK3 WT, activated myristoylated SGK3 (Myr SGK3) or the empty vector (Ctrl). Cell extracts were prepared 48 h after transfection and immunoblot analysis was performed to determine L‑plastin Ser5 phosphorylation and total L‑plastin as well as SGK3 Thr320 phosphorylation and total SGK3

Page 11 of 22Machado et al. Cell Commun Signal (2021) 19:22
50%, whereas Trametinib treatment alone was suffi-cient to decrease this phosphorylation to background levels. In contrast, in HCC38 cells, Apitolisib did not display any effect, whereas Trametinib again reduced HGF-dependent L-plastin Ser5 phosphorylation to background levels. Hence, the relative contribution of the PI3K pathway to L-plastin Ser5 phosphorylation appears to depend on the cellular context.
Next, to further shed light on the possible involvement of SGKs in L-plastin activation, we performed an in vitro kinase assay assessing the ability of the three SGK iso-forms SGK1, SGK2 and SGK3 to phosphorylate recom-binant full-length L-plastin on residue Ser5. As shown in Fig. 3b, SGK3 was able to phosphorylate L-plastin on its residue Ser5, although to a lower extent than RSK1. SGK2 was able to induce a weak L-plastin Ser5 phos-phorylation, whereas SGK1 did not exhibit such phos-phorylation ability. In order to control that the three SGK isoforms were similarly active, we assessed their phosphorylation activity on the protein Mouse Double Minutes 2 MDM2, which has been described as a stand-ard substrate of SGK1 [37]. As illustrated in Additional file 14: Figure S3, we have found that all three kinases were able to phosphorylate MDM2 on its residue Ser166, demonstrating their activity. We then examined the abil-ity of SGK3 to phosphorylate L-plastin on its residue Ser5 in cells. To this end, we performed a comparative analysis between different SGK3 constructs by co-trans-fecting FLAG-tagged SGK3 WT or myristoylated SGK3 (Myr SGK3) and L-plastinWT-GFP in HEK 293T cells, which are devoid of endogenous L-plastin. As illus-trated in Fig. 3c, our immunoblot analysis revealed that the myristoylated form of SGK3 was phosphorylated on residue Thr320 indicating activation of the protein. Strikingly, we consistently observed a strong L-plastin Ser5 phosphorylation only when co-expressed with the activated myristoylated SGK3 form, and not when co-expressed with the non-activated SGK3 WT, even though SGK3 WT was expressed at a higher level than myris-toylated SGK3 in the cells. Altogether, our results provide
evidence that L-plastin residue Ser5 can be phosphoryl-ated in cells by SGK3, following activation of the kinase.
L‑plastin Ser5 phosphorylation modulates breast cancer cell migration and invasionGiven the important role of L-plastin in cell motility of many different cell types, we next sought to examine the functional impact of L-plastin expression and Ser5 phos-phorylation level in breast cancer cells with a specific focus on cell migration and invasion. To this end, we have selected four cell lines expressing contrasting endoge-nous levels of this protein.
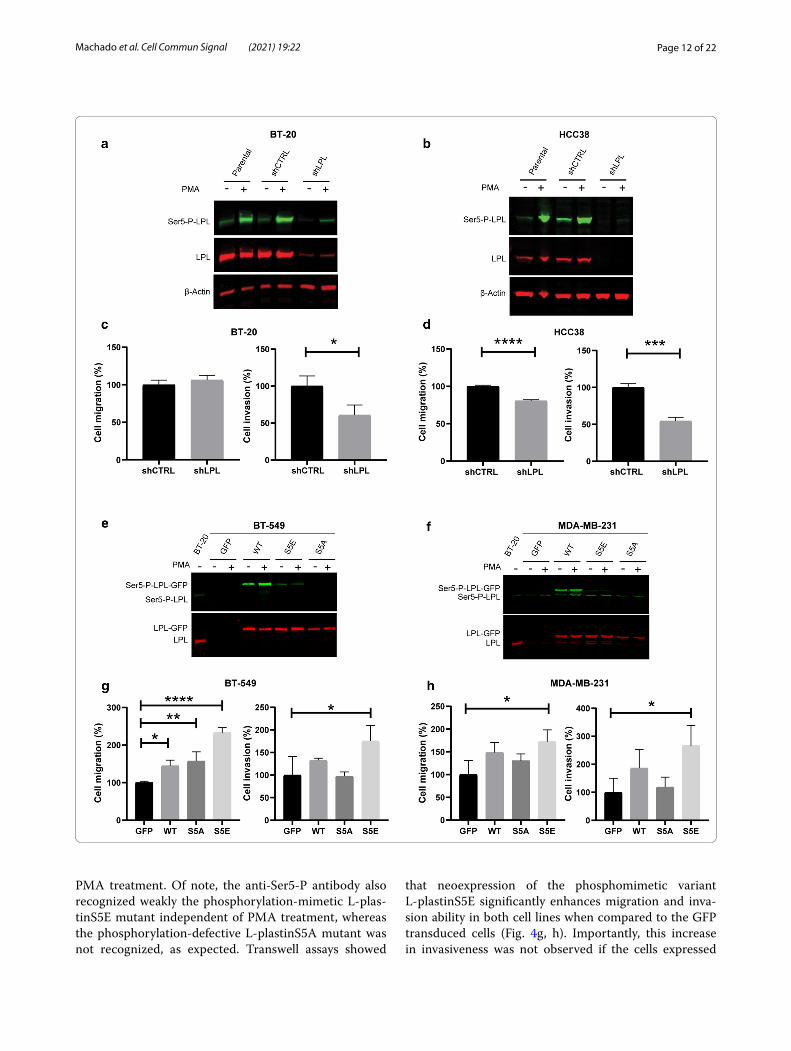
Initially, we set out to investigate the effect of L-plastin loss-of-function in cells naturally expressing high levels of L-plastin. For that purpose, we have silenced L-plas-tin expression in BT-20 and HCC38 cell lines. Charac-terization of the transduced cells by immunoblotting revealed that the downregulation was highly efficient in both cell lines (Fig. 4a, b). Following PMA stimulation, L-plastin Ser5 phosphorylation was strongly enhanced as monitored by the stronger band corresponding to Ser5 phosphorylated L-plastin (green). Even in the cells trans-duced with shRNA targeting L-plastin, PMA treatment could still induce Ser5 phosphorylation of the remaining L-plastin. Next, to determine whether L-plastin silencing has an impact on cell migration and invasion capacity, we performed transwell assays with the transduced cells. We observed that the Matrigel invasion ability was sig-nificantly reduced in both cell lines whereas the transwell migration was only significantly reduced in HCC38 cells (Fig. 4c, d).
In parallel, we have neoexpressed GFP-fused L-plastin wild type (WT) or the phosphorylation variants L-plas-tin Ser5Ala (S5A) or L-plastin Ser5Glu (S5E) in BT-549 and MDA-MB-231 cell lines, which display no or a low level of endogenous L-plastin, respectively. Immunoblot analysis showed a band corresponding to L-plastin-GFP (red) for all the transduced cell clones, except for the one transduced with GFP alone (Fig. 4e, f ). Consistently, L-plastin Ser5 phosphorylation was enhanced following
Fig. 4 L‑plastin Ser5 phosphorylation is important for migration and invasion of breast cancer cells in vitro. a, b L‑plastin (red) and Ser5‑P‑L‑plastin (green) immunoblotting of BT‑20 (a) and HCC38 cells (b) transduced with shRNA control (shCTRL) and shRNA targeting L‑plastin (shLPL). Cells were treated with 0.1 µM PMA for 1 h. β‑actin (red) was stained as a loading control. c, d Statistical plots of transwell migration and Matrigel‑coated transwell invasion assays. The number of cells which crossed the membrane was assessed after a 24 h incubation period and five fields at 20 × magnification objective were counted for each well. Three independent experiments were performed for each assay. Results are expressed as means ± SEM. Student’s t‑test (*p < 0.05, ***p < 0.001, ****p < 0.0001). E) and F) L‑plastin (red) and Ser5‑P‑L‑plastin (green) immunoblotting of BT‑549 (e) and MDA‑MB‑231 cells (f) transduced with GFP or GFP‑fused L‑plastinWT or the phosphorylation variants L‑plastin S5E or L‑plastin S5A. Cells were treated with 0.1 µM PMA for 1 h. BT‑20 cell extract was loaded as a control for endogenous L‑plastin expression. g, h Statistical plots of transwell migration and Matrigel‑coated transwell invasion assays. The assays were performed as described under (c, d). Results are expressed as means ± SEM of three independent experiments. One way ANOVA followed by Dunnett’s multiple comparison test relative to GFP transduced cells (*p < 0.05, **p < 0.01, ****p < 0.0001)
(See figure on next page.)
Page 12 of 22Machado et al. Cell Commun Signal (2021) 19:22
PMA treatment. Of note, the anti-Ser5-P antibody also recognized weakly the phosphorylation-mimetic L-plas-tinS5E mutant independent of PMA treatment, whereas the phosphorylation-defective L-plastinS5A mutant was not recognized, as expected. Transwell assays showed
that neoexpression of the phosphomimetic variant L-plastinS5E significantly enhances migration and inva-sion ability in both cell lines when compared to the GFP transduced cells (Fig. 4g, h). Importantly, this increase in invasiveness was not observed if the cells expressed

Page 13 of 22Machado et al. Cell Commun Signal (2021) 19:22
the non-phosphorylatable L-plastinS5A variant. A slight increase could also be detected for L-plastinWT-GFP expressing cells, although these differences were statisti-cally significant only for BT-549 cell migration.
Overall, these results indicate that, in addition to L-plastin expression, L-plastin Ser5 phosphorylation is required to promote breast cancer cell migration and invasion.
L‑plastin Ser5 phosphorylation promotes L‑plastin recruitment to invadopodiaTo further assess the role of L-plastin Ser5 phospho-rylation in regulating cell migration and invasion, we performed confocal microscopy to characterize the sub-cellular localization of L-plastin phosphorylation variants in MDA-MB-231 cells.
Consistently, we observed that neoexpressed L-plas-tin was localized in actin-rich migratory structures and colocalized with actin and cortactin in invadopodia, with cortactin being a widely used marker of invadopodia. Invadopodia were identified as cortactin- and F-actin-containing punctae (Fig. 5a). To investigate if L-plastin regulates invadopodia formation, the number of inva-dopodia per cell was determined. We observed a slight increase in invadopodia density in cells expressing the phosphomimetic L-plastinS5E variant when compared to the other conditions; however, this difference was not significant (Fig. 5b). In addition, we assessed the abil-ity of L-plastin variants to be recruited to invadopodia. Remarkably, the quantification of GFP positive invadopo-dia showed that the non-phosphorylatable L-plastinS5A invadopodia localization was around two-fold lower as compared to L-plastinWT or the phosphomimetic L-plastinS5E, suggesting that L-plastin Ser5 phospho-rylation is critical for L-plastin recruitment to invadopo-dia (Fig. 5c). To strengthen this finding, we investigated the intracellular localization of Ser5 phosphorylated L-plastin using the anti-Ser5-P antibody. This approach revealed that the L-plastin recruited to invadopodia is
essentially the phosphorylated form (Fig. 5d). Altogether, our results indicate that L-plastin expression does not affect invadopodia formation, but Ser5 phosphorylation facilitates L-plastin recruitment to these structures.
L‑plastin Ser5 phosphorylation does not enhance L‑plastin/cortactin interactionWe have previously shown that the invadopodia marker cortactin efficiently co-precipitated with L-plastinWT extracted from PMA-treated MCF7 cells [12]. Given the regulatory role of cortactin in invadopodia formation, function and assembly and knowing that cortactin acts as a scaffold protein [38], we wanted to further explore this interaction and the possible binding preference of cort-actin to the Ser5 phosphorylated form of L-plastin, To this end, we performed co-immunoprecipitation experi-ments using GFP-nanotrap on whole-cell lysates from transfected HEK 293T cells. First, we tested if the pres-ence of the C-terminal ABD2 (actin-binding domain 2) of L-plastin is necessary for its interaction with cortactin. To this end, we used the GFP-tagged L-plastinEF-ABD1 recombinant protein, which lacks ABD2. We certified that PMA stimulation leads to Ser5 phosphorylation of L-plastinEF-ABD1 at a similar level as compared to L-plastinWT (Fig. 6a). Cell lysates of cells transfected with GFP, L-plastinWT-GFP or L-plastinEF-ABD1-GFP treated with PMA were then submitted to GFP-nanotrap with subsequent immunoblotting (Fig. 6b). We confirmed that endogenous cortactin interacts with L-plastinWT, but the expression of L-plastinEF-ABD1 recombinant protein is not sufficient to preserve this interaction.
To investigate if Ser5 phosphorylation is essential for L-plastin/cortactin interaction, we then trans-fected HEK 293T cells with the GFP-tagged L-plastin phosphorylation variants (Fig. 6c). PMA stimulation of HEK 293T cells expressing L-plastinWT or expres-sion of the phospho-mimetic L-plastinS5E did not enhance L-plastin/cortactin interaction. Likewise, the non-phosphorylatable L-plastinS5A mutant was
(See figure on next page.)Fig. 5 Ser5 phosphorylation enhances L‑plastin recruitment to invadopodia in MDA‑MB‑231 cells. a Expression pattern of the transduced MDA‑MB‑231 cells expressing the different GFP‑fused L‑plastin constructs. Cells were plated on gelatin‑coated coverslips for 24 h and stained using anti‑cortactin (blue) and Alexa Fluor 594‑conjugated phalloidin (red) to visualize F‑actin. GFP signal was amplified using the Alexa Fluor 488‑conjugated GFP booster. Scale bar: 20 µm. Areas of actin, cortactin and L‑plastin co‑localization are seen in the overlay as white dot‑like structures (right column). The insets show a higher magnification of the boxed areas. b Quantification of cortactin and F‑actin‑containing punctae per cell was performed using single confocal slices of the ventral surface of cells. Results are expressed as means ± SEM of three independent experiments in which 60–80 cells per conditions were assessed. One way ANOVA comparing all four groups showed no significance. c Percentage of GFP‑positive invadopodia. Results are expressed as means ± SEM of three independent experiments. One way ANOVA followed by Tukey’s multiple comparison test (*p < 0.05). d Co‑localization of Ser5 phosphorylated L‑plastin with actin and cortactin in MDA‑MB‑231 cells. Cells were plated onto gelatin‑coated coverslips for 24 h and stained using anti‑cortactin (blue) and anti‑Ser5‑P‑L‑plastin (red) antibodies, followed by Alexa Fluor 633‑conjugated phalloidin (magenta) to stain F‑actin. Arrowheads point to areas of co‑localization of proteins, which are seen in the overlay as white dot‑like structures (right column). Scale bar: 10 µm

Page 14 of 22Machado et al. Cell Commun Signal (2021) 19:22
able to co-precipitate cortactin with similar efficiency than L-plastinWT or L-plastinS5E. These observa-tions show that Ser5 phosphorylation is not required for binding and does not enhance L-plastin/cortactin interaction.
L‑plastin Ser5 phosphorylation enhances ECM degradation abilityECM degradation activity is typically executed by mature invadopodia [39]. To monitor the impact of Ser5 phos-phorylation on ECM degradation capacity, transduced MDA-MB-231 cells were plated onto fluorescent gel-atin-coated coverslips (Fig. 7a). The total number of

Page 15 of 22Machado et al. Cell Commun Signal (2021) 19:22
cells associated with gelatin degradation did not change significantly upon expression of L-plastin wild type or phosphorylation variants (Fig. 7b). However, an increase in gelatin degradation area was found for cells express-ing L-plastinWT and the cells expressing the phospho-mimetic L-plastinS5E variant were found to have the highest gelatin degradation ability as compared to GFP expressing control cells (Fig. 7c).
Greater invasive and migratory capacities are often accompanied by elevated levels of MMPs, such as MMP-2 and MMP-9 [40]. To test a possible role for L-plastin in the secretion of MMPs, we performed gela-tin zymography on conditioned media of transduced MDA-MB-231 cells. Only the active forms of MMP-2 (65 kDa) and MMP-9 (82 kDa) were detected in the con-ditioned media. The results illustrated in Fig. 7d indicate that MMP-9, based on its gelatinase activity and appar-ent molecular weight, is the most prominent secreted protease in MDA-MB-231 breast cancer cells. Although all the L-plastin variants induced an increase in the activ-ity of MMP-9, the quantification of the observed differ-ences showed significance (~ twofold increase) only for the S5E variant when compared with GFP control sam-ples. Collectively, our results suggest that L-plastin Ser5
phosphorylation enhances MMP-9 activity and concomi-tant ECM degradation.
DiscussionPost-translational modifications (PTMs) are critical for protein function and play pivotal roles in cellular home-ostasis. Aberrant PTM may contribute to pathogenesis and has been associated with numerous diseases, includ-ing cancer [41]. This implies that the exclusive analysis of genetic variations and protein expression levels may often be insufficient or even misleading [42]. In particu-lar, protein phosphorylation displays the largest number of disease associations among PTMs and is especially relevant for breast cancer [41]. Since protein phospho-rylation is frequently altered as a consequence of cancer driver gene mutations and concomitant aberrant signal transduction, phosphoproteome analysis is indispensable for the understanding of disease mechanisms and may have diagnostic and therapeutic relevance [43].
Here, we aimed at exploring the interplay between ERK/MAPK and PI3K/AKT pathways in regulating L-plastin Ser5 phosphorylation. To this end, we per-formed immunoblot analysis to assess the activation status of four different output nodes in four breast can-cer cell lines in 20 different experimental conditions. In
Fig. 6 L‑plastin Ser5 phosphorylation is not required for L‑plastin/cortactin interaction. a L‑plastinEF‑ABD1 is phosphorylated upon PMA stimulation. HEK 293T cells were transfected with L‑plastinWT‑GFP or L‑plastinEF‑ABD1‑GFP. Cells were treated with or without 0.1 μM PMA for 1 h and whole‑cell lysates were submitted to L‑plastin (red) and Ser5‑P‑L‑plastin (green) immunoblotting. b Co‑immunoprecipitation of cortactin with L‑plastinWT in HEK 293T cells. Cells were transfected with GFP, L‑plastinWT‑GFP or L‑plastinEF‑ABD1‑GFP and treated with 0.1 μM PMA for 1 h. Following cell lysis, protein extracts were subjected to immunoprecipitation with GFP‑nanotrap. Aliquots of input [In], non‑bound [NB], and bound [B] fractions were separated by SDS‑PAGE and proteins were visualized by immunoblotting using an anti‑cortactin antibody (#05‑180). In the bound fraction, an intense unspecific signal is visible that corresponds to the important amount of precipitated L‑plastinWT‑GFP or L‑plastinEF‑ABD1‑GFP. C) Co‑immunoprecipitation of cortactin with L‑plastinWT and L‑plastin phosphovariants. Cells were transfected with GFP, L‑plastinWT‑GFP, L‑plastinS5E‑GFP and L‑plastinS5A‑GFP and treated with or without 0.1 μM PMA for 1 h. Protein extracts were subjected to immunoprecipitation with GFP‑nanotrap. Aliquots of input [In], non‑bound [NB], and bound [B] fractions were separated by SDS‑PAGE and proteins were visualized by immunoblotting using an anti‑cortactin antibody (#sc‑11408). In the bound fraction, an intense unspecific signal is visible that corresponds to the important amount of precipitated L‑plastin‑GFP variants

Page 16 of 22Machado et al. Cell Commun Signal (2021) 19:22
addition to phosphorylated L-plastin (pSer5) as an out-put node, we analyzed phosphorylated ERK (pTyr204) and phosphorylated AKT (pSer473) as read-outs for acti-vated ERK/MAPK and PI3K/AKT pathways, respectively.
As a fourth output node, we monitored phosphoryl-ated c-Src (pTyr416), since activated c-Src is known to be important for tumorigenesis and cancer progression and has been previously implicated in the regulation of
Fig. 7 Cells expressing the phosphomimetic L‑plastinS5E variant exhibit higher ability to degrade gelatin. a Representative images of the transduced MDA‑MB‑231 cells expressing the different GFP‑fused L‑plastin variants and degraded gelatin. Cells were plated on Alexa Fluor 568‑labeled gelatin (red)‑coated coverslips for 6 h and stained using Alexa Fluor 633‑conjugated phalloidin (magenta) to visualize F‑actin. GFP signal was amplified using the Alexa Fluor 488‑conjugated GFP booster. Single confocal slices of the ventral surface of cells are shown. Areas of gelatin degradation can be identified as dark spots. Scale bar: 20 µm. b Quantification of cells associated with gelatin degradation. Results are expressed as means ± SEM of three independent experiments in which 100–150 cells per condition were assessed. One way ANOVA comparing all four groups showed no significance. c Quantification of the total degradation area normalized against total cell area. Results are expressed as means ± SEM of three independent experiments. One way ANOVA followed by Dunnett’s multiple comparison test relative to GFP transduced cells (*p < 0.05). d MMP activities measured by gelatin zymography. Conditioned media were collected after 24 h and equal amounts were loaded on the gel. Shown is a representative gel. The graph shows the densitometry of the MMP‑9 degraded band relative to GFP control sample. Results are expressed as means ± SEM of three independent experiments. One way ANOVA followed by Dunnett’s multiple comparison test relative to GFP transduced cells (*p < 0.05)

Page 17 of 22Machado et al. Cell Commun Signal (2021) 19:22
several signalling processes, including ERK/MAPK and PI3K/AKT pathways [44]. We have stimulated the cells with the growth factors for which they express the corre-sponding receptor. As inhibitors, we selected a MEK and an AKT inhibitor, to block the ERK/MAPK and PI3K/AKT pathways, respectively. Additionally, a FAK inhibi-tor was used, as FAK is a key molecule in invasion and metastasis and activates both ERK/MAPK and PI3K/AKT pathways [45].
Performing computational modelling based on our experimental data, we confirmed that the ERK/MAPK pathway plays a major role in L-plastin Ser5 phosphoryl-ation. In addition, we found that the PI3K pathway likely contributes to this process via downstream SGK kinases, rather than via AKT. Our in vitro kinase assay comparing the three isoforms SGK1, SGK2 and SGK3 showed that Ser5 phosphorylation of full-lengh L-plastin is primar-ily mediated by the SGK3 isoform. Notably, in cells, full activation of SGK3 requires plasma or endosomal mem-brane localization [25, 46] mediated by the interaction of its Phox homology (PX) domain with PtdIns(3)P [47, 48]. Since myristoylation is known to target proteins to membranes [49], myristoylation of SGK3 has been shown to artificially enable full activation of SGK3 without exog-enous stimulation by growth factors [22]. Here, L-plastin Ser5 phosphorylation was highly increased when co-expressed with activated myristoylated SGK3, corrobo-rating the capacity of SGK3 to phosphorylate residue Ser5 of L-plastin in cells.
To further assess the contribution of the PI3K path-way in L-plastin Ser5 phosphorylation, we treated BT-20, HCC38 and SKBR3 cells with two drugs Apitolisib as a PI3K/mTOR inhibitor and Trametinib as a MEK inhibi-tor to inhibit the PI3K pathway and the ERK/MAPK pathway, respectively. The dual PI3K/mTOR inhibi-tor Apitolisib was chosen in order to block both PDK1, which is downstream of PI3K, and mTORC2, and thus, to inhibit the activation of SGK3, which requires phospho-rylation by the two kinases [50]. In HCC38 cells, PI3K/mTOR inhibition had no major effect on HGF-triggered L-plastin Ser5 phosphorylation as compared to MEK inhibition, which strongly impaired this phosphorylation event. In contrast, in SKBR3 cells, inhibition of the PI3K/mTOR pathway reduced L-plastin Ser5 phosphoryla-tion by 50%, and in BT-20 cells, PI3K/mTOR inhibition and MEK inhibition acted in a synergistic way to reduce this phosphorylation to background levels, suggesting that PI3K and mTOR are important for HGF-dependent L-plastin Ser5 phosphorylation in these two cell lines. Taken together, our results corroborate that the ERK/MAPK pathway is predominant for triggering L-plastin Ser5 phosphorylation. Importantly, the PI3K pathway contributes to this phosphorylation event depending on
the investigated cell line. For BT-20 cells, this involve-ment may be explained by the presence of an activat-ing mutation in the PI3KCA gene, which confers a gain of function to the p110α catalytic subunit of class IA PI3K and promotes PI3K-dependent tumorigenesis [51]. Oncogenic mutations in PIK3CA are found in approxi-mately 25% of breast cancers [3]. Importantly, PI3KCA-mutant cells that lack AKT activation display a functional dependency on SGK3, which shares a consensus phos-phorylation motif with AKT [52]. The mechanism linking oncogenic PI3KCA to SGK3 activation and concomitant AKT suppression involves the phosphoinositide phos-phatase INPP4B, and both SGK3 and INPP4B have been suggested to have oncogenic functions [53].
Only few studies have reported so far a link between the PI3K pathway and L-plastin regulation and most of these studies have focused on the PI3K/AKT axis. In chronic lymphocytic leukemia, inhibition studies provided evi-dence for a role of PI3K in B-cell receptor-induced L-plastin activation through promoting Ser5 phosphoryl-ation [54]. Moreover, in a prostate cancer study, the PI3K/AKT pathway was found to upregulate L-plastin expres-sion levels through upregulation of the transcription activator AP4 [55]. This study showed that L-plastin is a key player in AP4-mediated prostate cancer cell migra-tion, invasion and proliferation. Importantly, L-plastin and AP4 protein levels were also found to be upregulated in prostate cancer tissues as compared to adjacent nor-mal tissues and correlated with lymph node metastasis. On the other hand, L-plastin has also been shown to play an upstream role in the regulation of the PI3K/AKT pathway, by promoting SDF-1α-dependent AKT Thr308 phosphorylation in human T-lymphocytes [56] or AKT Ser473 phosphorylation via regulation of the mTORC2 complex activity in a very recent hypereosinophilia study [57]. Most interestingly, immunohistochemical staining of bladder cancer tissues revealed a significant positive correlation between pAKT and L-plastin expression as well as a significant correlation between L-plastin expres-sion and tumor histological grade, stage and growth pat-tern [58]. In our study, our experimental data corroborate our computational modelling predictions and indicate that, depending on the cellular context, the PI3K/SGK3 axis represents an alternative oncogenic signalling path-way involved in L-plastin activation. Knowing that this PI3K-dependent, AKT-independent signalling axis signif-icantly contributes to cancer progression [59], it deserves close attention and SGK inhibitors might be promising therapeutic agents.
In a next step, we examined the functional impact of the L-plastin Ser5 phosphorylation event in breast cancer cells. Whereas calcium binding and oxidation of L-plastin inhibit the actin-bundling activity of L-plastin [60–63],

Page 18 of 22Machado et al. Cell Commun Signal (2021) 19:22
Ser5 phosphorylation is known to promote its targeting to actin-rich structures and to increase its F-actin bun-dling activity in vitro and in cells [11, 12]. L-plastin phos-phorylation on residues Ser5 and Ser7 has been linked to bone resorption activity via nascent sealing zone and sealing ring formation in cultured osteoclasts and in mice [64, 65]. In T-cells, L-plastin Ser5 phosphorylation is important for immunological synapse maturation and stability and, thus, for proper T-cell activation [66, 67] and, in podocytes, this phosphorylation event promotes filopodia formation [68]. Most importantly, previous results obtained in cancer cells point to the importance of this phosphorylation event for in vitro invasion and in vivo metastasis formation of melanoma cells [69, 70]. Consistent with these findings, we demonstrate here that L-plastin Ser5 phosphorylation strongly promotes cell migration and invasion capacities in a breast cancer cell model.
The process of tumor cell invasion and metastasis is associated with the assembly of invadopodia, which are F-actin-rich protrusive structures capable of degrading the ECM. These structures are characterized by the pres-ence of the core proteins cortactin and Tks5. Moreover, they concentrate proteolytic activity and constitute the point of convergence of a plethora of signalling pathways [71]. Although, a dendritic actin network mediated by the Arp2/3 complex is known to be essential for invadopodia formation, there is increasing evidence that linear, bun-dled F-actin is also inherent to invadopodia [72, 73]. In addition to other actin-bundling proteins including fas-cin and α-actinin, a recent report has added L-plastin to the list of actin-bundling proteins found in invadopodia [19]. This study provided a model where L-plastin con-tributes to invadopodia extension, while protrusive force is guaranteed by fascin, which in turn, confers structural rigidity and stability [19]. In line, our results show that L-plastin ectopic expression does not affect invadopodia density in MDA-MB-231 cells, suggesting that L-plastin is not involved in the initial stage of invadopodia for-mation. Importantly, we found that Ser5 phosphoryla-tion promotes L-plastin recruitment to invadopodia and L-plastin localized in invadopodia is essentially the phos-phorylated form.
Since cortactin is considered as a scaffold protein in invadopodia [38], we wanted to better characterize the interaction between cortactin and L-plastin that we have shown before [12]. Our results indicate that the pres-ence of the L-plastin ABD2 domain is necessary for this interaction, but that Ser5 phosphorylation is not required for this interaction. Given that we have shown that Ser5 phosphorylation enhances L-plastin localization in invadopodia, we can speculate that the invadopodial
recruitment of L-plastin does not solely rely on its inter-action with cortactin.
Degradation of the ECM by podosomes and invado-podia occurs by localized secretion of specialized pro-teases [74]. However, the association between L-plastin and the regulation of matrix-degrading enzymes in these structures is largely unknown. Here we demon-strated that L-plastin Ser5 phosphorylation facilitates ECM degradation although it increases only weakly MMP-9 activity. An interesting approach to study the role of L-plastin in macrophage podosomes and cancer cell invadopodia was taken by the group of Jan Gette-mans, who produced nanobodies (Nb) either inhibiting L-plastin bundling activity (Nb5) or locking L-plastin in an inactivated state (Nb9) [75]. In macrophages, the expression as well as secretion and localization of the most prominent proteases MMP-2, MMP-9 and MMP-14, were found to be unaffected by both nanobodies [76]. Instead, the nanobodies induced podosome insta-bility by affecting the cyclic turnover of actin in the podosomes and, thereby, decreased podosome lifespan. The authors concluded that defective ECM degrada-tion observed in the nanobody-expressing cells was most likely associated with structural malformation of the podosomes [76]. Similarly, in PC-3 prostate cancer cells, the use of the L-plastin-specific nanobodies led to reduced degradation capacity of the cells [19]. Again, the bundling-inhibitor Nb5 had no effect on MMP-9 secretion and activity, confirming that Nb5-mediated reduction of degradation is not dependent on MMP-9 secretion and activity. More recently, Balta and col-laborators highlighted the existence of a link between L-plastin expression, total MMP activity and MMP-2 release in MV3 melanoma cells [63]. L-plastin and MMP-2 were found to localize in invadopodial exten-sions and to co-immunoprecipitate, indicating that L-plastin may help MMP-2 translocate to invadopodial structures. Similarly, cortactin was shown to regulate membrane trafficking to promote protease secretion for invadopodia-associated ECM degradation [77]. A more recent study revealed a role for both cortactin and fas-cin in the release of extracellular vesicles containing MMPs [78]. Notably, the involvement of fascin was not linked to its actin-bundling activity, but rather to its function in microtubule-regulation and endosomal traf-ficking. According to our results, L-plastin expression in MDA-MB-231 cells slightly increases MMP-9 activ-ity and has no influence on MMP-2. Despite the weak-ness of its influence on MMPs, we could demonstrate that L-plastin Ser5 phosphorylation strongly increases gelatin degradation capacity. Given that L-plastin Ser5 phosphorylation also increases its actin-bundling activ-ity [11], our results suggest that enhanced degradation

Page 19 of 22Machado et al. Cell Commun Signal (2021) 19:22
capacity of Ser5 phosphorylated L-plastin as com-pared to non-phosphorylated L-plastin is mainly due to enhanced bundling activity and only minimally due to enhanced MMP-9 activity.
Activation of invasion is a hallmark of metastatic cancers and understanding the cellular machinery that underlies invasion is critical for the establishment of novel predictive biomarkers and therapeutic targets. In this study, we have found that L-plastin Ser5 phos-phorylation promotes breast cancer cell invasion, L-plastin recruitment to invasive structures and degra-dation of the ECM. Furthermore, we have established
an involvement of the ERK/MAPK and PI3K path-ways in promoting L-plastin Ser5 phosphorylation in breast cancer cell lines. In a next step, we wanted to confirm these results in tissues by analyzing the exist-ence of potential correlations between L-plastin and ERK/MAPK or PI3K pathways in breast cancer tis-sue microarrays (TMAs). Surprisingly, we could not detect L-plastin in the carcinoma cells of the ana-lyzed TMAs when performing immunohistochemistry (IHC). As L-plastin expression and Ser5 phosphoryla-tion were detectable in infiltrated leukocytes, epitopes seem to have been preserved during sampling. This
Fig. 8 L‑plastin Ser5 phosphorylation cascade in cancer cells. The ERK/MAPK and PI3K pathways are frequently dysregulated in cancer. Upon activation of these signalling pathways, their downstream effector kinases RSK1/2 and SGK3, respectively, are able to phosphorylate L‑plastin on its residue Ser5. This phosphorylation leads to increased L‑plastin bundling activity as well as enhanced recruitment to invadopodia and ECM degradation, promoting the invasiveness of the cancer cell

Page 20 of 22Machado et al. Cell Commun Signal (2021) 19:22
result is surprising, because L-plastin expression in breast cancer tissues has been shown before by IHC [79, 80]. Other studies have also detected an expres-sion of L-plastin in breast cancer samples, but their methods did not take into account the heterogeneity of cancer tissues [81–83]. Whether L-plastin expres-sion in the carcinoma cells of our breast cancer TMAs was below threshold for detection in IHC remains to be established.
ConclusionsGiven the extensive crosstalk between the ERK/MAPK and PI3K pathways, blocking of one of the two pathways in anti-tumor therapy might be counteracted through activation of the other pathway. Therefore, combined therapy approaches concurrently blocking both pathways are expected to have more efficient anti-tumor activities. However, complete blocking of both signalling pathways might result in significant toxicity for non-transformed cells [5]. Taking all this into consideration, one can speculate that blocking a subset of downstream func-tions of both pathways might be an efficient approach. As illustrated in Fig. 8, our study has provided evidence that L-plastin is a downstream molecule of both ERK/MAPK and PI3K/SGK signalling pathways and, hence, represents a potential target for such an approach. Since L-plastin Ser5 phosphorylation promotes the recruit-ment of L-plastin to invadopodia, ECM degradation and invasion/migration of breast cancer cells, blocking this phosphorylation event might be an interesting alternative to reduce breast cancer cell invasiveness.
Supplementary informationThe online version contains supplementary material available at https ://doi.org/10.1186/s1296 4‑021‑00710 ‑5.
Additional file 1: Figure S1. Full‑length blots corresponding to the immunoblots presented in Figures 1B, 1C, 3A, 3B, 3C, 4A, 4B, 4E, 4F, 6A, 6B and 6C.
Additional file 2: Figure S4. Driver script for the modeling of cell signal‑ling with Dynamic Bayesian Networks. The file contains the Matlab com‑mands to reproduce the analysis with the FALCON toolbox.
Additional file 3: Figure S5. Matlab workspace containing the raw analysis results.
Additional file 4: Figure S6. Network definition for the post‑regulariza‑tion model.
Additional file 5: Figure S7. Summary spreadsheet containing the opti‑mal parameter values obtained by the FALCON analysis.
Additional file 6: Figure S8. Summary spreadsheet containing the node values for different network states under the optimal parametrization.
Additional file 7: Figure S9. Prior Knowledge network definition. The list of interactions specifies the topology of the signalling network used for the FALCON analysis.
Additional file 8: Figure S10. Constraints for the edge regularization. This empty file is used during the analysis to inform the algorithm that no prior information is used for constraining the regularization of the network model.
Additional file 9: Figure S11. Normalized activities for the different phos‑phoproteins and experimental conditions for the BT20 cell line.
Additional file 10: Figure S12. Normalized activities for the different phosphoproteins and experimental conditions for the HCC38 cell line.
Additional file 11: Figure S13. Normalized activities for the different phosphoproteins and experimental conditions for the MCF7 cell line.
Additional file 12: Figure S14. Normalized activities for the different phosphoproteins and experimental conditions for the SKBR3 cell line.
Additional file 13: Figure S2. The graphs show the ratio between the intensities obtained for phosphorylated (activated) protein versus total protein. Each ratio was then normalized to the mean of all the ratios obtained for one blot to make blots comparable by accounting for techni‑cal day‑to‑day variability. For representative purposes, data were scaled to the controls present on each blot and are represented as means +/‑ SEM of three independent experiments.
Additional file 14: Figure S3. A total of 2 μg recombinant full‑length MDM2 was incubated with 100 ng recombinant kinase and with 50 μM ATP in a reaction volume of 25 μl. A negative control reaction (CTRL) was performed by omitting a kinase. MDM2 Ser166 phosphorylation (red) and total MDM2 (green) were determined by immunoblot analysis.
AbbreviationsA: Apitolisib; ABD: Actin‑binding domain; AKT: RAC‑α serine/threonine kinase; ARP2/3: Actin‑related protein 2/3 complex; ATP: Adenosine triphosphate; BIC: Bayesian information criterion; BID: BiD1870, RSK inhibitor; CTRL: Control; DAPI: 4′,6‑Diamidino‑2‑phenylindole; E, Glu: Glutamic acid; ECM: Extracellular matrix; EDTA: Ethylenediaminetetraacetic acid; EGF: Epidermal growth factor; EGFR: Epidermal growth factor receptor; ERK: Extracellular signal regulated kinase (MAPK3); FAK: Focal adhesion kinase; GFP: Green fluorescent protein; HEK: Human embryonic kidney; HGF: Hepatocyte growth factor; HGFR: Hepatocyte growth factor receptor; IGF: Insulin‑like growth factor 1; IGF‑IR: Insulin‑like growth factor 1 receptor; IHC: Immunohistochemistry; INPP4B: Inositol polyphosphate‑4‑phosphatase type II B; kDa: Kilodalton; LPL: Total L‑plastin; MAPK: Mitogen‑activated protein kinase; MDM2: Mouse double minutes 2; MEK: Mitogen‑activated protein kinase kinase (MAP2K); MMP: Matrix metallo‑proteinase; MSE: Mean squared error; mTOR: Mammalian target of rapamycin; Nb: Nanobody; PBS: Phosphate‑buffered saline; PCR: Polymerase chain reac‑tion; PDK1: 3‑Phosphoinositide‑dependent protein kinase 1; PFA: Paraformal‑dehyde; PI3K: Phosphoinositide‑3 kinase; PI3KCA: Phosphoinositide‑3 kinase catalytic subunit α; PKA: Protein kinase A; PKC: Protein kinase C; PMA: Phorbol 12‑myristate 13‑acetate; p70S6K: P70 ribosomal protein S6 kinase; PTM: Post‑translational modification; rpm: Rotation per minute; ROI: Region of interest; RSK1: P90 ribosomal protein S6 kinase α‑1; RSK2: P90 ribosomal protein S6 kinase α‑3; RTK: Receptor tyrosine kinase (growth factor receptor); S, Ser: Ser‑ine; Ser5‑P‑LPL: Ser5 phosphorylated L‑plastin; SD: Standard deviation; SDF‑1α: Stromal cell‑derived factor 1α; SEM: Standard error of the mean; SGK: Serum/glucocorticoid regulated kinase; shRNA: Short hairpin RNA; Src: Sarcoma; T: Trametinib; Tks5: SH3 and PX domain‑containing protein 2A; TMA: Tissue microarray; WT: Wild type.
AcknowledgementsThe authors wish to thank Dr. Christelle Bahlawane, Sonia Frasquilho, Tobias Okello, and Dr. Yervand Karapetyan (Integrated Biobank of Luxembourg) for coordination, technical assistance and expert evaluation of immunohisto‑chemistry experiments. We also thank Christina Laurini and Marie Catillon for technical assistance with immunoblot analysis and plasmid construction as well as Dr. Andreas Girod for expert assistance with confocal microscopy analysis (DLSM, University of Luxembourg). The authors are grateful to Profes‑sor Dan Liu (Baylor College of Medicine, Houston, TX, USA) for providing SGK3 plasmids.

Page 21 of 22Machado et al. Cell Commun Signal (2021) 19:22
Authors’ contributionsESR conceived the study. RM, DS and ESR designed experiments and analyzed results. RM, DS and AB performed wet‑lab experiments. PL, SdL and TS contrib‑uted analytical tools and analyzed bioinformatics data. RM, SdL, TS and ESR wrote the manuscript. All authors read and approved the final manuscript.
FundingThis work was supported by a Grant from the Fondation Cancer Luxembourg (FC/2016/04).
Availability of data and materialsAll the datasets generated during this study and supporting the conclusions of this article are included within the article and its supplementary figures.
Ethics approval and consent to participateNot applicable.
Consent for publicationNot applicable.
Competing interestsThe authors declare that they have no competing interests.
Author details1 Cancer Cell Biology and Drug Discovery Group, Department of Life Sci‑ences and Medicine, Faculty of Science, Technology and Medicine, Univer‑sity of Luxembourg, CAMPUS Belval, BT1, 7, avenue des Hauts‑Fourneaux, 4362 Esch‑sur‑Alzette, Luxembourg. 2 Systems Biology Group, Department of Life Sciences and Medicine, University of Luxembourg, Esch‑sur‑Alzette, Luxembourg. 3 Present Address: Sensile Medical AG, Olten, Switzerland. 4 Present Address: Immune Systems Biology Group, Department of Infection and Immunity, Luxembourg Institute of Health, Esch‑sur‑Alzette, Luxembourg.
Received: 13 October 2020 Accepted: 18 January 2021
References 1. Day EK, Sosale NG, Lazzara MJ. Cell signaling regulation by protein
phosphorylation: a multivariate, heterogeneous, and context‑dependent process. Curr Opin Biotechnol. 2016;40:185–92.
2. Giancotti FG. Deregulation of cell signaling in cancer. FEBS Lett. 2014;588:2558–70.
3. Velloso FJ, Bianco AFR, Torres NEC, Chang TH, Sogayar MC. The crossroads of breast cancer progression: insights into the modulation of major signaling pathways. OncoTargets Ther. 2017;10:5491–524.
4. Bailey MH, Tokheim C, Porta‑Pardo E, Sengupta S, Bertrand D, Weerasin‑ghe A, et al. Comprehensive characterization of cancer driver genes and mutations. Cell. 2018;173(2):371‑385.e18.
5. De Luca A, Maiello MR, D’Alessio A, Pergameno M, Normanno N. The RAS/RAF/MEK/ERK and the PI3K/AKT signalling pathways: role in cancer pathogenesis and implications for therapeutic approaches. Expert Opin Ther Targets. 2012;16(SUPPL.2):S17‑27.
6. Cao Z, Liao Q, Su M, Huang K, Jin J, Cao D. AKT and ERK dual inhibitors: the way forward? Cancer Lett. 2019;459:30–40.
7. Morley SC. The actin‑bundling protein L‑plastin: a critical regulator of immune cell function. Int J Cell Biol. 2012;2012:1–10.
8. Lin CS, Park T, Chen ZP, Leavitt J. Human plastin genes. Comparative gene structure, chromosome location, and differential expression in normal and neoplastic cells. J Biol Chem. 1993;268(4):2781–92.
9. Park T, Chen ZP, Leavitt J. Activation of the leukocyte plastin gene occurs in most human cancer cells. Cancer Res. 1994;54(7):1775–81.
10. Morley SC. The actin‑bundling protein L‑plastin supports T‑cell motility and activation. Immunol Rev. 2013;256(1):48–62.
11. Janji B, Giganti A, De Corte V, Catillon M, Bruyneel E, Lentz D, et al. Phos‑phorylation on Ser5 increases the F‑actin‑binding activity of L‑plastin and promotes its targeting to sites of actin assembly in cells. J Cell Sci. 2006;119(9):1947–60.
12. Al Tanoury Z, Schaffner‑Reckinger E, Halavatyi A, Hoffmann C, Moes M, Hadzic E, et al. Quantitative kinetic study of the actin‑bundling protein L‑plastin and of its impact on actin turn‑over. PLoS ONE. 2010;5(2):e9210.
13. Lommel MJ, Trairatphisan P, Gäbler K, Laurini C, Muller A, Kaoma T, et al. L‑plastin Ser5 phosphorylation in breast cancer cells and in vitro is mediated by RSK downstream of the ERK/MAPK pathway. FASEB J. 2016;30(3):1218–33.
14. Shinomiya H, Hagi A, Fukuzumi M, Mizobuchi M, Hirata H, Utsumi S. Complete primary structure and phosphorylation site of the 65‑kDa macrophage protein phosphorylated by stimulation with bacterial lipopolysaccharide. J Immunol. 1995;154(7):3471–8.
15. Messier JM, Shaw LM, Chafel M, Matsudaira P, Mercurio AM. Fimbrin localized to an insoluble cytoskeletal fraction is constitutively phospho‑rylated on its headpiece domain in adherent macrophages. Cell Motil Cytoskeleton. 1993;25(3):223–33.
16. Marchisio PC, Cirillo D, Naldini L, Primavera MV, Teti A, Zambonin‑Zallone A. Cell‑substratum interaction of cultured avian osteoclasts is mediated by specific adhesion structures. J Cell Biol. 1984;99(5):1696–705.
17. Babb SG, Matsudaira P, Sato M, Correia I, Lim SS. Fimbrin in podosomes of monocyte‑derived osteoclasts. Cell Motil Cytoskelet. 1997;37(4):308–25.
18. Jones SL, Brown EJ. FcgammaRII‑mediated adhesion and phagocytosis induce L‑plastin phosphorylation in human neutrophils. J Biol Chem. 1996;271(24):14623–30.
19. Van Audenhove I, Denert M, Boucherie C, Pieters L, Cornelissen M, Gette‑mans J. Fascin rigidity and L‑plastin flexibility cooperate in cancer cell invadopodia and filopodia. J Biol Chem. 2016;291(17):9148–60.
20. Eddy RJ, Weidmann MD, Sharma VP, Condeelis JS. Tumor cell invado‑podia: invasive protrusions that orchestrate metastasis. Trends Cell Biol. 2017;27(8):595–607.
21. Samstag Y, Klemke M. Ectopic expression of L‑plastin in human tumor cells: diagnostic and therapeutic implications. Adv Enzyme Regul. 2007;47:118–26.
22. Liu D, Yang X, Songyang Z. Identification of CISK, a new member of the SGK kinase family that promotes IL‑3‑dependent survival. Curr Biol. 2000;10(19):1233–6.
23. Sever R, Brugge JS. Signal transduction in cancer. Cold Spring Harb Perspect Med. 2015;5(4):1–21.
24. Lemmon MA, Freed DM, Schlessinger J, Kiyatkin A. The dark side of cell signaling: positive roles for negative regulators. Cell. 2016;164:1172–84.
25. Lien EC, Dibble CC, Toker A. PI3K signaling in cancer: beyond AKT. Curr Opin Cell Biol. 2017;45:62–71.
26. Reddy RJ, Gajadhar AS, Swenson EJ, Rothenberg DA, Curran TG, White FM. Early signaling dynamics of the epidermal growth factor receptor. Proc Natl Acad Sci USA. 2016;113(11):3114–9.
27. Kim LC, Song L, Haura EB. Src kinases as therapeutic targets for cancer. Nat Rev Clin Oncol. 2009;6:587–95.
28. McLean GW, Carragher NO, Avizienyte E, Evans J, Brunton VG, Frame MC. The role of focal‑adhesion kinase in cancer—a new therapeutic opportu‑nity. Nat Rev Cancer. 2005;5:505–16.
29. Aksamitiene E, Achanta S, Kolch W, Kholodenko BN, Hoek JB, Kiyatkin A. Prolactin‑stimulated activation of ERK1/2 mitogen‑activated protein kinases is controlled by PI3‑kinase/Rac/PAK signaling pathway in breast cancer cells. Cell Signal. 2011;23:1794–805.
30. Allen‑Petersen BL, Carter CJ, Ohm AM, Reyland ME. Protein kinase Cδ is required for ErbB2‑driven mammary gland tumorigenesis and negatively correlates with prognosis in human breast cancer. Oncogene. 2014;33:1306–15.
31. Chiaradonna F, Balestrieri C, Gaglio D, Vanoni M. RAS and PKA path‑ways in cancer: new insight from transcriptional analysis. Front Biosci. 2008;13:5257–78.
32. Griner EM, Kazanietz MG. Protein kinase C and other diacylglycerol effec‑tors in cancer. Nat Rev Cancer. 2007;7:281–94.
33. De Landtsheer S, Trairatphisan P, Lucarelli P, Sauter T. FALCON: a toolbox for the fast contextualization of logical networks. Bioinformatics (Oxford, England). 2017;33(21):3431–6.
34. De Landtsheer S, Lucarelli P, Sauter T. Using regularization to infer cell line specificity in logical network models of signaling pathways. Front Physiol. 2018;9(MAY):1–13.
35. Burnham KP, Anderson DR. Multimodel inference: understanding AIC and BIC in model selection. Sociol Methods Res. 2004;33(2):261–304.
36. Díaz B. invadopodia detection and gelatin degradation assay. Bio Protoc. 2013;3(24):1–9.

Page 22 of 22Machado et al. Cell Commun Signal (2021) 19:22
37. Amato R, D’Antona L, Porciatti G, Agosti V, Menniti M, Rinaldo C, et al. Sgk1 activates MDM2‑dependent p53 degradation and affects cell proliferation, survival, and differentiation. J Mol Med. 2009;87(12):1221–39.
38. Jeannot P, Besson A. Cortactin function in invadopodia. Small GTPases. 2020;11(4):256–70.
39. Desai B, Ma T, Chellaiah MA. Invadopodia and matrix degradation, a new property of prostate cancer cells during migration and invasion. J Biol Chem. 2008;283(20):13856–66.
40. Gialeli C, Theocharis AD, Karamanos NK. Roles of matrix metalloprotein‑ases in cancer progression and their pharmacological targeting. FEBS J. 2011;278(1):16–27.
41. Xu H, Wang Y, Lin S, Deng W, Peng D, Cui Q, et al. DATABASE PTMD: a database of human disease‑associated post‑translational modifications. Genomics Proteomics Bioinform. 2018;16(4):244–51.
42. Yaffe MB. Why geneticists stole cancer research even though cancer is primarily a signaling disease. Sci Signal. 2019;12:eaaw3483.
43. Needham EJ, Parker BL, Burykin T, James DE, Humphrey SJ. Illuminating the dark phosphoproteome. Sci Signal. 2019;12:eaau8645.
44. Liu W, Kovacevic Z, Peng Z, Jin R, Wang P, Yue F, et al. The molecular effect of metastasis suppressors on Src signaling and tumorigenesis: new therapeu‑tic targets. Oncotarget. 2015;6(34):35522–41.
45. Golubovskaya VM. Targeting FAK in human cancer: from finding to first clini‑cal trials. Front Biosci. 2014;19:687–706.
46. Tessier M, Woodgett JR. Role of the Phox homology domain and phospho‑rylation in activation of serum and glucocorticoid‑regulated kinase‑3. J Biol Chem. 2006;281(33):23978–89.
47. Xu J, Liu D, Gill G, Songyang Z. Regulation of cytokine‑independent survival kinase (CISK) by the phox homology domain and phosphoinositides. J Cell Biol. 2001;154(4):699–705.
48. Bago R, Malik N, Munson MJ, Prescott AR, Davies P, Sommer E, et al. Charac‑terization of VPS34‑IN1, a selective inhibitor of Vps34, reveals that the phos‑phatidylinositol 3‑phosphate‑binding SGK3 protein kinase is a downstream target of class III phosphoinositide 3‑kinase. Biochem J. 2014;463:413–27.
49. Meinnel T, Dian C, Giglione C. Myristoylation, an ancient protein modi‑fication mirroring eukaryogenesis and evolution. Trends Biochem Sci. 2020;45:619–32.
50. Bruhn MA, Pearson RB, Hannan RD, Sheppard KE. Second AKT: the rise of SGK in cancer signalling. Growth Factors. 2010;28(6):394–408.
51. Zhao L, Vogt PK. Class I PI3K in oncogenic cellular transformation. Onco‑gene. 2008;27:5486–96.
52. Vasudevan KM, Barbie DA, Davies MA, Rabinovsky R, McNear CJ, Kim JJ, et al. AKT‑independent signaling downstream of oncogenic PIK3CA mutations in human cancer. Cancer Cell. 2009;16(1):21–32.
53. Gasser JA, Inuzuka H, Lau AW, Wei W, Beroukhim R, Toker A. SGK3 mediates INPP4B‑dependent PI3K signaling in breast cancer. Mol Cell. 2014;56(4):595–607.
54. Dubovsky JA, Chappell DL, Harrington BK, Agrawal K, Andritsos LA, Flynn JM, et al. Lymphocyte cytosolic protein 1 is a chronic lymphocytic leukemia membrane‑associated antigen critical to niche homing. Blood. 2013;122(19):3308–16.
55. Chen C, Cai Q, He W, Lam TB, Lin J, Zhao Y, et al. AP4 modulated by the PI3K/AKT pathway promotes prostate cancer proliferation and metastasis of prostate cancer via upregulating L‑plastin. Cell Death Dis. 2017;8(10):e3060.
56. Freeley M, O’Dowd F, Paul T, Kashanin D, Davies A, Kelleher D, et al. L‑plastin regulates polarization and migration in chemokine‑stimulated human T lymphocytes. J Immunol. 2012;188(12):6357–70.
57. Ma G, Gezer D, Herrmann O, Feldberg K, Schemionek M, Jawhar M, et al. LCP1 triggers mTORC2/AKT activity and is pharmacologically targeted by enzastaurin in hypereosinophilia. Mol Carcinog. 2020;59(1):87–103.
58. Harris LD, De La Cerda J, Tuziak T, Rosen D, Xiao L, Shen Y, et al. Analysis of the expression of biomarkers in urinary bladder cancer using a tissue micro‑array. Mol Carcinog. 2008;47(9):678–85.
59. Basnet R, Gong GQ, Li C, Wang MW. Serum and glucocorticoid inducible protein kinases (SGKs): a potential target for cancer intervention. Acta Pharm Sin B. 2018;8:767–71.
60. Namba Y, Ito M, Zu Y, Shigesada K, Maruyama K. Human T cell L‑plastin bundles actin filaments in a calcium‑dependent manner. J Biochem. 1992;112(4):503–7.
61. Schwebach CL, Agrawal R, Lindert S, Kudryashova E, Kudryashov DS. the roles of actin‑binding domains 1 and 2 in the calcium‑dependent regulation of actin filament bundling by human plastins. J Mol Biol. 2017;429:2490–508.
62. Ishida H, Jensen KV, Woodman AG, Hyndman ME, Vogel HJ. The calcium‑dependent switch helix of L‑plastin regulates actin bundling. Sci Rep. 2017;7:40662.
63. Balta E, Hardt R, Liang J, Kirchgessner H, Orlik C, Jahraus B, et al. Spatial oxida‑tion of L‑plastin downmodulates actin‑based functions of tumor cells. Nat Commun. 2019;10(1):4073.
64. Chellaiah MA, Majumdar S, Aljohani H. Peptidomimetic inhibitors of L‑plastin reduce the resorptive activity of osteoclast but not the bone forming activ‑ity of osteoblasts in vitro. PLoS ONE. 2018;13(9):e0204209.
65. Chellaiah MA, Moorer MC, Majumdar S, Aljohani H, Morley SC, Yingling V, et al. L‑Plastin deficiency produces increased trabecular bone due to attenuation of sealing ring formation and osteoclast dysfunction. Bone Res. 2020;8(3):1–10.
66. Wabnitz G, Balta E, Samstag Y. L‑plastin regulates the stability of the immune synapse of naive and effector T‑cells. Adv Biol Regul. 2017;63:107–14.
67. De Clercq S, Zwaenepoel O, Martens E, Vandekerckhove J, Guillabert A, Gettemans J. Nanobody‑induced perturbation of LFA‑1/L‑plastin phos‑phorylation impairs MTOC docking, immune synapse formation and T cell activation. Cell Mol Life Sci. 2013;70(5):909–22.
68. Schenk LK, Möller‑Kerutt A, Klosowski R, Wolters D, Schaffner‑Reckinger E, Weide T, et al. Angiotensin II regulates phosphorylation of actin‑associated proteins in human podocytes. FASEB J. 2017;31:5019–35.
69. Klemke M, Rafael MT, Wabnitz GH, Weschenfelder T, Konstandin MH, Garbi N, et al. Phosphorylation of ectopically expressed L‑plastin enhances inva‑siveness of human melanoma cells. Int J Cancer. 2007;120:2590–9.
70. Riplinger SM, Wabnitz GH, Kirchgessner H, Jahraus B, Lasitschka F, Schulte B, et al. Metastasis of prostate cancer and melanoma cells in a preclinical in vivo mouse model is enhanced by L‑plastin expression and phosphoryla‑tion. Mol Cancer. 2014;13(10):1–12.
71. Madsen CD, Sahai E. Cancer dissemination‑lessons from leukocytes. Dev Cell. 2010;19:13–26.
72. Li A, Dawson JC, Forero‑Vargas M, Spence HJ, Yu X, König I, et al. The actin‑bundling protein fascin stabilizes actin in invadopodia and potentiates protrusive invasion. Curr Biol. 2010;20(4):339–45.
73. Schoumacher M, Goldman RD, Louvard D, Vignjevic DM. Actin, microtu‑bules, and vimentin intermediate filaments cooperate for elongation of invadopodia. J Cell Biol. 2010;189(3):541–56.
74. Linder S. The matrix corroded: podosomes and invadopodia in extracellular matrix degradation. Trends Cell Biol. 2007;17(3):107–17.
75. Delanote V, Vanloo B, Catillon M, Friederich E, Vandekerckhove J, Gettemans J. An alpaca single‑domain antibody blocks filopodia formation by obstruct‑ing L‑plastin‑mediated F‑actin bundling. FASEB J. 2010;24(1):105–18.
76. De Clercq S, Boucherie C, Vandekerckhove J, Gettemans J, Guillabert A. L‑plastin nanobodies perturb matrix degradation, podosome formation, stability and lifetime in THP‑1 macrophages. PLoS ONE. 2013;8(11):1–16.
77. Clark ES, Weaver AM. A new role for cortactin in invadopodia: Regulation of protease secretion. Eur J Cell Biol. 2008;87:581–90.
78. Beghein E, Devriese D, Van Hoey E, Gettemans J. Cortactin and fascin‑1 regulate extracellular vesicle release by controlling endosomal trafficking or invadopodia formation and function. Sci Rep. 2018;8(1):15606.
79. Lapillonne A, Coue O, Friederich E, Nicolas A, Del Maestro L, Louvard D, et al. Expression patterns of L‑plastin isoform in normal and carcinomatous breast tissues. Anticancer Res. 2000;20(5A):3177–82.
80. Alldridge L, Metodieva G, Greenwood C, Al‑Janabi K, Thwaites L, Sauven P, et al. Proteome profiling of breast tumors by gel electrophoresis and nanoscale electrospray ionization mass spectrometry. J Proteome Res. 2008;7(4):1458–69.
81. Schulz DM, Böllner C, Thomas G, Atkinson M, Esposito I, Höfler H, et al. Identification of differentially expressed proteins in triple‑negative breast carcinomas using DIGE and mass spectrometry. J Proteome Res. 2009;8(7):3430–8.
82. Pillar N, Polsky AL, Shomron N. Dual inhibition of ABCE1 and LCP1 by microRNA‑96 results in an additive effect in breast cancer mouse model. Oncotarget. 2019;10(21):2086–94.
83. Tiedemann K, Sadvakassova G, Mikolajewicz N, Juhas M, Sabirova Z, Tabariès S, et al. Exosomal release of L‑plastin by breast cancer cells facilitates meta‑static bone osteolysis. Transl Oncol. 2019;12(3):462–74.
Publisher’s NoteSpringer Nature remains neutral with regard to jurisdictional claims in pub‑lished maps and institutional affiliations.