l-lysine production by corynebacterium...
TRANSCRIPT
1
L-lysine Production by
Corynebacterium glutamicum
Clay Swackhamer
Danielle Lesso
Casey Hall
Kashne Kamalanathan
BE 468
Microbiological Engineering
Department of Agricultural and Biological Engineering
The Pennsylvania State University
Spring 2015
2
Table of Contents Objective .........................................................................................................................................3
Introduction ....................................................................................................................................3
Production Capacity .....................................................................................................................5
Microorganism .............................................................................................................................5
Fermentation Parameters .............................................................................................................7
Fermentation Conditions ..............................................................................................................7
Medium ........................................................................................................................................8
Carbon Source ..............................................................................................................................9
Nitrogen Source ............................................................................................................................9
Micronutrients ............................................................................................................................10
Bioreactor design ........................................................................................................................10
Sterilization ................................................................................................................................20
Aeration and Agitation ................................................................................................................24
Aeration ......................................................................................................................................24
Agitation .....................................................................................................................................30
Downstream Processing...............................................................................................................35
Conclusion ....................................................................................................................................42
Limits and Recommendations ....................................................................................................44
Acknowledgements ......................................................................................................................46
References .....................................................................................................................................47
3
Objective
The objective is to produce industrial amounts of L-lysine for use as an animal feed additive. The goal is
to produce 25,000 tons, which is 3.125% of world production and 10% of United States production.
Introduction
Lysine is produced for both human consumption and animal feed. It is one of the nine essential amino
acids, which cannot be biosynthesized and thus must come from a dietary source (Anastassiadis, 2007). All amino
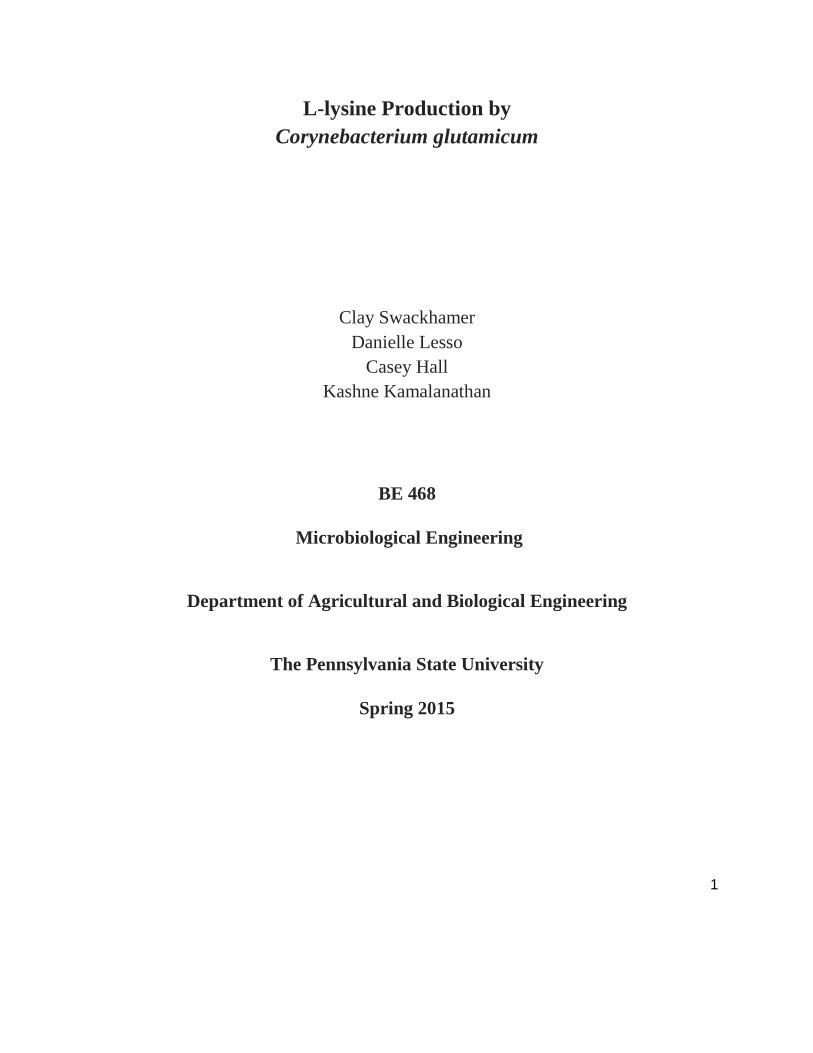
acids contain a chiral carbon, an amine group, and a carboxyl group, as well as an “R” group, which is different for
each amino acid. (Lysine K (Lys). 2003). L-Lysine is a basic amino acid, as the amine group tends to bear a positive
charge (-NH3+) and its PI is 9.75 (Lysine K (Lys). 2003). The PI is the isoelectric point of an amino acid, 9.75 for
L-Lysine.
Figure 1. Structure of L-Lysine (Univ. of Maryland, 2003).
In humans L-Lysine has been demonstrated as an important nutritional component, and is especially
important for healthy skin, nails, and even hair, as it is necessary for collagen production (Ehrlich, 2011). There is
also evidence that L-lysine consumption prevents the Herpes simplex virus from entering its lytic cycle (Ehrlich,
4
2011), and because of this is used as a preventative or maintenance therapy against outbreaks of this virus. Since
there are no biosynthetic pathways for L-Lysine in animals it can become a limiting factor in protein synthesis and
thus growth in agricultural production of animals (ADM, 2015). It provides proper digestible amino acid levels,
which are critical for production of lean meat. Furthermore, supplementing amino acids in animal feed allows
dietary crude protein to be reduced overall, and for every one percent decrease in dietary crude protein nitrogen in
manure is decreased 10%, ammonia emissions into the air decreased by 10%, water consumption of the animal
decreased by 3% and manure volume decreased by 5% (Kerr et al., 2003).
These may appear to be trivial benefits, but because of the massive scale of the global agricultural industry,
even modest improvements in optimizing animal processes are significant. There is an estimated global population
of 19 billion chickens kept for agricultural purposes at any given time (Counting Chickens, 2011). With the
estimated figure for manure production of chickens, (0.21 lb./day/animal) (Tao et al., 2008) the manure production
from chickens can be estimated as 1.89 billion pounds per day, and even a 5 percent decrease in manure production
would result in 94.5 million less pounds of manure each day that would need to be treated (Tao et al., 2008).
Nitrogen production is estimated as 0.0029 lb Nitrogen/day/animal and using this in addition to the potential for a
10% decrease in animal manure nitrogen content though overall crude protein decrease, a 5.5 million pound per day
decrease in the nitrogen produced globally by the poultry industry can be calculated (Tao et al., 2008). These sample
calculations show the potential for using L-lysine supplementation to optimize animal diets and also alleviate stress
on the environment caused by agricultural byproducts.
The main difference between L-lysine produced for human consumption and that produced for animal feed
is the level of purification of the final product. For human consumption, the form is typically that of a fine chemical
used as part of a supplement or higher chemical application; in contrast, lysine for animal feed can be within the
purity range of 35 to 80% (Anastassiadis, 2007). To determine the purity of the final product, downstream
processing options including ion exchange chromatography and drying can be chosen. In this application of lysine
production, the objective is to create a lysine product suitable for animal feed.
Use of traditional organic synthesis to create lysine results in a racemic mixture of both D- and L-lysine.
Even though primary production via this synthetic pathway is typically more economical than biological methods,

5
downstream processing is very difficult due to the problem of needing to separate the two stereoisomers, L-lysine
and D-lysine (Gorton, 1963). Since all known life can only metabolize L amino acids, D-Lysine produced in this
synthetic process is a waste product (Brignole and McDowell, 2001), and industrial processes to either convert it to
L-Lysine or remove it from racemic mixtures on a commercial scale are not attempted.
In order to achieve a production of L-lysine which results in a product that is biologically available, a
biological step must be introduced in production, preventing the appearance of the D-Lysine stereoisomer
(Anastassiadis, 2007). Use of a microbial fermentation absolves the need for separating the two optically active
forms (Anastassiadis, 2007), and also presents an opportunity to build on a process that has been employed since the
1960’s to produce L-Lysine (Toride, 2002). In a bacterial fermentation, a microorganism is used which is capable of
synthesizing the desired product, an amino acid, from nutrient sources which are inexpensive, such as simple
sources of carbon and nitrogen. In the case of commercial scale L-Lysine production, large investments in capital
are required in order to construct and operate the infrastructure through which the fermentation is conducted, which
includes reactors, heat exchangers, pumps, storage tanks, and downstream processing equipment (Humphrey and
Lee, 1992).
Production Capacity
Overall annual world production of L-lysine is about 800,000 tons (Anastassiadis, 2007). Assuming
owning 3.125% of the worldwide market, the objective for annual production of final product was selected to be
25,000 tons. The final product is about 60% pure, calculated on dry matter of L-lysine along with an equivalent
amount of hydrochloric acid.
Microorganism
The organism Corynebacterium glutamicum is used in industry to produce L-lysine through an aerobic
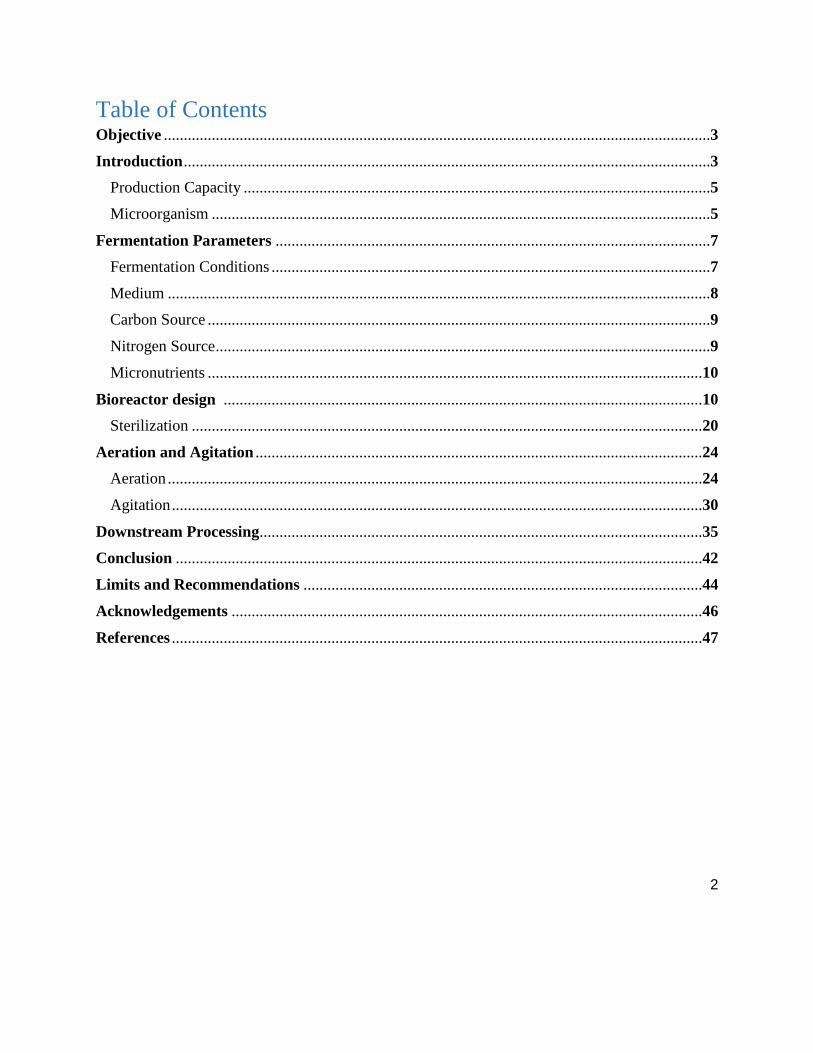
process (Anastassiadis, 2007). Figure 2 shows the biosynthesis of L-Lysine, in which a pathway is followed leading
from aspartate (which is itself derived from oxaloacetate, a Krebs cycle intermediate) through a series of
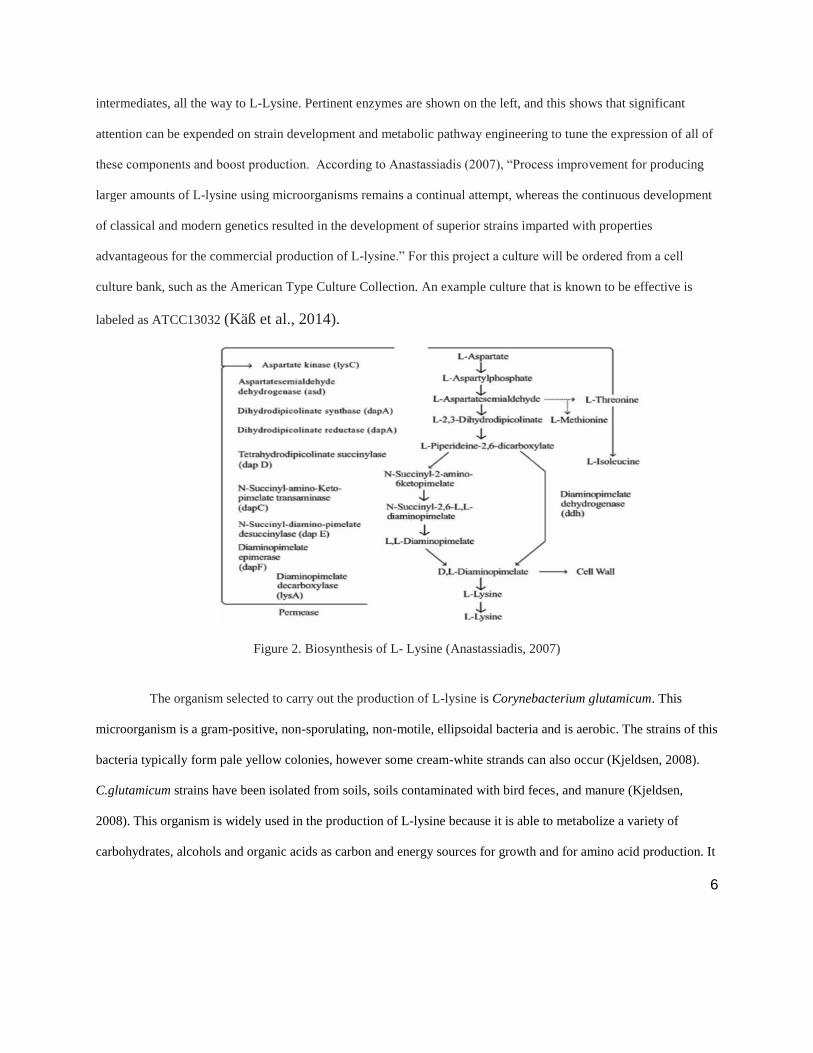
6
intermediates, all the way to L-Lysine. Pertinent enzymes are shown on the left, and this shows that significant
attention can be expended on strain development and metabolic pathway engineering to tune the expression of all of
these components and boost production. According to Anastassiadis (2007), “Process improvement for producing
larger amounts of L-lysine using microorganisms remains a continual attempt, whereas the continuous development
of classical and modern genetics resulted in the development of superior strains imparted with properties
advantageous for the commercial production of L-lysine.” For this project a culture will be ordered from a cell
culture bank, such as the American Type Culture Collection. An example culture that is known to be effective is
labeled as ATCC13032 (Käß et al., 2014).
Figure 2. Biosynthesis of L- Lysine (Anastassiadis, 2007)
The organism selected to carry out the production of L-lysine is Corynebacterium glutamicum. This
microorganism is a gram-positive, non-sporulating, non-motile, ellipsoidal bacteria and is aerobic. The strains of this
bacteria typically form pale yellow colonies, however some cream-white strands can also occur (Kjeldsen, 2008).
C.glutamicum strains have been isolated from soils, soils contaminated with bird feces, and manure (Kjeldsen,
2008). This organism is widely used in the production of L-lysine because it is able to metabolize a variety of
carbohydrates, alcohols and organic acids as carbon and energy sources for growth and for amino acid production. It
7
is also able to metabolize inorganic nitrogen sources such as ammonia. L-lysine is produced in about seven or ten
steps from its precursor oxalacetate. C. glutamicum has a respiratory metabolism, with oxygen as its terminal
electron acceptor. In addition, nitrate can serve as the electron acceptor (Kjeldsen, 2008).
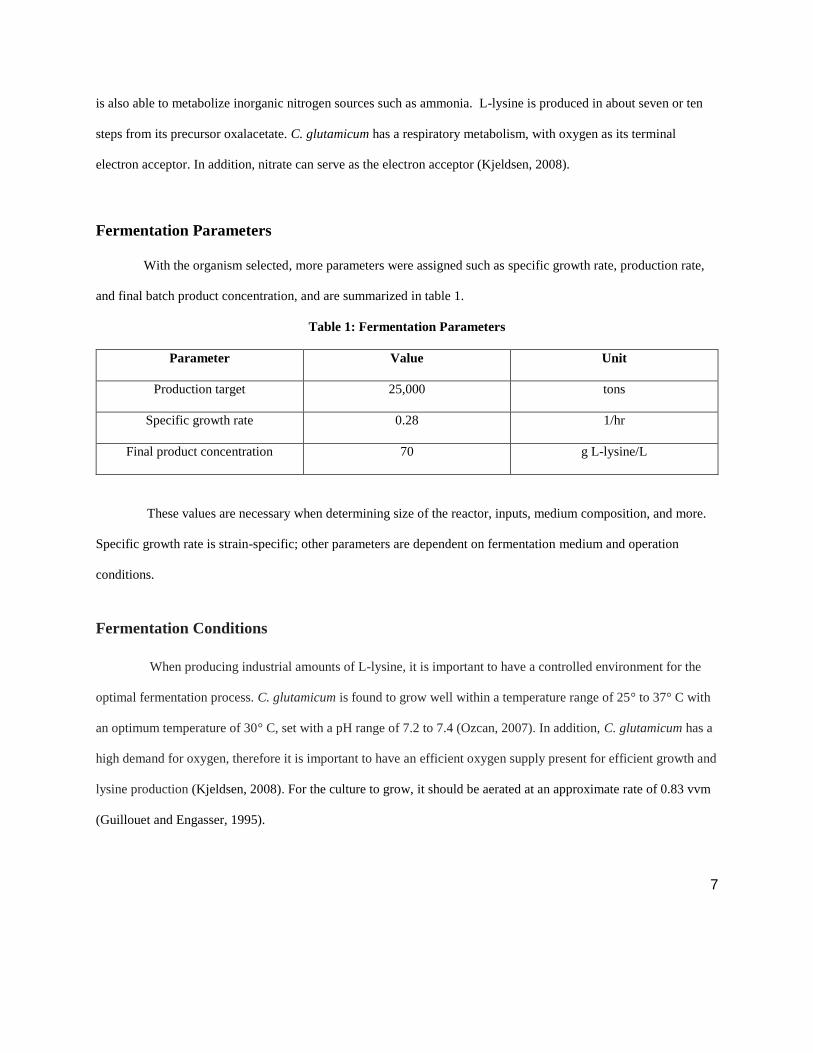
Fermentation Parameters
With the organism selected, more parameters were assigned such as specific growth rate, production rate,
and final batch product concentration, and are summarized in table 1.
Table 1: Fermentation Parameters
Parameter Value Unit
Production target 25,000 tons
Specific growth rate 0.28 1/hr
Final product concentration 70 g L-lysine/L
These values are necessary when determining size of the reactor, inputs, medium composition, and more.
Specific growth rate is strain-specific; other parameters are dependent on fermentation medium and operation
conditions.
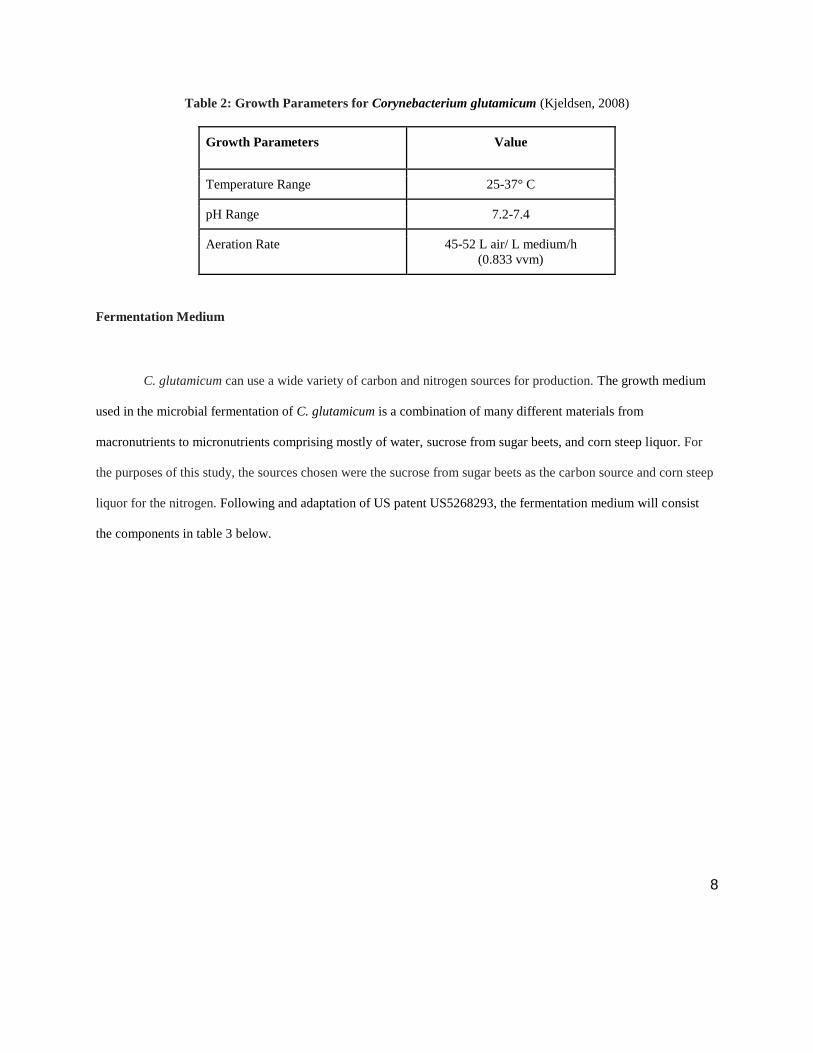
Fermentation Conditions
When producing industrial amounts of L-lysine, it is important to have a controlled environment for the
optimal fermentation process. C. glutamicum is found to grow well within a temperature range of 25° to 37° C with
an optimum temperature of 30° C, set with a pH range of 7.2 to 7.4 (Ozcan, 2007). In addition, C. glutamicum has a
high demand for oxygen, therefore it is important to have an efficient oxygen supply present for efficient growth and
lysine production (Kjeldsen, 2008). For the culture to grow, it should be aerated at an approximate rate of 0.83 vvm
(Guillouet and Engasser, 1995).
8
Table 2: Growth Parameters for Corynebacterium glutamicum (Kjeldsen, 2008)
Growth Parameters Value
Temperature Range 25-37° C
pH Range 7.2-7.4
Aeration Rate 45-52 L air/ L medium/h
(0.833 vvm)
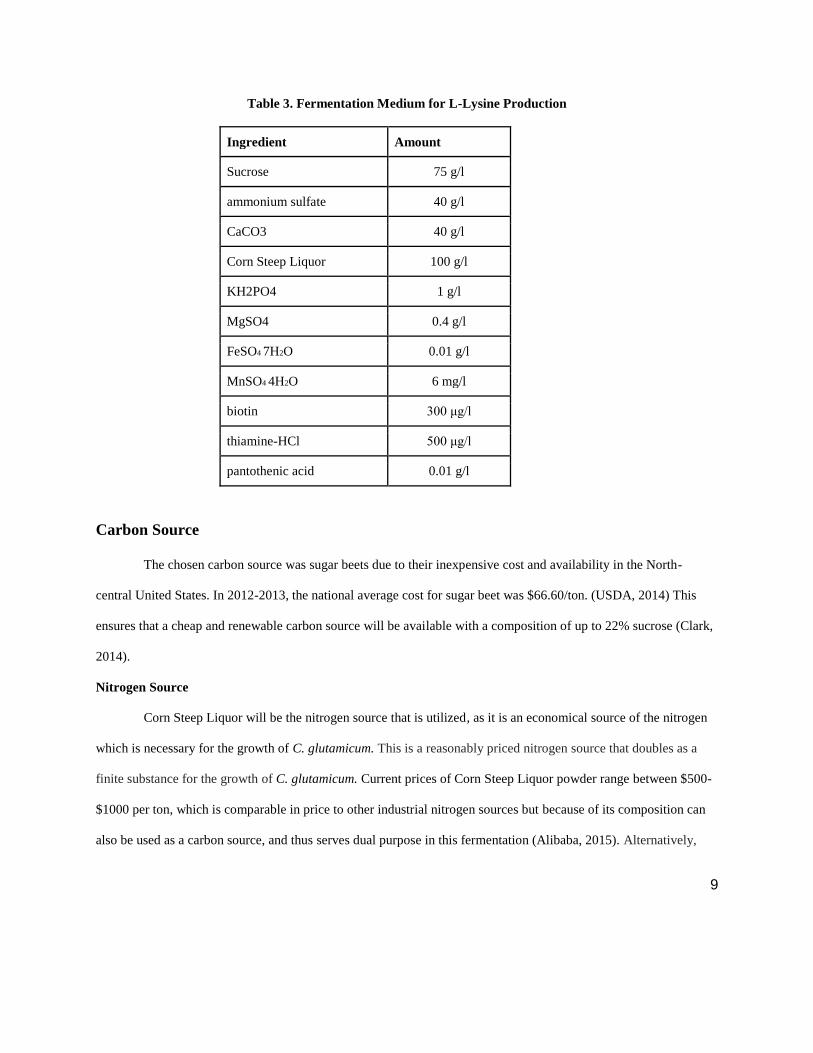
Fermentation Medium
C. glutamicum can use a wide variety of carbon and nitrogen sources for production. The growth medium
used in the microbial fermentation of C. glutamicum is a combination of many different materials from
macronutrients to micronutrients comprising mostly of water, sucrose from sugar beets, and corn steep liquor. For
the purposes of this study, the sources chosen were the sucrose from sugar beets as the carbon source and corn steep
liquor for the nitrogen. Following and adaptation of US patent US5268293, the fermentation medium will consist
the components in table 3 below.
9
Table 3. Fermentation Medium for L-Lysine Production
Ingredient Amount
Sucrose 75 g/l
ammonium sulfate 40 g/l
CaCO3 40 g/l
Corn Steep Liquor 100 g/l
KH2PO4 1 g/l
MgSO4 0.4 g/l
FeSO4 7H2O 0.01 g/l
MnSO4 4H2O 6 mg/l
biotin 300 μg/l
thiamine-HCl 500 μg/l
pantothenic acid 0.01 g/l
Carbon Source
The chosen carbon source was sugar beets due to their inexpensive cost and availability in the North-
central United States. In 2012-2013, the national average cost for sugar beet was $66.60/ton. (USDA, 2014) This
ensures that a cheap and renewable carbon source will be available with a composition of up to 22% sucrose (Clark,
2014).
Nitrogen Source
Corn Steep Liquor will be the nitrogen source that is utilized, as it is an economical source of the nitrogen
which is necessary for the growth of C. glutamicum. This is a reasonably priced nitrogen source that doubles as a
finite substance for the growth of C. glutamicum. Current prices of Corn Steep Liquor powder range between $500-
$1000 per ton, which is comparable in price to other industrial nitrogen sources but because of its composition can
also be used as a carbon source, and thus serves dual purpose in this fermentation (Alibaba, 2015). Alternatively,
10
protein hydrolyzate, corn steep liquor, meat extract or yeast extract containing nitrogen substances can be added
(Pythia, 2006).
Micronutrients
Micronutrients are necessary for a variety of reasons. Iron is important for its participation in electron
transport chain components, Magnesium as a cofactor for DNA repair proteins, and Biotin (B7) for fatty acid
biosynthesis, gluconeogenesis, and amino acid metabolism (Aragony, 2013). Other compounds are used as growth
factors, cofactors, or can play a role in ion-exchange. Covalent bonding is used for enzyme immobilization, however
the functional groups on cell and support material surfaces are not suitable for covalent binding (Shuler and Kargi,
2002). For this reason, charged ions or ionic compounds such as Fe, Mg, Mn and others are added to fermentation
medium to assist in enzyme mobilization.
Some strains of amino acid producing microorganisms are auxotrophic for certain substances, and
according to the Pythia Institute of Biotechnology, these mutant strains require the input of these additional
substances into the culture medium.
Bioreactor design
Considering the goal yield of 25,000 tons/yr of lysine, several pieces of information must be discovered in
order to calculate the number of reactors and volume of reactors for production use. First, the feasible concentration
of lysine that will be produced in the fermentation broth is needed, and an acceptable concentration value of 70 g/L
was discovered in the literature (Heinzle et al., 2006). Next, equation 1 is devised to calculate the total volume that
will need to be processed in order to achieve the yearly production goal, assuming 100 percent product recovery.
𝑔𝑜𝑎𝑙 = 50,000 𝑡𝑜𝑛
𝑦𝑒𝑎𝑟∗
2,000𝑙𝑏
𝑡𝑜𝑛∗
0.454 𝑘𝑔
𝑙𝑏∗
1000𝑔
𝑘𝑔∗
1 𝐿
70 𝑔 𝐿−𝑙𝑦𝑠𝑖𝑛𝑒 Eqn. 1
𝑔𝑜𝑎𝑙 = 6.5 ∗ 108 𝐿
𝑦𝑟= 650 𝑚𝑖𝑙𝑙𝑖𝑜𝑛
𝐿
𝑦𝑟

11
After the total volume of fermented mediumF is known, the time of fermentation must be
calculated. This comes from equation 2, which describes the total fermentation time using its component
parts, which are each calculated separately.
𝑇𝑜𝑡𝑎𝑙 𝑓𝑒𝑟𝑚𝑒𝑛𝑡𝑎𝑡𝑖𝑜𝑛 𝑡𝑖𝑚𝑒 = 𝑡𝑖𝑚𝑒𝑙𝑎𝑔 + 𝑡𝑖𝑚𝑒𝑙𝑜𝑔 + 𝑡𝑖𝑚𝑒𝑠𝑡𝑎𝑡𝑖𝑜𝑛𝑎𝑟𝑦 + 𝑡𝑖𝑚𝑒𝑖𝑑𝑙𝑒 Eqn. 2
Log phase time is calculated by integrating the first order kinetic equation which describes
logarithmic microbial growth, and is shown here in equation 3.
𝑑𝑥
𝑑𝑡= 𝜇𝑥 Eqn. 3
𝑑𝑥
𝑥= 𝜇𝑑𝑡
∫𝑑𝑥
𝑥
𝑥
𝑥𝑜
= ∫ 𝜇𝑑𝑡𝑡
0
ln(𝑥) − ln(𝑥𝑜) = 𝜇𝑡
ln (𝑥
𝑥𝑜) ∗
1
𝜇= 𝑡𝑖𝑚𝑒𝑙𝑜𝑔
For fermenters with this microorganism grown to saturation, the final biomass value is
approximately 20 g/L (Heinzle, et al. 2006). This is the value of x, but to evaluate timelog, a value for
initial biomass is also needed. This is found by analyzing the inoculum concentration and volume of the
bioreactor. An assumption must also be made for the relative volume of the inoculum to the reactor, and a
standard value of 1% is chosen. For an inoculum grown under the same conditions as the larger scale
reactor (20 g biomass / L), the post inoculation biomass concentration in the working reactor (xo) can be
calculated as soon as the volume is known. For now, an assumption for volume must be made, and a
figure of 830,000 L is chosen. This is made with knowledge of the general scale of L-lysine
12
fermentations, and with the knowledge of total required volume per year. It is also calculated in the
section on bioreactor design. Using this value, the value of xo is calculated in equation 4.
𝐶𝑜𝑛𝑐𝑖𝑛𝑜𝑐𝑢𝑙𝑢𝑚 ∗ 𝑉𝑜𝑙𝑢𝑚𝑒𝑖𝑛𝑜𝑐𝑢𝑙𝑢𝑚 = 𝐼𝑛𝑖𝑡𝑖𝑎𝑙 𝑐𝑜𝑛𝑐𝑟𝑒𝑎𝑐𝑡𝑜𝑟 ∗ 𝑉𝑜𝑙𝑢𝑚𝑒 𝑅𝑒𝑎𝑐𝑡𝑜𝑟 Eqn. 4
𝐼𝑛𝑖𝑡𝑖𝑎𝑙 𝑐𝑜𝑛𝑐𝑒𝑛𝑡𝑎𝑡𝑖𝑜𝑛𝑟𝑒𝑎𝑐𝑡𝑜𝑟 = (20𝑔
𝐿) ∗ (0.01 ∗ 830,000𝐿)/830,000𝐿
𝐼𝑛𝑖𝑡𝑖𝑎𝑙 𝑐𝑜𝑛𝑐𝑒𝑛𝑡𝑎𝑡𝑖𝑜𝑛𝑟𝑒𝑎𝑐𝑡𝑜𝑟 = 𝑥𝑜 = 0.2 𝑔
𝐿
This is substituted into equation 3 and timelog is solved. A value of μ = 0.28 /hr is taken from the
literature (Heinzle, et al. 2006).
ln (𝑥
𝑥𝑜) ∗
1
𝜇= 𝑡𝑖𝑚𝑒𝑙𝑜𝑔 Eqn. 5
ln (20𝑔/𝐿
0.2𝑔/𝐿) ∗
1
0.28/ℎ𝑟= 𝑡𝑖𝑚𝑒𝑙𝑜𝑔
𝑡𝑖𝑚𝑒𝑙𝑜𝑔 = 16.4 ℎ𝑟
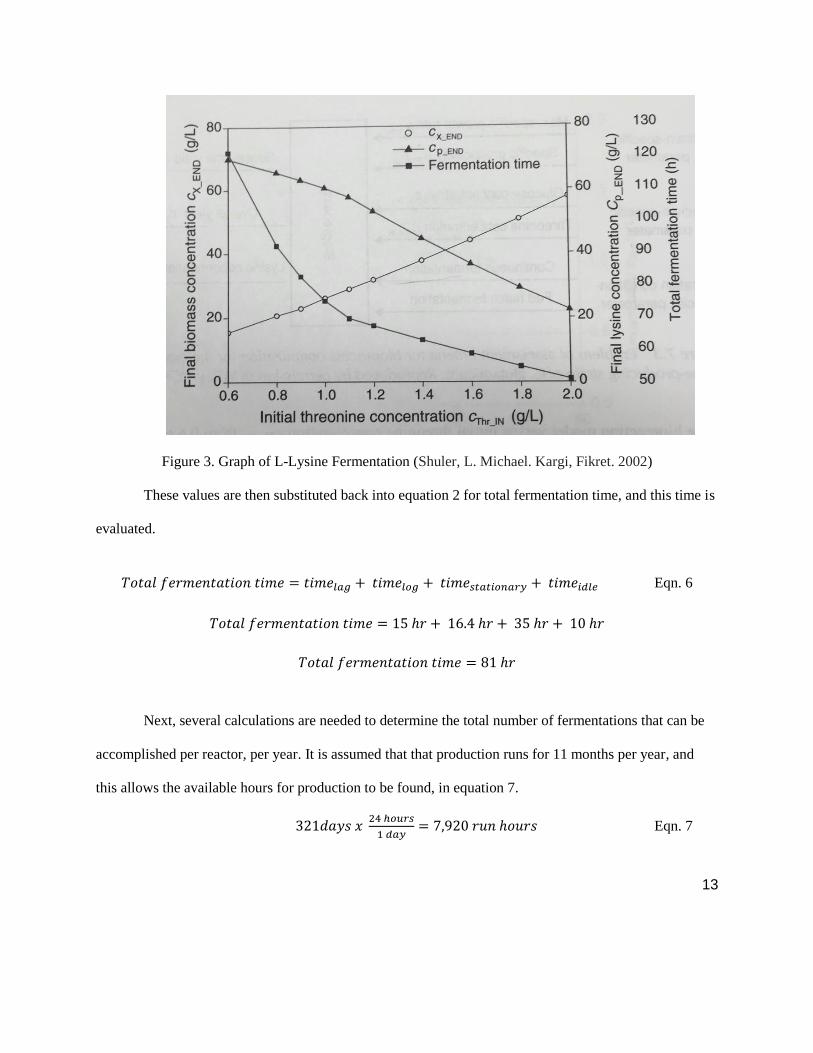
Next, the other terms in the total time equation are determined. First, idle time is assumed at 10
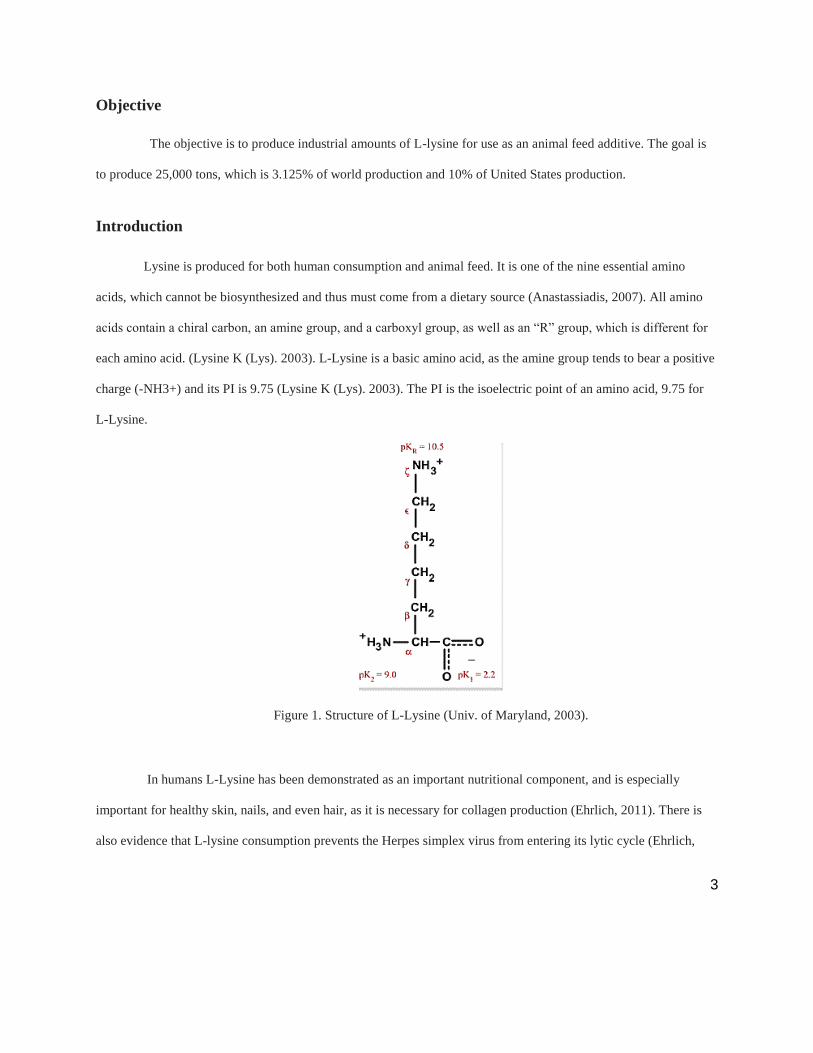
hr. This includes harvesting, cleaning, refilling, and sterilization. Based on a graph of L-lysine production
it can be determined that it is a secondary metabolite, and that the fermentation is type II. This means that
significant time must be spent in the stationary phase in order to allow product concentration to rise
significantly. From the graph below, the necessary stationary time can be estimated at 35 hr. The lag time
can likewise be estimated at 15 hr.
13
Figure 3. Graph of L-Lysine Fermentation (Shuler, L. Michael. Kargi, Fikret. 2002)
These values are then substituted back into equation 2 for total fermentation time, and this time is
evaluated.
𝑇𝑜𝑡𝑎𝑙 𝑓𝑒𝑟𝑚𝑒𝑛𝑡𝑎𝑡𝑖𝑜𝑛 𝑡𝑖𝑚𝑒 = 𝑡𝑖𝑚𝑒𝑙𝑎𝑔 + 𝑡𝑖𝑚𝑒𝑙𝑜𝑔 + 𝑡𝑖𝑚𝑒𝑠𝑡𝑎𝑡𝑖𝑜𝑛𝑎𝑟𝑦 + 𝑡𝑖𝑚𝑒𝑖𝑑𝑙𝑒 Eqn. 6
𝑇𝑜𝑡𝑎𝑙 𝑓𝑒𝑟𝑚𝑒𝑛𝑡𝑎𝑡𝑖𝑜𝑛 𝑡𝑖𝑚𝑒 = 15 ℎ𝑟 + 16.4 ℎ𝑟 + 35 ℎ𝑟 + 10 ℎ𝑟
𝑇𝑜𝑡𝑎𝑙 𝑓𝑒𝑟𝑚𝑒𝑛𝑡𝑎𝑡𝑖𝑜𝑛 𝑡𝑖𝑚𝑒 = 81 ℎ𝑟
Next, several calculations are needed to determine the total number of fermentations that can be
accomplished per reactor, per year. It is assumed that that production runs for 11 months per year, and
this allows the available hours for production to be found, in equation 7.
321𝑑𝑎𝑦𝑠 𝑥 24 ℎ𝑜𝑢𝑟𝑠
1 𝑑𝑎𝑦= 7,920 𝑟𝑢𝑛 ℎ𝑜𝑢𝑟𝑠 Eqn. 7
14
7,920 𝑟𝑢𝑛 ℎ𝑜𝑢𝑟𝑠 𝑥 1 𝑓𝑒𝑟𝑚𝑒𝑛𝑡𝑎𝑡𝑖𝑜𝑛
81 ℎ𝑜𝑢𝑟𝑠= 98 𝑓𝑒𝑟𝑚𝑒𝑛𝑡𝑎𝑡𝑖𝑜𝑛𝑠
A value of 96 runs per year is chosen for the reactor, however, in order to allow 2 cycles worth of
flexible time (7 days) for maintenance, down time, troubleshooting, and other unforeseen difficulties. It is
now evident that a 1.8 million L reactor can be run 96 times per year in our fermentation, but this is not
the only way to accomplish the production goal. In fact, there are numerous possibilities to accomplish
the goal, by modifying the number of reactors (n) in parallel, and the volume (V) of each reactor.
Equation 6 is developed to calculate this production goal.
𝐺𝑜𝑎𝑙 (𝐿
𝑦𝑒𝑎𝑟) = 650 ∗ 106 (
𝐿
𝑦𝑒𝑎𝑟) =
𝑛 𝑓𝑒𝑟𝑚𝑒𝑛𝑡𝑒𝑟𝑠
1∗
𝑉𝑜𝑙𝑢𝑚𝑒 (𝐿)
𝑓𝑒𝑟𝑚𝑒𝑛𝑡𝑒𝑟∗
1
𝑟𝑢𝑛∗
96 𝑟𝑢𝑛𝑠
𝑦𝑒𝑎𝑟 Eqn. 8
The variables in this equation are n and V, and a data set is generated for possible combinations
that meet the production goal. Each combination in the following table will allow the production goal to
be met, but some are more feasible than others.

15
Table 4: Combinations of Number Fermenters and Volume per Fermenter that Allow Production
Goal to be Satisfied
Number Fermenters
(n)
Volume Fermenter (L)
1 3333333
2 1666667
3 1111111
4 833333
5 666667
6 555556
7 476190
8 416667
9 370370
10 333333
11 303030
12 277778
13 256410
14 238095
15 222222
16 208333
17 196078
18 185185
19 175439
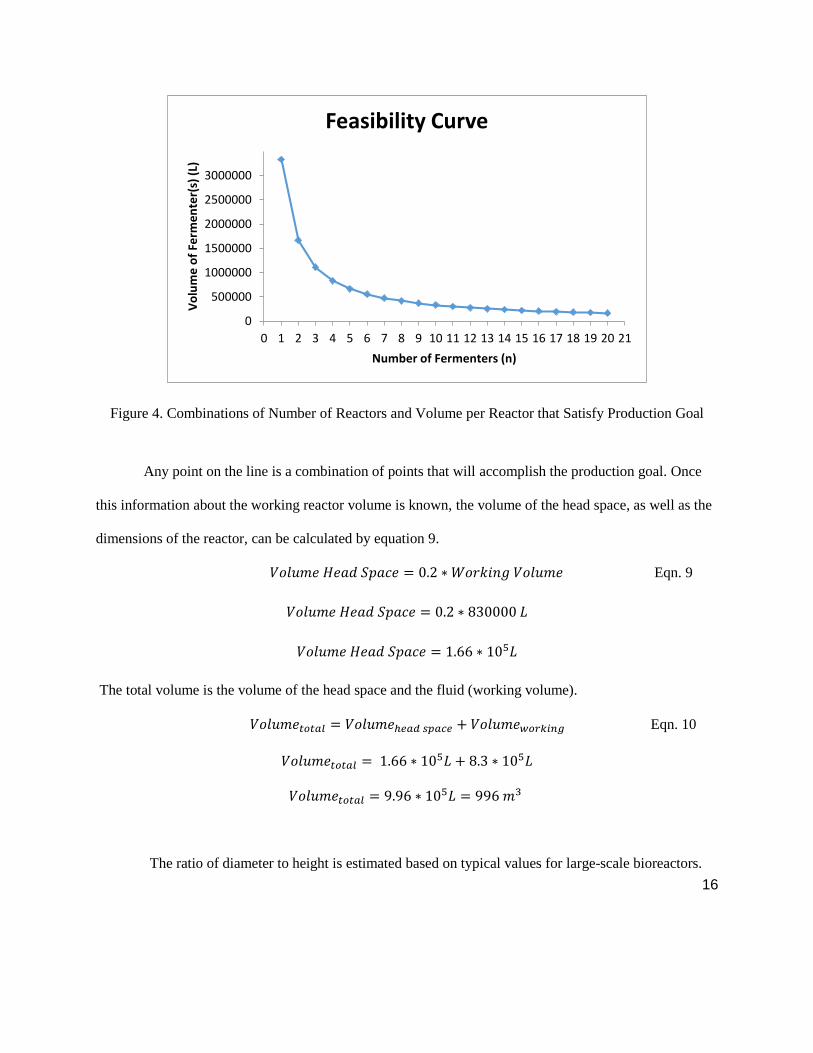
The above data set is graphed as a scatter plot, which allows a visual analysis. It can be seen that
as the number of reactors is increased, the necessary volume per reactor is lower. Likewise, production
could be accomplished with very few reactors if they were extremely large.
A tentative decision has been reached to choose an 830,000 L reactor, and the data set shows that
approximately 4 of these reactors will be needed in parallel. This choice may be updated with further
optimization when more data is available.
16
Figure 4. Combinations of Number of Reactors and Volume per Reactor that Satisfy Production Goal
Any point on the line is a combination of points that will accomplish the production goal. Once
this information about the working reactor volume is known, the volume of the head space, as well as the
dimensions of the reactor, can be calculated by equation 9.
𝑉𝑜𝑙𝑢𝑚𝑒 𝐻𝑒𝑎𝑑 𝑆𝑝𝑎𝑐𝑒 = 0.2 ∗ 𝑊𝑜𝑟𝑘𝑖𝑛𝑔 𝑉𝑜𝑙𝑢𝑚𝑒 Eqn. 9
𝑉𝑜𝑙𝑢𝑚𝑒 𝐻𝑒𝑎𝑑 𝑆𝑝𝑎𝑐𝑒 = 0.2 ∗ 830000 𝐿
𝑉𝑜𝑙𝑢𝑚𝑒 𝐻𝑒𝑎𝑑 𝑆𝑝𝑎𝑐𝑒 = 1.66 ∗ 105𝐿
The total volume is the volume of the head space and the fluid (working volume).
𝑉𝑜𝑙𝑢𝑚𝑒𝑡𝑜𝑡𝑎𝑙 = 𝑉𝑜𝑙𝑢𝑚𝑒ℎ𝑒𝑎𝑑 𝑠𝑝𝑎𝑐𝑒 + 𝑉𝑜𝑙𝑢𝑚𝑒𝑤𝑜𝑟𝑘𝑖𝑛𝑔 Eqn. 10
𝑉𝑜𝑙𝑢𝑚𝑒𝑡𝑜𝑡𝑎𝑙 = 1.66 ∗ 105𝐿 + 8.3 ∗ 105𝐿
𝑉𝑜𝑙𝑢𝑚𝑒𝑡𝑜𝑡𝑎𝑙 = 9.96 ∗ 105𝐿 = 996 𝑚3
The ratio of diameter to height is estimated based on typical values for large-scale bioreactors.
0
500000
1000000
1500000
2000000
2500000
3000000
0 1 2 3 4 5 6 7 8 9 10 11 12 13 14 15 16 17 18 19 20 21
Vo
lum
e o
f Fe
rme
nte
r(s)
(L)
Number of Fermenters (n)
Feasibility Curve
17
𝑑𝑖𝑎𝑚𝑒𝑡𝑒𝑟𝑟𝑒𝑎𝑐𝑡𝑜𝑟 (𝑚)
ℎ𝑒𝑖𝑔ℎ𝑡 𝑟𝑒𝑎𝑐𝑡𝑜𝑟 (𝑚)=
1
3 Eqn. 11
This can be combined with the equation for volume of a cylindrical bioreactor (assuming a flat
head plate and base).
𝑉𝑜𝑙𝑢𝑚𝑒𝑡𝑜𝑡𝑎𝑙 = 𝜋
4∗ (𝑑𝑖𝑎𝑚𝑒𝑡𝑒𝑟𝑟𝑒𝑎𝑐𝑡𝑜𝑟)2 ∗ ℎ𝑒𝑖𝑔ℎ𝑡𝑟𝑒𝑎𝑐𝑡𝑜𝑟 = 996 𝑚3 Eqn. 12
The previous two equations are in two unknowns, and thus the height and diameter of the reactor
can be determined.
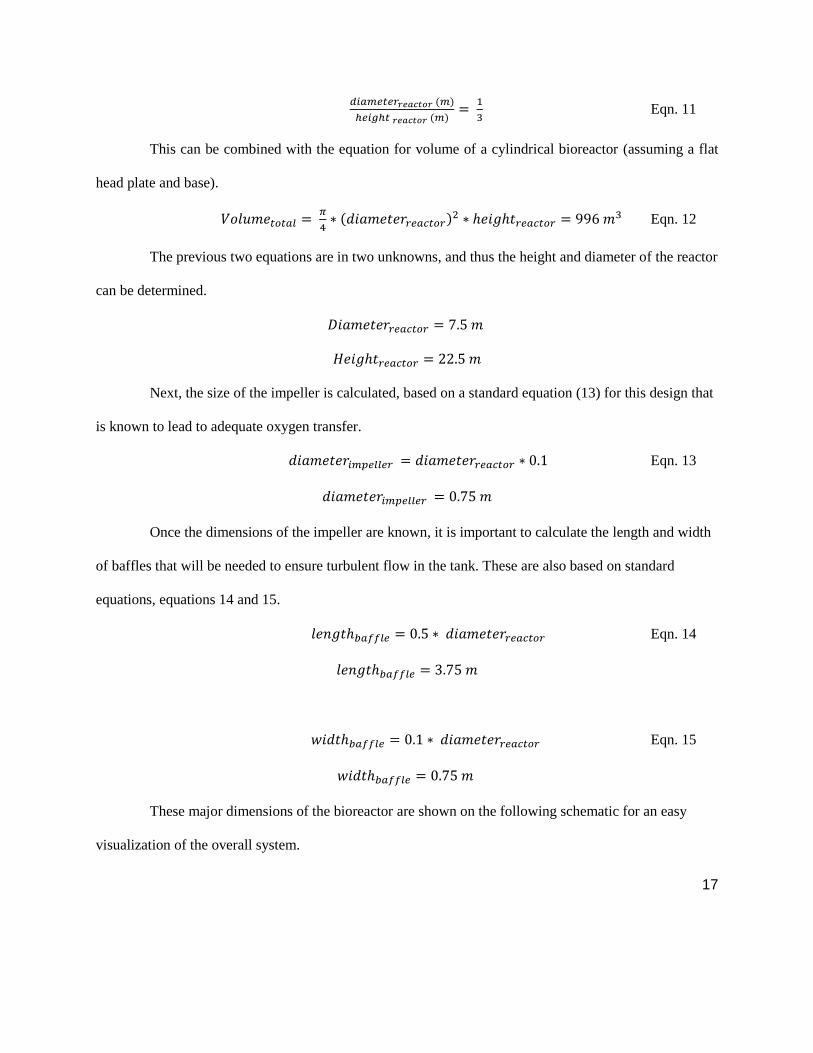
𝐷𝑖𝑎𝑚𝑒𝑡𝑒𝑟𝑟𝑒𝑎𝑐𝑡𝑜𝑟 = 7.5 𝑚
𝐻𝑒𝑖𝑔ℎ𝑡𝑟𝑒𝑎𝑐𝑡𝑜𝑟 = 22.5 𝑚
Next, the size of the impeller is calculated, based on a standard equation (13) for this design that
is known to lead to adequate oxygen transfer.
𝑑𝑖𝑎𝑚𝑒𝑡𝑒𝑟𝑖𝑚𝑝𝑒𝑙𝑙𝑒𝑟 = 𝑑𝑖𝑎𝑚𝑒𝑡𝑒𝑟𝑟𝑒𝑎𝑐𝑡𝑜𝑟 ∗ 0.1 Eqn. 13
𝑑𝑖𝑎𝑚𝑒𝑡𝑒𝑟𝑖𝑚𝑝𝑒𝑙𝑙𝑒𝑟 = 0.75 𝑚
Once the dimensions of the impeller are known, it is important to calculate the length and width
of baffles that will be needed to ensure turbulent flow in the tank. These are also based on standard
equations, equations 14 and 15.
𝑙𝑒𝑛𝑔𝑡ℎ𝑏𝑎𝑓𝑓𝑙𝑒 = 0.5 ∗ 𝑑𝑖𝑎𝑚𝑒𝑡𝑒𝑟𝑟𝑒𝑎𝑐𝑡𝑜𝑟 Eqn. 14
𝑙𝑒𝑛𝑔𝑡ℎ𝑏𝑎𝑓𝑓𝑙𝑒 = 3.75 𝑚
𝑤𝑖𝑑𝑡ℎ𝑏𝑎𝑓𝑓𝑙𝑒 = 0.1 ∗ 𝑑𝑖𝑎𝑚𝑒𝑡𝑒𝑟𝑟𝑒𝑎𝑐𝑡𝑜𝑟 Eqn. 15
𝑤𝑖𝑑𝑡ℎ𝑏𝑎𝑓𝑓𝑙𝑒 = 0.75 𝑚
These major dimensions of the bioreactor are shown on the following schematic for an easy
visualization of the overall system.
18
Figure 5. Primary reactor with major dimensions
The calculations for bioreactor design are repeated for the pre-fermenter, which is needed to
prepare the inoculum for the primary reactors. With the goal of producing a 1% inoculum for each of the
four 830,000L primary reactors running in parallel, a minimum working volume for each pre-fermenter
can be calculated. It is assumed that four pre-fermenters will also be used. This will make it easier to
coordinate pre-fermentations for the large reactors, which will operate in parallel, but on different
schedules.
𝑉𝑜𝑙𝑢𝑚𝑒𝑤𝑜𝑟𝑘𝑖𝑛𝑔 = 𝑣𝑜𝑙𝑢𝑚𝑒 𝑝𝑟𝑖𝑚𝑎𝑟𝑦 𝑟𝑒𝑎𝑐𝑡𝑜𝑟 ∗ 𝑝𝑒𝑟𝑐𝑒𝑛𝑡 𝑖𝑛𝑜𝑐𝑢𝑙𝑢𝑚 (Eqn. 16)
𝑉𝑜𝑙𝑢𝑚𝑒𝑤𝑜𝑟𝑘𝑖𝑛𝑔 = 830,000 𝐿 ∗ 0.01
𝑉𝑜𝑙𝑢𝑚𝑒𝑤𝑜𝑟𝑘𝑖𝑛𝑔 = 8,300 𝐿
Headspace can be calculated by the same metrics as it was for the primary reactor.
19
𝑉𝑜𝑙𝑢𝑚𝑒ℎ𝑒𝑎𝑑 𝑠𝑝𝑎𝑐𝑒 = 0.2 ∗ 𝑉𝑜𝑙𝑢𝑚𝑒𝑤𝑜𝑟𝑘𝑖𝑛𝑔 Eqn. 17
𝑉𝑜𝑢𝑚𝑒ℎ𝑒𝑎𝑑 𝑠𝑝𝑎𝑐𝑒 = 1,660 𝐿
Total volume can now be calculated.
𝑉𝑜𝑢𝑚𝑒𝑝𝑟𝑒−𝑓𝑒𝑟𝑚𝑒𝑛𝑡𝑒𝑟 = 𝑉𝑜𝑙𝑢𝑚𝑒𝑤𝑜𝑟𝑘𝑖𝑛𝑔 + 𝑉𝑜𝑙𝑢𝑚𝑒ℎ𝑒𝑎𝑑 𝑠𝑝𝑎𝑐𝑒
𝑉𝑜𝑢𝑚𝑒𝑝𝑟𝑒−𝑓𝑒𝑟𝑚𝑒𝑛𝑡𝑒𝑟 = 9,960 𝐿
The ratio of diameter to height is estimated based on typical values for large scale bioreactors.
𝑑𝑖𝑎𝑚𝑒𝑡𝑒𝑟𝑟𝑒𝑎𝑐𝑡𝑜𝑟 (𝑚)
ℎ𝑒𝑖𝑔ℎ𝑡 𝑟𝑒𝑎𝑐𝑡𝑜𝑟 (𝑚)=
1
3 Eqn. 18
This can again be combined with the equation for volume of a cylindrical bioreactor.
𝑉𝑜𝑙𝑢𝑚𝑒𝑡𝑜𝑡𝑎𝑙 = 𝜋
4∗ (𝑑𝑖𝑎𝑚𝑒𝑡𝑒𝑟𝑟𝑒𝑎𝑐𝑡𝑜𝑟)2 ∗ ℎ𝑒𝑖𝑔ℎ𝑡𝑟𝑒𝑎𝑐𝑡𝑜𝑟 = 9.96 𝑚3 Eqn. 19
The previous two equations are in two unknowns, and thus the height and diameter of the pre-
fermenter can be solved.
𝐷𝑖𝑎𝑚𝑒𝑡𝑒𝑟𝑝𝑟𝑒−𝑓𝑒𝑟𝑚𝑒𝑛𝑡𝑒𝑟 = 1.61 𝑚
𝐻𝑒𝑖𝑔ℎ𝑡𝑝𝑟𝑒−𝑓𝑒𝑟𝑚𝑒𝑛𝑡𝑒𝑟 = 4.90 𝑚
Next, the size of the impeller is calculated, based on a standard equation (20) for this design that
is known to lead to adequate oxygen transfer.
𝑑𝑖𝑎𝑚𝑒𝑡𝑒𝑟𝑖𝑚𝑝𝑒𝑙𝑙𝑒𝑟 = 𝑑𝑖𝑎𝑚𝑒𝑡𝑒𝑟𝑝𝑟𝑒−𝑓𝑒𝑟𝑚𝑒𝑛𝑡𝑒𝑟 ∗ 0.1 Eqn. 20
𝑑𝑖𝑎𝑚𝑒𝑡𝑒𝑟𝑖𝑚𝑝𝑒𝑙𝑙𝑒𝑟 = 0.161 𝑚
Once the dimensions of the impeller are known, it is important to calculate the length and width
of baffles that will be needed to ensure turbulent flow in the tank. These are also based on standard
equations, equations 19 and 20.
𝑙𝑒𝑛𝑔𝑡ℎ𝑏𝑎𝑓𝑓𝑙𝑒 = 0.5 ∗ 𝑑𝑖𝑎𝑚𝑒𝑡𝑒𝑟𝑝𝑟𝑒−𝑓𝑒𝑟𝑚𝑒𝑛𝑡𝑒𝑟 Eqn. 21
𝑙𝑒𝑛𝑔𝑡ℎ𝑏𝑎𝑓𝑓𝑙𝑒 = 0.805 𝑚
20
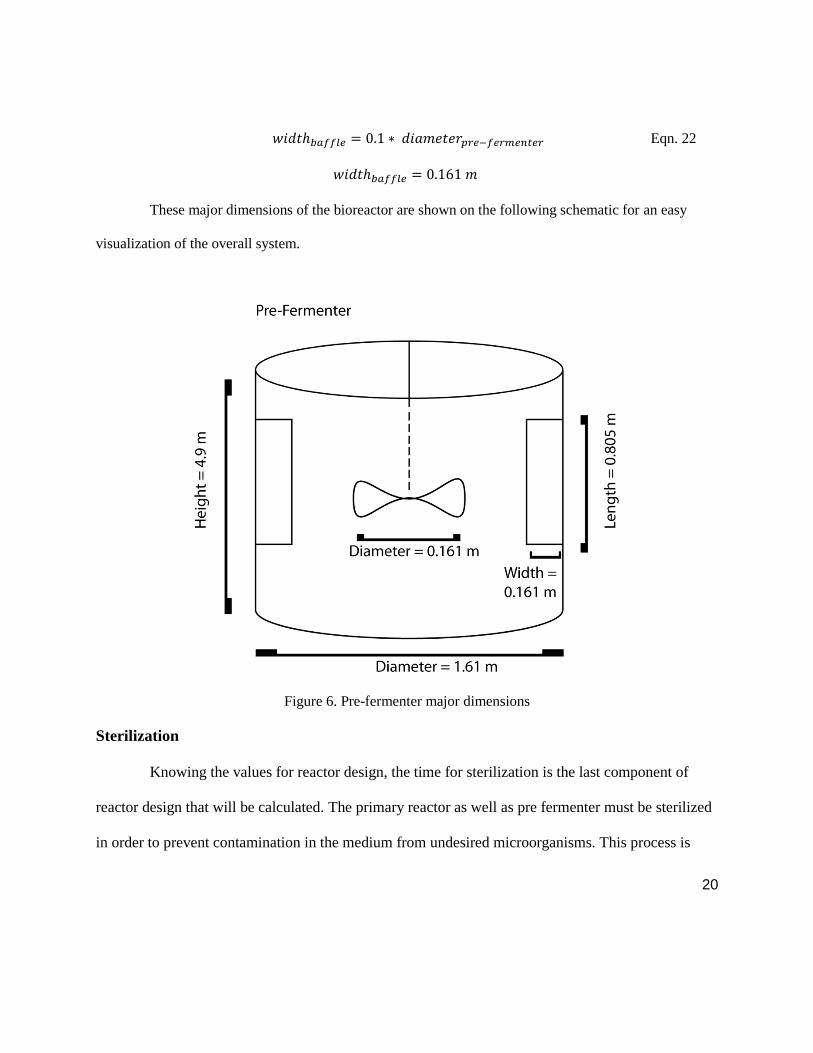
𝑤𝑖𝑑𝑡ℎ𝑏𝑎𝑓𝑓𝑙𝑒 = 0.1 ∗ 𝑑𝑖𝑎𝑚𝑒𝑡𝑒𝑟𝑝𝑟𝑒−𝑓𝑒𝑟𝑚𝑒𝑛𝑡𝑒𝑟 Eqn. 22
𝑤𝑖𝑑𝑡ℎ𝑏𝑎𝑓𝑓𝑙𝑒 = 0.161 𝑚
These major dimensions of the bioreactor are shown on the following schematic for an easy
visualization of the overall system.
Figure 6. Pre-fermenter major dimensions
Sterilization
Knowing the values for reactor design, the time for sterilization is the last component of
reactor design that will be calculated. The primary reactor as well as pre fermenter must be sterilized
in order to prevent contamination in the medium from undesired microorganisms. This process is
21
undertaken at 15 psi and 121°C (Shuler, 2002). The sterilization occurs in-line, as the reactor is
pressurized and heated until the desired conditions are reached (Shuler, 2002). These conditions must
then be maintained for adequate time in order for successful sterilization, and these necessary times
are calculated using known values for the death kinetics of spores as well as the total number of
spores in the reactors.
With a probability of unsuccessful sterilization set at the acceptable value of 0.001 (Demirci,
2015), as well as assuming that initial spore concentration is 1*10^5 spores/ L, and that Kd for spores
= 1/min (Shuler, 2002), the time for sterilization can be calculated. The last piece of information that
is needed is the total number of spores in the primary reactor as well as pre-fermenter, and this
information is calculated in equation (21).
Assumptions:
(1 − 𝑃𝑜(𝑡)) = 0.001
𝐾𝑑 =1
𝑚𝑖𝑛
𝑛𝑠𝑝𝑜𝑟𝑒𝑠 = 1 ∗ 105𝑠𝑝𝑜𝑟𝑒𝑠
𝐿
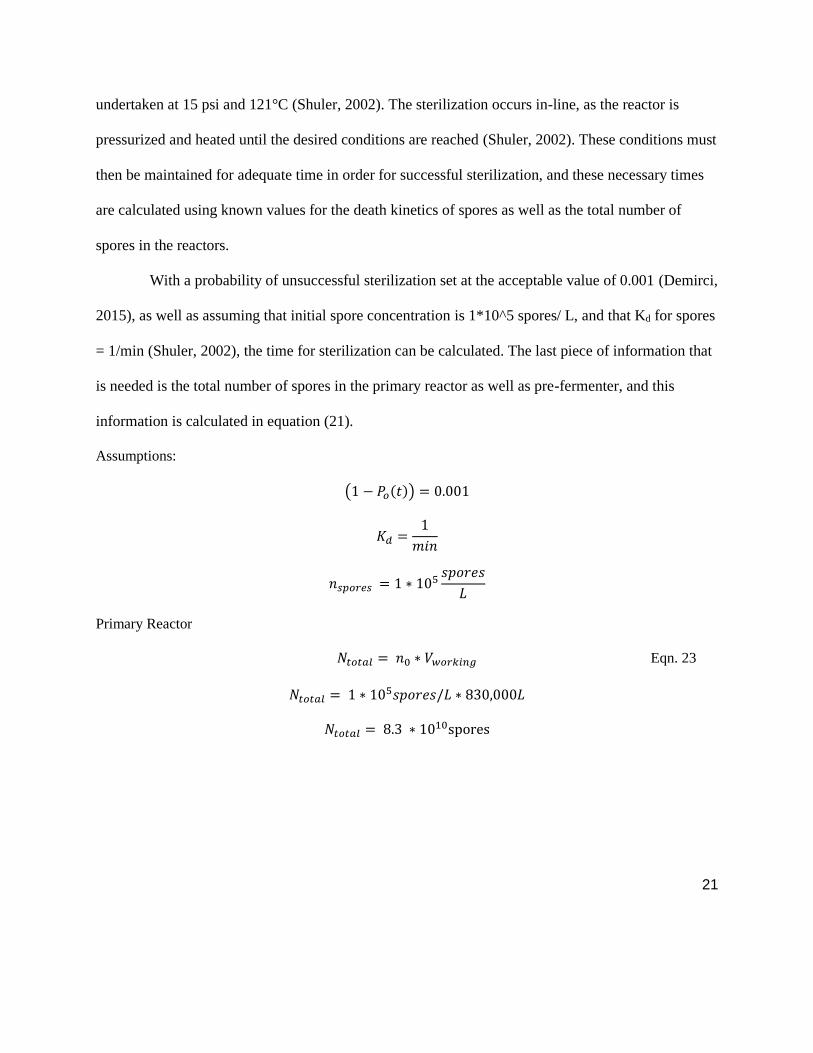
Primary Reactor
𝑁𝑡𝑜𝑡𝑎𝑙 = 𝑛0 ∗ 𝑉𝑤𝑜𝑟𝑘𝑖𝑛𝑔 Eqn. 23
𝑁𝑡𝑜𝑡𝑎𝑙 = 1 ∗ 105𝑠𝑝𝑜𝑟𝑒𝑠/𝐿 ∗ 830,000𝐿
𝑁𝑡𝑜𝑡𝑎𝑙 = 8.3 ∗ 1010spores
22
Figure 7. Sterilization chart, conditions marked for primary reactor
𝐾𝑑𝑡 (from figure ) 1/32 𝑚𝑖𝑛
𝑡𝑠𝑡𝑒𝑟𝑖𝑙𝑖𝑧𝑒 = 32𝑚𝑖𝑛
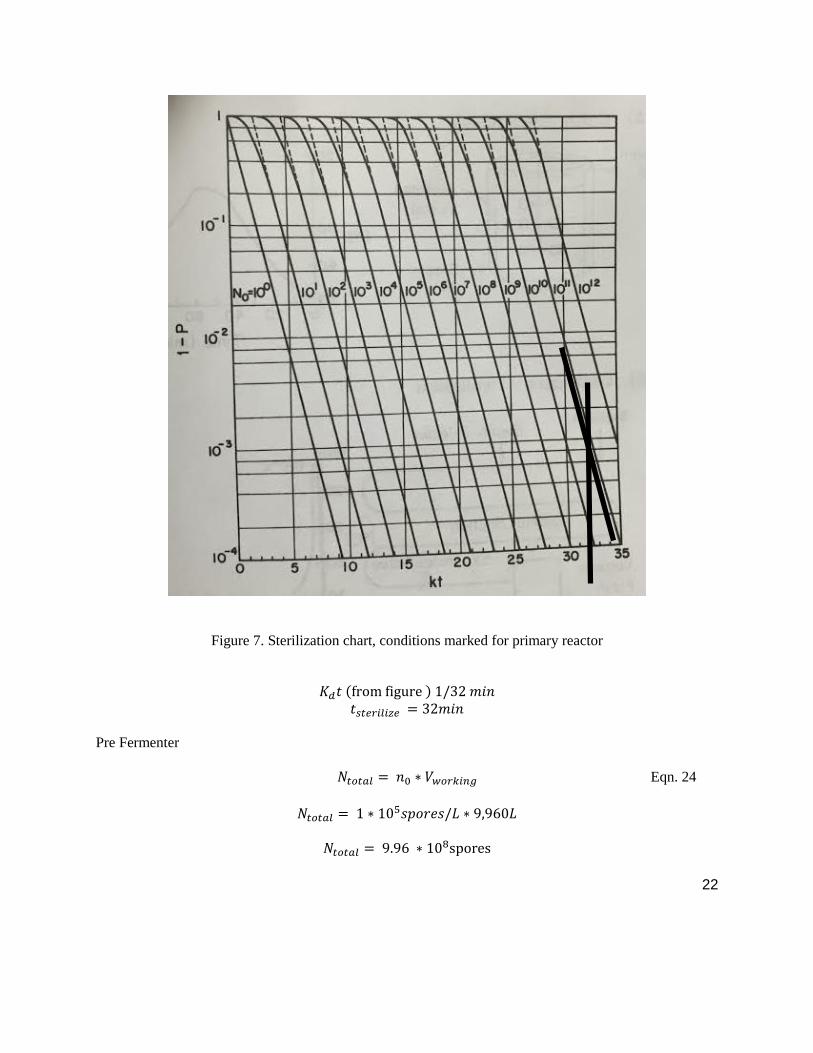
Pre Fermenter
𝑁𝑡𝑜𝑡𝑎𝑙 = 𝑛0 ∗ 𝑉𝑤𝑜𝑟𝑘𝑖𝑛𝑔 Eqn. 24
𝑁𝑡𝑜𝑡𝑎𝑙 = 1 ∗ 105𝑠𝑝𝑜𝑟𝑒𝑠/𝐿 ∗ 9,960𝐿
𝑁𝑡𝑜𝑡𝑎𝑙 = 9.96 ∗ 108spores
23
Figure 8. Sterilization chart, conditions marked for pre-fermenter
𝐾𝑑𝑡 (from figure ) = 1/27 𝑚𝑖𝑛
𝑡𝑠𝑡𝑒𝑟𝑖𝑙𝑖𝑧𝑒 = 27 𝑚𝑖𝑛
24
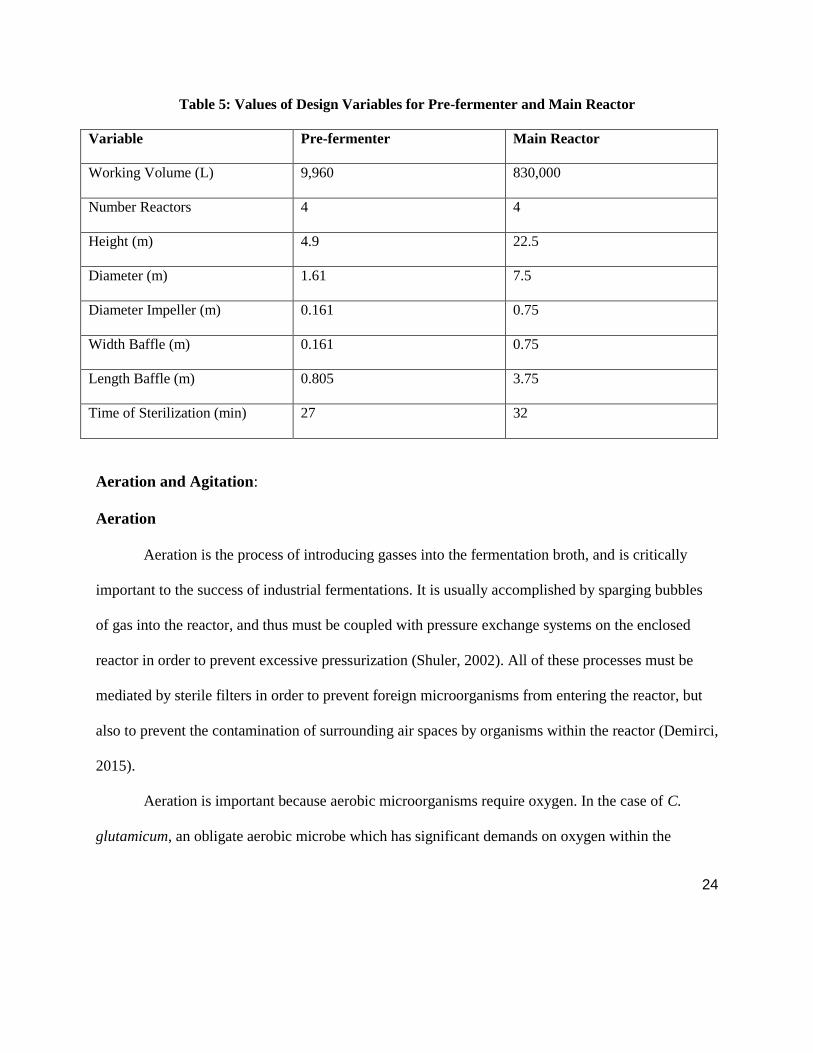
Table 5: Values of Design Variables for Pre-fermenter and Main Reactor
Variable Pre-fermenter Main Reactor
Working Volume (L) 9,960 830,000
Number Reactors 4 4
Height (m) 4.9 22.5
Diameter (m) 1.61 7.5
Diameter Impeller (m) 0.161 0.75
Width Baffle (m) 0.161 0.75
Length Baffle (m) 0.805 3.75
Time of Sterilization (min) 27 32
Aeration and Agitation:
Aeration
Aeration is the process of introducing gasses into the fermentation broth, and is critically
important to the success of industrial fermentations. It is usually accomplished by sparging bubbles
of gas into the reactor, and thus must be coupled with pressure exchange systems on the enclosed
reactor in order to prevent excessive pressurization (Shuler, 2002). All of these processes must be
mediated by sterile filters in order to prevent foreign microorganisms from entering the reactor, but
also to prevent the contamination of surrounding air spaces by organisms within the reactor (Demirci,
2015).
Aeration is important because aerobic microorganisms require oxygen. In the case of C.
glutamicum, an obligate aerobic microbe which has significant demands on oxygen within the
25
bioreactor, it is evident that some attention must be taken to ensure that an adequate supply of
available dissolved oxygen is provided, and this was accomplished through designing an aeration
system.
It is necessary to adequately estimate the oxygen requirements for the fermentation of L-
lysine, and from a study conducted on a C. glutamicum fermentation producing L-lysine, the specific
oxygen uptake rate has been determined (Käß et al., 2014).
𝑆𝑝𝑒𝑐𝑖𝑓𝑖𝑐 𝑂2 𝑈𝑝𝑡𝑎𝑘𝑒 𝑅𝑎𝑡𝑒 = 4.0 𝑚𝑚𝑜𝑙 𝑂2
𝑔𝑏𝑖𝑜𝑚𝑎𝑠𝑠∗ℎ𝑟 Eqn. 25
Total oxygen demand depends on the specific oxygen uptake rate as well as active biomass
in the reactor, and since biomass changes with time, the instantaneous oxygen demand is dependent
on time as well. Biomass concentration as a function of time has been found by integrating the first
order kinetic equation for log phase growth of microorganisms and then solving for x. Using this
equation, the concentration of active biomass during the log phase can be calculated at any time. It is
assumed that before the log phase, the concentration of biomass is equal to the initial concentration
(0.2g/L), and that during the stationary phase it is equal to the saturation concentration (20 g/L).
𝑑𝑥
𝑑𝑡= 𝜇𝑥 Eqn. 26
ln (𝑥
𝑥𝑜) ∗
1
𝜇= 𝑡𝑖𝑚𝑒𝑙𝑜𝑔
𝑥 = 𝑥𝑜 ∗ 𝑒(𝜇∗𝑡𝑙𝑜𝑔)
Where:
𝑥𝑜 = biomass concentration at time zero, defined as the beginning of the log phase
𝜇 = specific growth rate = 0.28/hr
𝑡𝑙𝑜𝑔 = elapsed time into the log phase, with the beginning of the log phase defined as 𝑡𝑙𝑜𝑔 = 0
26
Now that specific oxygen uptake rate and biomass as a function of time are both known,
oxygen uptake rate as a function of time can be found, and is presented in equation (13). The
advantage of knowing the oxygen demand of the bioreactor as a function of time is that maximum
aeration may not be necessary across the entire time of fermentation, and operational costs can be
lowered by avoiding unnecessary aeration. For example, early lag phase oxygen uptake may be very
low compared to late log phase uptake, and avoiding unnecessary aeration during the times when it is
not needed can contribute to cost savings. It is assumed that the concentration of biomass is only
changing during the log growth phase. This is because during the lag phase biomass concentration is
approximately equal to initial biomass concentration, and during the stationary phase is
approximately equal to saturated biomass concentration.
𝑂𝑥𝑦𝑔𝑒𝑛 𝑈𝑝𝑡𝑎𝑘𝑒 𝑅𝑎𝑡𝑒 (𝑂𝑈𝑅) = 𝑆𝑝𝑒𝑐𝑖𝑓𝑖𝑐 𝑂𝑥𝑦𝑔𝑒𝑛 𝑈𝑝𝑡𝑎𝑘𝑒 𝑅𝑎𝑡𝑒 ∗ 𝐴𝑐𝑡𝑖𝑣𝑒 𝐵𝑖𝑜𝑚𝑎𝑠𝑠 (𝑡) Eqn. 27
𝑂𝑈𝑅 = 4.0 𝑚𝑚𝑜𝑙 𝑂2
𝑔𝑏𝑖𝑜𝑚𝑎𝑠𝑠∗ℎ𝑟∗
32𝑚𝑔 𝑂2
𝑚𝑚𝑜𝑙 𝑂2∗ 𝑥(𝑡)
𝑂𝑈𝑅 = 4.0 𝑚𝑚𝑜𝑙 𝑂2
𝑔𝑏𝑖𝑜𝑚𝑎𝑠𝑠 ∗ ℎ𝑟∗
32𝑚𝑔 𝑂2
𝑚𝑚𝑜𝑙 𝑂2
𝑥𝑜, 𝑓𝑜𝑟 𝑡 < 𝑡𝑙𝑎𝑔
𝑂𝑈𝑅 = 4.0 𝑚𝑚𝑜𝑙 𝑂2
𝑔𝑏𝑖𝑜𝑚𝑎𝑠𝑠∗ℎ𝑟∗
32𝑚𝑔 𝑂2
𝑚𝑚𝑜𝑙 𝑂2𝑥𝑜 ∗ 𝑒(𝜇∗𝑡𝑙𝑜𝑔), 𝑓𝑜𝑟 𝑡𝑙𝑎𝑔 < 𝑡 < 𝑡𝑠𝑡𝑎𝑡𝑖𝑜𝑛𝑎𝑟𝑦
𝑂𝑈𝑅 = 4.0 𝑚𝑚𝑜𝑙 𝑂2
𝑔𝑏𝑖𝑜𝑚𝑎𝑠𝑠∗ℎ𝑟∗
32𝑚𝑔 𝑂2
𝑚𝑚𝑜𝑙 𝑂2𝑥𝑠𝑎𝑡𝑢𝑟𝑎𝑡𝑖𝑜𝑛, 𝑓𝑜𝑟 𝑡 > 𝑡𝑠𝑡𝑎𝑡𝑖𝑜𝑛𝑎𝑟𝑦
These equations allow OUR to be plotted as a function of time for the entire fermentation.
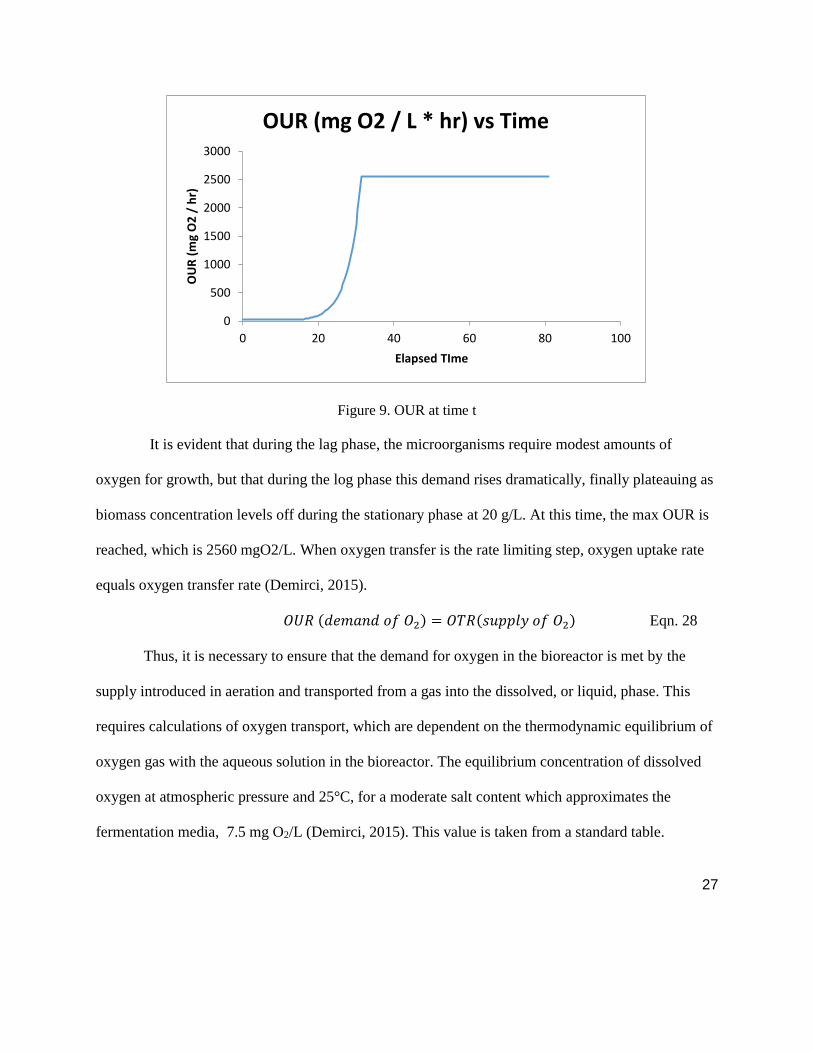
Figure 9 Oxygen uptake rate as a function of time
27
Figure 9. OUR at time t
It is evident that during the lag phase, the microorganisms require modest amounts of
oxygen for growth, but that during the log phase this demand rises dramatically, finally plateauing as
biomass concentration levels off during the stationary phase at 20 g/L. At this time, the max OUR is
reached, which is 2560 mgO2/L. When oxygen transfer is the rate limiting step, oxygen uptake rate
equals oxygen transfer rate (Demirci, 2015).
𝑂𝑈𝑅 (𝑑𝑒𝑚𝑎𝑛𝑑 𝑜𝑓 𝑂2) = 𝑂𝑇𝑅(𝑠𝑢𝑝𝑝𝑙𝑦 𝑜𝑓 𝑂2) Eqn. 28
Thus, it is necessary to ensure that the demand for oxygen in the bioreactor is met by the
supply introduced in aeration and transported from a gas into the dissolved, or liquid, phase. This
requires calculations of oxygen transport, which are dependent on the thermodynamic equilibrium of
oxygen gas with the aqueous solution in the bioreactor. The equilibrium concentration of dissolved
oxygen at atmospheric pressure and 25°C, for a moderate salt content which approximates the
fermentation media, 7.5 mg O2/L (Demirci, 2015). This value is taken from a standard table.
0
500
1000
1500
2000
2500
3000
0 20 40 60 80 100
OU
R (
mg
O2
/ h
r)
Elapsed TIme
OUR (mg O2 / L * hr) vs Time
28
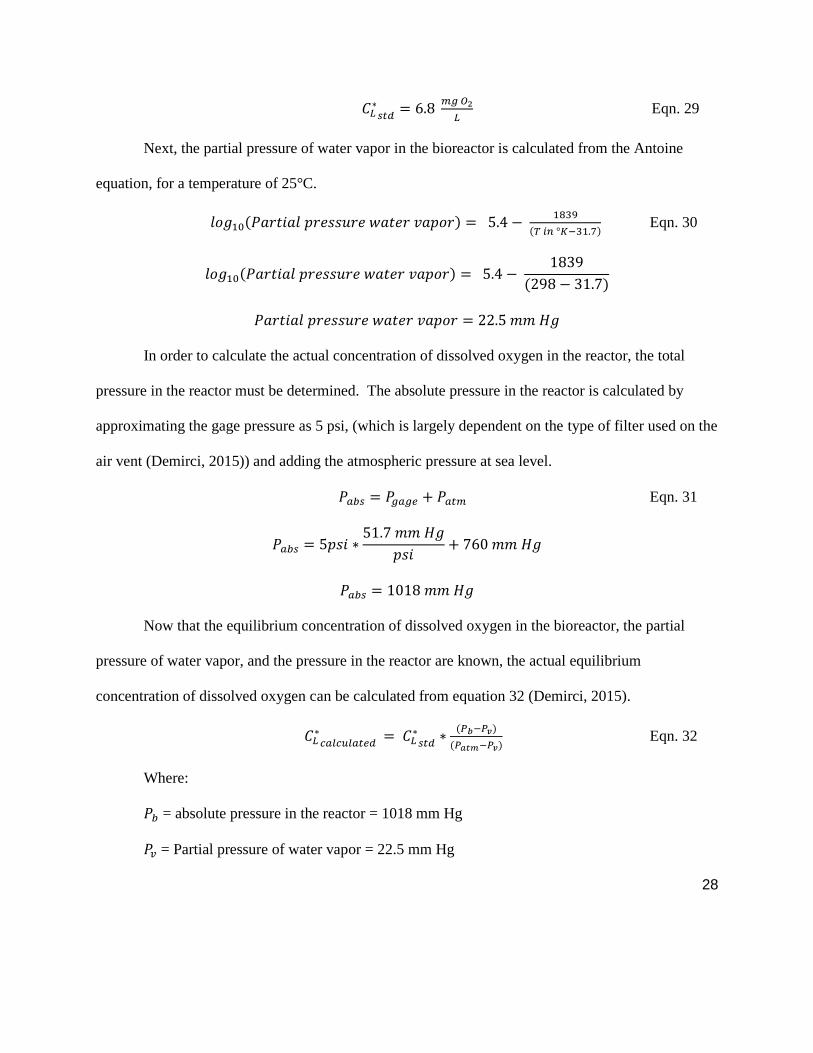
𝐶𝐿∗
𝑠𝑡𝑑= 6.8
𝑚𝑔 𝑂2
𝐿 Eqn. 29
Next, the partial pressure of water vapor in the bioreactor is calculated from the Antoine
equation, for a temperature of 25°C.
𝑙𝑜𝑔10(𝑃𝑎𝑟𝑡𝑖𝑎𝑙 𝑝𝑟𝑒𝑠𝑠𝑢𝑟𝑒 𝑤𝑎𝑡𝑒𝑟 𝑣𝑎𝑝𝑜𝑟) = 5.4 − 1839
(𝑇 𝑖𝑛 °𝐾−31.7) Eqn. 30
𝑙𝑜𝑔10(𝑃𝑎𝑟𝑡𝑖𝑎𝑙 𝑝𝑟𝑒𝑠𝑠𝑢𝑟𝑒 𝑤𝑎𝑡𝑒𝑟 𝑣𝑎𝑝𝑜𝑟) = 5.4 − 1839
(298 − 31.7)
𝑃𝑎𝑟𝑡𝑖𝑎𝑙 𝑝𝑟𝑒𝑠𝑠𝑢𝑟𝑒 𝑤𝑎𝑡𝑒𝑟 𝑣𝑎𝑝𝑜𝑟 = 22.5 𝑚𝑚 𝐻𝑔
In order to calculate the actual concentration of dissolved oxygen in the reactor, the total
pressure in the reactor must be determined. The absolute pressure in the reactor is calculated by
approximating the gage pressure as 5 psi, (which is largely dependent on the type of filter used on the
air vent (Demirci, 2015)) and adding the atmospheric pressure at sea level.
𝑃𝑎𝑏𝑠 = 𝑃𝑔𝑎𝑔𝑒 + 𝑃𝑎𝑡𝑚 Eqn. 31
𝑃𝑎𝑏𝑠 = 5𝑝𝑠𝑖 ∗51.7 𝑚𝑚 𝐻𝑔
𝑝𝑠𝑖+ 760 𝑚𝑚 𝐻𝑔
𝑃𝑎𝑏𝑠 = 1018 𝑚𝑚 𝐻𝑔
Now that the equilibrium concentration of dissolved oxygen in the bioreactor, the partial
pressure of water vapor, and the pressure in the reactor are known, the actual equilibrium
concentration of dissolved oxygen can be calculated from equation 32 (Demirci, 2015).
𝐶𝐿∗
𝑐𝑎𝑙𝑐𝑢𝑙𝑎𝑡𝑒𝑑 = 𝐶𝐿
∗𝑠𝑡𝑑
∗(𝑃𝑏−𝑃𝑣)
(𝑃𝑎𝑡𝑚−𝑃𝑣) Eqn. 32
Where:
𝑃𝑏 = absolute pressure in the reactor = 1018 mm Hg
𝑃𝑣 = Partial pressure of water vapor = 22.5 mm Hg
29
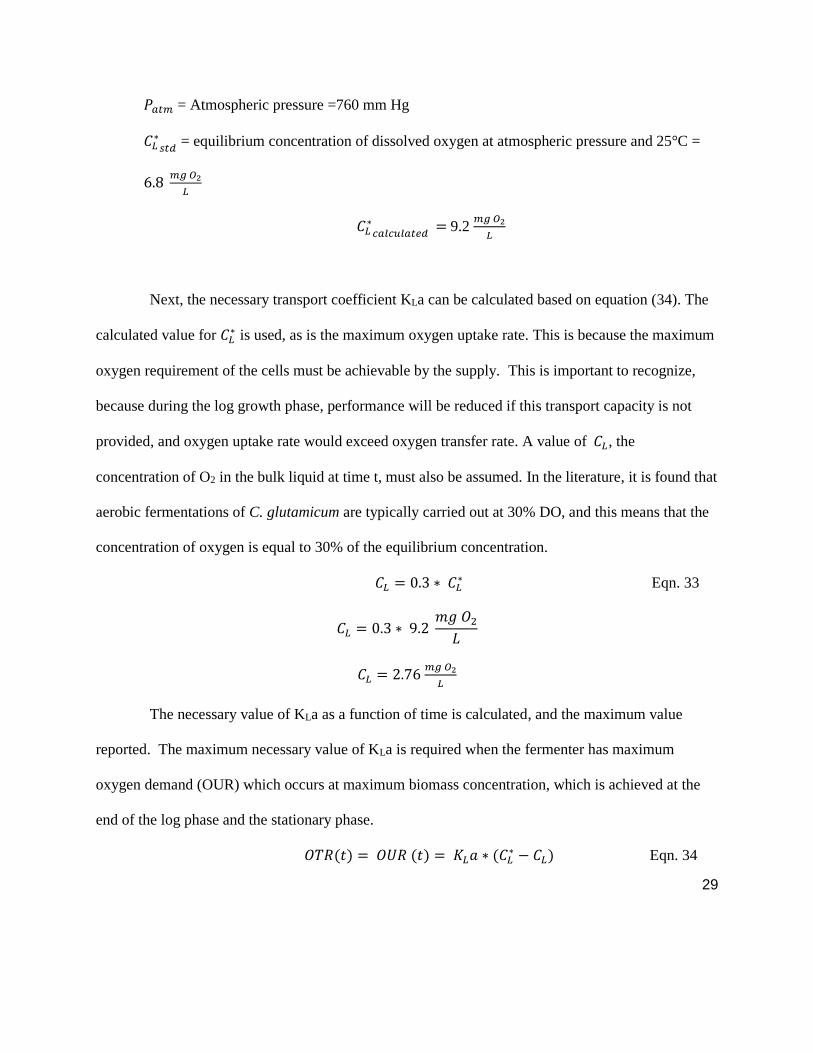
𝑃𝑎𝑡𝑚 = Atmospheric pressure =760 mm Hg
𝐶𝐿∗
𝑠𝑡𝑑 = equilibrium concentration of dissolved oxygen at atmospheric pressure and 25°C =
6.8 𝑚𝑔 𝑂2
𝐿
𝐶𝐿∗
𝑐𝑎𝑙𝑐𝑢𝑙𝑎𝑡𝑒𝑑 = 9.2
𝑚𝑔 𝑂2
𝐿
Next, the necessary transport coefficient KLa can be calculated based on equation (34). The
calculated value for 𝐶𝐿 ∗ is used, as is the maximum oxygen uptake rate. This is because the maximum
oxygen requirement of the cells must be achievable by the supply. This is important to recognize,
because during the log growth phase, performance will be reduced if this transport capacity is not
provided, and oxygen uptake rate would exceed oxygen transfer rate. A value of 𝐶𝐿, the
concentration of O2 in the bulk liquid at time t, must also be assumed. In the literature, it is found that
aerobic fermentations of C. glutamicum are typically carried out at 30% DO, and this means that the
concentration of oxygen is equal to 30% of the equilibrium concentration.
𝐶𝐿 = 0.3 ∗ 𝐶𝐿∗ Eqn. 33
𝐶𝐿 = 0.3 ∗ 9.2 𝑚𝑔 𝑂2
𝐿
𝐶𝐿 = 2.76 𝑚𝑔 𝑂2
𝐿
The necessary value of KLa as a function of time is calculated, and the maximum value
reported. The maximum necessary value of KLa is required when the fermenter has maximum
oxygen demand (OUR) which occurs at maximum biomass concentration, which is achieved at the
end of the log phase and the stationary phase.
𝑂𝑇𝑅(𝑡) = 𝑂𝑈𝑅 (𝑡) = 𝐾𝐿𝑎 ∗ (𝐶𝐿∗ − 𝐶𝐿) Eqn. 34
30
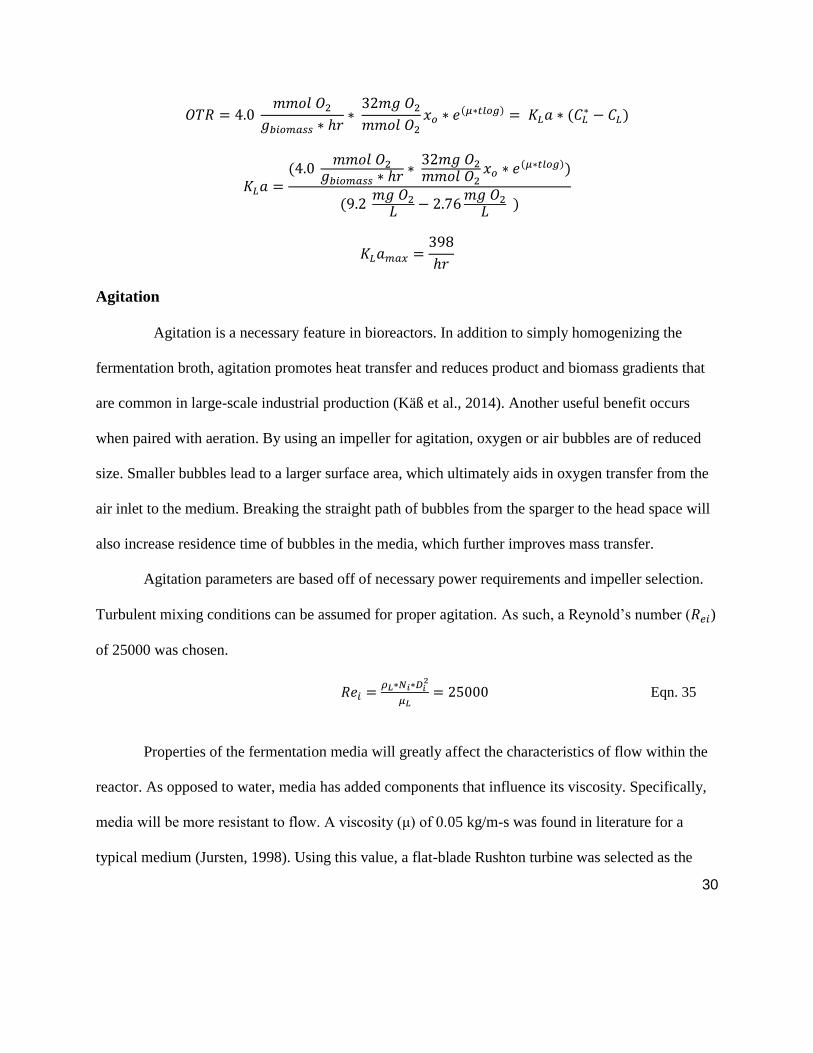
𝑂𝑇𝑅 = 4.0 𝑚𝑚𝑜𝑙 𝑂2
𝑔𝑏𝑖𝑜𝑚𝑎𝑠𝑠 ∗ ℎ𝑟∗
32𝑚𝑔 𝑂2
𝑚𝑚𝑜𝑙 𝑂2
𝑥𝑜 ∗ 𝑒(𝜇∗𝑡𝑙𝑜𝑔) = 𝐾𝐿𝑎 ∗ (𝐶𝐿∗ − 𝐶𝐿)
𝐾𝐿𝑎 =(4.0
𝑚𝑚𝑜𝑙 𝑂2
𝑔𝑏𝑖𝑜𝑚𝑎𝑠𝑠 ∗ ℎ𝑟∗
32𝑚𝑔 𝑂2
𝑚𝑚𝑜𝑙 𝑂2𝑥𝑜 ∗ 𝑒(𝜇∗𝑡𝑙𝑜𝑔))
(9.2 𝑚𝑔 𝑂2
𝐿− 2.76
𝑚𝑔 𝑂2
𝐿 )
𝐾𝐿𝑎𝑚𝑎𝑥 =398
ℎ𝑟
Agitation
Agitation is a necessary feature in bioreactors. In addition to simply homogenizing the
fermentation broth, agitation promotes heat transfer and reduces product and biomass gradients that
are common in large-scale industrial production (Käß et al., 2014). Another useful benefit occurs
when paired with aeration. By using an impeller for agitation, oxygen or air bubbles are of reduced
size. Smaller bubbles lead to a larger surface area, which ultimately aids in oxygen transfer from the
air inlet to the medium. Breaking the straight path of bubbles from the sparger to the head space will
also increase residence time of bubbles in the media, which further improves mass transfer.
Agitation parameters are based off of necessary power requirements and impeller selection.
Turbulent mixing conditions can be assumed for proper agitation. As such, a Reynold’s number (𝑅𝑒𝑖)
of 25000 was chosen.
𝑅𝑒𝑖 =𝜌𝐿∗𝑁𝑖∗𝐷𝑖
2
𝜇𝐿= 25000 Eqn. 35
Properties of the fermentation media will greatly affect the characteristics of flow within the
reactor. As opposed to water, media has added components that influence its viscosity. Specifically,
media will be more resistant to flow. A viscosity (μ) of 0.05 kg/m-s was found in literature for a
typical medium (Jursten, 1998). Using this value, a flat-blade Rushton turbine was selected as the
31
impeller type. As a radially-directing impeller, it is cost effective and useful for relatively low-
viscosity media. To size the impeller, the size of the bioreactor must be considered. Typically,
impeller diameter is 10% of that of the reactor.
With radial impellers, vortexes can be created in the media. The solution to this is
introducing baffles along the edges of the reactor. Baffle lengths are typically 5% of reactor diameter.
The length and width of the baffles as well as the diameter of the impeller are calculated in the
bioreactor design section and restated as follows:
𝐷𝑖𝑚𝑝𝑒𝑙𝑙𝑒𝑟 = 0.75 m
𝐿𝑏𝑎𝑓𝑓𝑙𝑒 = 3.75 m
𝑊𝑏𝑎𝑓𝑓𝑙𝑒 = 0.75 m
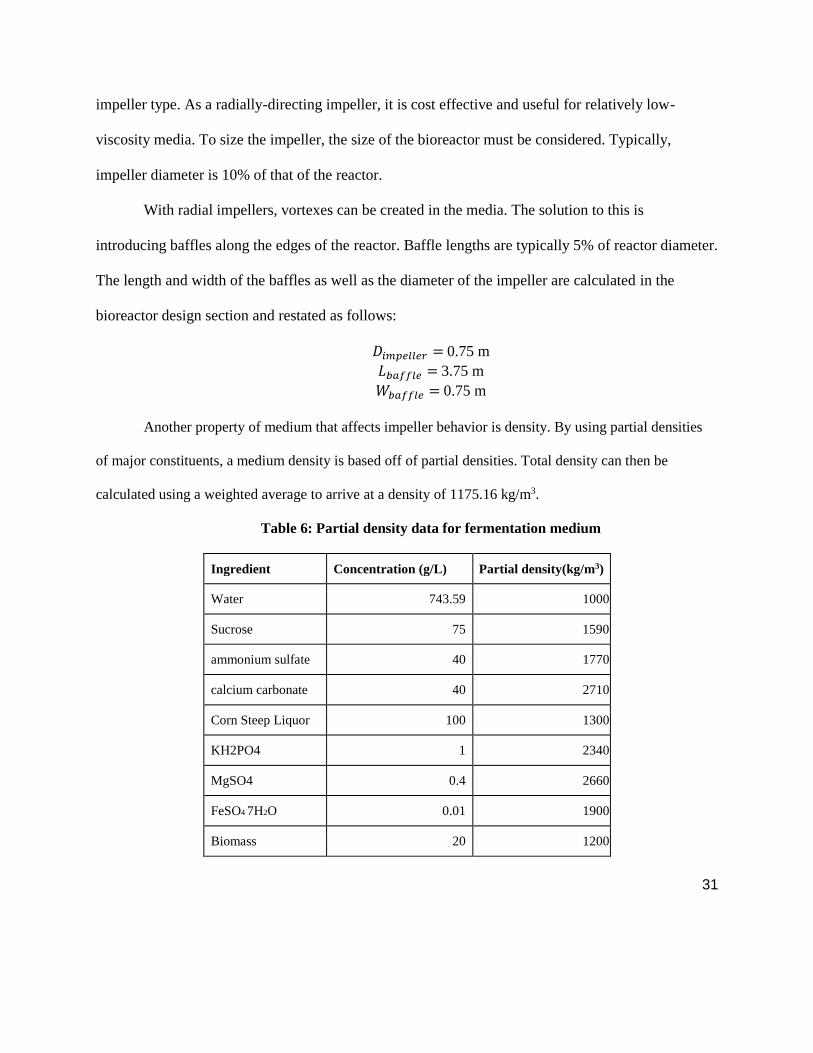
Another property of medium that affects impeller behavior is density. By using partial densities
of major constituents, a medium density is based off of partial densities. Total density can then be
calculated using a weighted average to arrive at a density of 1175.16 kg/m3.
Table 6: Partial density data for fermentation medium
Ingredient Concentration (g/L) Partial density(kg/m3)
Water 743.59 1000
Sucrose 75 1590
ammonium sulfate 40 1770
calcium carbonate 40 2710
Corn Steep Liquor 100 1300
KH2PO4 1 2340
MgSO4 0.4 2660
FeSO4 7H2O 0.01 1900
Biomass 20 1200
32
𝑑𝑒𝑛𝑠𝑖𝑡𝑦 = ∑𝑐𝑜𝑛𝑐𝑒𝑛𝑡𝑟𝑎𝑡𝑖𝑜𝑛 [
𝑔
𝐿]∗𝑝𝑎𝑟𝑡𝑖𝑎𝑙 𝑑𝑒𝑛𝑠𝑖𝑡𝑦[
𝑘𝑔
𝑚3]
1000= 1199.5
𝑘𝑔
𝑚3 Eqn. 36
After finding density, all variables are known for calculating angular impeller speed. Other
variables are Reynold’s number, viscosity, and diameter of impeller (equation 35).
𝑁𝑖 =𝑅𝑒𝑖𝜇
𝜌𝐷𝑖2 =
(25000)(0.05𝑘𝑔
𝑚−𝑠)
(1199.5𝑘𝑔
𝑚3)(0.7514 𝑚)2= 1.39
1
𝑠∗
60 𝑠
𝑚𝑖𝑛= 83 𝑟𝑝𝑚 Eqn. 37
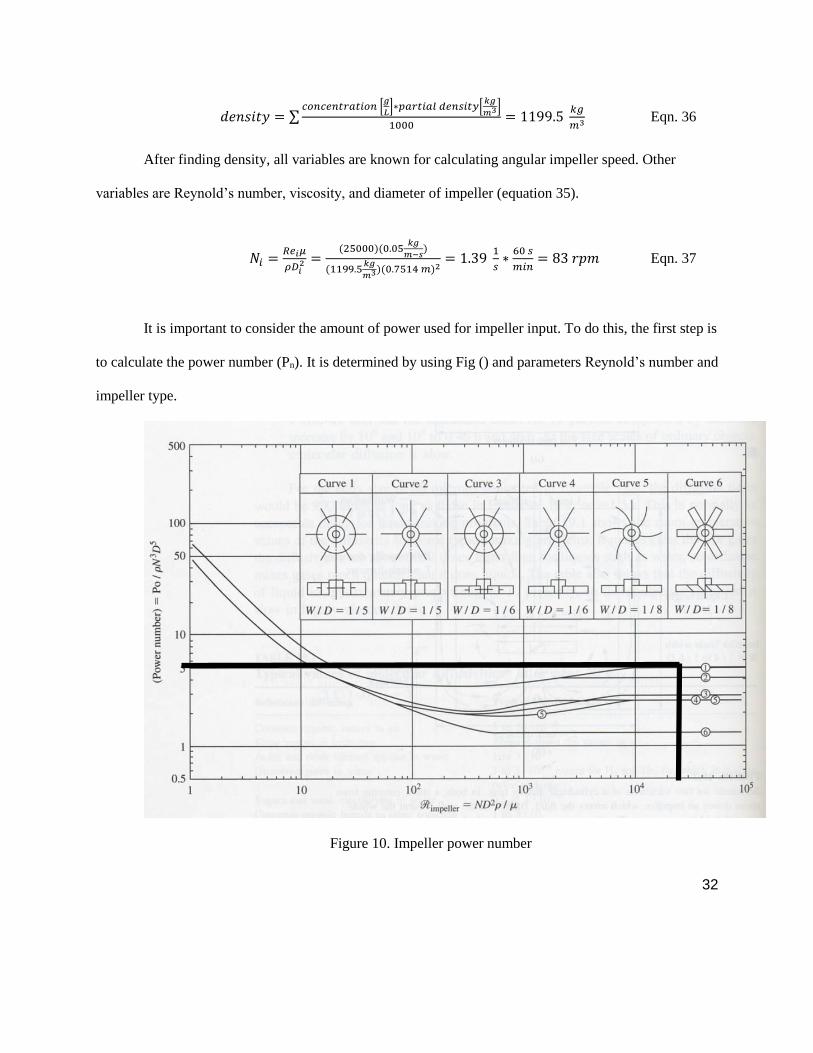
It is important to consider the amount of power used for impeller input. To do this, the first step is
to calculate the power number (Pn). It is determined by using Fig () and parameters Reynold’s number and
impeller type.
Figure 10. Impeller power number
33
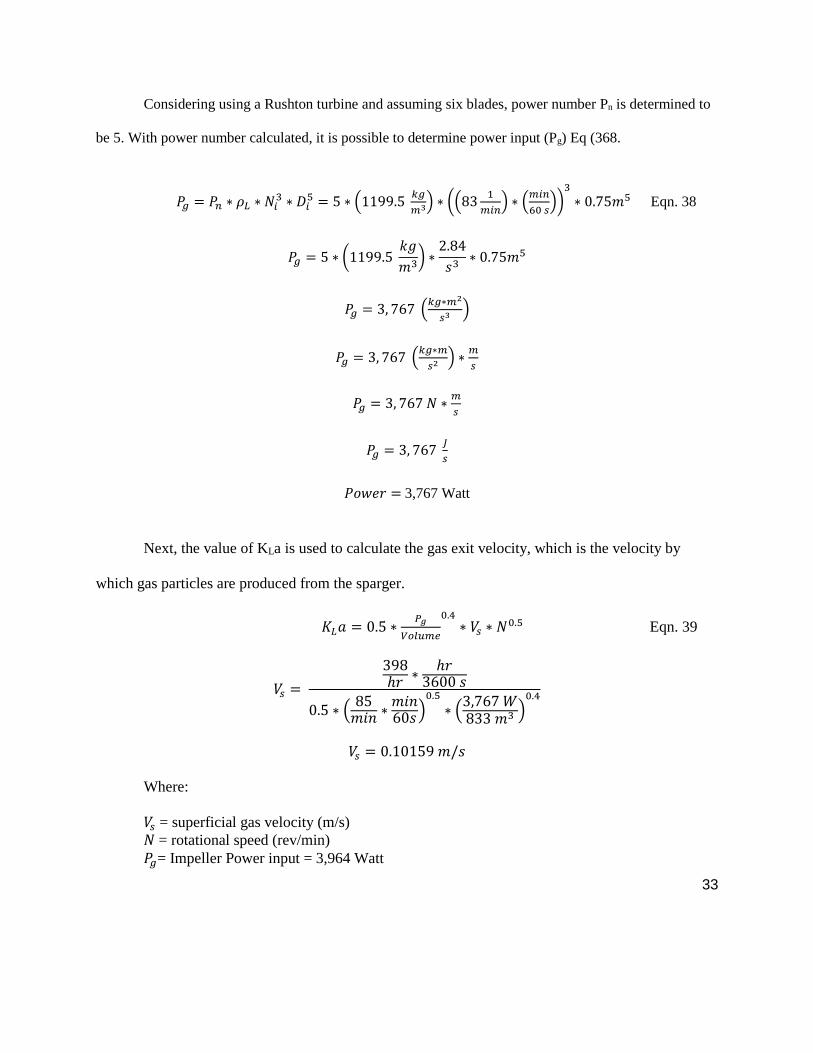
Considering using a Rushton turbine and assuming six blades, power number Pn is determined to
be 5. With power number calculated, it is possible to determine power input (Pg) Eq (368.
𝑃𝑔 = 𝑃𝑛 ∗ 𝜌𝐿 ∗ 𝑁𝑖3 ∗ 𝐷𝑖
5 = 5 ∗ (1199.5 𝑘𝑔
𝑚3) ∗ ((831
𝑚𝑖𝑛) ∗ (
𝑚𝑖𝑛
60 𝑠))
3
∗ 0.75𝑚5 Eqn. 38
𝑃𝑔 = 5 ∗ (1199.5 𝑘𝑔
𝑚3) ∗
2.84
𝑠3∗ 0.75𝑚5
𝑃𝑔 = 3, 767 (𝑘𝑔∗𝑚2
𝑠3 )
𝑃𝑔 = 3, 767 (𝑘𝑔∗𝑚
𝑠2 ) ∗𝑚
𝑠
𝑃𝑔 = 3, 767 𝑁 ∗𝑚
𝑠
𝑃𝑔 = 3, 767 𝐽
𝑠
𝑃𝑜𝑤𝑒𝑟 = 3,767 Watt
Next, the value of KLa is used to calculate the gas exit velocity, which is the velocity by
which gas particles are produced from the sparger.
𝐾𝐿𝑎 = 0.5 ∗𝑃𝑔
𝑉𝑜𝑙𝑢𝑚𝑒
0.4∗ 𝑉𝑠 ∗ 𝑁0.5 Eqn. 39
𝑉𝑠 =
398ℎ𝑟
∗ℎ𝑟
3600 𝑠
0.5 ∗ (85
𝑚𝑖𝑛 ∗𝑚𝑖𝑛60𝑠 )
0.5
∗ (3,767 𝑊833 𝑚3 )
0.4
𝑉𝑠 = 0.10159 𝑚/𝑠
Where:
𝑉𝑠 = superficial gas velocity (m/s)
𝑁 = rotational speed (rev/min)
𝑃𝑔= Impeller Power input = 3,964 Watt
34
Volume = bioreactor volume =833 m3
An assumption for orifice size and geometry must now be made. Orifices are assumed to be
circular, with a diameter of 15 cm. The area of a single orifice is calculated with equation 40.
𝐴𝑟𝑒𝑎𝑜𝑟𝑖𝑓𝑖𝑐𝑒 =𝑝𝑖
4∗ 𝑑𝑖𝑎𝑚𝑡𝑒𝑟𝑜𝑟𝑖𝑓𝑖𝑐𝑒
2 Eqn. 40
𝐴𝑟𝑒𝑎𝑜𝑟𝑖𝑓𝑖𝑐𝑒 = 0.01767 𝑚2
The total number of orifices must be calculated based on gas velocity and air flow rate. The
air flow rate in volume air/ volume media/ minute is assumed to be 0.1. This total number of orifices
is calculated by equation 41.
𝐴𝑖𝑟 𝑓𝑙𝑜𝑤 𝑟𝑎𝑡𝑒 = 𝑉𝑠 ∗ 𝐴𝑡𝑜𝑡𝑎𝑙 Eqn. 41
𝐴𝑖𝑟 𝑓𝑙𝑜𝑤 𝑟𝑎𝑡𝑒 = 𝑉𝑠 ∗ 𝐴𝑜𝑟𝑖𝑓𝑖𝑐𝑒 ∗ 𝑁𝑜𝑟𝑖𝑓𝑖𝑐𝑒𝑠
𝑁𝑜𝑟𝑖𝑓𝑖𝑐𝑒𝑠 =
0.1 𝑚3𝑎𝑖𝑟𝑚3𝑚𝑒𝑑𝑖𝑎 ∗ 𝑚𝑖𝑛
0.01767 𝑚2 ∗ 0.0995𝑚𝑠 ∗
60𝑠𝑚𝑖𝑛
𝑁𝑜𝑟𝑖𝑓𝑖𝑐𝑒𝑠 = 0.928 𝑜𝑟𝑖𝑓𝑖𝑐𝑒𝑠
𝑚3𝑚𝑒𝑑𝑖𝑎
The total number of orifices is calculated from the number of orifices per unit volume media,
knowing that the working volume of each bioreactor is 833 m3.
𝑁𝑢𝑚𝑏𝑒𝑟 𝑜𝑟𝑖𝑓𝑖𝑐𝑒𝑠 𝑡𝑜𝑡𝑎𝑙 = 0.928 𝑜𝑟𝑖𝑓𝑖𝑐𝑒𝑠
𝑚3𝑚𝑒𝑑𝑖𝑎 ∗ 833𝑚3 Eqn. 42
𝑁𝑢𝑚𝑏𝑒𝑟 𝑜𝑟𝑖𝑓𝑖𝑐𝑒𝑠 𝑡𝑜𝑡𝑎𝑙 = 774
In conclusion, and aeration and agitation system was designed for the bioreactor, which will
produce L-lysine. Several assumptions have been made, such as air flow rate and orifice size, based
on reasonable knowledge of these parameters in other systems. The assumption has been made that
35
the fermentation will be oxygen limited, that is, that while the system is operated the oxygen uptake
of the microorganisms will equal the oxygen transfer provided by aeration and agitation. The overall
system is now ready for further design considerations, such as product recovery and economic
analysis.
Downstream Processing
At this stage of the analysis, it is important to recognize the steps of production that have
already been elaborated, and determine the remaining steps as well. The formulation of medium,
fermentation parameters, and bioreactor design have all been accomplished, as has the design of a
sufficient aeration system and agitation system. The growth of the microorganism has been
quantified and production of product calculated. However, these steps are all part of primary
fermentation, and the result of these processes is still a dilute and multi-component solution of
dissolved product, which is of relatively little value without further processing. What is needed is an
effective way to both purify and concentrate the product into a form that can be sold. While
designing this process, several general heuristics for bioprocessing are kept in mind.
First, major impurities such as spent fermentation medium and biomass are to be removed as
early as possible in the overall scheme of processing (Zydney, 2015). This is because the earliest
possible removal of impurities allows the feed stream to be scaled down in volume, and thus
subsequent processing equipment can be designed at a smaller scale, which leads to reduced costs.
Second, the product is to be moved through the overall process as quickly as possible (Zydney,
2015). This prevents product breakdown as well as frees up equipment to process more batches in the
same amount of time, lowering labor and energy costs. Third, it is desired to remove general
impurities early, and then remove specific impurities with targeted purifications (if necessary) once

36
the feed stream has been scaled down, concentrated, and general impurities removed (Zydney, 2015).
This is because general impurities usually can be removed without impacting yield, whereas
obstinate specific impurities can sometimes only be reduced to acceptable levels using processes
which impact yield more severely, and it is desired to eliminate any steps early on in the process
which significantly decrease yield. In addition, specific impurity removal usually functions better at
smaller scales of volume and with highly concentrated product, and this is more easily achievable if
these steps are accomplished later in the processing. Lastly, specific impurity removal often involves
specialized and expensive equipment, and these costs can be reduced once the feed stream has been
concentrated (Harrison, 2003).
In the overall scheme of processing, it is necessary to determine whether the processing steps
will occur in batch or continuous form. In the case of L-lysine production, where the primary
fermentations are all batch processes, it is desired to move forward with batch processing as well.
This allows for better coordination between primary fermentation and downstream processing. It is
acknowledged that continuous processing is theoretically possible, but at this moment it is unlikely
that this is performed by any production group on an industrial scale (Wendisch, 2007).
It is also necessary to determine in what form the product is present in the fermentation
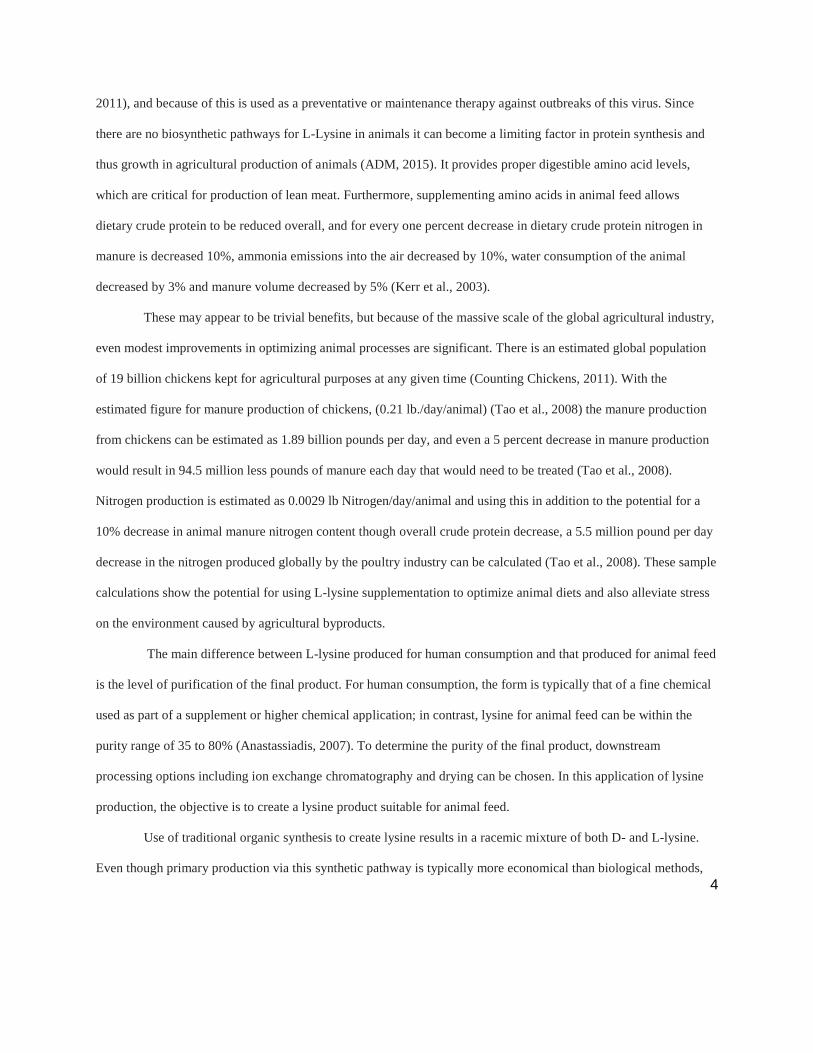
medium. In the case of L-lysine, which is secreted as an extracellular product, it is in solution
(Wendisch, 2007). This means that a good candidate for an initial step is the removal of biomass.
This is accomplished via rotary vacuum drum filtration.
In this step, the bioreactor is emptied slowly into a large tank, in which a partially submerged
drum covered in filtration medium is housed. This drum rotates and a vacuum is drawn in the center,
pulling broth out of the tank while filtering biomass. The biomass cake is continuously scraped off
37
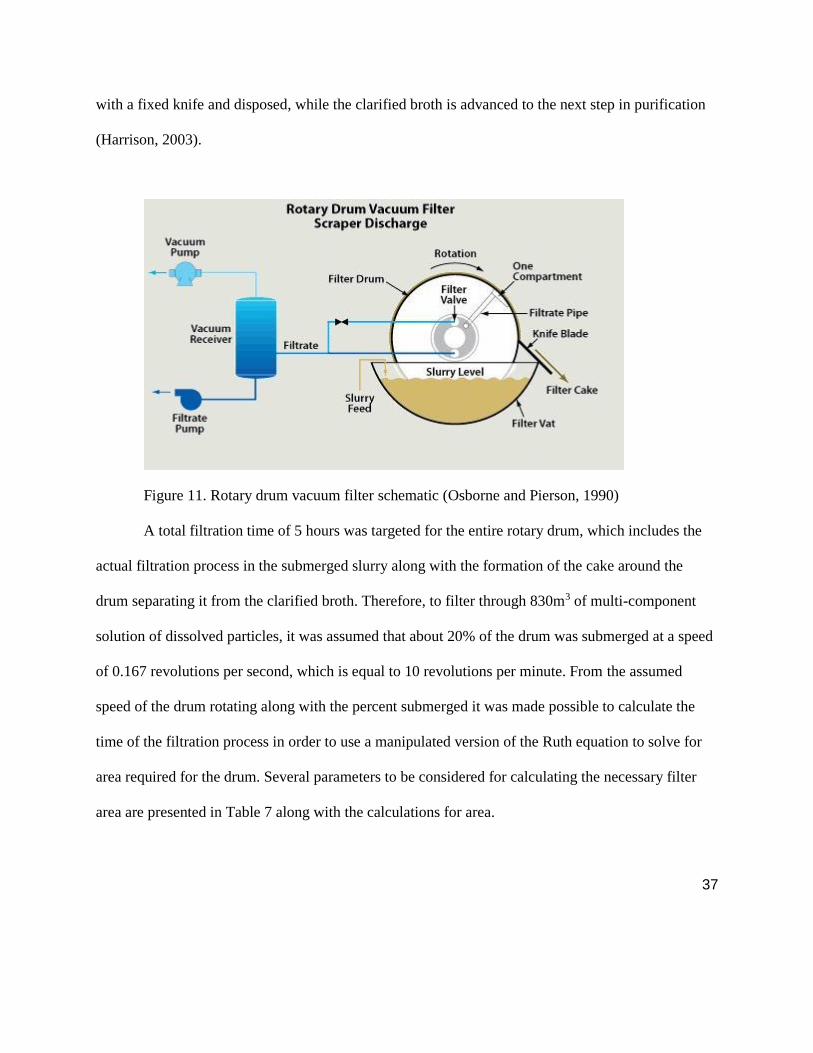
with a fixed knife and disposed, while the clarified broth is advanced to the next step in purification
(Harrison, 2003).
Figure 11. Rotary drum vacuum filter schematic (Osborne and Pierson, 1990)
A total filtration time of 5 hours was targeted for the entire rotary drum, which includes the
actual filtration process in the submerged slurry along with the formation of the cake around the
drum separating it from the clarified broth. Therefore, to filter through 830m3 of multi-component
solution of dissolved particles, it was assumed that about 20% of the drum was submerged at a speed
of 0.167 revolutions per second, which is equal to 10 revolutions per minute. From the assumed
speed of the drum rotating along with the percent submerged it was made possible to calculate the
time of the filtration process in order to use a manipulated version of the Ruth equation to solve for
area required for the drum. Several parameters to be considered for calculating the necessary filter
area are presented in Table 7 along with the calculations for area.
38
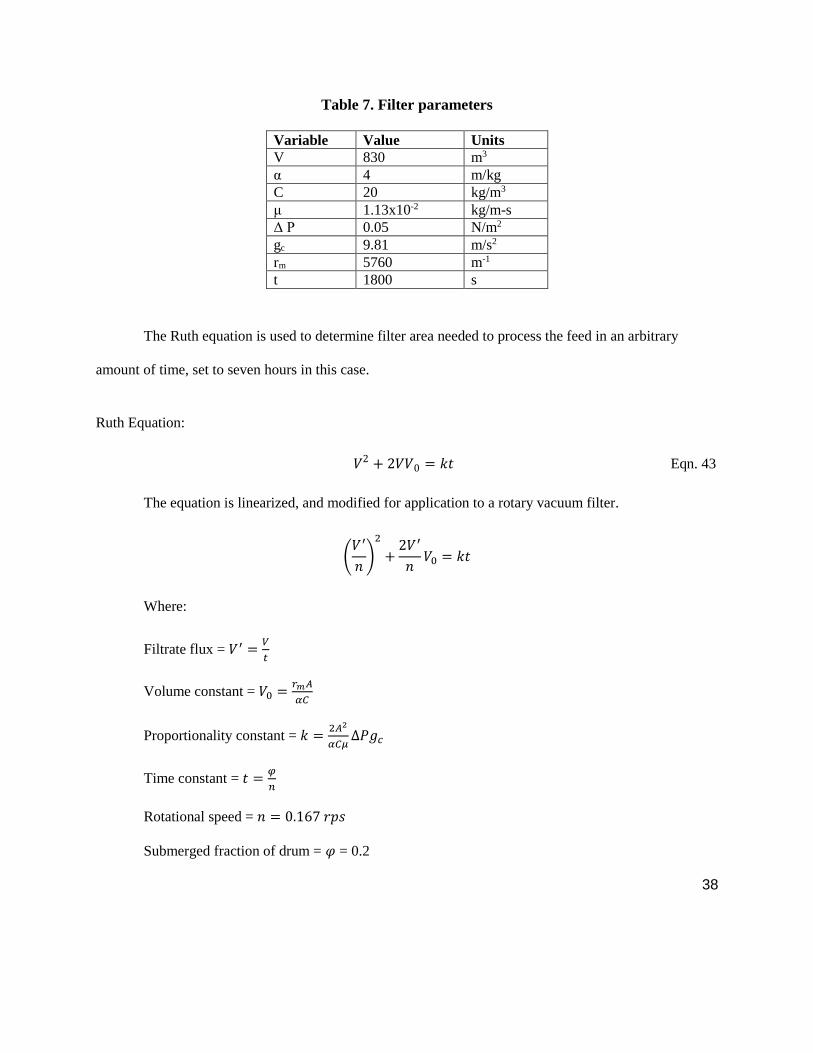
Table 7. Filter parameters
Variable Value Units
V 830 m3
α 4 m/kg
C 20 kg/m3
μ 1.13x10⁻² kg/m-s
Δ P 0.05 N/m2
gc 9.81 m/s2
rm 5760 m-1
t 1800 s
The Ruth equation is used to determine filter area needed to process the feed in an arbitrary
amount of time, set to seven hours in this case.
Ruth Equation:
𝑉2 + 2𝑉𝑉0 = 𝑘𝑡 Eqn. 43
The equation is linearized, and modified for application to a rotary vacuum filter.
(𝑉′
𝑛)
2
+2𝑉′
𝑛𝑉0 = 𝑘𝑡
Where:
Filtrate flux = 𝑉′ =𝑉
𝑡
Volume constant = 𝑉0 =𝑟𝑚𝐴
𝛼𝐶
Proportionality constant = 𝑘 =2𝐴2
𝛼𝐶𝜇Δ𝑃𝑔𝑐
Time constant = 𝑡 =𝜑
𝑛
Rotational speed = 𝑛 = 0.167 𝑟𝑝𝑠
Submerged fraction of drum = 𝜑 = 0.2
39
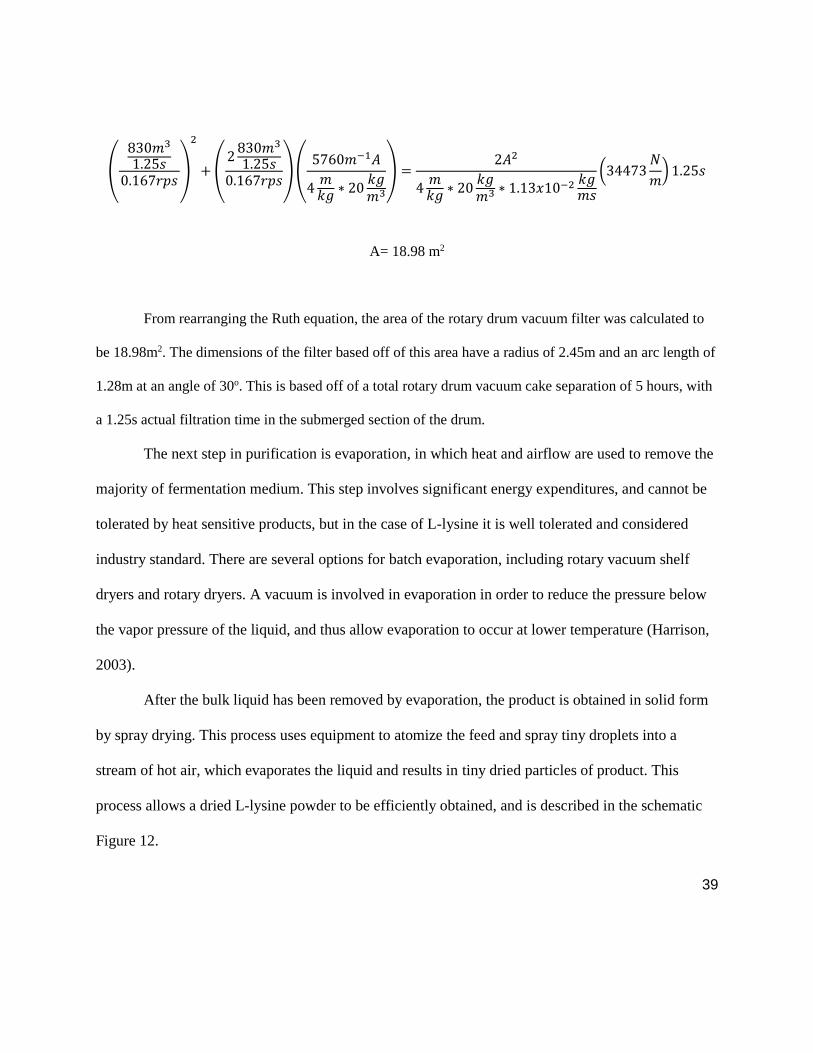
(
830𝑚3
1.25𝑠0.167𝑟𝑝𝑠
)
2
+ (2
830𝑚3
1.25𝑠0.167𝑟𝑝𝑠
) (5760𝑚−1𝐴
4𝑚𝑘𝑔
∗ 20𝑘𝑔𝑚3
) =2𝐴2
4𝑚𝑘𝑔
∗ 20𝑘𝑔𝑚3 ∗ 1.13𝑥10−2 𝑘𝑔
𝑚𝑠
(34473𝑁
𝑚) 1.25𝑠
A= 18.98 m2
From rearranging the Ruth equation, the area of the rotary drum vacuum filter was calculated to
be 18.98m2. The dimensions of the filter based off of this area have a radius of 2.45m and an arc length of
1.28m at an angle of 30o. This is based off of a total rotary drum vacuum cake separation of 5 hours, with
a 1.25s actual filtration time in the submerged section of the drum.
The next step in purification is evaporation, in which heat and airflow are used to remove the
majority of fermentation medium. This step involves significant energy expenditures, and cannot be
tolerated by heat sensitive products, but in the case of L-lysine it is well tolerated and considered
industry standard. There are several options for batch evaporation, including rotary vacuum shelf
dryers and rotary dryers. A vacuum is involved in evaporation in order to reduce the pressure below
the vapor pressure of the liquid, and thus allow evaporation to occur at lower temperature (Harrison,
2003).
After the bulk liquid has been removed by evaporation, the product is obtained in solid form
by spray drying. This process uses equipment to atomize the feed and spray tiny droplets into a
stream of hot air, which evaporates the liquid and results in tiny dried particles of product. This
process allows a dried L-lysine powder to be efficiently obtained, and is described in the schematic
Figure 12.
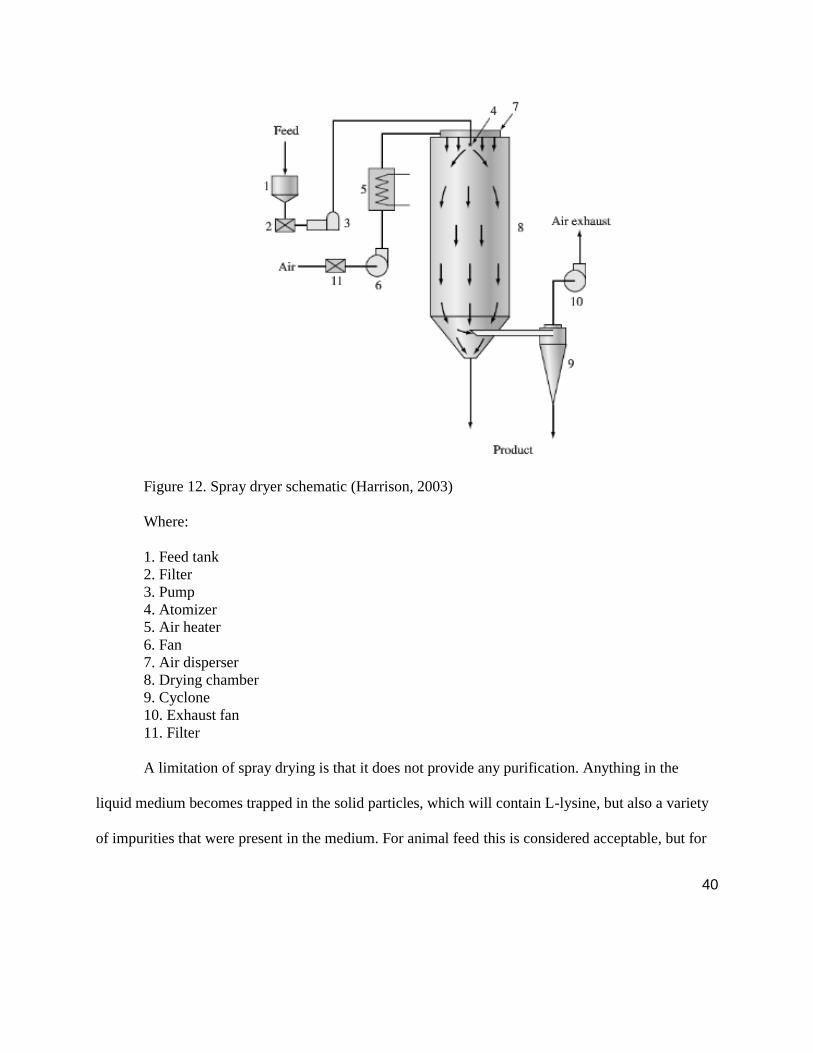
40
Figure 12. Spray dryer schematic (Harrison, 2003)
Where:
1. Feed tank
2. Filter
3. Pump
4. Atomizer
5. Air heater
6. Fan
7. Air disperser
8. Drying chamber
9. Cyclone
10. Exhaust fan
11. Filter
A limitation of spray drying is that it does not provide any purification. Anything in the
liquid medium becomes trapped in the solid particles, which will contain L-lysine, but also a variety
of impurities that were present in the medium. For animal feed this is considered acceptable, but for
41
research or pharmaceutical use a much higher degree of purity would be required. In order to provide
the possibility of producing a higher grade of L-lysine, a different recovery process could be used in
place of spray drying. A good candidate unit operation for this process is ion exchange
chromatography (IEX).
Ion exchange chromatography involves pushing the feed stream through a column that is
packed with resin. The product is bound to the resin, then the column is washed with a buffer to
expel unbound impurities. Finally, the column is eluted under different conditions than those under
which binding occurred (Zydney, 2015). This allows the product to leave the solid phase and re-enter
the liquid phase, then become expelled from the column where it can be captured and moved to a
higher purity storage. Since L-lysine is positively charged at neutral pH, the column would be packed
with an anionic resin. This would allow the binding of the product at neutral pH. Elution would occur
at a pH higher than the isoelectic point for L-Lysine, which is 9.75. At this pH, the product becomes
neutral and leaves the solid phase. It can then be eluted from the column at both high concentration
and purity.
This process is not feasible for the general production of animal feed for several reasons.
First, IEX resins and control systems tend to be very expensive, and secondly, function at relatively
low flow rates, well below those which would be necessary to process the amounts of L-lysine
necessary to have an impact in the market for animal feed (Harrison, 2003). It is nevertheless an
interesting addition to the overall process that could function in parallel with spray drying and be
used to produce a product at higher purity, which could allow the operation to follow the demands of
the market any given time and operate with flexibility that could lead to higher profits.
42
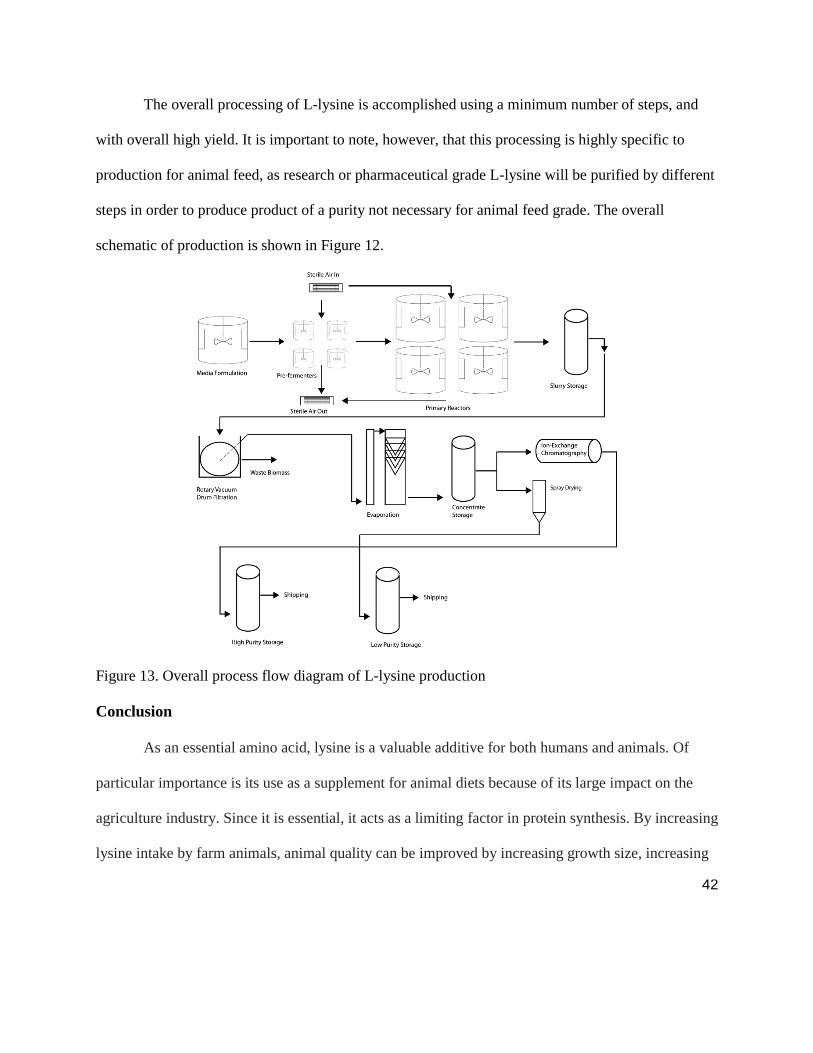
The overall processing of L-lysine is accomplished using a minimum number of steps, and
with overall high yield. It is important to note, however, that this processing is highly specific to
production for animal feed, as research or pharmaceutical grade L-lysine will be purified by different
steps in order to produce product of a purity not necessary for animal feed grade. The overall
schematic of production is shown in Figure 12.
Figure 13. Overall process flow diagram of L-lysine production
Conclusion
As an essential amino acid, lysine is a valuable additive for both humans and animals. Of
particular importance is its use as a supplement for animal diets because of its large impact on the
agriculture industry. Since it is essential, it acts as a limiting factor in protein synthesis. By increasing
lysine intake by farm animals, animal quality can be improved by increasing growth size, increasing
43
lean meat percentage, and decreasing manure nitrogen levels that lead to ammonia emissions. The
global agriculture industry is of a huge scale, and these benefits lead to a more efficient system. As
such, this report offered a design for L-lysine production for use as animal feed supplements. This
product can be created by a biological step to account for the L-stereoisomer and only needs to be
purified to 60%. A goal yield of 25,000 tons/yr was decided.
The lysine was produced by Corynebacterium glutamicum through aerobic
fermentation. C. glutamicum has been widely used to produce L-lysine because it is able to
metabolize inorganic nitrogen sources and a variety of carbon sources, making it a very useful
microbe for large-scale production. It has an optimal temperature of 30° C and needs an efficient
oxygen supply, making aeration and agitation extremely important. With an acceptable concentration
of 70 g/L of lysine in the bioreactor, 20 g/L of biomass is needed. The bioreactor has a working
volume of 830,000 L and can be run 96 times/ yr. The prefermentor then has a working volume of
8,300 L. Main fermenter is 22.5 m high and 7.5 m wide and supplemented with a 0.75 m impeller
running at 18 rpm. With a specific oxygen uptake rate of 4.0 mmol O2/g biomass-hr, kLa would have
to be 0.0034 /s.
After the bacteria produced the expected yield of lysine, downstream processing begins.
Specifically, this refers to separation and purification of the broth into the final product. After first
filtering the broth by a rotary drum vacuum filter to remove the biomass and other solids, the
resulting liquid is evaporated. This final solution is sent through a spray dryer to create isolated
particles of product. Using this multistage system, the fermentation broth is transformed into a
marketable, useful lysine supplement.
44
Limitations and Recommendations:
Several limitations of this design process must be recognized. The first assumption made is
the production goal (10% of the global market share), which is assumed to be a share which could
lead to a profitable operation. Secondly, it is assumed that large scale fermentation will remain to be
the most economical option for production of L-lysine. Significant advances in synthetic organic
chemistry or chiral molecule separation could theoretically change this. L-lysine is an inherently
valuable product because it is an amino acid which is not biosynthesized in mammals. It is thus also
assumed that the metabolism of agricultural animals will not be altered through genetic engineering
to allow synthesis of L-lysine. This type of major metabolic engineering is considered highly
unlikely, and coupled with the growing agricultural industry, L-lysine should remain a useful product
for the foreseeable future.
Several fermentation parameters were gathered from literature, but must be considered
assumptions that would require experimental validation. These include specific growth rate and the
achievable final concentration of L-lysine. Likewise, the aeration rate, optimal temperature, optimal
pH, inoculum concentration, saturation biomass, and medium composition are taken from literature
detailing optimization efforts for this fermentation, but should also be validated experimentally.
In the calculation of volume needed to cover the production goal, it is assumed that 100
percent of product produced will be recovered and sold. This assumption will need to be adjusted for
each individual operation. Idle time, lag phase growth time and stationary phase times were all taken
from literature, but should be considered cautiously. It was assumed that production can only run for
11 months of the year, and that the plant can operate on a 24 hour schedule.
45
It is assume that the head space of the reactor is 20% of the working volume, that ratio of
diameter to height is one to three, that the reactor is a perfect cylinder with flat head and base plates,
and that it operates at 5 psi (largely determined by the air-out filter). It is assumed that the diameter
of the impeller is 10% of the diameter of the reactor, that the length of the baffles is 50% of the
length of diameter of the reactor, and that the width of the baffles is 10% of the diameter of the
reactor.
It is assumed that an acceptable probability of unsuccessful sterilization is 0.001, that the Kd
value for spores is 1/min, and that the concentration of spores in the medium is 1*105/L.
A value for the specific oxygen uptake of the microorganism is taken from literature, and
that this value is constant for all times during the fermentation. It is assumed that oxygen uptake will
equal oxygen transfer rate during the process, as well as that the fermentation will be carried out for
conditions where the concentration of dissolved oxygen is 30% of the maximum concentration.
It is assumed that the Reynolds’s number of the medium will be 25,000, as well as that the
microorganism can tolerate the shear induced by this agitation. The viscosity of the medium was
found in literature but should also be validated. It is assumed that a Rushton type impeller will be
used in the reactor. It is assumed that orifices for aeration will be 10 cm in diameter and circular.
For processing, it is assumed that sufficient mass transfer could be achieved in an ion
exchange chromatography column without requiring pressure drop greater than the specified
allowable drop for an IEX column for the fermentation medium that is used.
46
Acknowledgements
Our team would like to thank professor Dr. Demirci for teaching us the fundamental concepts
and theories that could be applied to design a process for the production of L-lysine
by Corynebacterium glutamicum. His willingness to give us his time to help us understand and
design each step in the process has been very much appreciated.
We would also like to thank the Department of Agricultural and Biological Engineering and
The Pennsylvania State University for having an unlimited amount of resources including text
references along with hands on laboratory experience to help us fully understand how concepts
learned in class are performed on a small scale to then be applied on an industry scale for our
project.
From the support of Dr. Demirci and the Ag and Biological Engineering department at Penn
State, it was made possible to complete and design an industry process for the production of l-lysine
by Corynebacterium glutamiacum.
47
References
Alibaba. Cost of Corn Steep Liquor Powder. Available at: http://www.alibaba.com/product-detail/corn-
steep-liquor-powder-with-high_604607007.html. Accessed on 25 January 2015.
Aragony, A., I. Oliveira, M. Machado, D. Bordin, L. Bergter, D. Pra, and J Henriques. 2013. The
Influence of Micronutrients in Cell Culture: A Reflection on Viability and Genomic
Stability. BioMed Research International. http://www.hindawi.com/journals/bmri/2013/597282/.
Archer Daniels Midland Company (ADM). 2015. ADM L-Lysine HCL Fact Sheet.
Badino, A.C., M.C.R. Facciotti, and W. Schmidell. 2001. Volumetric oxygen transfer coefficients (kLa)
in batch cultivations involving non-Newtonian broths. Biochemical Engineering 8(2001): 111–
119.
Brignole, E. and J. McDowell. 2001. Amino Acid Racemization. Today’s Chemist at Work 6(2): 1532-
4494. http://pubs.acs.org/subscribe/archive/tcaw/10/i02/html/02brignole.html. Accessed January
25, 2015.
Clark, M. A. Sugar: 2014. Encyclopedia Britannica. Available at:
http://www.britannica.com/EBchecked/topic/571880/sugar. Accessed 24 January 2015.
Demirci, A. 2015. BE 468 Lab Manual. Pennsylvania State University, University Park, PA.
Economist Online. 2011. Global Livestock Counts: Counting Chickens. The Economist.
http://www.economist.com/blogs/dailychart/2011/07/global-livestock-counts. Accessed January
25, 2015.
Ehrlich, S. 2013. Lysine. University of Maryland Medical Center. Baltimore, MD. 2011
http://umm.edu/health/medical/altmed/supplement/lysine. Accessed January 25, 2015.
48
Engasser, J. M. and S. Guillouet. 1995. Growth of Corynebacterium glutamicum in glucose-limited
continuous cultures under high osmotic pressure. Influence of growth rate on the intracellular
accumulation of proline, glutamate and trehalose. Appl. Microbiol. and Biotechnol. 44(3-4): 496-
500.
Gorton, B. S., J. N. Coker, H. P. Browder, and C. W. DeFiebre. 1963. A process for the production of
lysine by chemical and microbiological synthesis. Ind. Eng. Chem. Prod. Res. Dev. 2(4): 308-
314.
Harrison, R. 2003. Bioseparations Science and Engineering. New York. Oxford University Press.
Heinzle, E., A. Biwer, and C. Cooney. 2006. Development of Sustainable Bioprocess. West Sussex,
England.
Humphrey, A. S. and E. Lee. 1992. Riegel’s Handbook of Industrial Chemistry. Ninth Edition. New
York. Van Nostrand Reinhold.
Käß, F., S. Junne, P. Neubauer, W. Wiechert, and M. Oldiges. 2014. Process inhomogeneity leads to
rapid side product turnover in cultivation of Corynebacterium glutamicum. Microbial Cell
Factories. 13:6.
Kalinowski, J. "Fermentative Production of Amino Acids and Vitamins by Corynebacteria". Universität
Bielefeld. Genetik. http://www.genetik.uni-bielefeld.de/Genetik/coryne/coryne.eng.html
Kerr, Y. and E. Nienaber. 2003. Influences of dietary protein level, amino acid supplementation and
environmental temperature on performance, body composition, organ weights and total
heat production of growing pigs. Journal of Animal Science.
http://www.ncbi.nlm.nih.gov/pubmed/12926782#. Accessed February 12, 2015.
Kjeldsen. 2008. Optimization of an industrial L-lysine producing Corynebacterium glutamicum
strain. Technical University of Denmark, Department of Systems Biology.
49
L-Lysine: an essential feed ingredient. International Starch Institute, Aarhus N, Denmark. Available at:
http://www.starch.dk/isi/bio/lysine.asp. Accessed 12 February 2015.
Lysine K (Lys). 2003. The Biology Project. Biochemistry. http://www.biology.arizona.edu. Accessed
January 25, 2015.
Moulton, G. 2014. Fed-batch fermentation: A practical guide to scalable recombinant protein
in Escherichia coli. Cambridge. Woodhead Publishing.
McConnell, M. 2014. U.S. Sugar Production. United States Department of Agriculture. Available at:
http://www.ers.usda.gov/topics/crops/sugar-sweeteners/background.aspx. Accessed 24 January
2015.
Oh, J. W., S.J Kim, Y.J. Cho, N. H. Park, and J.H. Lee, 1993. Fermentation using Corynebacterium
glutamicum. US5268293.
Osborne, D. G. and H. G. Pierson. 1990. Vacuum Filtration. Solid-Liquid Separation. 3rd ed. Ed.
Ladislav Svarovsky. London: Butterworth & Co. Ltd, 1990: 415-446, 466-475.
Ozcan, N, C. Ejsinger, and A. Shevchenko. Osmolality, Temperature, and Membrane Lipid Composition
Modulate in Activity of Betaine Transporter BetP in Corynebacterium glutamicum. Journal of
Bacteriology: 2007. 189(20): 7485-7496.
Pythia Institute of Biotechnology. Recent Patents on Biotechnology 2007: L-Lysine Fermentation.
Revised: 22 November 2006.
Rao, D., S. Razak, B. Praveena, and A. Swamy. 2007. Dissolved oxygen concentration analysis of L-
Lysine fermentation production by Corynebacterium glutamicum .The Internet Journal of
Pharmacology 6(1).
50
Anastassiadis, S. L-Lysine Fermentation. 2007. Recent Patents on Biotechnology 1: 11-24.
Shah, A., H. A. Haleem, and G. M. Khan. 2002. Fermentative Production of L- Lysine: Fungal
Fermentation and Mutagenesis- II, A Review. Pakistan Journal of Pharmaceutical Sciences
15(2): 29-25.
Shuler, M. and F. Kargi. 2002. Bioprocess Engineering- Basic Concepts, Second edition, 263-266. Upper
Saddle river, NJ: Prentice Hall PTR.
Tao, J. and K. Mancl. 2008. Agricultural Factsheet: Estimating Manure Production, Storage Size, and
Land Application Area. The Ohio State University. http://ohioline.osu.edu/aex-fact/pdf/0715.pdf.
Accessed January 25, 2015.
Y. Toride. 2002. Lysine and other amino acids for feed: production and contribution to protein utilization
in animal feeding. Protein Sources for the Animal Feed Industry. Ajinomoto Co., Inc.
http://www.fao.org/docrep/007/y5019e/y5019e0a.htm. Accessed January 25, 2015.
USDA, NASS, Agricultural Press. Table 12- Sugarbeet: price per ton, by State and United States.
Updated 13 August 2014.
Wendisch, V. 2007. Amino acid biosynthesis: pathways, regulation, and metabolic engineering.
Microbiology Monographs. DOI 10.1007/978-3-540-48596-4
Zydney, A. 2015. CHE 449 Course materials. Pennsylvania State University, University Park, PA.