l e t the b of us news l s r
TRANSCRIPT

20 GREEN BAG 2D 253
LEGAL EDUCATION THROUGH THE BLURRY LENS OF US NEWS LAW SCHOOL RANKINGS
Andrew P. Morriss†
HE CHINESE CHARACTERS in the title of this piece are the closest thing to the apocryphal “Chinese curse” of “may you live in in-teresting times.” The closest actual proverb is “Better to be a dog in a peaceful time, than to be a human in a chaotic period.”1
This seems a fitting metaphor for what has been going on in legal educa-tion since 2008, when things began to get “interesting.” That the attribu-tion of the English version of the curse is apocryphal and that I’ve taken the “true” meaning from Wikipedia (although I did check with a native Chinese-speaking friend, who assures me that Wikipedia is accurate on this point) is a good metaphor for rankings and their impact on legal edu-cation. Applicants, law review editors, alumni, and many more people rely on US News’s law school rankings to evaluate law schools, as secure in their knowledge that these are a valid source of information on relative merit as are those people who confidently attribute the “may you live in interesting times” version of the curse to a non-existent Chinese language source are in theirs.
† Andrew P. Morriss is Dean and Anthony G. Buzbee Dean’s Endowed Chair at the Texas A&M University School of Law. This article uses data submitted by schools for the 2018 cover date (2017 publication date) US News rankings unless otherwise noted.
1 May you live in interesting times, Wikipedia, en.wikipedia.org/wiki/May_you_live_in_ interesting_times (last visited Jan. 28, 2017).
T

Andrew P. Morriss
254 20 GREEN BAG 2D
Just as the apocryphal curse bears a resemblance to an actual proverb about dogs and peaceful times, so the US News rankings reflect – if through rather blurry glass – where legal education is.2 With the caveats that there are many bad things that have come from rankings, and from the illusory precision of US News rankings in particular,3 and that a great deal of what the rankings reflect is a fairly stable pecking order, as well as having tor-tured this metaphor as far as I can, let’s look at the data that US News uses and see what it reveals about where legal education is headed.
REPUTATION RANKINGS orty percent of the total overall US News ranking comes from two sur-veys, the results of which are commonly referred to as “reputation”
rankings or scores. Twenty-five percent of the total is based on a survey of four people at each school (the dean, the academic associate dean, the chair of the faculty appointments committee, and the most recently ten-ured faculty member). Fifteen percent comes from a survey of lawyers and judges, which for the past few years has been drawn from names sub-mitted by law schools (each is invited to submit ten). Because of the rela-tively low response rates, this is a three-year rolling average of the survey
2 Many of us spend far too much time dissecting the minutiae of the rankings – a guilty
pleasure right up there with binge watching old TV shows. 3 See WENDY NELSON ESPELAND & MICHEAL SAUDER, ENGINES OF ANXIETY: ACADEMIC
RANKINGS, REPUTATION, AND ACCOUNTABILITY (2016). Professor Brian Leiter provides a concise statement of what academic rankings ought to focus on. Brian Leiter, How to Rank Law Schools, 81 INDIANA L.J. 47 (2006). Leiter’s blog, Brian Leiter’s Law School Reports, is also an excellent resource for identifying what’s wrong with current rankings. What US News does well is to assemble information on all schools into one easy-to-use place. Its rankings then assign a precise-appearing number to each school, which is convenient for those comparing schools who do not want to dig into details. This convenience is some-thing that applicants appear to value. It also seems to be something that law professors val-ue, given the emphasis put on placement in journals published at higher-ranked schools over those published at lower-ranked ones, rather than relying on impact rankings like the Washington & Lee ranking of journals or more direct evidence of impact such as downloads or citations. If we want applicants and law review editors to stop checking our schools’ rankings in deciding where to apply or whether or not to accept our manu-scripts, the academy ought to model good behavior and come up with some better ways to assess the value of our scholarship than the median LSATs of the class of the student editors who accepted or rejected it.
F

Legal Education Through the Blurry Lens of US News
SPRING 2017 255
responses. Surveys are done in the fall and enter into the calculation of the following spring’s publication.4 These are the major unique content in US News’s ranking (which originated in a survey of law deans about law schools in 1987), which may account for their heavy weighting in the sur-vey. Somewhat surprisingly, just 67% of eligible US News academic voters sent in the surveys this past year.5
What can we learn from these surveys? There are obvious limitations. For example, it is not clear how much a lawyer in Texas knows about law schools in Ohio or vice versa, but each is offered the chance to rate every ABA-accredited law school between 1 (“marginal”) and 5 (“outstanding”) nonetheless. Similarly, faculty in Texas might know a bit more about law schools in Ohio (or vice versa) than do Texas lawyers, but probably not a huge amount more about many schools. Yet everyone gets to vote on all the schools.
These are, however, the only regular national surveys of law faculty (some of them, anyway) or lawyers about law schools, so they are inter-esting. Several excellent studies of these rankings have been done over the past few years that are worth reading for those interested in them.6 Table 1 gives some summary statistics that illustrate trends over the past three years in the reputation scores.
There are three quite interesting things in the data. First, the voters seem to understand strategic behavior reasonably well. No school gets a 5-out-of-5 ranking in either survey. If we look at the top 14 schools (the “T14” – a group that has so far rebuffed all but the University of Texas’s spring 2017 move into it), in the 2017 ranking, the median academic rep-utation score is a 4.3 and the median lawyer/ judge ranking is a 4.4. This means that a reasonable number of voters are marking less than 5-out-of-5
4 US News puts the following year’s date on its March law school ranking, so the March 2016 ranking is labeled by the magazine as the 2017 ranking. All rankings dates in this article are the cover dates.
5 Methodology, US NEWS & WORLD REPORT, BEST GRADUATE SCHOOLS 67 (2017). Given the impact of the rankings, the small pool (just over 800 total voters), and the ease of voting (at least for your own school and your alma mater), this may reflect such distaste or indifference for the rankings enterprise that bubbling in a few circles is not worth the minimal effort.
6 For example, Robert L. Jones, A Longitudinal Analysis of U.S. News Law School Academic Reputation Scores Between 1998 and 2013, 40 FLA. ST. U. L. REV. 721 (2013).

Andrew P. Morriss
256 20 GREEN BAG 2D
for Yale, Harvard, Stanford, Chicago, Columbia, NYU, Penn, Michigan, Berkeley, Virginia, Duke, Northwestern, Cornell, and Georgetown. Since US News terms a 5 as “outstanding,” it seems hard to imagine that these schools do not merit that label. Yet their peer scores range from 3.9 to 4.8 and their lawyer/judge scores from 4.1 to 4.8. Since a quite large percentage of the academic voters graduated from these schools,7 one po-tential explanation is that the alumni of each school are giving lower scores to their schools’ rivals and higher scores to their own schools and alma maters. Otherwise it is hard to see why Virginia is a 4.3 and Berkeley a 4.5. The same might be said of any other pair in that group. This high-lights the arbitrary nature of the US News rankings.
Second, it is generally true that the lawyers and judges surveyed think more highly of virtually all law schools than do the academics surveyed. Indeed, the only law school that scored lower on the lawyer/judge rank-ing than on the academic ranking consistently over the last three years is Yale, which has come in 0.1 lower for the past three years. Connecticut also scored 0.1 lower in the lawyer/judge ranking than in the academic ranking in two of the past three years, so perhaps it is some bias against that state among the bar. Interestingly, the gaps get larger as we go down the rankings hierarchy, suggesting that at least the sample of lawyers polled by US News thinks better of lower-ranked law schools than the sam-ple of academics polled. For example, for the past three years, the differ-ence in the medians of the two rankings is just 0.2 for the top 25 but is 0.6 for the 100-150 group and the unranked schools.
Third, these scores make a pretty solid obstacle to major changes in the overall ranking order. Every school bounces up and down from year to year, but there is remarkable stability in the peer and lawyer/judge rank-ings over time. Bill Henderson discussed this in a 2012 Legal Whiteboard post that showed that 88% of the variation among schools’ 2012 peer ranking was attributable to their 1993 peer ranking.8 Jeff Stake similarly found evidence of an echo effect, in which earlier rankings affected later
7 See Daniel Martin Katz, et al., Reproduction of Hierarchy? A Social Network Analysis of the
American Law Professoriate, 61 J. LEGAL ED. 1 (2011). 8 William D. Henderson, How to Improve Your Law School’s Academic Reputation, The Legal
Whiteboard (Nov. 19, 2012) available at lawprofessors.typepad.com/legalwhiteboard/ 2012/11/how-to-increase-your-law-schools-academic-reputation.html.

Legal Education Through the Blurry Lens of US News
SPRING 2017 257
position.9 My own exploration of the data revealed that the lawyer/judge ranking had more variation from year to year than the peer ranking before US News began the three-year averaging but it is now less volatile.
The survey results are a barrier to large-scale movement because, as Table 1 suggests, relatively few schools in a ranking cohort overlap with the adjoining cohorts on reputation scores. Over the last three years, the most common cumulative change in all ranking cohorts other than the unranked tier was zero; in that last group the most common cumulative change was -0.1 for the lawyer/judge ranking.
The differences in scores for different ranking cohorts are substantial and the changes schools have achieved in their rankings relatively small, suggesting these reputation scores are not going to move a great deal in the future. Many law schools have sent out many brochures over many years in an effort to change their reputations. These reputations turn out to be quite sticky, however, and so reputations have changed less than the schools mailing out the brochures probably hoped. (The prize for the big-gest reputation change in Robert Jones’s study of 1998-2013 goes to Michigan State. It got the biggest boost in both categories, which seems most likely to have been a result of the affiliation of the former Detroit College of Law with Michigan State University in 1995, its move to East Lansing, and its ability to build on the new affiliation thereafter.) If a school moves up or down in the overall rankings and stays in its new posi-tion, it appears reputation scores gradually start to converge on a level closer to that position. This takes considerable time, however.
The broader conclusion this suggests is that – despite the continuing turmoil in legal education – neither the bar nor the academy has much changed its opinion about the relative merits of many schools.10 That could be an artifact of the populations US News has chosen to survey. But if there was some general shift in attitudes about legal education either among fac-ulties or among the bar, it seems likely it would be reflected in some way in the survey results. Of course, that could be because the academy and
9 Jeffrey Evans Stake, The Interplay Between Law School Rankings, Reputations, and Resource
Allocation: Ways Rankings Mislead, 81 INDIANA L. J. 229 (2006). 10 This is consistent with what my coauthors and I found about stability of hierarchy over
time. See Olufunmilayo Arewa, Andrew P. Morriss, & William D. Henderson, Enduring Hierarchies in American Legal Education, 89 INDIANA L. J. 941 (2014).

Andrew P. Morriss
258 20 GREEN BAG 2D
the profession have their heads stuck in the sand, as many outside com-mentators have suggested (often with less polite terms than “sand”).
One important question is whether we can do better at assessing dif-ferent aspects of law schools’ reputations to provide those who consume rankings with better information. Brian Leiter has tried to do so, with his Condorcet voting poll.11 However, as Leiter notes, many of the results tracked “the U.S. News nonsense number, which is many things but not a measure of the scholarly distinction of the faculty.” Nonetheless, this is a promising start on a more robust methodology for determining general academic reputation.
Others have proposed rankings based on SSRN downloads or other measures of scholarship, all of which pose their own problems.
As many deans and university administrators have noticed, accrediting and regulatory agencies – which for most law schools include both the ABA and the regional accrediting body for the broader university and, for public schools, higher education coordinating boards – are showing in-creased interest in universities being able to document impact, teaching quality, and other variables. If legal education wants to continue to have its current relatively large degree of control over its destiny (relative to many other disciplines), some measures of scholarly productivity and im-pact will need to be developed and accepted broadly enough that we do not end up with measures we do not like. For example, many academic departments are now being evaluated at universities using data from Aca-demic Analytics on citations, awards, research grants, and so forth. This has not led to great joy among all those so measured.12 Perhaps fortunate-ly, that firm’s data does not cover anything law schools do. But if we do not develop our own analyses, we may wake up someday to find someone has done it for us. Moreover, in the wake of continued criticism of legal scholarship from outside the academy (and some from within it), we need
11 The full results are at civs.cs.cornell.edu/cgi-bin/results.pl?id=E_87dbd88fc4a8515c.
Leiter discusses the top 50 results on his Law School rankings. Brian Leiter, 50 Best Law School Faculties, 2016 edition, leiterlawschool.typepad.com/leiter/2016/10/50-best-law-faculties-2016-edition.html.
12 See, e.g., Colleen Flaherty, Refusing to Be Evaluated by a Formula, Inside Higher Ed (Dec. 11, 2015) available at www.insidehighered.com/news/2015/12/11/rutgers-professors-object-contract-academic-analytics.

Legal Education Through the Blurry Lens of US News
SPRING 2017 259
a more robust defense of the impact of the work we do if we are to con-tinue to get resource transfers from universities to fund it. Provosts are likely (and reasonably) to ask law deans for evidence of the return on their investments in law schools, now that universities are being asked to help law schools weather the financial problems from falling enrollments.13
STUDENTS s we all know, there are not as many law students as there used to be. Roughly we are at 1974 levels of students, with more than 50
additional accredited law schools than in 1974. While it might be possible that students return to legal education in the vast numbers of the golden years, we cannot depend on it. The decline in applicants and enrolled stu-dents has been higher at the top end of the LSAT/UGPA range than at the bottom end, intensifying competition for students with top credentials.
Over the past few years, this has had several consequences related to US News’s focus on median LSAT and median UGPA. One use some appli-cants make of the rankings is to help them figure out at which schools they are competitive. Since the magazine’s printed and online tables report 25th/75th percentiles for LSAT and UGPA, applicants have zeroed in on those numbers as good proxies for whether their applications are likely to succeed. (Medians are reported on each school’s individual webpage at the US News rankings website.) Controversially, some commentators have suggested that law schools’ admission of students with lower entering cre-dentials is a major factor in declining bar passage rates nationally.14
Looking at schools generally, LSAT numbers are pretty stable, although GPA numbers dropped a little bit in the 25-50 ranking range and LSATs dropped in the 51-100 group and in the unranked tier. Worryingly, the 25th percentile LSAT fell a bit more in the unranked tier, which may fuel
13 As part of Texas A&M School of Law’s efforts to report on scholarly impact to our
university, Prof. Gary Lucas at Texas A&M produced an excellent guide to how different measures work and capture different aspects of scholarly impact. Gary Lucas, Measuring Scholarly Impact: A Guide for Law School Administrators and Legal Scholars, 165 U. Pa. L. Rev. Online 165 (2017).
14 See Natalie Kitroeff, Are Lawyers Getting Dumber? Yes, says the woman who runs the bar exam, BLOOMBERG BUSINESSWEEK (Aug. 20, 2015) available at www.bloomberg.com/news/ features/2015-08-20/are-lawyers-getting-dumber-.
A

Andrew P. Morriss
260 20 GREEN BAG 2D
the overall criticism that schools are admitting less-qualified applicants with consequences for bar passage down the road. UGPA numbers are up relatively widely, albeit by small amounts. Anecdotally, there are reports of schools focusing on raising their UGPA numbers in hopes of a rankings boost and this is some evidence that might be going on. Focusing on UGPA can make rankings sense if a school’s LSAT ranges are highly compressed. For example, there are fifteen schools in the top 25 where their 75th per-centile LSAT is just one point ahead of their median. Moving up one median LSAT point would require changing the LSAT profile of their class dramati-cally, so looking to UGPA for a boost is a good alternative. Tables 2 and 3 provide summary statistics by tier for LSAT and UGPA numbers; Figures 1 and 2 illustrate differences in the compression in LSAT scores between the schools in the 1-25 and 26-50 ranking ranges.
Putting more emphasis on UGPA in admissions might or might not be a good thing for legal education. Higher UGPAs might indicate greater undergraduate work effort or they might not. Emphasis on UGPA could lead to a shift away from students with degrees in subjects that traditional-ly had lower UGPAs (e.g., science and engineering) or toward students from institutions with less-rigorous grading policies. The mythical 4.0 basket-weaving major thus might be headed for a much better school than a chemical engineer with a 3.63 (below the median UGPA for all of the top 25 schools). Of course, it is unlikely that many schools would make such a dramatic choice for basket-weaving over chemical engineering, but some impact is likely on the margins.
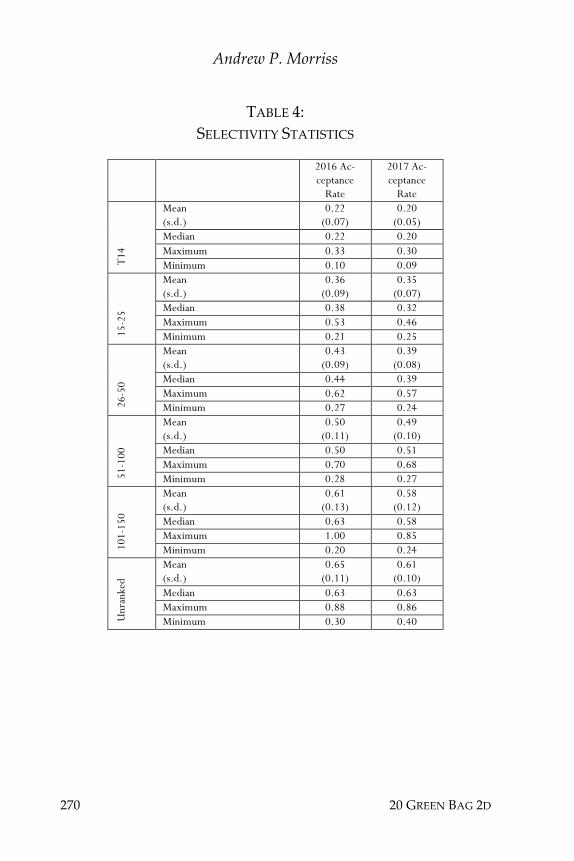
It does not matter much to US News’s formula (just 2.5%) but one clear distinction among law schools is how selective they are in admissions. Table 4 provides summary data. The T14 schools are all below 30% admission rates, the T15-25 schools are all below 50%, the T26-50 are all below 60%, and the T51-100 schools are all below 70%. Those are not particularly impressive admissions rates. Put another way, almost 15% of the twenty-seven T25 schools have admissions rates over 40% and nearly a third of fifty-four T50 schools do as well. Less than half of the forty-eight schools ranked 51-100 have admissions rates under 50%, only 16% of the forty-eight schools ranked 101-150 do, and just under 11% of the unranked schools do. Over 42% of all law schools are admitting over half their applicants.
Another way to consider this is through median acceptance rates for

Legal Education Through the Blurry Lens of US News
SPRING 2017 261
the different ranking tiers. For the T26-50 group, the median acceptance rate is 39%, better than last year’s 44%. For T51-100, it is 51%, down slightly from last year’s 50%. For T101-150 it is 58%, an improvement on last year’s 63%. For the unranked tier, it is 63%, a slight improvement on last year’s 64%. Certainly, the downward slide in applicants has dramati-cally reduced selectivity. Sixteen schools admit more than 80% of their applicants and twenty-four admit more than 70%. The bright side is that most people who want to go to law school can do so if they find the right school to match their credentials.
What can these summary numbers tell us about legal education? While the top-ranked schools are still fine (and I am sure that is a huge relief to readers), weaknesses start to appear surprisingly high up in the ranking pecking order. The “median median LSAT” is a 157 (about the 70th per-centile) for the T51-100 schools, but the median acceptance rate for those schools is 51%. Through skillful scholarship offers, terrific tours, hard-working admissions offices, and many offers of admission, schools in that part of the hierarchy are managing to keep their class credentials fairly stable. But with a median 39% acceptance rate for the T26-50 schools (which have a “median median LSAT” of 161 but a median 25th percentile LSAT of 156), the T51-100 group is going to inevitably lose some of those 157-and-above LSAT applicants to the higher-tier schools or have to in-crease scholarship offers to retain them if applications do not pick up.
Ultimately, many law schools are stuck in a competition in which their applicants, guided by US News as the main third party source they have and who are quite sensibly price sensitive, are choosing their law school based on price and perceived quality (i.e., rankings). To the extent schools are not particularly differentiated (think of how standardized 1L curricula are), that is not a terrible strategy from the point of view of the applicant. What might change some of that is if more schools are able to differentiate themselves. One successful example of this is Baylor University, whose “Practice Court” program is correctly seen by applicants who want to be litigators as an important differentiator. Not surprisingly, Baylor has a na-tional applicant pool and impressive selectivity compared to similarly ranked schools. Similarly, George Mason has developed a powerful brand as the law and economics school. It too outperforms many similarly ranked schools in selectivity. That is not to suggest the rest of us need to

Andrew P. Morriss
262 20 GREEN BAG 2D
imitate Baylor or George Mason. Indeed, we should not. But I think it does suggest that law schools are going to have to get better across the board at explaining their unique advantages to students.
JOBS, JOBS, JOBS News gives post-graduation measures a total weight of 20% in its rankings. It used to give 4% weight to employed-at-graduation
numbers, 14% to employed-at-nine-months, and 2% to a bar exam pas-sage ratio that adjusted a school’s bar passage for the overall first-time pas-sage rate in the state where the largest number of the school’s graduates took the exam. Now the magazine weights different types of jobs differ-ently, but primarily focuses on full-time, long-term JD-required and JD-advantage jobs at graduation and 10 months out (at least, the rankings re-sults correlate well with just counting those two categories). As employ-ment statistics get more attention (via Law School Transparency, for ex-ample), schools are putting additional effort into them. Those efforts take time to pay off, since the 2018 rankings feature employment numbers from the class of 2015. (The lag is due to the need to collect the data ten months out and then submit it the following fall.) Employed at graduation is mostly a proxy for success at large firm hiring, so let’s focus on the 10th month data. Table 5 lists summary statistics.
The news is not particularly cheery. From year to year, individual schools bounce up and down, with a big gain often following a preceding year’s large drop that brought increased attention to employment efforts. Overall the median school saw a small drop (1.52%) in employed-at-10-months data between last year’s ranking and the numbers reported for this year’s, with bigger losses at the top end of the ranking hierarchy and some small gains (in the half-a-percent range) in the 51+ ranking range. That’s at least a little bit disturbing, given the attention law schools have paid to employ-ment numbers in recent years.15 Schools have more work to do in this area.
Bar passage numbers continue to erode for many schools as well, alt-hough there is no handy compilation that we can turn to for the latest sta-tistics. Because of US News’s method of calculating the ratio, schools in states
15 One of the best commentators on employment numbers is Prof. Jerry Organ, who blogs
at the Legal Whiteboard.
US

Legal Education Through the Blurry Lens of US News
SPRING 2017 263
with unaccredited law schools have gotten a boost in the past since the un-accredited graduates influence the overall first-time pass rate that US News uses as a denominator to adjust for varying difficulty across state bar exams.16 Dismal results in many states, including what Blog Emperor and Taxprof Paul Caron termed “carnage” in California,17 is likely to result in some reordering of rankings – in the 2019 edition published in 2018! The key impact of bar numbers – outside of the quirks it introduces in the specifics of the ranking of schools in states where there are graduates of non-ABA accredited schools taking the bar in large enough numbers to affect the overall first-time bar passage rate relative to the ABA-accredited first time rate – is thus to serve as a fairly impermeable ceiling on overall employ-ment numbers: It is hard to get a JD-required job without a law license.18
Is there a better way for prospective students, employers, and others to follow law schools’ success in getting their students past the bar exam? There are possibilities. The spread of the Uniform Bar Exam (UBE) means more and more bar takers are getting scores that can be transferred around the country and compared across state lines.19 As well, the in-
16 You can see this by comparing #33 Wisconsin’s bar passage (100% on the Wisconsin bar, since Wisconsin has a diploma privilege) and its ratio (100/81 = 1.23) with #30 UC Davis (86% on the California bar) and its ratio (86/60 = 1.43). If US News used the statewide ABA accredited first time bar passage rate for the California schools (66%) instead of the overall first time bar passage rate (60%), Davis’s ratio would be 1.30 in-stead. (As these are from the 2017 rankings, they reflect 2014 calendar year bar exams.) Or compare Davis to Ohio State, which it was tied with at #30. Ohio State’s bar passage ratio is (92.6/81 = 1.30). If it had tied with Davis on this element and all else had re-mained the same, Davis would likely have dropped to #32, behind Ohio State and Bos-ton College at #30. This dependence on such small things highlights the silliness of put-ting too much weight on the overall rankings.
17 Paul Caron, July 2016 California Bar Exam Carnage, TaxProf (Nov. 22, 2016) available at tax prof.typepad.com//taxprof_blog/2016/11/july-2016-california-bar-exam-carnage.html.
18 In the past, this was certainly a looser relationship. A surprising number of law schools used to report employed-at-9-months numbers that exceeded their bar passage statistic by a considerable margin. Of course, the bar passage number is just from one state, while the employment number was for all graduates and so perhaps those taking bar exams not reported by US News all passed and were employed at 9 months. But the gaps were pretty substantial at times. Law School Transparency and the ABA deserve credit for improving the employment numbers, even if the process of improvement has been painful at times.
19 I was originally a skeptic of the UBE, since it significantly reduces local content on the bar, but I’ve come around to the idea that the greater portability and the more robust

Andrew P. Morriss
264 20 GREEN BAG 2D
creased attention on the less-than-stellar recent results might open up at least some states to more robust data-sharing with the public. Of greater interest to an applicant considering bar results than the overall pass rate of students from a particular law school is whether someone with a profile (LSAT, UGPA) like that applicant would be likely to pass.20 As the UBE spreads and makes bar results more comparable, the transparency move-ment may begin to press for more detailed reporting on results. At the least, a law school that takes on students with entering credentials suggest-ing they may struggle with the bar exam needs to communicate to appli-cants how its program equips students to pass the bar.
MONEY News gives 9.75% weight to spending per student on “instruc-tion, library and supporting services” as well 1.5% weight to
spending per student on “all other items, including financial aid.” There is no justification for weighting inputs so heavily, since it surely matters more to students how those resources are spent than how much is spent. Comparison data on this point is hard to come by due to pesky antitrust laws, so I’m limited to a couple of general observations.
First, schools are generally reducing spending as a result of declining enrollments. The question with respect to US News is whether they are reducing spending or enrollments faster, since it is spending per student that matters. Schools are also increasing financial aid/tuition discounting, often at the expense of other spending, in the increasingly competitive admissions market. That’s moving money from the more heavily weighted direct spending category to the less heavily weighted indirect spending category. So we should expect some rankings churn as a result (and so sales of more copies of the latest rankings for US News).
reliability and validity efforts of the NCBE in constructing the UBE are valuable enough to offset the value of local content. Likely more persuasive to many state bar authorities than deans’ opinions is the reduced burden on state bar examiners from having the NCBE prepare more of the exam and the resulting greater validity and reliability.
20 Students with a 170 LSAT are quite good at taking multiple-choice tests, for example, and so it is not surprising that schools with lots of students with high LSATs have lots of students who do well on the bar exam.
US

Legal Education Through the Blurry Lens of US News
SPRING 2017 265
Similarly, the student-faculty ratio moves as both parts of the ratio change. Schools where the number of faculty decline more slowly than the number of students will temporarily outperform those where the reverse happens.21 One interesting trend here will be the move to increase experi-ential learning to comply with ABA Standard 303(3)’s requirement of a minimum of six credit hours of experiential education in simulations, clin-ics, and field placements. Since all of these are more resource-intensive than a large Socratic class, schools with the resources to invest more heavi-ly in clinics and simulations taught by full-time faculty will gain a slight further advantage in the rankings.
Overall, we appear to be moving in the direction of more separation between the top tier and the rest of the legal academy. When we looked at the hierarchy of legal education over time, my coauthors and I found that the overall hierarchy was fairly stable and that quite a bit of it seemed to be ultimately a reflection of the resources available to a school.22 For several decades up to 2008, that difference was eroding. Of course Har-vard still had more money than schools further down the rankings ladder, but the spending per student wasn’t as different as it had been because everyone could charge substantial tuition. Now that this is no longer true, one separating factor among schools is likely to be whether or not a parent university is willing to invest over the long term or if the law school is one of the small number with hefty endowments. The New York Times’s ac-count of the financial struggles at Valparaiso, which emphasized the transi-tion from a teaching institution that didn’t focus on scholarship to one that quite successfully put much greater emphasis on scholarship, may become a story line that is more prevalent around the country.23
LIBRARIES News’s formula gives 0.75% weight to the number of books in a law school’s library. Those numbers are not likely to change
much and, even if they did, it would not change the rankings much.
21 Since the number is measured in the fall semester, a school’s numbers can be improved
by encouraging the faculty to schedule their sabbaticals, visits, etc. in the spring. 22 Arewa, et al., supra n.10. 23 Noam Scheiber, An Expensive Law Degree, and No Place to Use It, N.Y. Times (June 17, 2016).
US

Andrew P. Morriss
266 20 GREEN BAG 2D
Counting books does not tell us much about how well a law school pre-pares its students to do legal research.
CONCLUSION he broad conclusion is that we are still in a “chaotic period” for legal education. More concretely, here are four general predictions for the
future:
1. Law schools will increasingly find ways to differentiate themselves from one another.
2. There will be an increasing separation between the top of the hier-archy, where resources are more abundant, and the rest of legal education, where money will be tighter, student-faculty ratios higher, and entering credentials weaker.
3. The increasing emphasis on metrics and law schools’ increasing de-pendence on central funding will drive more attention to ways to quantify law schools’ performance. If we do not develop our own measures, central administrations will do it for us.
4. Transparency efforts will expand to include more information on bar passage as well as employment.
Of course, there are things going on in legal education that this little article leaves out. Many schools struggle to increase racial and ethnic diver-sity in a more competitive market for applicants. Law schools’ lack of ideo-logical diversity has drawn negative comments recently. US News, despite some pressure to do so, has so far not added any measure of any type of diversity to its overall ranking. More and more schools are launching non-JD degrees and expanding into online education, as they seek new revenue sources. The ABA has left non-JD initiatives largely unregulated, other than to ensure they are not detracting from the JD program; regional accreditors and state higher education authorities have jurisdiction over these and are starting to learn more about how legal education works. That may spark more interest on their part in the rest of what we do in the future. It will stay interesting for quite some time.
T

Legal Education Through the Blurry Lens of US News
SPRING 2017 267
TABLE 1: PEER AND LAWYER/JUDGE RATINGS
Peer Lawyer/Judge
T14
Mean (s.d.)
4.5 (0.2)
4.5 (0.2)
Median 4.5 4.5 Maximum 4.8 4.8 Minimum 4.1 4.3
15-2
5
Mean (s.d.)
3.5 (0.3)
3.8 (0.3)
Median 3.4 3.8 Maximum 4.0 4.2 Minimum 3.1 3.2
26-5
0
Mean (s.d.)
3.5 (0.6)
3.8 (0.5)
Median 3.3 3.7 Maximum 4.8 4.8 Minimum 2.6 2.9
51-1
00
Mean (s.d.)
2.4 (0.2)
3.0 (0.2)
Median 2.4 3.0 Maximum 2.7 3.4 Minimum 1.9 2.6
101-
150
Mean (s.d.)
2.0 (0.2)
2.6 (0.4)
Median 2.0 2.6 Maximum 2.4 3.1 Minimum 1.5 1.9
Unr
anke
d
Mean (s.d.)
1.5 (0.2)
2.0 (0.4)
Median 2.0 2.6 Maximum 2.0 2.9 Minimum 1.1 1.4

Andrew P. Morriss
268 20 GREEN BAG 2D
TABLE 2: LSAT STATISTICS
2016 2017 25th 50th 75th 25th 50th 75th
T14
Mean (s.d.)
165.43 (3.11)
169.21 (2.15)
170.86 (2.60)
165.50 (2.74)
169.29 (2.09)
171.00 (2.42)
Median 165 169 170 165 169 170 Maximum 171 173 176 170 173 175 Minimum 161 166 168 162 166 168
15-2
5
Mean (s.d.)
159.15 (2.44)
164.31 (2.21)
165.77 (2.45)
159.23 (2.80)
164.54 (2.40)
165.85 (2.03)
Median 160 165 166 159 165 166 Maximum 162 167 169 163 168 169 Minimum 155 161 162 153 161 163
26-5
0
Mean (s.d.)
156.67 (1.92)
160.59 (1.89)
162.59 (1.69)
156.63 (1.67)
160.85 (1.70)
162.59 (1.69)
Median 156 161 162 156 161 163 Maximum 161 164 166 161 163 165 Minimum 154 157 160 154 158 159
51-1
00
Mean (s.d.)
153.04 (2.03)
156.42 (2.09)
158.90 (1.68)
152.81 (1.84)
156.29 (2.14)
158.81 (1.83)
Median 153 156 159 153 157 159 Maximum 158 161 162 156 161 163 Minimum 148 152 156 149 152 155
101-
150
Mean (s.d.)
149.00 (2.12)
152.10 (2.00)
155.06 (1.84)
148.73 (2.36)
152.00 (2.05)
154.88 (1.67)
Median 149 152 155 149 152 155 Maximum 154 156 158 155 157 158 Minimum 144 147 150 144 147 151
Unr
anke
d
Mean (s.d.)
144.35 (3.85)
147.38 (3.86)
150.76 (3.60)
144.43 (3.78)
147.29 (3.75)
150.54 (3.57)
Median 149 152 155 149 152 155 Maximum 153 156 158 152 155 158 Minimum 130 133 137 131 134 137

Legal Education Through the Blurry Lens of US News
SPRING 2017 269
TABLE 3: UGPA STATISTICS
2016 2017 25th 50th 75th 25th 50th 75th
T14
Mean (s.d.)
3.63 (0.11)
3.81 (0.07)
3.90 (0.06)
3.62 (0.11)
3.82 (0.06)
3.90 (0.05)
Median 3.60 3.78 3.89 3.60 3.81 3.89 Maximum 3.86 3.93 3.98 3.79 3.90 3.97 Minimum 3.47 3.70 3.81 3.43 3.70 3.81
15-2
5
Mean (s.d.)
3.42 (0.09)
3.71 (0.06)
3.83 (0.04)
3.42 (0.11)
3.71 (0.05)
3.83 (0.03)
Median 3.45 3.73 3.83 3.41 3.71 3.82 Maximum 3.51 3.79 3.90 3.56 3.78 3.87 Minimum 3.18 3.61 3.75 3.15 3.61 3.77
26-5
0
Mean (s.d.)
3.30 (0.09)
3.56 (0.09)
3.72 (0.08)
3.33 (0.10)
3.59 (0.11)
3.74 (0.08)
Median 3.29 3.54 3.69 3.32 3.57 3.72 Maximum 3.45 3.77 3.93 3.55 3.82 3.92 Minimum 3.08 3.41 3.58 3.16 3.45 3.62
51-1
00
Mean (s.d.)
3.14 (0.10)
3.43 (0.10)
3.66 (0.08)
3.16 (0.10)
3.44 (0.09)
3.67 (0.07)
Median 3.15 3.42 3.66 3.16 3.44 3.67 Maximum 3.40 3.65 3.85 3.41 3.69 3.91 Minimum 2.91 3.27 3.48 2.89 3.27 3.47
101-
150
Mean (s.d.)
2.98 (0.10)
3.28 (0.10)
3.54 (0.08)
3.00 (0.11)
3.28 (0.11)
3.55 (0.09)
Median 3.00 3.27 3.53 3.01 3.29 3.55 Maximum 3.21 3.63 3.76 3.21 3.64 3.78 Minimum 2.77 3.05 3.34 2.70 3.03 3.33
Unr
anke
d
Mean (s.d.)
2.77 (0.16)
3.08 (0.16)
3.38 (0.13)
2.79 (0.17)
3.11 (0.17)
3.39 (0.16)
Median 3.00 3.27 3.53 3.01 3.29 3.55 Maximum 3.22 3.55 3.76 3.19 3.52 3.81 Minimum 2.48 2.74 3.12 2.48 2.79 3.07
Andrew P. Morriss
270 20 GREEN BAG 2D
TABLE 4: SELECTIVITY STATISTICS
2016 Ac-ceptance
Rate
2017 Ac-ceptance
Rate
T14
Mean (s.d.)
0.22 (0.07)
0.20 (0.05)
Median 0.22 0.20 Maximum 0.33 0.30 Minimum 0.10 0.09
15-2
5
Mean (s.d.)
0.36 (0.09)
0.35 (0.07)
Median 0.38 0.32 Maximum 0.53 0.46 Minimum 0.21 0.25
26-5
0
Mean (s.d.)
0.43 (0.09)
0.39 (0.08)
Median 0.44 0.39 Maximum 0.62 0.57 Minimum 0.27 0.24
51-1
00
Mean (s.d.)
0.50 (0.11)
0.49 (0.10)
Median 0.50 0.51 Maximum 0.70 0.68 Minimum 0.28 0.27
101-
150
Mean (s.d.)
0.61 (0.13)
0.58 (0.12)
Median 0.63 0.58 Maximum 1.00 0.85 Minimum 0.20 0.24
Unr
anke
d
Mean (s.d.)
0.65 (0.11)
0.61 (0.10)
Median 0.63 0.63 Maximum 0.88 0.86 Minimum 0.30 0.40

Legal Education Through the Blurry Lens of US News
SPRING 2017 271
TABLE 5: EMPLOYED AT 10 MONTHS STATISTICS
2016 Em-ployed at 10
mos.
2017 Em-ployed at 10
mos.
T14
Mean (s.d.)
93.70 (3.61)
88.42 (4.65)
Median 94.95 89.41 Maximum 97.80 93.90 Minimum 86.10 74.63
15-2
5
Mean (s.d.)
86.35 (3.22)
80.45 (3.84)
Median 86.90 81.19 Maximum 91.10 85.53 Minimum 80.50 72.54
26-5
0
Mean (s.d.)
79.30 (6.10)
77.17 (5.80)
Median 79.70 77.73 Maximum 89.00 85.80 Minimum 58.00 65.41
51-1
00
Mean (s.d.)
73.46 (7.76)
74.54 (7.65)
Median 72.30 74.23 Maximum 88.70 92.13 Minimum 58.60 60.48
101-
150
Mean (s.d.)
69.33 (7.78)
69.27 (7.32)
Median 71.65 69.93 Maximum 87.00 81.72 Minimum 47.90 52.50
Unr
anke
d
Mean (s.d.)
56.24 (10.05)
54.55 (12.12)
Median 71.65 69.93 Maximum 72.90 79.20 Minimum 31.70 14.14

Andrew P. Morriss
272 20 GREEN BAG 2D
FIGURE 1: LSAT SPREADS, TOP 25

Legal Education Through the Blurry Lens of US News
SPRING 2017 273
FIGURE 2: LSAT SPREADS, 26-50