l e n n o x i n t e r n at i o n a l i n c
TRANSCRIPT
UNITED STATESSECURITIES AND EXCHANGE COMMISSION
Washington, D. C. 20549_________________________________________________
FORM 10-Q _________________________________________________
☒
QUARTERLY REPORT PURSUANT TO SECTION 13 OR 15(d) OF THE SECURITIES EXCHANGE ACTOF 1934
For the quarterly period ended September 30, 2020OR
☐
TRANSITION REPORT PURSUANT TO SECTION 13 OR 15(d) OF THE SECURITIES EXCHANGE ACTOF 1934
For the transition period from _____to ______
Commission file number 001-15149 _________________________________________________
LENNOX INTERNATIONAL INC.Incorporated pursuant to the laws of the State of Delaware_________________________________________________
Internal Revenue Service Employer Identification No. 42-0991521
2140 LAKE PARK BLVD., RICHARDSON, Texas, 75080(972-497-5000)
_________________________________________________ Securities registered pursuant to Section 12(b) of the Act:
Title of each class Trading Symbol(s) Name of each exchange on which registeredCommon stock, $0.01 par value per share LII New York Stock Exchange
Indicate by check mark whether the registrant (1) has filed all reports required to be filed by Section 13 or 15(d) of the Securities Exchange Act of 1934during the preceding 12 months (or for such shorter period that the registrant was required to file such reports), and (2) has been subject to such filingrequirements for the past 90 days. Yes ☒ No ☐
Indicate by check mark whether the registrant has submitted electronically every Interactive Data File required to be submitted pursuant to Rule 405 ofRegulation S-T (§232.405 of this chapter) during the preceding 12 months (or for such shorter period that the registrant was required to submit suchfiles). Yes ☒ No ☐
Indicate by check mark whether the registrant is a large accelerated filer, an accelerated filer, a non-accelerated filer, a smaller reporting company or anemerging growth company. See the definitions of “large accelerated filer,” “accelerated filer,” “smaller reporting company,” and “emerging growthcompany" in Rule 12b-2 of the Exchange Act.
Large Accelerated Filer ☒ Accelerated Filer ☐
Non-Accelerated Filer ☐ Smaller Reporting Company ☐
Emerging growth company ☐
If an emerging growth company, indicate by check mark if the registrant has elected not to use the extended transition period for complying with any new or revisedfinancial accounting standards provided pursuant to Section 13(a) of the Exchange Act. ☐
Indicate by check mark whether the registrant is a shell company (as defined in Rule 12b-2 of the Exchange Act). Yes ☐ No ☒
As of October 9, 2020, the number of shares outstanding of the registrant’s common stock, par value $0.01 per share, was 38,289,399.

LENNOX INTERNATIONAL INC.FORM 10-Q
For the three and nine months ended September 30, 2020
INDEXPage
Part I Financial InformationItem 1. Financial Statements
Consolidated Balance Sheets - September 30, 2020 (Unaudited) and December 31, 2019 1Consolidated Statements of Operations (Unaudited) - Three Months and Nine Months Months Ended September 30, 2020 and 2019 2Consolidated Statements of Comprehensive Income (Unaudited) - Three Months and Nine Months Months Ended September 30, 2020 and 2019 3Consolidated Statements of Stockholders' Deficit (Unaudited) - Three Months and Nine Months Months Ended September 30, 2020 and 2019 4Consolidated Statements of Cash Flows (Unaudited) - Nine Months Ended September 30, 2020 and 2019 6Notes to Consolidated Financial Statements (Unaudited) 7
Item 2. Management's Discussion and Analysis of Financial Condition and Results of Operations 23Item 3. Quantitative and Qualitative Disclosures About Market Risk 34Item 4. Controls and Procedures 35
Part II Other InformationItem 1. Legal Proceedings 35Item 1A. Risk Factors 35Item 2. Unregistered Sales of Equity Securities and Use of Proceeds 35Item 6. Exhibits 37
i
Part I - Financial InformationItem 1. Financial Statements
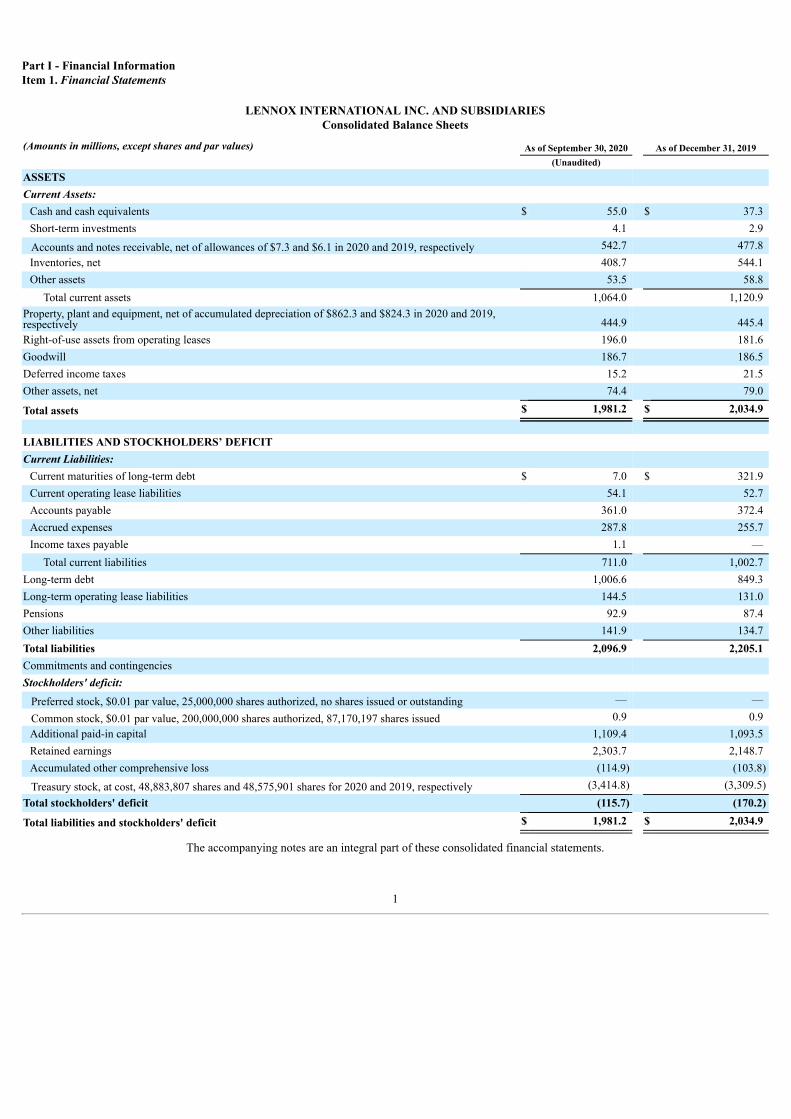
LENNOX INTERNATIONAL INC. AND SUBSIDIARIESConsolidated Balance Sheets
(Amounts in millions, except shares and par values) As of September 30, 2020 As of December 31, 2019(Unaudited)
ASSETSCurrent Assets:
Cash and cash equivalents $ 55.0 $ 37.3 Short-term investments 4.1 2.9
Accounts and notes receivable, net of allowances of $7.3 and $6.1 in 2020 and 2019, respectively 542.7 477.8 Inventories, net 408.7 544.1 Other assets 53.5 58.8
Total current assets 1,064.0 1,120.9 Property, plant and equipment, net of accumulated depreciation of $862.3 and $824.3 in 2020 and 2019,respectively 444.9 445.4 Right-of-use assets from operating leases 196.0 181.6 Goodwill 186.7 186.5 Deferred income taxes 15.2 21.5 Other assets, net 74.4 79.0
Total assets $ 1,981.2 $ 2,034.9
LIABILITIES AND STOCKHOLDERS’ DEFICITCurrent Liabilities:
Current maturities of long-term debt $ 7.0 $ 321.9 Current operating lease liabilities 54.1 52.7 Accounts payable 361.0 372.4 Accrued expenses 287.8 255.7 Income taxes payable 1.1 —
Total current liabilities 711.0 1,002.7 Long-term debt 1,006.6 849.3 Long-term operating lease liabilities 144.5 131.0 Pensions 92.9 87.4 Other liabilities 141.9 134.7 Total liabilities 2,096.9 2,205.1 Commitments and contingenciesStockholders' deficit:
Preferred stock, $0.01 par value, 25,000,000 shares authorized, no shares issued or outstanding — —
Common stock, $0.01 par value, 200,000,000 shares authorized, 87,170,197 shares issued 0.9 0.9 Additional paid-in capital 1,109.4 1,093.5 Retained earnings 2,303.7 2,148.7 Accumulated other comprehensive loss (114.9) (103.8)
Treasury stock, at cost, 48,883,807 shares and 48,575,901 shares for 2020 and 2019, respectively (3,414.8) (3,309.5)Total stockholders' deficit (115.7) (170.2)
Total liabilities and stockholders' deficit $ 1,981.2 $ 2,034.9
The accompanying notes are an integral part of these consolidated financial statements.
1

LENNOX INTERNATIONAL INC. AND SUBSIDIARIESConsolidated Statements of Operations
(Unaudited)
(Amounts in millions, except per share data)For the Three Months Ended
September 30,For the Nine Months Ended
September 30,
2020 2019 2020 2019
Net sales $ 1,055.0 $ 1,032.9 $ 2,720.1 $ 2,922.2 Cost of goods sold 731.7 734.6 1,955.3 2,090.3
Gross profit 323.3 298.3 764.8 831.9 Operating Expenses:
Selling, general and administrative expenses 151.8 143.4 412.7 441.6 Losses (gains) and other expenses, net 3.4 2.2 5.6 5.3 Restructuring charges 0.1 6.1 10.6 6.5 Loss on sale of business — 0.2 — 9.1 Loss (gain) from natural disasters, net of insurance recoveries 4.9 (7.1) 7.6 (85.4)Income from equity method investments (4.0) (3.3) (11.2) (10.5)
Operating income 167.1 156.8 339.5 465.3 Pension settlements 0.3 — 0.3 60.6 Interest expense, net 6.5 12.5 22.2 36.5 Other expense (income), net 1.1 0.6 3.3 1.7
Income from continuing operations before income taxes 159.2 143.7 313.7 366.5 Provision for income taxes 27.5 29.0 68.8 71.5 Income from continuing operations 131.7 114.7 244.9 295.0 Discontinued Operations:
Loss from discontinued operations before income taxes — — (0.9) (0.4)Income tax benefit — — (0.6) (0.1)Loss from discontinued operations — — (0.3) (0.3)
Net income $ 131.7 $ 114.7 $ 244.6 $ 294.7
Earnings per share – Basic:Income from continuing operations $ 3.44 $ 2.97 $ 6.39 $ 7.54 Loss from discontinued operations — — (0.01) (0.01)
Net income $ 3.44 $ 2.97 $ 6.38 $ 7.53
Earnings per share – Diluted:Income from continuing operations $ 3.42 $ 2.94 $ 6.35 $ 7.46 Loss from discontinued operations — — (0.01) —
Net income $ 3.42 $ 2.94 $ 6.34 $ 7.46
Weighted Average Number of Shares Outstanding - Basic 38.3 38.6 38.3 39.1 Weighted Average Number of Shares Outstanding - Diluted 38.6 39.0 38.6 39.5
The accompanying notes are an integral part of these consolidated financial statements.
2

LENNOX INTERNATIONAL INC. AND SUBSIDIARIESConsolidated Statements of Comprehensive Income
(Unaudited)
(Amounts in millions)For the Three Months Ended
September 30,For the Nine Months Ended
September 30,
2020 2019 2020 2019
Net income $ 131.7 $ 114.7 $ 244.6 $ 294.7 Other comprehensive income (loss):
Foreign currency translation adjustments 6.0 (6.2) (11.8) (2.4)Reclassification of foreign currency translation gains into earnings — — — 2.1 Net change in pension and post-retirement liabilities (2.1) 7.6 (4.5) 10.1 Reclassification of pension and post-retirement benefit losses into earnings 1.4 1.5 4.4 4.4 Pension settlements 0.3 — 0.3 60.6 Share of equity method investments other comprehensive income (1.2) — (1.2) — Net change in fair value of cash flow hedges 3.2 (3.1) (3.2) (2.3)Reclassification of cash flow hedge losses into earnings 0.4 2.5 5.5 6.9 Other comprehensive income (loss) before taxes 8.0 2.3 (10.5) 79.4
Tax (expense) benefit (1.2) 0.1 (0.6) (17.8)Other comprehensive income (loss), net of tax 6.8 2.4 (11.1) 61.6
Comprehensive income $ 138.5 $ 117.1 $ 233.5 $ 356.3
The accompanying notes are an integral part of these consolidated financial statements.
3

LENNOX INTERNATIONAL INC. AND SUBSIDIARIESCONSOLIDATED STATEMENTS OF STOCKHOLDERS' DEFICIT
For the three and nine months ended September 30, 2020 and 2019 (Unaudited)(In millions, except per share data)
CommonStockIssued
AdditionalPaid-InCapital
RetainedEarnings
AccumulatedOther
ComprehensiveLoss
Treasury Stock atCost Total
Stockholders'Deficit(For the three months ended September 30, 2020) Shares Amount
Balance as of June 30, 2020 $ 0.9 $ 1,102.4 $ 2,201.5 $ (121.7) 48.9 $ (3,412.0) $ (228.9)Net income — — 131.7 — — — 131.7 Dividends, $0.77 per share — — (29.5) — — — (29.5)Foreign currency translation adjustments — — — 6.0 — — 6.0 Pension and post-retirement liability changes, net of taxbenefit of $0.1 — — — (0.3) — — (0.3)Share of equity method investments other comprehensiveincome — — — (1.2) — — (1.2)Stock-based compensation expense — 8.0 — — — — 8.0 Change in cash flow hedges, net of tax expense of $1.3 — — — 2.3 — — 2.3 Treasury shares reissued for common stock — (1.0) — — (0.1) 1.7 0.7 Treasury stock purchases — — — — 0.1 (4.5) (4.5)
Balance as of September 30, 2020 $ 0.9 $ 1,109.4 $ 2,303.7 $ (114.9) 48.9 $ (3,414.8) $ (115.7)
CommonStockIssued
AdditionalPaid-InCapital
RetainedEarnings
AccumulatedOther
ComprehensiveLoss
Treasury Stock atCost Total
Stockholders'Deficit(For the three months ended September 30, 2019) Shares Amount
Balance as of June 30, 2019 $ 0.9 $ 1,085.8 $ 1,979.4 $ (129.6) 48.1 $ (3,154.0) $ (217.5)Net income — — 114.7 — — — 114.7 Dividends, $0.77 per share — — (29.7) — — — (29.7)Foreign currency translation adjustments — — — (6.2) — — (6.2)Pension and post-retirement liability changes, net of tax — — — 9.0 — — 9.0 Stock-based compensation expense — 4.2 — — — — 4.2 Change in cash flow hedges, net of tax benefit of $0.1 — — — (0.4) — — (0.4)Treasury shares reissued for common stock — — — — — 1.0 1.0 Treasury stock purchases — — — — 0.5 (152.4) (152.4)
Balance as of September 30, 2019 $ 0.9 $ 1,090.0 $ 2,064.4 $ (127.2) 48.6 $ (3,305.4) $ (277.3)
The accompanying notes are an integral part of these consolidated financial statements.
4

LENNOX INTERNATIONAL INC. AND SUBSIDIARIESCONSOLIDATED STATEMENTS OF STOCKHOLDERS' DEFICIT
For the three and nine months ended September 30, 2020 and 2019 (Unaudited)(In millions, except per share data)
CommonStockIssued
AdditionalPaid-InCapital
RetainedEarnings
AccumulatedOther
ComprehensiveLoss
Treasury Stock atCost Total
Stockholders'Deficit(For the nine months ended September 30, 2020) Shares Amount
Balance as of December 31, 2019 $ 0.9 $ 1,093.5 $ 2,148.7 $ (103.8) 48.6 $ (3,309.5) $ (170.2)Cumulative effect adjustment upon adoption of newaccounting standard (ASU 2016-13) — — (1.3) — — — (1.3)Net income — — 244.6 — — — 244.6 Dividends, $2.31 per share — — (88.3) — — — (88.3)Foreign currency translation adjustments — — — (11.8) — — (11.8)Pension and post-retirement liability changes, net of tax — — — 0.2 — — 0.2 Share of equity method investments other comprehensiveincome — — — (1.2) — — (1.2)Stock-based compensation expense — 18.4 — — — — 18.4 Change in cash flow hedges, net of tax expense of $0.5 — — — 1.7 — — 1.7 Treasury shares reissued for common stock — (2.5) — — (0.2) 4.8 2.3 Treasury stock purchases — — — — 0.5 (110.1) (110.1)
Balance as of September 30, 2020 $ 0.9 $ 1,109.4 $ 2,303.7 $ (114.9) 48.9 $ (3,414.8) $ (115.7)
CommonStockIssued
AdditionalPaid-InCapital
RetainedEarnings
AccumulatedOther
ComprehensiveLoss
Treasury Stock atCost Total
Stockholders'Deficit(For the nine months ended September 30, 2019) Shares Amount
Balance as of December 31, 2018 $ 0.9 $ 1,078.8 $ 1,855.0 $ (188.8) 47.3 $ (2,895.5) $ (149.6)Cumulative effect adjustment upon adoption of newaccounting standard (ASC 842) — — (0.3) — — — (0.3)Net income — — 294.7 — — — 294.7 Dividends, $2.18 per share — — (85.0) — — — (85.0)Foreign currency translation adjustments — — — (0.3) — — (0.3)Pension and post-retirement liability changes, net of taxexpense of $16.4 — — — 58.6 — — 58.6 Stock-based compensation expense — 15.6 — — — — 15.6 Change in cash flow hedges, net of tax expense of $1.3 — — — 3.3 — — 3.3 Treasury shares reissued for common stock — (4.4) — — (0.2) 7.0 2.6 Treasury stock purchases — — — — 1.5 (416.9) (416.9)
Balance as of September 30, 2019 $ 0.9 $ 1,090.0 $ 2,064.4 $ (127.2) 48.6 $ (3,305.4) $ (277.3)
The accompanying notes are an integral part of these consolidated financial statements.
5

LENNOX INTERNATIONAL INC. AND SUBSIDIARIESConsolidated Statements of Cash Flows
(Unaudited)(Amounts in millions) For the Nine Months Ended September 30,
2020 2019Cash flows from operating activities:
Net income $ 244.6 $ 294.7 Adjustments to reconcile net income to net cash provided by operating activities:
Loss on sale of business — 9.1 Insurance recoveries received for property damage incurred from natural disaster — (11.6)Income from equity method investments (11.2) (10.5)Dividends from affiliates 9.3 9.3 Restructuring charges, net of cash paid 3.5 6.0 Provision for credit losses 5.0 4.0 Unrealized losses (gains), net on derivative contracts 0.5 (0.1)Stock-based compensation expense 18.4 15.6 Depreciation and amortization 55.4 53.1 Deferred income taxes 5.6 17.0 Pension expense 7.7 65.9 Pension contributions (2.8) (1.7)Other items, net 2.0 (0.4)
Changes in assets and liabilities, net of effects of divestitures:Accounts and notes receivable (69.3) (178.2)Inventories 137.6 (107.0)Other current assets 2.0 1.5 Accounts payable (2.4) (24.5)Accrued expenses 29.6 7.6 Income taxes payable / receivable 6.8 (8.2)Other, net 3.9 (17.1)
Net cash provided by operating activities 446.2 124.5 Cash flows from investing activities:
Proceeds from the disposal of property, plant and equipment 0.7 1.2 Purchases of property, plant and equipment (55.9) (77.0)Net proceeds from sale of business — 43.5 Purchases of short-term investments (1.3) (2.4)Insurance recoveries received for property damage incurred from natural disaster — 11.6
Net cash used in investing activities (56.5) (23.1)Cash flows from financing activities:
Short-term debt payments (4.6) (5.3)Short-term debt borrowings 4.6 5.3 Asset securitization borrowings 91.0 155.5 Asset securitization payments (376.0) (58.0)Long-term debt borrowings 600.0 — Long-term debt payments (5.4) (35.0)Borrowings from credit facility 1,509.5 1,938.5 Payments on credit facility (1,980.5) (1,608.5)Payments of deferred financing costs (7.1) — Proceeds from employee stock purchases 2.2 2.5 Repurchases of common stock (100.0) (400.0)Repurchases of common stock to satisfy employee withholding tax obligations (10.1) (16.9)Cash dividends paid (88.6) (80.9)
Net cash used in financing activities (365.0) (102.8)Increase in cash and cash equivalents 24.7 (1.4)Effect of exchange rates on cash and cash equivalents (7.0) 1.2 Cash and cash equivalents, beginning of period 37.3 46.3
Cash and cash equivalents, end of period $ 55.0 $ 46.1
Supplemental disclosures of cash flow information:Interest paid $ 19.0 $ 31.5
Income taxes paid (net of refunds) $ 55.1 $ 78.7
Insurance recoveries received $ — $ 138.0
The accompanying notes are an integral part of these consolidated financial statements.
6

LENNOX INTERNATIONAL INC.NOTES TO CONSOLIDATED FINANCIAL STATEMENTS
(Unaudited)1. General:
References in this Quarterly Report on Form 10-Q to "we," "our," "us," "LII," or the "Company" refer to Lennox International Inc. and its subsidiaries,unless the context requires otherwise.
Basis of Presentation
The accompanying unaudited Consolidated Balance Sheet as of September 30, 2020, the accompanying unaudited Consolidated Statements ofOperations for the three and nine months ended September 30, 2020 and 2019, the accompanying unaudited Consolidated Statements of ComprehensiveIncome for the three and nine months ended September 30, 2020 and 2019, the accompanying unaudited Consolidated Statements of Stockholders' Deficitfor the three and nine months ended September 30, 2020 and 2019, and the accompanying unaudited Consolidated Statements of Cash Flows for the ninemonths ended September 30, 2020 and 2019 should be read in conjunction with our audited consolidated financial statements and footnotes included in ourAnnual Report on Form 10-K for the year ended December 31, 2019.
The accompanying unaudited consolidated financial statements have been prepared in accordance with generally accepted accounting principles(“GAAP”) for interim financial information and with the instructions to Form 10-Q and Article 10 of Regulation S-X. The accompanying consolidatedfinancial statements contain all material adjustments, consisting principally of normal recurring adjustments, necessary for a fair presentation of ourfinancial position, results of operations and cash flows. Certain information and footnote disclosures normally included in financial statements prepared inaccordance with GAAP have been condensed or omitted pursuant to applicable rules and regulations, although we believe that the disclosures herein areadequate to make the information presented not misleading. The operating results for the interim periods are not necessarily indicative of the results thatmay be expected for a full year.
Our fiscal quarterly periods are comprised of approximately 13 weeks, but the number of days per quarter may vary year-over-year. Our quarterlyreporting periods usually end on the Saturday closest to the last day of March, June and September. Our fourth quarter and fiscal year ends on December31, regardless of the day of the week on which December 31 falls. For convenience, the 13-week periods comprising each fiscal quarter are denoted by thelast day of the respective calendar quarter.
Use of Estimates
The preparation of financial statements requires us to make estimates and assumptions about future events. These estimates and the underlyingassumptions affect the amounts of assets and liabilities reported, disclosures about contingent assets and liabilities, and reported amounts of revenues andexpenses. Such estimates include the valuation of accounts receivable, inventories, goodwill, intangible assets and other long-lived assets, contingencies,guarantee obligations, indemnifications, and assumptions used in the calculation of income taxes, pension and post-retirement medical benefits, self-insurance and warranty reserves, and stock-based compensation, among others. These estimates and assumptions are based on our best estimates andjudgment.
We evaluate these estimates and assumptions on an ongoing basis using historical experience and other factors, including the current economicenvironment. We believe these estimates and assumptions to be reasonable under the circumstances and will adjust such estimates and assumptions whenfacts and circumstances dictate. Volatile equity, foreign currency and commodity markets combine to increase the uncertainty inherent in such estimatesand assumptions. Future events and their effects cannot be determined with precision and actual results could differ significantly from these estimates.Changes in these estimates will be reflected in the financial statements in future periods.
Impact of COVID-19 Pandemic
A novel strain of coronavirus (“COVID-19”) surfaced in late 2019 and has spread around the world, including to the United States. In March 2020, theWorld Health Organization declared COVID-19 a pandemic. The COVID-19 pandemic has disrupted our business operations and caused a significantunfavorable impact on our results of operations.
In response to the COVID-19 pandemic, various national, state, and local governments where we, our suppliers, and our customers operate issueddecrees prohibiting certain businesses from continuing to operate and certain classes of workers from reporting to work. Those decrees have resulted insupply chain disruption and higher employee absenteeism in our factories.
7

Additionally, certain of our manufacturing facilities experienced short-term suspensions of operations for COVID-19 employee health concerns.
The magnitude of the impact of COVID-19 remains unpredictable and we, therefore, continue to anticipate potential supply chain disruptions, employeeabsenteeism, short-term suspensions of manufacturing facilities and additional health and safety costs related to the COVID-19 pandemic that couldunfavorably impact our business. Although these disruptions and costs are expected to be temporary, there is significant uncertainty around the durationand overall impact to our business operations. We believe it is possible that the impact of the COVID-19 pandemic could have a material adverse effect onthe results of our operations, financial position and cash flows.
Recently Adopted Accounting Guidance
In June 2016, the FASB issued ASU No. 2016-13, Financial Instruments – Credit Losses (Topic 326): Measurement of Credit Losses on FinancialInstruments. ASU 2016-13 replaces the incurred loss impairment methodology in current GAAP with a methodology that reflects expected credit lossesand requires consideration of a broader range of reasonable and supportable information to estimate credit losses. ASU 2016-13 is effective for SEC filersfor interim and annual periods beginning after December 15, 2019. We adopted ASU 2016-13 using the modified retrospective method for all financialassets measured at amortized cost. Results for periods after January 1, 2020 are presented under ASU 2016-13 while prior period amounts continue to bereported under previously applicable accounting standards. We recorded a $1.3 million net decrease to retained earnings as of January 1, 2020 for thecumulative effect of adopting ASU 2016-13.
In January 2017, the FASB issued ASU No. 2017-04, Intangible - Goodwill and Other (Topic 350): Simplifying the Test for Goodwill Impairment. ASU2017-04 eliminates step two of the goodwill impairment test and specifies that goodwill impairment should be measured by comparing the fair value of areporting unit with its carrying amount. Additionally, the amount of goodwill allocated to each reporting unit with a zero or negative carrying amount of netassets should be disclosed. ASU 2017-04 is effective for annual or interim goodwill impairment tests performed in fiscal years beginning after December15, 2019. The adoption of ASU 2017-04 did not have a material impact on our consolidated results of operations, cash flows, or statement of financialposition.
In August 2018, the FASB issued ASU No. 2018-15, Intangibles – Internal-Use Software (Topic 350-40): Customer’s Accounting for ImplementationCosts incurred in a Cloud Computing Arrangement That is a Service Contract. ASU 2018-15 provides guidance to determine how implementation costsassociated with cloud computing arrangements that are incurred to develop or obtain internal-use software should be capitalized or expensed as incurred.ASU 2018-15 is effective for fiscal years beginning after December 15, 2019. The adoption of ASU 2018-15 did not have a material impact on ourconsolidated results of operations, cash flows, or statement of financial position.
2. Reportable Business Segments:
We operate in three reportable business segments of the heating, ventilation, air conditioning and refrigeration (“HVACR”) industry. Our segments areorganized primarily by the nature of the products and services we provide. The following table describes each segment: Segment Product or Services Markets Served Geographic Areas
Residential Heating &Cooling
Furnaces, air conditioners, heat pumps, packaged heating andcooling systems, indoor air quality equipment, comfortcontrol products, replacement parts and supplies
Residential Replacement;Residential New Construction
United StatesCanada
Commercial Heating &Cooling
Unitary heating and air conditioning equipment, appliedsystems, controls, installation and service of commercialheating and cooling equipment, and variable refrigerant flowcommercial products
Light Commercial United StatesCanada
Refrigeration Condensing units, unit coolers, fluid coolers, air cooledcondensers, air handlers, process chillers, controls, andcompressorized racks
Light Commercial;Food Preservation; Non-Food/Industrial
United StatesCanadaEurope
We use segment profit or loss as the primary measure of profitability to evaluate operating performance and to allocate capital resources. We definesegment profit or loss as a segment’s income or loss from continuing operations before income
8

taxes included in the accompanying Consolidated Statements of Operations, excluding certain items. The reconciliation in the table below details the itemsexcluded.
Our corporate costs include those costs related to corporate functions such as legal, internal audit, treasury, human resources, tax compliance and seniorexecutive staff. Corporate costs also include the long-term share-based incentive awards provided to employees throughout LII. We record these share-based awards as corporate costs because they are determined at the discretion of the Board of Directors and based on the historical practice of doing so forinternal reporting purposes.
Any intercompany sales and associated profit (and any other intercompany items) are eliminated from segment results. There were no significantintercompany eliminations for the periods presented.
Segment Data
Net sales and segment profit (loss) for each segment, along with a reconciliation of segment profit (loss) to Operating income, are shown below (inmillions):
For the Three Months Ended
September 30,For the Nine Months Ended
September 30,
2020 2019 2020 2019
Net salesResidential Heating & Cooling $ 722.0 $ 637.6 $ 1,808.8 $ 1,792.2 Commercial Heating & Cooling 207.9 253.3 574.6 687.9 Refrigeration 125.1 142.0 336.7 442.1
$ 1,055.0 $ 1,032.9 $ 2,720.1 $ 2,922.2
Segment profit (loss) (1)
Residential Heating & Cooling $ 153.0 $ 126.5 $ 312.8 $ 366.6 Commercial Heating & Cooling 38.8 47.1 93.1 116.0 Refrigeration 13.0 19.8 22.6 47.3 Corporate and other (28.3) (18.1) (61.3) (54.3)
Total segment profit 176.5 175.3 367.2 475.6 Reconciliation to Operating income:Special product quality adjustments — (0.5) (1.0) (1.0)Loss on sale of business — 0.2 — 9.1 Prior quarter partial advance of insurance recoveries related to lost profits — 8.0 — — Loss (gain) from natural disasters, net of insurance recoveries 4.9 1.2 7.6 (11.6)Items in Losses (gains) and other expenses, net that are excluded from segmentprofit (loss) (1) 4.4 3.5 10.5 7.3 Restructuring charges 0.1 6.1 10.6 6.5
Operating income $ 167.1 $ 156.8 $ 339.5 $ 465.3
(1) We define segment profit (loss) as a segment's operating income included in the accompanying Consolidated Statements of Operations, excluding:• The following items in Losses (gains) and other expenses, net:
◦ Net change in unrealized (gains) losses on unsettled futures contracts,◦ Special legal contingency charges,◦ Asbestos-related litigation,◦ Environmental liabilities,◦ Charges incurred related to COVID-19 pandemic,◦ Other items, net,
• Loss on sale of business,• Special product quality adjustments,• Prior quarter partial advance of insurance recoveries related to lost profits,• Loss (gain) from natural disasters, net of insurance recoveries; and,• Restructuring charges.
9
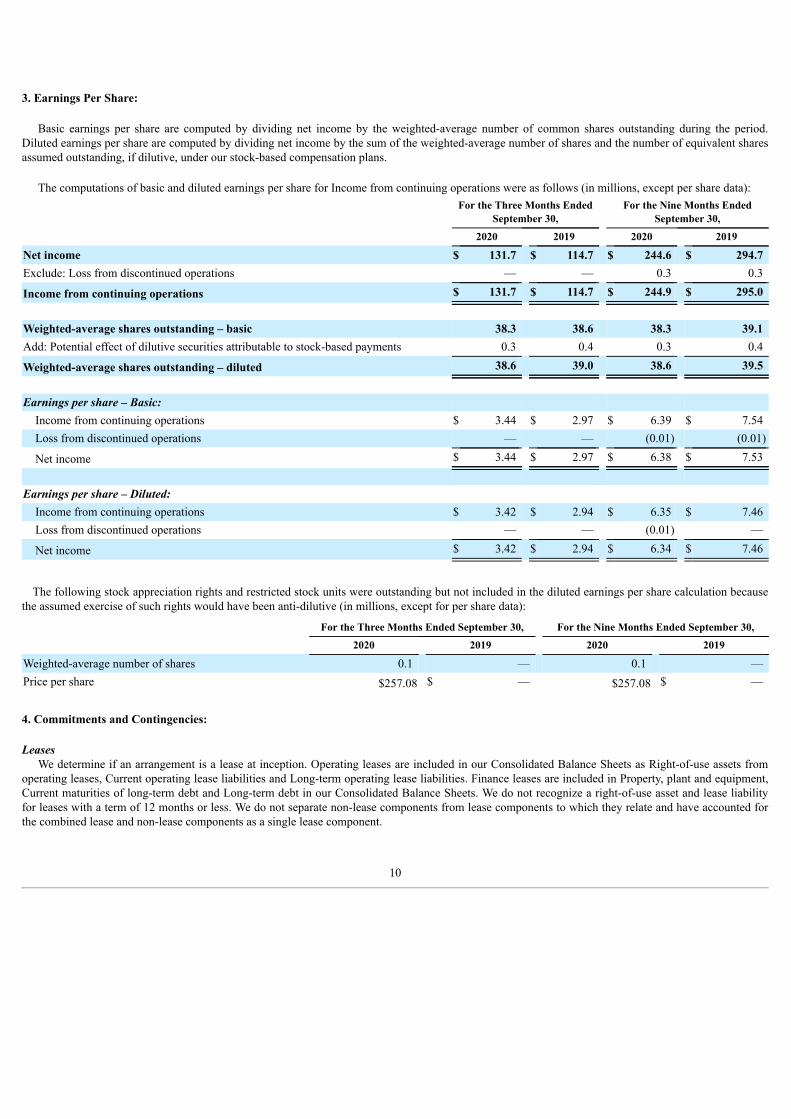
3. Earnings Per Share:
Basic earnings per share are computed by dividing net income by the weighted-average number of common shares outstanding during the period.Diluted earnings per share are computed by dividing net income by the sum of the weighted-average number of shares and the number of equivalent sharesassumed outstanding, if dilutive, under our stock-based compensation plans.
The computations of basic and diluted earnings per share for Income from continuing operations were as follows (in millions, except per share data):
For the Three Months Ended
September 30,For the Nine Months Ended
September 30,
2020 2019 2020 2019
Net income $ 131.7 $ 114.7 $ 244.6 $ 294.7 Exclude: Loss from discontinued operations — — 0.3 0.3
Income from continuing operations $ 131.7 $ 114.7 $ 244.9 $ 295.0
Weighted-average shares outstanding – basic 38.3 38.6 38.3 39.1 Add: Potential effect of dilutive securities attributable to stock-based payments 0.3 0.4 0.3 0.4
Weighted-average shares outstanding – diluted 38.6 39.0 38.6 39.5
Earnings per share – Basic:Income from continuing operations $ 3.44 $ 2.97 $ 6.39 $ 7.54 Loss from discontinued operations — — (0.01) (0.01)
Net income $ 3.44 $ 2.97 $ 6.38 $ 7.53
Earnings per share – Diluted:Income from continuing operations $ 3.42 $ 2.94 $ 6.35 $ 7.46 Loss from discontinued operations — — (0.01) —
Net income $ 3.42 $ 2.94 $ 6.34 $ 7.46
The following stock appreciation rights and restricted stock units were outstanding but not included in the diluted earnings per share calculation becausethe assumed exercise of such rights would have been anti-dilutive (in millions, except for per share data):
For the Three Months Ended September 30, For the Nine Months Ended September 30,
2020 2019 2020 2019
Weighted-average number of shares 0.1 — 0.1 — Price per share $257.08 $ — $257.08 $ —
4. Commitments and Contingencies:
LeasesWe determine if an arrangement is a lease at inception. Operating leases are included in our Consolidated Balance Sheets as Right-of-use assets from
operating leases, Current operating lease liabilities and Long-term operating lease liabilities. Finance leases are included in Property, plant and equipment,Current maturities of long-term debt and Long-term debt in our Consolidated Balance Sheets. We do not recognize a right-of-use asset and lease liabilityfor leases with a term of 12 months or less. We do not separate non-lease components from lease components to which they relate and have accounted forthe combined lease and non-lease components as a single lease component.
10

Many of our lease agreements contain renewal options; however, we do not recognize right-of-use assets or lease liabilities for renewal periods unless itis determined that we are reasonably certain of renewing the lease at inception or when a triggering event occurs. Some of our lease agreements containrent escalation clauses (including index-based escalations), rent holidays, capital improvement funding or other lease concessions. We recognize ourminimum rental expense on a straight-line basis based on the fixed components of a lease arrangement. We amortize this expense over the term of the leasebeginning with the date of initial possession, which is the date we enter the leased space and begin to make improvements in preparation for its intendeduse. Variable lease components represent amounts that are not fixed in nature and are not tied to an index or rate, and are recognized as incurred. Undercertain of our third-party service agreements, we control a specific space or underlying asset used in providing the service by the third-party serviceprovider. These arrangements meet the definition under ASC 842 and therefore are accounted for under ASC 842.
In determining our right-of-use assets and lease liabilities, we apply a discount rate to the minimum lease payments within each lease agreement. ASC842 requires us to use the rate of interest that a lessee would have to pay to borrow on a collateralized basis over a similar term an amount equal to the leasepayments in a similar economic environment. When we cannot readily determine the discount rate implicit in the lease agreement, we utilize ourincremental borrowing rate. To estimate our specific incremental borrowing rates over various tenors (ranging from 1-year through 30-years), a comparablemarket yield curve consistent with our credit quality was calibrated to our publicly outstanding debt instruments.
We lease certain real and personal property under non-cancelable operating leases. Approximately 72% of our right-of-use assets and lease liabilitiesrelate to our leases of real estate with the remaining amounts relating to our leases of IT equipment, fleet vehicles and manufacturing and distributionequipment.
Product Warranties and Product Related Contingencies
We provide warranties to customers for some of our products and record liabilities for the estimated future warranty-related costs based on failure rates,cost experience and other factors. We periodically review the assumptions used to determine the product warranty liabilities and will adjust the liabilities infuture periods for changes in assumptions, as necessary.
Liabilities for estimated product warranty costs related to continuing operations are included in the following captions on the accompanyingConsolidated Balance Sheets (in millions):
As of September 30, 2020 As of December 31, 2019
Accrued expenses $ 37.0 $ 38.2 Other liabilities 80.4 74.6
Total warranty liability $ 117.4 $ 112.8
The changes in product warranty liabilities related to continuing operations for the nine months ended September 30, 2020 were as follows (in millions):Total warranty liability as of December 31, 2019 $ 112.8
Warranty claims paid (26.9)Changes resulting from issuance of new warranties 31.2 Changes in estimates associated with pre-existing liabilities 0.3 Changes in foreign currency translation rates and other —
Total warranty liability as of September 30, 2020 $ 117.4
We have incurred, and will likely continue to incur, product costs not covered by insurance or our suppliers’ warranties, which are not included in thetables immediately above. Also, to satisfy our customers and protect our brands, we have repaired or replaced installed products experiencing quality-related issues, and will likely continue such repairs and replacements. Liabilities for such quality related issues are not material.
11

Litigation
We are involved in a number of claims and lawsuits incident to the operation of our businesses. Insurance coverages are maintained and estimated costsare recorded for such claims and lawsuits, including costs to settle claims and lawsuits, based on experience involving similar matters and specific factsknown.
Some of these claims and lawsuits allege personal injury or health problems resulting from exposure to asbestos that was integrated into certain of ourproducts. We have never manufactured asbestos and have not incorporated asbestos-containing components into our products for several decades. Asubstantial majority of these asbestos-related claims have been covered by insurance or other forms of indemnity or have been dismissed without payment.The remainder of our closed cases have been resolved for amounts that are not material, individually or in the aggregate. Our defense costs for asbestos-related claims are generally covered by insurance. However, our insurance coverage for settlements and judgments for asbestos-related claims variesdepending on several factors and are subject to policy limits. We may have greater financial exposure for future settlements and judgments. The followingtable summarizes the expenses, net of probable insurance recoveries, for known and future asbestos-related litigation recorded in Losses (gains) and otherexpenses, net in the Consolidated Statements of Operations (in millions):
For the Three Months EndedSeptember 30,
For the Nine Months EndedSeptember 30,
2020 2019 2020 2019
Expense (gain) for asbestos-related litigation, net $ 2.4 $ 1.5 $ 1.9 $ 3.3
It is management's opinion that none of these claims or lawsuits or any threatened litigation will have a material adverse effect on our financialcondition, results of operations or cash flows. Claims and lawsuits, however, involve uncertainties and it is possible that their eventual outcome couldadversely affect our results of operations for a particular period.
Natural Disasters and Recovery
On July 19, 2018, our manufacturing facility in Marshalltown, Iowa was severely damaged by a tornado. On August 10, 2020, the Marshalltown facilitywas partially damaged by a derecho wind storm. The costs and losses incurred as well as any insurance recoveries for both of these natural disasters areshown in Loss (gain) from natural disasters, net of insurance recoveries in the Consolidated Statements of Operations.
The following table summarizes the components of Loss (gain) from natural disasters, net of insurance recoveries (in millions):
For the Three Months EndedSeptember 30,
For the Nine Months EndedSeptember 30,
2020 2019 2020 2019
Marshalltown tornado $ 0.4 $ (7.1) $ 3.1 $ (85.4)Marshalltown wind storm 4.5 — 4.5 —
Loss (gain) from natural disasters, net of insurance recoveries $ 4.9 $ (7.1) $ 7.6 $ (85.4)
Marshalltown Tornado
Insurance covered the repair or replacement of our assets that suffered damage or loss, and business interruption costs, including lost profits, andreimbursement for other expenses and costs that have been incurred relating to the damages and losses suffered. In December 2019, we reached a finalsettlement with our insurance carriers for a total cumulative insurance recovery of $367.5 million for the losses we incurred and will incur from thetornado. All recoveries related to the final settlement were received in 2018 and 2019. The following table summarizes the Loss (gain) from naturaldisasters, net of insurance recoveries relating to the tornado (in millions):
12

For the Three Months EndedSeptember 30,
For the Nine Months EndedSeptember 30,
2020 2019 2020 2019
Insurance recoveries received $ — $ 10.0 $ — $ 138.0 Losses and expenses incurred:
Site clean-up and remediation — (3.5) — 19.8 Factory inefficiencies due to lower productivity — 0.8 — 9.3 Other 0.4 5.6 3.1 23.5
Total losses and expenses $ 0.4 $ 2.9 $ 3.1 $ 52.6 Components of Marshalltown tornado in Loss (gain) from naturaldisasters, net of insurance recoveries:
Insurance proceeds for lost profits — (8.3) — (73.8)Loss (gain) from natural disaster, net of insurance recoveries 0.4 1.2 3.1 (11.6)
$ 0.4 $ (7.1) $ 3.1 $ (85.4)
Marshalltown Wind Storm
We have insurance for the repair and replacement of our assets that suffered damage or loss, and are working closely with our insurance carriers andclaims adjusters to ascertain the amount of insurance recoveries due to us as a result of the damage and losses we suffered. Our insurance policies alsoprovide business interruption coverage, including lost profits and reimbursement for other expenses and costs that have been incurred related to thedamages and losses suffered. The following table summarizes the Loss (gain) from natural disasters, net of insurance recoveries relating to the wind storm(in millions):
For the Three Months EndedSeptember 30,
For the Nine Months EndedSeptember 30,
2020 2019 2020 2019
Inventory write-offs $ 0.1 $ — $ 0.1 $ — Site clean-up and remediation 0.5 — 0.5 — Building repairs 2.8 — 2.8 — Factory inefficiencies due to lower productivity 0.2 — 0.2 — Other 0.9 — 0.9 —
Total losses and expenses $ 4.5 $ — $ 4.5 $ — Components of Marshalltown wind storm in Loss (gain) from naturaldisasters, net of insurance recoveries:
Loss (gain) from natural disaster $ 4.5 $ — $ 4.5 $ —
5. Stock Repurchases:
Our Board of Directors have authorized a total of $3 billion to repurchase shares of our common stock (collectively referred to as the "Share RepurchasePlans"), including a $500 million share repurchase authorization in December 2019. Under this program, we may repurchase shares from time to time inopen market transactions and in privately negotiated transactions based on business, market, applicable legal requirements and other considerations. Therepurchase program does not require the repurchase of a specific number of shares and may be terminated at any time. As of September 30, 2020, $446million of shares may be repurchased under the Share Repurchase Plans.
On February 13, 2020, we entered into a Fixed Dollar Accelerated Share Repurchase Transaction (the "ASR Agreement") with Bank of America, toeffect an accelerated stock buyback of the Company's common stock. Under the ASR Agreement, we paid Bank of America $100.0 million and Bank ofAmerica delivered to us common stock representing approximately 85% of the shares expected to be purchased under the ASR Agreement. The ASR wascompleted in March 2020 and Bank of America delivered a total of 0.4 million shares of common stock repurchased under this ASR Agreement.
13

We also repurchased shares for $10.1 million during the nine months ended September 30, 2020 from employees who tendered their shares to satisfyminimum tax withholding obligations upon the vesting and exercise of stock-based compensation awards.
6. Divestitures:
During the first quarter of 2019, we obtained Board of Directors' approval and signed an agreement with EPTA S.p.A., a private Italian company, for thesale of our Kysor Warren business. The sale was completed on March 29, 2019 and the following table summarizes the net loss recognized in connectionwith this divestiture. There were no gains or losses on the sale of this business for the nine months ended September 30, 2020.
(Amounts in millions)For the Year Ended December
31, 2019
Cash received from the buyer $ 49.0 Net assets sold (52.0)AOCI reclassification adjustments, primarily foreign currency translation (2.1)Direct costs to sell (5.5)
Loss on sale of business $ (10.6)
7. Restructuring Charges:
We record restructuring charges associated with management-approved restructuring plans when we reorganize or remove duplicative headcount orinfrastructure within our businesses. Restructuring charges include severance costs to eliminate a specified number of employees, infrastructure charges tovacate facilities and consolidate operations, contract cancellation costs, accelerated depreciation for impaired assets and other related activities. The timingof associated cash payments is dependent upon the type of restructuring charge and can extend over a multi-year period. Restructuring charges are notincluded in our calculation of segment profit (loss), as more fully explained in Note 2.
Due to the economic impact of COVID-19 on our business, we implemented several cost reduction actions in the second quarter of 2020. We recorded$10.0 million of restructuring charges for the nine months ended September 30, 2020 for these actions, which consisted of employee terminations forpositions that were no longer needed to support the business, selective facility closures, and cancellations of certain sales and marketing activities. We alsorecorded $0.6 million of restructuring charges for restructuring plans initiated in the third and fourth quarters of 2019.
Information regarding the restructuring charges for all ongoing activities, including actions initiated in 2019, is presented in the following table (inmillions):
Incurred in 2020 Incurred to DateTotal Expected to
be Incurred
Severance and related expense $ 4.5 $ 5.8 $ 6.5 Asset write-offs and accelerated depreciation 1.9 3.6 3.6 Lease termination (0.1) 1.0 1.0 Other 4.3 4.8 5.5
Total restructuring charges $ 10.6 $ 15.2 $ 16.6
While restructuring charges are excluded from our calculation of segment profit (loss), the table below presents the restructuring charges associatedwith each segment (in millions):
Incurred in 2020 Incurred to DateTotal Expected to
be Incurred
Residential Heating & Cooling $ 6.5 $ 9.4 $ 9.4 Commercial Heating & Cooling 1.4 3.1 3.8 Refrigeration 1.4 1.4 2.1 Corporate & Other 1.3 1.3 1.3
Total restructuring charges $ 10.6 $ 15.2 $ 16.6
14

8. Revenue Recognition:
The following table disaggregates our revenue by business segment by geography which provides information as to the major source of revenue. SeeNote 2 for additional information on our reportable business segments and the products and services sold in each segment.
For the Three Months Ended September 30, 2020
Primary Geographic MarketsResidential Heating &
CoolingCommercial Heating &
Cooling Refrigeration Consolidated
United States $ 665.6 $ 184.6 $ 67.2 $ 917.4 Canada 56.4 22.7 — 79.1 Other international — 0.6 57.9 58.5
Total $ 722.0 $ 207.9 $ 125.1 $ 1,055.0
For the Three Months Ended September 30, 2019
Primary Geographic MarketsResidential Heating &
CoolingCommercial Heating &
Cooling Refrigeration Consolidated
United States $ 597.3 $ 227.0 $ 82.5 $ 906.8 Canada 40.3 26.0 — 66.3 Other international — 0.3 59.5 59.8
Total $ 637.6 $ 253.3 $ 142.0 $ 1,032.9
For the Nine Months Ended September 30, 2020
Primary Geographic MarketsResidential Heating &
CoolingCommercial Heating &
Cooling Refrigeration Consolidated
United States $ 1,681.8 $ 518.9 $ 188.0 $ 2,388.7 Canada 127.0 54.8 — $ 181.8 Other international — 0.9 148.7 $ 149.6
Total $ 1,808.8 $ 574.6 $ 336.7 $ 2,720.1
For the Nine Months Ended September 30, 2019
Primary Geographic MarketsResidential Heating &
CoolingCommercial Heating &
Cooling Refrigeration Consolidated
United States $ 1,677.6 $ 623.3 $ 254.1 $ 2,555.0 Canada 114.6 63.8 0.7 $ 179.1 International — 0.8 187.3 $ 188.1
Total $ 1,792.2 $ 687.9 $ 442.1 $ 2,922.2
Residential Heating & Cooling - We manufacture and market a broad range of furnaces, air conditioners, heat pumps, packaged heating and coolingsystems, equipment and accessories to improve indoor air quality, comfort control products, replacement parts and supplies and related products for boththe residential replacement and new construction markets in North America. These products are sold under various brand names and are sold either throughdirect sales to a network of independent installing dealers, including through our network of Lennox stores or to independent distributors. For the threemonths ended September 30, 2020 and 2019, direct sales represented 74% and 74% of revenues, and sales to independent distributors represented theremainder. For the nine months ended September 30, 2020 and 2019, direct sales represented 75% and 74% of revenues, and sales to independentdistributors represented the remainder. Given the nature of our business, customer product orders are fulfilled at a point in time and not over a period oftime.
Commercial Heating & Cooling - In North America, we manufacture and sell unitary heating and cooling equipment used in light commercialapplications, such as low-rise office buildings, restaurants, retail centers, churches and schools. These
15
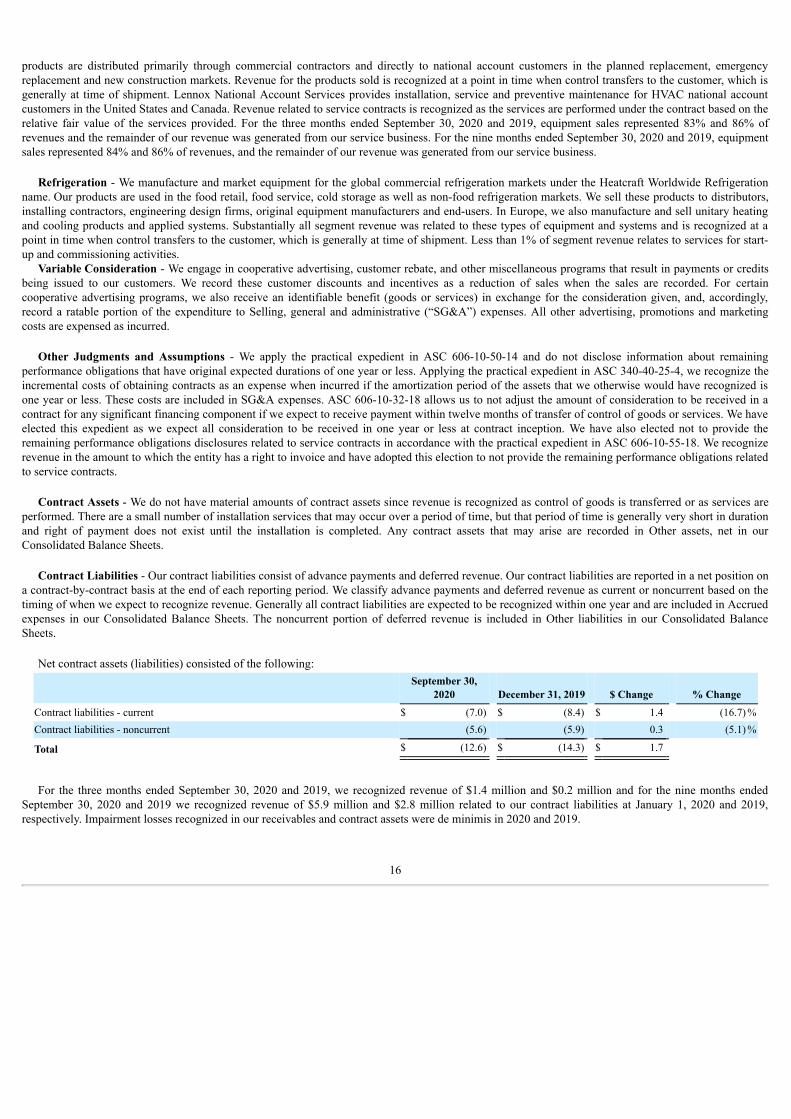
products are distributed primarily through commercial contractors and directly to national account customers in the planned replacement, emergencyreplacement and new construction markets. Revenue for the products sold is recognized at a point in time when control transfers to the customer, which isgenerally at time of shipment. Lennox National Account Services provides installation, service and preventive maintenance for HVAC national accountcustomers in the United States and Canada. Revenue related to service contracts is recognized as the services are performed under the contract based on therelative fair value of the services provided. For the three months ended September 30, 2020 and 2019, equipment sales represented 83% and 86% ofrevenues and the remainder of our revenue was generated from our service business. For the nine months ended September 30, 2020 and 2019, equipmentsales represented 84% and 86% of revenues, and the remainder of our revenue was generated from our service business.
Refrigeration - We manufacture and market equipment for the global commercial refrigeration markets under the Heatcraft Worldwide Refrigerationname. Our products are used in the food retail, food service, cold storage as well as non-food refrigeration markets. We sell these products to distributors,installing contractors, engineering design firms, original equipment manufacturers and end-users. In Europe, we also manufacture and sell unitary heatingand cooling products and applied systems. Substantially all segment revenue was related to these types of equipment and systems and is recognized at apoint in time when control transfers to the customer, which is generally at time of shipment. Less than 1% of segment revenue relates to services for start-up and commissioning activities.
Variable Consideration - We engage in cooperative advertising, customer rebate, and other miscellaneous programs that result in payments or creditsbeing issued to our customers. We record these customer discounts and incentives as a reduction of sales when the sales are recorded. For certaincooperative advertising programs, we also receive an identifiable benefit (goods or services) in exchange for the consideration given, and, accordingly,record a ratable portion of the expenditure to Selling, general and administrative (“SG&A”) expenses. All other advertising, promotions and marketingcosts are expensed as incurred.
Other Judgments and Assumptions - We apply the practical expedient in ASC 606-10-50-14 and do not disclose information about remainingperformance obligations that have original expected durations of one year or less. Applying the practical expedient in ASC 340-40-25-4, we recognize theincremental costs of obtaining contracts as an expense when incurred if the amortization period of the assets that we otherwise would have recognized isone year or less. These costs are included in SG&A expenses. ASC 606-10-32-18 allows us to not adjust the amount of consideration to be received in acontract for any significant financing component if we expect to receive payment within twelve months of transfer of control of goods or services. We haveelected this expedient as we expect all consideration to be received in one year or less at contract inception. We have also elected not to provide theremaining performance obligations disclosures related to service contracts in accordance with the practical expedient in ASC 606-10-55-18. We recognizerevenue in the amount to which the entity has a right to invoice and have adopted this election to not provide the remaining performance obligations relatedto service contracts.
Contract Assets - We do not have material amounts of contract assets since revenue is recognized as control of goods is transferred or as services areperformed. There are a small number of installation services that may occur over a period of time, but that period of time is generally very short in durationand right of payment does not exist until the installation is completed. Any contract assets that may arise are recorded in Other assets, net in ourConsolidated Balance Sheets.
Contract Liabilities - Our contract liabilities consist of advance payments and deferred revenue. Our contract liabilities are reported in a net position ona contract-by-contract basis at the end of each reporting period. We classify advance payments and deferred revenue as current or noncurrent based on thetiming of when we expect to recognize revenue. Generally all contract liabilities are expected to be recognized within one year and are included in Accruedexpenses in our Consolidated Balance Sheets. The noncurrent portion of deferred revenue is included in Other liabilities in our Consolidated BalanceSheets.
Net contract assets (liabilities) consisted of the following:September 30,
2020 December 31, 2019 $ Change % Change
Contract liabilities - current $ (7.0) $ (8.4) $ 1.4 (16.7) %Contract liabilities - noncurrent (5.6) (5.9) 0.3 (5.1) %
Total $ (12.6) $ (14.3) $ 1.7
For the three months ended September 30, 2020 and 2019, we recognized revenue of $1.4 million and $0.2 million and for the nine months endedSeptember 30, 2020 and 2019 we recognized revenue of $5.9 million and $2.8 million related to our contract liabilities at January 1, 2020 and 2019,respectively. Impairment losses recognized in our receivables and contract assets were de minimis in 2020 and 2019.
16

9. Other Financial Statement Details:Inventories:
The components of inventories are as follows (in millions):As of September 30, 2020 As of December 31, 2019
Finished goods $ 258.4 $ 402.9 Work in process 5.7 6.0 Raw materials and parts 204.8 198.8
Subtotal 468.9 607.7 Excess of current cost over last-in, first-out cost (60.2) (63.6)
Total inventories, net $ 408.7 $ 544.1
Goodwill:
The changes in the carrying amount of goodwill in 2020, in total and by segment, are summarized in the table below (in millions):
Balance atDecember 31, 2019
Changes in foreigncurrency translation
ratesBalance at
September 30, 2020
Residential Heating & Cooling $ 26.1 $ — $ 26.1 Commercial Heating & Cooling 61.1 — 61.1 Refrigeration 99.3 0.2 99.5
Total Goodwill $ 186.5 $ 0.2 $ 186.7
We monitor our reporting units for indicators of impairment throughout the year to determine if a change in facts or circumstances warrants a re-
evaluation of our goodwill. We have not recorded any goodwill impairments for the three or nine months ended September 30, 2020.
Derivatives:
Objectives and Strategies for Using Derivative Instruments
Commodity Price Risk - We utilize a cash flow hedging program to mitigate our exposure to volatility in the prices of metal commodities used in ourproduction processes. Our hedging program includes the use of futures contracts to lock in prices, and as a result, we are subject to derivative losses shouldthe metal commodity prices decrease and gains should the prices increase. We utilize a dollar cost averaging strategy so that a higher percentage ofcommodity price exposures are hedged near-term and lower percentages are hedged at future dates. This strategy allows for protection against near-termprice volatility while allowing us to adjust to market price movements over time.
Interest Rate Risk - A portion of our debt bears interest at variable rates, and as a result, we are subject to variability in the cash paid for interest. Tomitigate a portion of that risk, we may choose to engage in an interest rate swap hedging strategy to eliminate the variability of interest payment cash flows.We are not currently hedged against interest rate risk.
Foreign Currency Risk - Foreign currency exchange rate movements create a degree of risk by affecting the U.S. dollar value of assets and liabilitiesarising in foreign currencies. We seek to mitigate the impact of currency exchange rate movements on certain short-term transactions by periodicallyentering into foreign currency forward contracts.
Cash Flow Hedges
We have foreign exchange forward contracts and commodity futures contracts designated as cash flow hedges that are scheduled to mature throughJanuary 2021 and February 2022, respectively. Unrealized gains or losses from our cash flow hedges are included in Accumulated other comprehensiveloss (“AOCL”) and are expected to be reclassified into earnings
17

within the next 18 months based on the prices of the commodities and foreign currencies at the settlement dates. We recorded the following amounts inAOCL related to our cash flow hedges (in millions):
As of September 30, 2020 As of December 31, 2019
Unrealized (gains) losses on unsettled contracts $ (2.0) $ 0.2 Income tax expense (benefit) 0.3 (0.2)
(Gains) included in AOCL, net of tax (1) $ (1.7) $ —
(1) Assuming commodity prices and foreign currency exchange rates remain constant, we expect to reclassify $1.2 million of derivative gains intoearnings within the next 12 months.
Stock-Based Compensation:
We issue various long-term incentive awards, including performance share units, restricted stock units and stock appreciation rights under the LennoxInternational Inc. 2019 Incentive Plan, as amended and restated. Stock-based compensation expense related to continuing operations is included in Selling,general and administrative expenses in the accompanying Consolidated Statements of Operations as follows (in millions):
For the Three Months EndedSeptember 30,
For the Nine Months EndedSeptember 30,
2020 2019 2020 2019
Stock-based compensation expense (1) $ 8.0 $ 4.2 $ 18.4 $ 15.6
(1) All expense was recorded in our Corporate and Other business segment.
10. Pension Benefit Plans:
The components of net periodic benefit cost for pension benefits were as follows (in millions):
For the Three Months EndedSeptember 30,
For the Nine Months EndedSeptember 30,
2020 2019 2020 2019
Service cost $ 1.4 $ 1.2 $ 4.2 $ 3.6 Interest cost 1.6 2.7 5.0 8.1 Expected return on plan assets (2.0) (3.6) (6.2) (10.8)Amortization of prior service cost — 0.1 0.1 0.1 Recognized actuarial loss 1.4 1.4 4.3 4.3 Other 0.1 — — — Settlements and curtailments 0.3 — 0.3 60.6
Net periodic benefit cost $ 2.8 $ 1.8 $ 7.7 $ 65.9
11. Income Taxes:
As of September 30, 2020, we had approximately $3.2 million in total gross unrecognized tax benefits. Of this amount $3.2 million, if recognized,would be recorded through the Consolidated Statements of Operations.
We are currently under examination for our U.S. federal income taxes under the Internal Revenue Service's Compliance Assurance Program for 2019and are subject to examination by numerous other taxing authorities in the U.S. and in foreign jurisdictions. We are generally no longer subject to U.S.federal, state and local, or non-U.S. income tax examinations by taxing authorities for years prior to 2012.
18
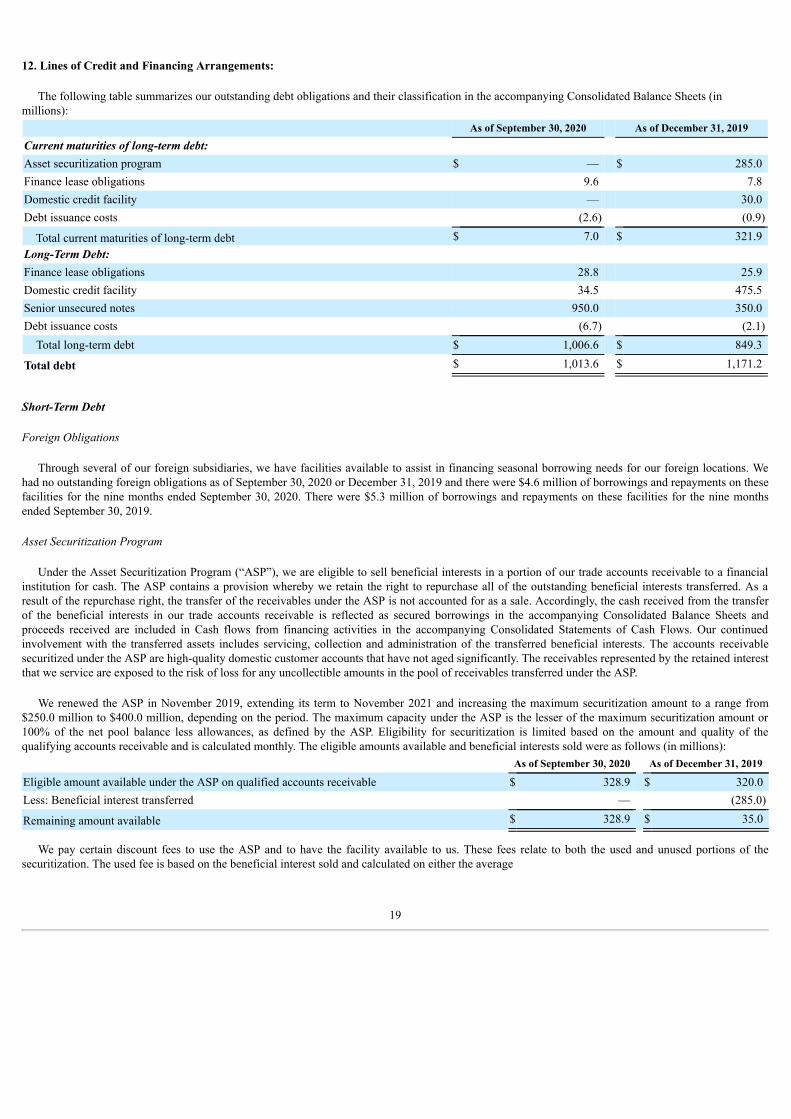
12. Lines of Credit and Financing Arrangements:
The following table summarizes our outstanding debt obligations and their classification in the accompanying Consolidated Balance Sheets (inmillions):
As of September 30, 2020 As of December 31, 2019
Current maturities of long-term debt:Asset securitization program $ — $ 285.0 Finance lease obligations 9.6 7.8 Domestic credit facility — 30.0 Debt issuance costs (2.6) (0.9)
Total current maturities of long-term debt $ 7.0 $ 321.9 Long-Term Debt:Finance lease obligations 28.8 25.9 Domestic credit facility 34.5 475.5 Senior unsecured notes 950.0 350.0 Debt issuance costs (6.7) (2.1)
Total long-term debt $ 1,006.6 $ 849.3
Total debt $ 1,013.6 $ 1,171.2
Short-Term Debt
Foreign Obligations
Through several of our foreign subsidiaries, we have facilities available to assist in financing seasonal borrowing needs for our foreign locations. Wehad no outstanding foreign obligations as of September 30, 2020 or December 31, 2019 and there were $4.6 million of borrowings and repayments on thesefacilities for the nine months ended September 30, 2020. There were $5.3 million of borrowings and repayments on these facilities for the nine monthsended September 30, 2019.
Asset Securitization Program
Under the Asset Securitization Program (“ASP”), we are eligible to sell beneficial interests in a portion of our trade accounts receivable to a financialinstitution for cash. The ASP contains a provision whereby we retain the right to repurchase all of the outstanding beneficial interests transferred. As aresult of the repurchase right, the transfer of the receivables under the ASP is not accounted for as a sale. Accordingly, the cash received from the transferof the beneficial interests in our trade accounts receivable is reflected as secured borrowings in the accompanying Consolidated Balance Sheets andproceeds received are included in Cash flows from financing activities in the accompanying Consolidated Statements of Cash Flows. Our continuedinvolvement with the transferred assets includes servicing, collection and administration of the transferred beneficial interests. The accounts receivablesecuritized under the ASP are high-quality domestic customer accounts that have not aged significantly. The receivables represented by the retained interestthat we service are exposed to the risk of loss for any uncollectible amounts in the pool of receivables transferred under the ASP.
We renewed the ASP in November 2019, extending its term to November 2021 and increasing the maximum securitization amount to a range from$250.0 million to $400.0 million, depending on the period. The maximum capacity under the ASP is the lesser of the maximum securitization amount or100% of the net pool balance less allowances, as defined by the ASP. Eligibility for securitization is limited based on the amount and quality of thequalifying accounts receivable and is calculated monthly. The eligible amounts available and beneficial interests sold were as follows (in millions):
As of September 30, 2020 As of December 31, 2019
Eligible amount available under the ASP on qualified accounts receivable $ 328.9 $ 320.0 Less: Beneficial interest transferred — (285.0)
Remaining amount available $ 328.9 $ 35.0
We pay certain discount fees to use the ASP and to have the facility available to us. These fees relate to both the used and unused portions of thesecuritization. The used fee is based on the beneficial interest sold and calculated on either the average
19
LIBOR rate or floating commercial paper rate determined by the purchaser of the beneficial interest, plus a program fee of 0.70%. The average rates as ofSeptember 30, 2020 and December 31, 2019 were 0.88% and 2.51%, respectively. The unused fee is based on 101% of the maximum available amount lessthe beneficial interest transferred and is calculated at a rate ranging between 0.25% and 0.35%, depending on the available borrowings, throughout the termof the agreement. We recorded these fees in Interest expense, net in the accompanying Consolidated Statements of Operations.
The ASP contains certain restrictive covenants relating to the quality of our accounts receivable and cross-default provisions with our Seventh Amendedand Restated Credit Facility Agreement ("Domestic Credit Facility"), senior unsecured notes and any other indebtedness we may have over $75.0 million.The administrative agent under the ASP is also a participant in our Domestic Credit Facility. The participating financial institutions have investment gradecredit ratings. As of September 30, 2020, we believe we were in compliance with all covenant requirements.
Long-Term Debt
Domestic Credit Facility
On July 30, 2020, we amended our Domestic Credit Facility to extend the term of our revolving credit facility by one year and to provide for a$250.0 million decrease in revolving commitments. The amended Domestic Credit Facility currently consists of a $750.0 million unsecured revolvingcredit facility that matures in August 2022. The previously outstanding unsecured term loan was fully repaid in September 2020.
Under our Domestic Credit Facility, we had outstanding borrowings of $34.5 million as well as $2.2 million committed to standby letters of credit as ofSeptember 30, 2020. Subject to covenant limitations, $713.3 million was available for future borrowings. The revolving credit facility includes a subfacilityfor swingline loans of up to $65.0 million.
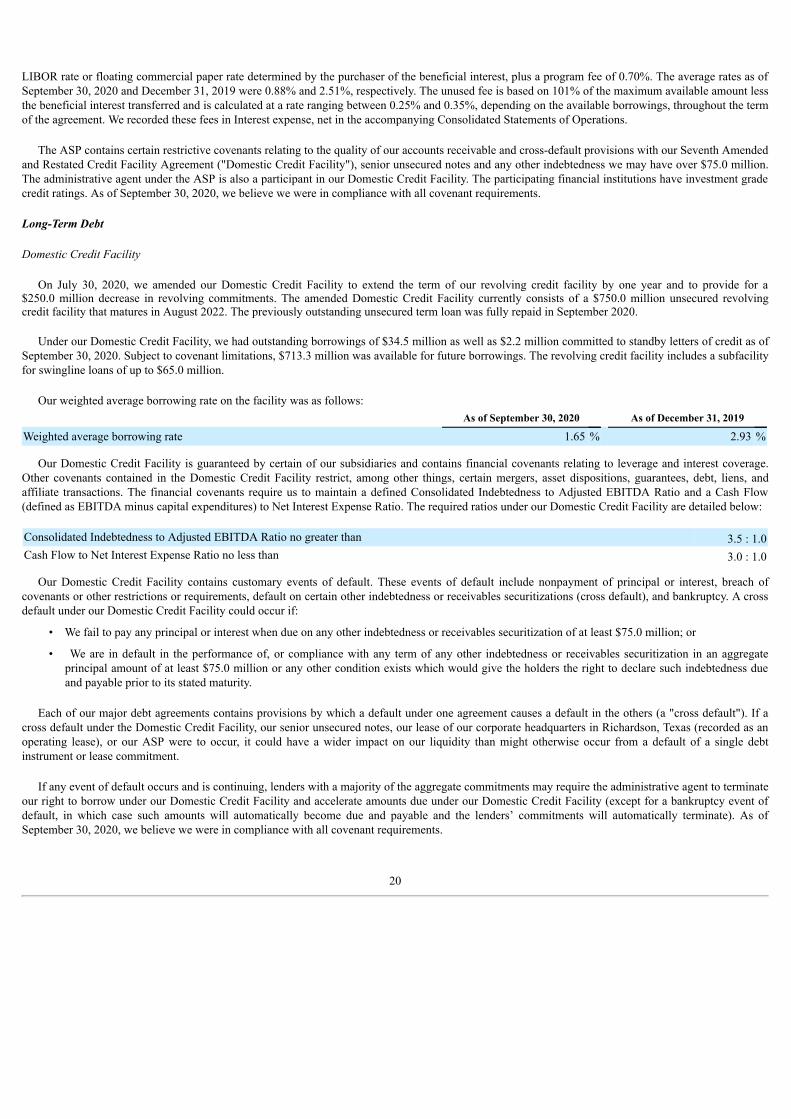
Our weighted average borrowing rate on the facility was as follows:As of September 30, 2020 As of December 31, 2019
Weighted average borrowing rate 1.65 % 2.93 %
Our Domestic Credit Facility is guaranteed by certain of our subsidiaries and contains financial covenants relating to leverage and interest coverage.Other covenants contained in the Domestic Credit Facility restrict, among other things, certain mergers, asset dispositions, guarantees, debt, liens, andaffiliate transactions. The financial covenants require us to maintain a defined Consolidated Indebtedness to Adjusted EBITDA Ratio and a Cash Flow(defined as EBITDA minus capital expenditures) to Net Interest Expense Ratio. The required ratios under our Domestic Credit Facility are detailed below: Consolidated Indebtedness to Adjusted EBITDA Ratio no greater than 3.5 : 1.0Cash Flow to Net Interest Expense Ratio no less than 3.0 : 1.0
Our Domestic Credit Facility contains customary events of default. These events of default include nonpayment of principal or interest, breach ofcovenants or other restrictions or requirements, default on certain other indebtedness or receivables securitizations (cross default), and bankruptcy. A crossdefault under our Domestic Credit Facility could occur if:
• We fail to pay any principal or interest when due on any other indebtedness or receivables securitization of at least $75.0 million; or
• We are in default in the performance of, or compliance with any term of any other indebtedness or receivables securitization in an aggregateprincipal amount of at least $75.0 million or any other condition exists which would give the holders the right to declare such indebtedness dueand payable prior to its stated maturity.
Each of our major debt agreements contains provisions by which a default under one agreement causes a default in the others (a "cross default"). If across default under the Domestic Credit Facility, our senior unsecured notes, our lease of our corporate headquarters in Richardson, Texas (recorded as anoperating lease), or our ASP were to occur, it could have a wider impact on our liquidity than might otherwise occur from a default of a single debtinstrument or lease commitment.
If any event of default occurs and is continuing, lenders with a majority of the aggregate commitments may require the administrative agent to terminateour right to borrow under our Domestic Credit Facility and accelerate amounts due under our Domestic Credit Facility (except for a bankruptcy event ofdefault, in which case such amounts will automatically become due and payable and the lenders’ commitments will automatically terminate). As ofSeptember 30, 2020, we believe we were in compliance with all covenant requirements.
20
Senior Unsecured Notes
We issued two series of senior unsecured notes on July 30, 2020 for $300.0 million each, which will mature on August 1, 2025 (the "2025 Notes") andAugust 1, 2027 (the "2027 Notes") with interest being paid semi-annually on February and August at 1.35% and 1.70% respectively, per annum. We alsoissued $350.0 million of senior unsecured notes in November 2016 (the "2023 Notes," and together with the 2025 Notes and the 2027 Notes, the "Notes")which will mature on November 15, 2023 with interest being paid semi-annually on May 15 and November 15 at 3.00% per annum.
All the Notes are guaranteed, on a senior unsecured basis, by certain of our subsidiaries that guarantee indebtedness under our Domestic Credit Facility.The indenture governing the Notes contains covenants that, among other things, limit our ability and the ability of the subsidiary guarantors to: create orincur certain liens; enter into certain sale and leaseback transactions; and enter into certain mergers, consolidations and transfers of substantially all of ourassets. The indenture also contains a cross default provision which is triggered if we default on other debt of at least $75.0 million in principal which is thenaccelerated, and such acceleration is not rescinded within 30 days of the notice date. As of September 30, 2020, we believe we were in compliance with allcovenant requirements.
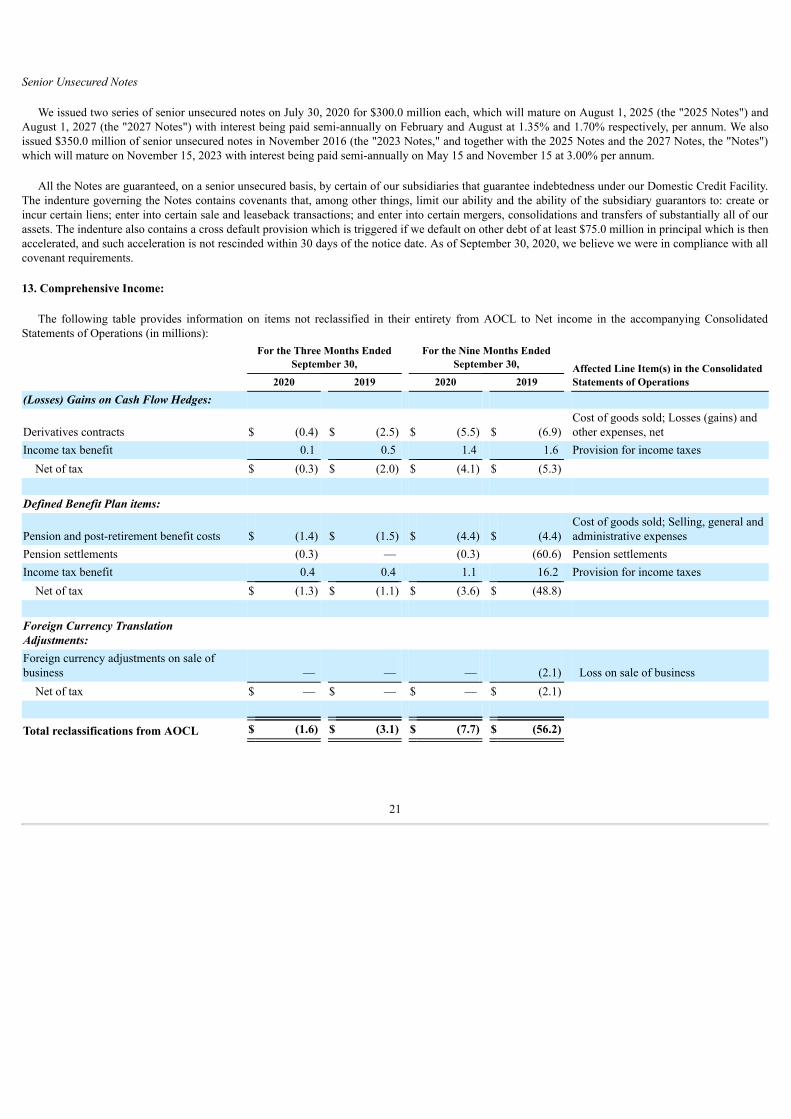
13. Comprehensive Income:
The following table provides information on items not reclassified in their entirety from AOCL to Net income in the accompanying ConsolidatedStatements of Operations (in millions):
For the Three Months EndedSeptember 30,
For the Nine Months EndedSeptember 30, Affected Line Item(s) in the Consolidated
Statements of Operations2020 2019 2020 2019
(Losses) Gains on Cash Flow Hedges:
Derivatives contracts $ (0.4) $ (2.5) $ (5.5) $ (6.9)Cost of goods sold; Losses (gains) andother expenses, net
Income tax benefit 0.1 0.5 1.4 1.6 Provision for income taxesNet of tax $ (0.3) $ (2.0) $ (4.1) $ (5.3)
Defined Benefit Plan items:
Pension and post-retirement benefit costs $ (1.4) $ (1.5) $ (4.4) $ (4.4)Cost of goods sold; Selling, general andadministrative expenses
Pension settlements (0.3) — (0.3) (60.6) Pension settlementsIncome tax benefit 0.4 0.4 1.1 16.2 Provision for income taxes
Net of tax $ (1.3) $ (1.1) $ (3.6) $ (48.8)
Foreign Currency TranslationAdjustments:Foreign currency adjustments on sale ofbusiness — — — (2.1) Loss on sale of business
Net of tax $ — $ — $ — $ (2.1)
Total reclassifications from AOCL $ (1.6) $ (3.1) $ (7.7) $ (56.2)
21

The following table provides information on changes in AOCL, by component (net of tax), for the nine months ended September 30, 2020 (in millions):
Gains (Losses) onCash Flow
Hedges
Share of equitymethod
investments othercomprehensive
income
Defined BenefitPension Plan
Items
ForeignCurrency
TranslationAdjustments Total AOCL
Balance as of December 31, 2019 $ — $ — $ (81.5) $ (22.3) $ (103.8)Other comprehensive loss before reclassifications (2.4) (1.2) (3.4) (11.8) (18.8)Amounts reclassified from AOCL 4.1 — 3.6 — 7.7 Net other comprehensive (loss) income 1.7 (1.2) 0.2 (11.8) (11.1)
Balance as of September 30, 2020 $ 1.7 $ (1.2) $ (81.3) $ (34.1) $ (114.9)
14. Fair Value Measurements:
Fair Value Hierarchy
The methodologies used to determine the fair value of our financial assets and liabilities at September 30, 2020 were the same as those used atDecember 31, 2019.
Assets and Liabilities Carried at Fair Value on a Recurring Basis
Derivatives were classified as Level 2 and primarily valued using estimated future cash flows based on observed prices from exchange-tradedderivatives. We also considered the counterparty's creditworthiness, or our own creditworthiness, as appropriate. Adjustments were recorded to reflect therisk of credit default, however, they were insignificant to the overall value of the derivatives. Refer to Note 9 for more information related to our derivativeinstruments.
Other Fair Value Disclosures
The carrying amounts of Cash and cash equivalents, Short-term investments, Accounts and notes receivable, net, Accounts payable, and Short-term debtapproximate fair value due to the short maturities of these instruments. The carrying amount of our Domestic Credit Facility in Long-term debt alsoapproximates fair value due to its variable-rate characteristics.
The fair value of our senior unsecured notes in Long-term debt, classified as Level 2, was based on the amount of future cash flows using currentmarket rates for debt instruments of similar maturities and credit risk. The following table presents their fair value (in millions):
As of September 30,2020 As of December 31, 2019
Senior unsecured notes $ 945.0 $ 356.8
22
Item 2. Management's Discussion and Analysis of Financial Condition and Results of Operations
This Quarterly Report on Form 10-Q contains forward-looking statements within the meaning of Section 27A of the Securities Act of 1933, asamended, and Section 21E of the Securities Exchange Act of 1934, as amended, that are based on information currently available to management as well asmanagement’s assumptions and beliefs as of the date such statements were made. All statements, other than statements of historical fact, included in thisQuarterly Report on Form 10-Q constitute forward-looking statements, including but not limited to statements identified by forward-looking terminology,such as the words “may,” “will,” “should,” “plan,” “anticipate,” “believe,” “intend,” “estimate” and “expect” and similar expressions. Such statementsreflect our current views with respect to future events, based on what we believe are reasonable assumptions; however, such statements are subject tocertain risks and uncertainties.
In addition to the specific uncertainties discussed elsewhere in this Quarterly Report on Form 10-Q, the risk factors set forth in Part I, “Item 1A. RiskFactors” in our Annual Report on Form 10-K for the year ended December 31, 2019, and those set forth in Part II, “Item 1A. Risk Factors” of this report, ifany, may affect our performance and results of operations. Should one or more of these risks or uncertainties materialize, or should underlying assumptionsprove incorrect, actual results may differ materially from those in the forward-looking statements. We disclaim any intention or obligation to update orreview any forward-looking statements or information, whether as a result of new information, future events or otherwise, except as required by law.
Business Overview
We operate in three reportable business segments of the heating, ventilation, air conditioning and refrigeration (“HVACR”) industry. Our reportablesegments are Residential Heating & Cooling, Commercial Heating & Cooling, and Refrigeration. For additional information regarding our reportablesegments, see Note 2 in the Notes to the Consolidated Financial Statements.
Our fiscal quarterly periods are comprised of approximately 13 weeks, but the number of days per quarter may vary year-over-year. Our quarterlyreporting periods usually end on the Saturday closest to the last day of March, June and September. Our fourth quarter and fiscal year ends on December31, regardless of the day of the week on which December 31 falls. For convenience, throughout this Management’s Discussion and Analysis of FinancialCondition and Results of Operations, the 13-week periods comprising each fiscal quarter are denoted by the last day of the respective calendar quarter.
We sell our products and services through a combination of direct sales, distributors and company-owned parts and supplies stores. The demand for ourproducts and services is seasonal and significantly impacted by the weather. Warmer than normal summer temperatures generate demand for replacementair conditioning and refrigeration products and services, and colder than normal winter temperatures have a similar effect on heating products and services.Conversely, cooler than normal summers and warmer than normal winters depress the demand for HVACR products and services. In addition to weather,demand for our products and services is influenced by national and regional economic and demographic factors, such as interest rates, the availability offinancing, regional population and employment trends, new construction, general economic conditions, and consumer spending habits and confidence. Asubstantial portion of the sales in each of our business segments is attributable to replacement business, with the balance comprised of new constructionbusiness.
The principal elements of cost of goods sold are components, raw materials, factory overhead, labor, estimated warranty costs, and freight anddistribution costs. The principal raw materials used in our manufacturing processes are steel, copper and aluminum. In recent years, pricing volatility forthese commodities and related components, including the impact of imposed tariffs on the import of certain of our raw materials and components, hasimpacted us and the HVACR industry in general. We seek to mitigate the impact of volatility in commodity prices through a combination of price increases,commodity contracts, improved production efficiency and cost reduction initiatives. We also partially mitigate volatility in the prices of these commoditiesby entering into futures contracts and fixed forward contracts.
Impact of COVID-19 Pandemic and the Resulting Changes to our 2020 Financial Performance
A novel strain of coronavirus (“COVID-19”) surfaced in late 2019 and has spread around the world, including to the United States. In March 2020, theWorld Health Organization declared COVID-19 a pandemic. The COVID-19 pandemic has disrupted our business operations and caused a significantunfavorable impact on our results of operations.
In response to the COVID-19 pandemic various national, state, and local governments where we, our suppliers, and our customers operate issueddecrees prohibiting certain businesses from continuing to operate and certain classes of workers from reporting to work. Those decrees have resulted insupply chain disruption and higher employee absenteeism in our factories.
23
Additionally, certain of our manufacturing facilities experienced short-term suspensions of operations for COVID-19 employee health concerns during thesecond and third quarters of 2020.
Due to the adverse impact of the COVID-19 pandemic on our European manufacturing facilities and the resulting downturn in the related business, werecorded an $8 million valuation allowance in the first quarter of 2020 on certain foreign deferred tax assets as we concluded that it was no longer morelikely than not that these foreign tax loss carryforwards would be realized.
In April 2020, we implemented cost reduction actions to realize $115 million of SG&A savings relative to our initial 2020 financial plans based onexpectations that the North American unitary HVAC and refrigeration market would be negatively impacted by approximately 20% due to the pandemic.During the third quarter, we revised our outlook for the remainder of 2020 due to the improved performance of our end markets and our strong operationalperformance. We are now planning for $65 million of SG&A savings this year, with the decrease in savings due primarily to reinstituting the temporarysalary reductions, increasing sales commissions and paying performance-based incentive compensation.
In connection with these cost saving actions, we incurred pre-tax charges of $10 million in the second and third quarters of 2020 related primarily topersonnel severance and benefits and facility exit costs. Also, we incurred $6 million of expenses for the nine months ended September 30, 2020 for facilitycleaning and sanitization supplies to ensure the health and safety of our employees.
The magnitude of the impact of COVID-19 remains unpredictable and we, therefore, continue to anticipate potential supply chain disruptions, employeeabsenteeism and short-term suspensions of manufacturing facilities, and additional health and safety costs related to the COVID-19 pandemic that couldunfavorably impact our business. Since the first quarter of 2020, we have reset our financial expectations and, based on our latest guidance, now expect2020 revenue to be down 5% to 9% from last year versus our initial 2020 guidance for growth of 4% to 8%. Additionally, we now expect Diluted EPS fromcontinuing operations in the range of $8.35 to $8.95 for the year as compared to our initial expected range of $11.30 to $11.90 for 2020.
We expect our cash generation to remain strong for 2020 as our working capital requirements decline, and currently project approximately $525 millionin cash flows from operations for the year. We reduced our capital expenditure plans for 2020 from $153 million initially to $100 million. We are ratedinvestment grade by both S&P and Moody’s, and we expect to remain well within our debt covenants. We do not anticipate any liquidity concerns as weissued $600 million in senior unsecured notes in the third quarter of 2020 and extended the term of bank revolver by one year until the latter half of 2022.Our quarterly dividend plans are unchanged, most recently $0.77 per share, or more than $115 million in total payments for the year. We repurchased $100million of stock in the first quarter of the $400 million we had planned to repurchase for the year. However, we placed the remaining repurchase plans for2020 on hold.
Financial Overview
Results for the third quarter of 2020 were mixed and adversely impacted by the business downturn caused by the COVID-19 pandemic. Year over yearsales and profit were up in our Residential Heating & Cooling segment primarily due to higher volumes, while they were down in our Commercial Heating& Cooling and Refrigeration segments primarily due to lower sales volumes. The Residential Heating & Cooling segment saw a 13% increase in net salesand a $27 million increase in segment profit. The Commercial Heating & Cooling segment had a 18% decrease in net sales and a $8 million decrease insegment profit. The Refrigeration segment had a 12% decline in net sales and a $7 million decline in segment profit.
Financial Highlights
• Net sales increased $22 million to $1,055 million in the third quarter of 2020 driven by favorable price and mix combined and net volumeincreases.
• Operating income in the third quarter of 2020 increased $10 million to $167 million primarily driven by factory productivity, lower commoditycosts, and sourcing and engineering-led cost reductions, partially offset by non-recurring insurance recoveries in 2019 for lost profits related to theMarshalltown tornado.
• Net income for the third quarter of 2020 increased $17 million to $132 million.• Diluted earnings per share from continuing operations were $3.42 per share in the third quarter of 2020 compared to $2.94 per share in the third
quarter of 2019.• For the nine months ended September 30, 2020, we returned $89 million to shareholders through dividend payments and repurchased $100 million
of common stock through our share repurchase program.
24
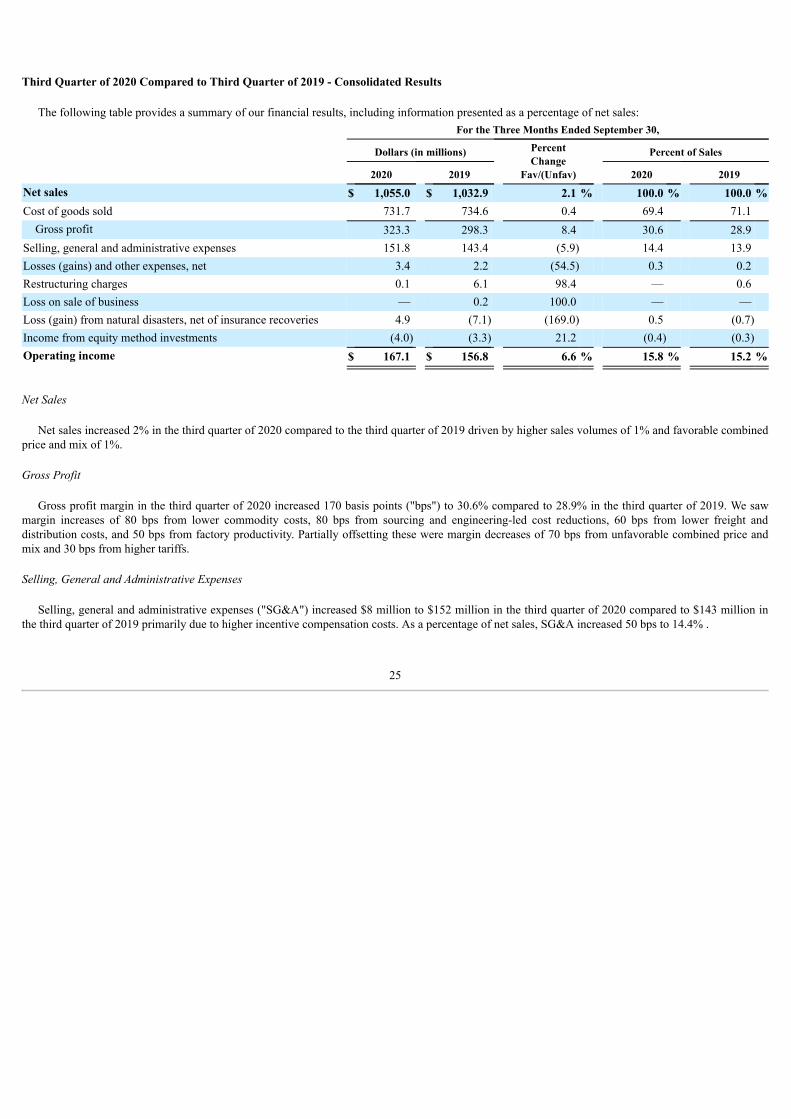
Third Quarter of 2020 Compared to Third Quarter of 2019 - Consolidated Results
The following table provides a summary of our financial results, including information presented as a percentage of net sales: For the Three Months Ended September 30,
Dollars (in millions) PercentChange
Fav/(Unfav)
Percent of Sales
2020 2019 2020 2019
Net sales $ 1,055.0 $ 1,032.9 2.1 % 100.0 % 100.0 %Cost of goods sold 731.7 734.6 0.4 69.4 71.1
Gross profit 323.3 298.3 8.4 30.6 28.9 Selling, general and administrative expenses 151.8 143.4 (5.9) 14.4 13.9 Losses (gains) and other expenses, net 3.4 2.2 (54.5) 0.3 0.2 Restructuring charges 0.1 6.1 98.4 — 0.6 Loss on sale of business — 0.2 100.0 — — Loss (gain) from natural disasters, net of insurance recoveries 4.9 (7.1) (169.0) 0.5 (0.7)Income from equity method investments (4.0) (3.3) 21.2 (0.4) (0.3)Operating income $ 167.1 $ 156.8 6.6 % 15.8 % 15.2 %
Net Sales
Net sales increased 2% in the third quarter of 2020 compared to the third quarter of 2019 driven by higher sales volumes of 1% and favorable combinedprice and mix of 1%.
Gross Profit
Gross profit margin in the third quarter of 2020 increased 170 basis points ("bps") to 30.6% compared to 28.9% in the third quarter of 2019. We sawmargin increases of 80 bps from lower commodity costs, 80 bps from sourcing and engineering-led cost reductions, 60 bps from lower freight anddistribution costs, and 50 bps from factory productivity. Partially offsetting these were margin decreases of 70 bps from unfavorable combined price andmix and 30 bps from higher tariffs.
Selling, General and Administrative Expenses
Selling, general and administrative expenses ("SG&A") increased $8 million to $152 million in the third quarter of 2020 compared to $143 million inthe third quarter of 2019 primarily due to higher incentive compensation costs. As a percentage of net sales, SG&A increased 50 bps to 14.4% .
25

Losses (gains) and Other Expenses, Net
Losses (gains) losses and other expenses, net for the third quarter of 2020 and 2019 included the following (in millions):For the Three Months Ended
September 30,
2020 2019
Realized losses on settled futures contracts $ — $ 0.1 Foreign currency exchange gains (0.4) (0.3)Gain on disposal of fixed assets (0.2) — Other operating income (0.4) (1.2)Net change in unrealized (gains) losses on unsettled futures contracts (1.4) 0.1 Special legal contingency charges 0.2 0.3 Asbestos-related litigation 2.4 1.5 Environmental liabilities 0.3 1.1 Charges incurred related to COVID-19 pandemic 3.0 — Other items, net (0.1) 0.6
Losses (gains) and other expenses, net (pre-tax) $ 3.4 $ 2.2
The net change in unrealized losses on unsettled futures contracts was due to changes in commodity prices relative to the unsettled futures contractprices. For more information on our futures contracts, see Note 9 in the Notes to the Consolidated Financial Statements. For more information on speciallegal contingency charges and asbestos-related litigation, see Note 4 in the Notes to the Consolidated Financial Statements. The environmental liabilitiesrelated to estimated remediation costs for contamination at some of our facilities. The charges incurred related to the COVID-19 pandemic related primarilyto facility cleaning costs and sanitization supplies to ensure the health and safety of our employees.
Restructuring Charges
Restructuring charges were insignificant in the third quarter of 2020 and related to ongoing cost reduction actions taken in prior periods. For additionalinformation on our restructuring activities, refer to Note 7 in the Notes to the Consolidated Financial Statements.
Gains and Losses related to Natural Disasters
On July 19, 2018, our manufacturing facility in Marshalltown, Iowa was severely damaged by a tornado. On August 10, 2020, the Marshalltown facilitywas partially damaged by a derecho wind storm. The costs and losses incurred as well as any insurance recoveries for both of these natural disasters areshown in Loss (gain) from natural disasters, net of insurance recoveries in the Consolidated Statements of Operations.
In December 2019, we reached a final settlement with our insurance carriers for a total cumulative insurance recovery of $367.5 million for the losseswe incurred and will incur from the tornado. All recoveries related to the final settlement were received in 2018 and 2019. During the third quarter of 2020,we incurred expenses of less than $1 million related to damages caused by the tornado, which primarily related to other restoration costs.
We have insurance for the repair and replacement of our assets that suffered damage or loss related to the wind storm. We are working closely with ourinsurance carriers and claims adjusters to ascertain the amount of insurance recoveries due to us as a result of the damage and losses we suffered. Ourinsurance policies also provide business interruption coverage, including lost profits and reimbursement for other expenses and costs that have beenincurred related to the damages and losses suffered. During the third quarter of 2020, we incurred expenses of approximately $5 million related to damagescaused by the wind storm, which included site clean up, building repairs and other restoration costs.
See Note 4 in the Notes to the Consolidated Financial Statements for additional information.
Income from Equity Method Investments
We participate in two joint ventures that are engaged in the manufacture and sale of compressors, unit coolers and condensing units. We exert significantinfluence over these affiliates based upon our ownership, but do not control them due to
26

venture partner participation. Accordingly, these joint ventures have been accounted for under the equity method and their financial position and results ofoperations are not consolidated. Income from equity method investments of $4 million in the third quarter of 2020 was up slightly compared to the thirdquarter of 2019.
Interest Expense, net
Interest expense, net of $7 million in the third quarter of 2020 was down $6 million from $13 million in the third quarter of 2019 due to lowerborrowing costs and fewer borrowings.
Income Taxes
Our effective tax rate was 17.3% for the third quarter of 2020 compared to 20.2% for the third quarter of 2019. The rate decreased primarily due tohigher excess tax benefits from stock-based compensation and a favorable mix of income from jurisdictions with lower tax rates. We expect our annualeffective tax rate in 2020 to be between 19% and 20%, after excluding the impacts of excess tax benefits recorded under ASU No. 2016-09, after the $8million valuation allowance recorded in the first quarter of 2020 and after the tax impacts of restructuring and pandemic-related charges.
Third Quarter of 2020 Compared to Third Quarter of 2019 - Results by Segment
Residential Heating & Cooling
The following table presents our Residential Heating & Cooling segment's net sales and profit for the third quarter of 2020 and 2019 (dollars inmillions):
For the Three Months Ended September30,
2020 2019 Difference % Change
Net sales $ 722.0 $ 637.6 $ 84.4 13.2 %Profit $ 153.0 $ 126.5 $ 26.5 20.9 %% of net sales 21.2 % 19.8 %
Net sales increased 13% in the third quarter of 2020 compared to the third quarter of 2019. Sales volumes increased 11% and combined price and mixincreased 2%.
Segment profit in the third quarter of 2020 increased $27 million compared to the third quarter of 2019 due to $19 million from higher sales volumes,$7 million of factory productivity, $6 million from engineering and sourcing-led cost reductions, $6 million from lower freight and distribution costs, $5million from lower commodity costs, $4 million of favorable price, $2 million from lower warranty and other product costs, and $1 million of income fromequity method investments. Partially offsetting these increases was $16 million of non-recurring insurance proceeds for lost profits related to theMarshalltown tornado, $4 million from timing of tariffs for certain Chinese imports, $1 million from unfavorable mix, $1 million from higher SG&Aexpenses, and $1 million from unfavorable foreign currency exchange rates.
Commercial Heating & Cooling
The following table presents our Commercial Heating & Cooling segment's net sales and profit for the third quarter of 2020 and 2019 (dollars inmillions):
For the Three Months Ended September30,
2020 2019 Difference % Change
Net sales $ 207.9 $ 253.3 $ (45.4) (17.9)%Profit $ 38.8 $ 47.1 $ (8.3) (17.6)%% of net sales 18.7 % 18.6 %
Net sales decreased 18% in the third quarter of 2020 compared to the third quarter of 2019. Sales volumes declined 15% and mix was unfavorable 3%.
27
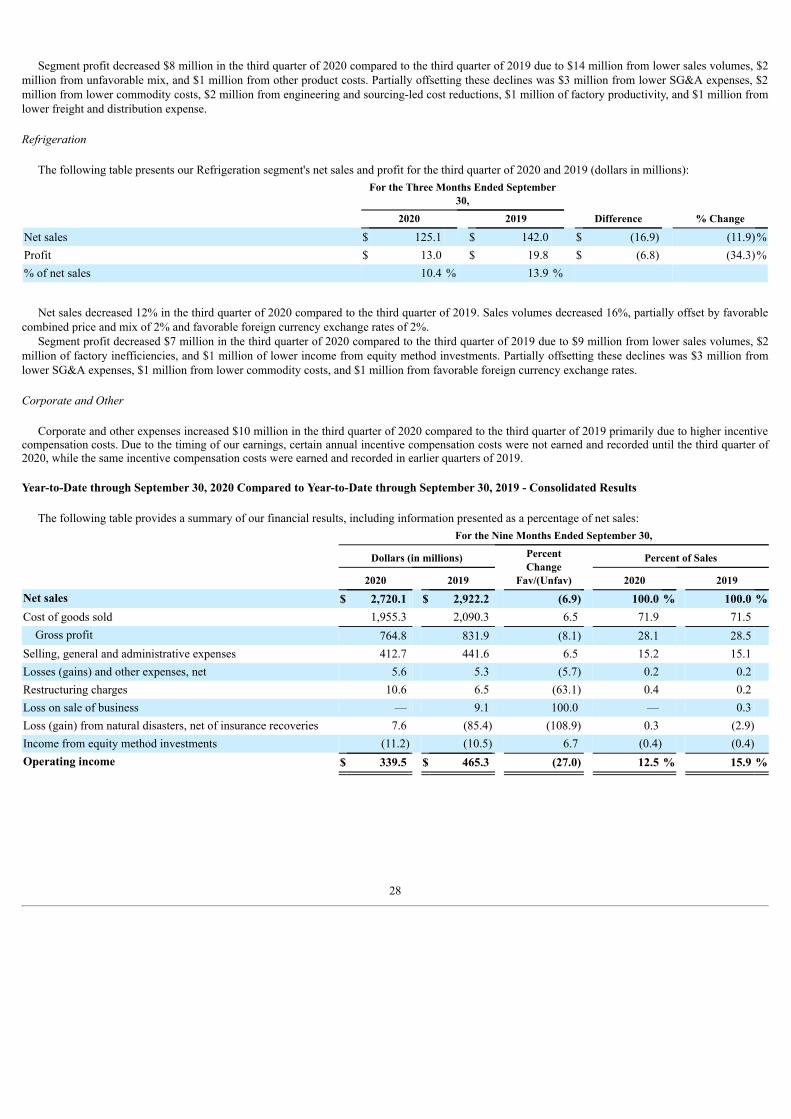
Segment profit decreased $8 million in the third quarter of 2020 compared to the third quarter of 2019 due to $14 million from lower sales volumes, $2million from unfavorable mix, and $1 million from other product costs. Partially offsetting these declines was $3 million from lower SG&A expenses, $2million from lower commodity costs, $2 million from engineering and sourcing-led cost reductions, $1 million of factory productivity, and $1 million fromlower freight and distribution expense.
Refrigeration
The following table presents our Refrigeration segment's net sales and profit for the third quarter of 2020 and 2019 (dollars in millions):For the Three Months Ended September
30,
2020 2019 Difference % Change
Net sales $ 125.1 $ 142.0 $ (16.9) (11.9)%Profit $ 13.0 $ 19.8 $ (6.8) (34.3)%% of net sales 10.4 % 13.9 %
Net sales decreased 12% in the third quarter of 2020 compared to the third quarter of 2019. Sales volumes decreased 16%, partially offset by favorablecombined price and mix of 2% and favorable foreign currency exchange rates of 2%.
Segment profit decreased $7 million in the third quarter of 2020 compared to the third quarter of 2019 due to $9 million from lower sales volumes, $2million of factory inefficiencies, and $1 million of lower income from equity method investments. Partially offsetting these declines was $3 million fromlower SG&A expenses, $1 million from lower commodity costs, and $1 million from favorable foreign currency exchange rates.
Corporate and Other
Corporate and other expenses increased $10 million in the third quarter of 2020 compared to the third quarter of 2019 primarily due to higher incentivecompensation costs. Due to the timing of our earnings, certain annual incentive compensation costs were not earned and recorded until the third quarter of2020, while the same incentive compensation costs were earned and recorded in earlier quarters of 2019.
Year-to-Date through September 30, 2020 Compared to Year-to-Date through September 30, 2019 - Consolidated Results
The following table provides a summary of our financial results, including information presented as a percentage of net sales: For the Nine Months Ended September 30,
Dollars (in millions) PercentChange
Fav/(Unfav)
Percent of Sales
2020 2019 2020 2019
Net sales $ 2,720.1 $ 2,922.2 (6.9) 100.0 % 100.0 %Cost of goods sold 1,955.3 2,090.3 6.5 71.9 71.5
Gross profit 764.8 831.9 (8.1) 28.1 28.5 Selling, general and administrative expenses 412.7 441.6 6.5 15.2 15.1 Losses (gains) and other expenses, net 5.6 5.3 (5.7) 0.2 0.2 Restructuring charges 10.6 6.5 (63.1) 0.4 0.2 Loss on sale of business — 9.1 100.0 — 0.3 Loss (gain) from natural disasters, net of insurance recoveries 7.6 (85.4) (108.9) 0.3 (2.9)Income from equity method investments (11.2) (10.5) 6.7 (0.4) (0.4)Operating income $ 339.5 $ 465.3 (27.0) 12.5 % 15.9 %
28
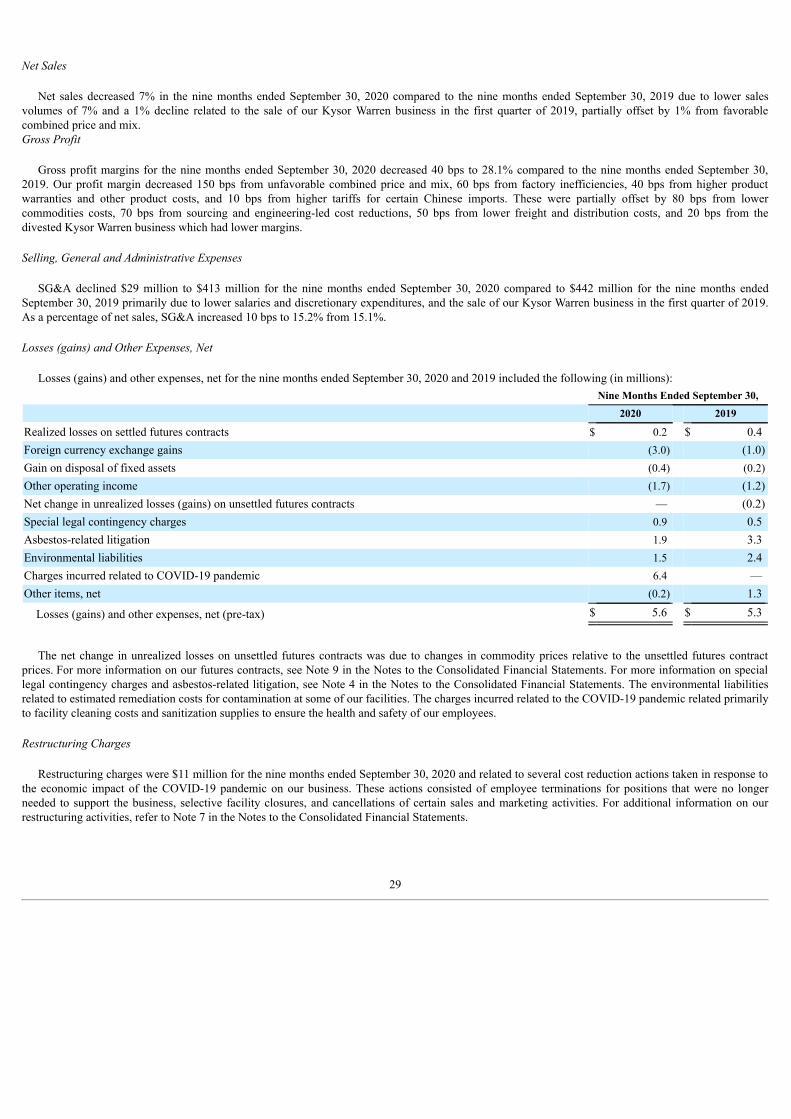
Net Sales
Net sales decreased 7% in the nine months ended September 30, 2020 compared to the nine months ended September 30, 2019 due to lower salesvolumes of 7% and a 1% decline related to the sale of our Kysor Warren business in the first quarter of 2019, partially offset by 1% from favorablecombined price and mix.Gross Profit
Gross profit margins for the nine months ended September 30, 2020 decreased 40 bps to 28.1% compared to the nine months ended September 30,2019. Our profit margin decreased 150 bps from unfavorable combined price and mix, 60 bps from factory inefficiencies, 40 bps from higher productwarranties and other product costs, and 10 bps from higher tariffs for certain Chinese imports. These were partially offset by 80 bps from lowercommodities costs, 70 bps from sourcing and engineering-led cost reductions, 50 bps from lower freight and distribution costs, and 20 bps from thedivested Kysor Warren business which had lower margins.
Selling, General and Administrative Expenses
SG&A declined $29 million to $413 million for the nine months ended September 30, 2020 compared to $442 million for the nine months endedSeptember 30, 2019 primarily due to lower salaries and discretionary expenditures, and the sale of our Kysor Warren business in the first quarter of 2019.As a percentage of net sales, SG&A increased 10 bps to 15.2% from 15.1%.
Losses (gains) and Other Expenses, Net
Losses (gains) and other expenses, net for the nine months ended September 30, 2020 and 2019 included the following (in millions):Nine Months Ended September 30,
2020 2019
Realized losses on settled futures contracts $ 0.2 $ 0.4 Foreign currency exchange gains (3.0) (1.0)Gain on disposal of fixed assets (0.4) (0.2)Other operating income (1.7) (1.2)Net change in unrealized losses (gains) on unsettled futures contracts — (0.2)Special legal contingency charges 0.9 0.5 Asbestos-related litigation 1.9 3.3 Environmental liabilities 1.5 2.4 Charges incurred related to COVID-19 pandemic 6.4 — Other items, net (0.2) 1.3
Losses (gains) and other expenses, net (pre-tax) $ 5.6 $ 5.3
The net change in unrealized losses on unsettled futures contracts was due to changes in commodity prices relative to the unsettled futures contractprices. For more information on our futures contracts, see Note 9 in the Notes to the Consolidated Financial Statements. For more information on speciallegal contingency charges and asbestos-related litigation, see Note 4 in the Notes to the Consolidated Financial Statements. The environmental liabilitiesrelated to estimated remediation costs for contamination at some of our facilities. The charges incurred related to the COVID-19 pandemic related primarilyto facility cleaning costs and sanitization supplies to ensure the health and safety of our employees.
Restructuring Charges
Restructuring charges were $11 million for the nine months ended September 30, 2020 and related to several cost reduction actions taken in response tothe economic impact of the COVID-19 pandemic on our business. These actions consisted of employee terminations for positions that were no longerneeded to support the business, selective facility closures, and cancellations of certain sales and marketing activities. For additional information on ourrestructuring activities, refer to Note 7 in the Notes to the Consolidated Financial Statements.
29
Loss on Sale of Business
We recognized a loss of $9 million for the nine months ended September 30, 2019 related to the sale of our Kysor Warren business in the first quarter of2019. There were no losses related to this sale for the nine months ended September 30, 2020. Refer to Note 6 in the Notes to the Consolidated FinancialStatements for additional information on this divestiture.
Gains and Losses related to Natural Disasters
On July 19, 2018, our manufacturing facility in Marshalltown, Iowa was severely damaged by a tornado. On August 10, 2020, the Marshalltown facilitywas partially damaged by a derecho wind storm. The costs and losses incurred as well as any insurance recoveries for both of these natural disasters areshown in Loss (gain) from natural disasters, net of insurance recoveries in the Consolidated Statements of Operations.
In December 2019, we reached a final settlement with our insurance carriers for a total cumulative insurance recovery of $367.5 million for the losseswe incurred and will incur from the tornado. All recoveries related to the final settlement were received in 2018 and 2019. For the nine months endedSeptember 30, 2020, we incurred expenses of $3 million related to damages caused by the tornado, which primarily related to other restoration costs.
We have insurance for the repair and replacement of our assets that suffered damage or loss related to the wind storm. We are working closely with ourinsurance carriers and claims adjusters to ascertain the amount of insurance recoveries due to us as a result of the damage and losses we suffered. Ourinsurance policies also provide business interruption coverage, including lost profits and reimbursement for other expenses and costs that have beenincurred related to the damages and losses suffered. During the third quarter of 2020, we incurred expenses of approximately $5 million related to damagescaused by the wind storm, which included site clean up, building repairs and other restoration costs.
Income from Equity Method Investments
Income from equity method investments of $11 million for the nine months ended September 30, 2020 was up approximately $1 million compared tothe nine months ended September 30, 2019.
Pension Settlements
In the second quarter of 2019, we entered into an agreement with Pacific Life Insurance Company to purchase a group annuity contract and transfer$100.0 million of our pension plan assets and $105.6 million of related pension benefit obligations. We recognized a $60.6 million pension settlementcharge in the Statement of Operations as a result of this transaction. There were less than $1 million of pension settlements for the nine months endedSeptember 30, 2020. For additional information, refer to Note 10 in the Notes to the Consolidated Financial Statements.
Interest Expense, net
Interest expense, net of $22 million for the nine months ended September 30, 2020 decreased $15 million from $37 million for the nine months endedSeptember 30, 2019 due to lower borrowing costs and lower borrowings.
Income Taxes
Our effective tax rate increased to 21.9% for the nine months ended September 30, 2020 compared to 19.5% for the nine months ended September 30,2019 primarily due to lower excess tax benefits from stock-based compensation and the recording of a $8 million valuation allowance on certain foreigndeferred tax assets recorded in the first quarter of 2020.
30
Year-to-Date through September 30, 2020 Compared to Year-to-Date through September 30, 2019 - Results by Segment
Residential Heating & Cooling
The following table presents our Residential Heating & Cooling segment's net sales and profit for the nine months ended September 30, 2020 and 2019(dollars in millions):
Nine Months Ended September 30,
2020 2019 Difference % Change
Net sales $ 1,808.8 $ 1,792.2 $ 16.6 0.9 %Profit $ 312.8 $ 366.6 $ (53.8) (14.7)%% of net sales 17.3 % 20.5 %
Net sales increased 1% in the nine months ended September 30, 2020 compared to the nine months ended September 30, 2019. Price increased 1% andmix was favorable by 1%, partially offset by lower sales volumes of 1%.
Segment profit for the nine months ended September 30, 2020 decreased $54 million compared to the same period in 2019 due to $74 million of non-recurring insurance proceeds in 2019 for lost profits related to the Marshalltown tornado, $10 million of factory inefficiencies, $14 million of higherwarranty and other product costs, $6 million from lower sales volume, $19 million from unfavorable mix, and $2 million from higher tariffs on certainChinese imports. Partially offsetting these declines was $17 million from lower SG&A expenses, $14 million from engineering and sourcing-led costreductions, $13 million from lower commodity costs, $13 million of higher price, $13 million from lower freight and distribution expense, and $1 millionfrom favorable foreign currency exchange rates.
Commercial Heating & Cooling
The following table presents our Commercial Heating & Cooling segment's net sales and profit for the nine months ended September 30, 2020 and 2019(dollars in millions):
Nine Months Ended September 30,
2020 2019 Difference % Change
Net sales $ 574.6 $ 687.9 $ (113.3) (16.5)%Profit $ 93.1 $ 116.0 $ (22.9) (19.7)%% of net sales 16.2 % 16.9 %
Net sales decreased 16% in the nine months ended September 30, 2020 compared to the nine months ended September 30, 2019 due to lower salesvolumes.
Segment profit for the nine months ended September 30, 2020 decreased $23 million compared to the same period of 2019 due to $40 million fromlower sales volumes, $5 million from unfavorable mix, and $2 million from higher warranty and other product costs. Partially offsetting these declines was$9 million from lower SG&A expenses, $6 million from engineering and sourcing-led cost reductions, $5 million from lower commodity costs, $1 millionof factory productivity, $2 million from lower freight and distribution expenses, and $1 million from favorable foreign currency exchange rates.
Refrigeration
The following table presents our Refrigeration segment's net sales and profit for the nine months ended September 30, 2020 and 2019 (dollars inmillions):
Nine Months Ended September 30,
2020 2019 Difference % Change
Net sales $ 336.7 $ 442.1 $ (105.4) (23.8)%Profit $ 22.6 $ 47.3 $ (24.7) (52.2)%% of net sales 6.7 % 10.7 %
31

Net sales decreased 24% for the nine months ended September 30, 2020 compared to the nine months ended September 30, 2019. Sales volumes werelower by 17% and the loss of sales from our divested Kysor Warren business contributed 8%, which was partially offset by favorable combined price andmix of 1%.
Segment profit for the nine months ended September 30, 2020 decreased $25 million compared to the same period of 2019 due to $26 million fromlower sales volumes, $9 million of factory inefficiencies, $4 million from warranty and other product costs, $2 million from non-recurring Europeanrefrigerant quota sales in 2019, and $1 million from lower income from equity method investments. Partially offsetting these declines was $7 million fromlower SG&A expenses, $4 million from lower commodity costs, $2 million from engineering and souring-led cost reductions, $1 million from favorablecombined price and mix, $1 million from lower freight and distribution expenses, $1 million of higher profit due to the divestiture of the Kysor Warrenbusiness, and $1 million from favorable foreign currency exchange rates.
Corporate and Other
Corporate and other expenses increased $7 million in the nine months ended September 30, 2020 compared to the nine months ended September 30,2019 due to higher incentive compensation costs.
Liquidity and Capital Resources
Our working capital and capital expenditure requirements are generally met through internally generated funds, bank lines of credit and an assetsecuritization arrangement. Working capital needs are generally greater in the first and second quarters due to the seasonal nature of our business cycle.
Statement of Cash Flows
The following table summarizes our cash flow activity for the nine months ended September 30, 2020 and 2019 (in millions):For the Nine Months Ended
September 30,
2020 2019
Net cash provided by operating activities $ 446.2 $ 124.5 Net cash used in investing activities (56.5) (23.1)Net cash used in financing activities (365.0) (102.8)
Net Cash Provided by Operating Activities - We generated $446 million in cash from operating activities during the nine months ended September 30,2020. The increase in net cash provided by operating activities for the nine months ended September 30, 2020 compared to the same period in 2019 reflectslower working capital requirements in 2020.
Net Cash Used in Investing Activities - Capital expenditures were $56 million in the nine months ended September 30, 2020 compared to $77 million inthe same period of 2019. Capital expenditures in 2020 were primarily related to the expansion of manufacturing capacity and equipment, and investmentsin systems and software to support the overall enterprise. For the nine months ended September 30, 2019, we also received net proceeds of $44 million forthe sale of our Kysor Warren business and insurance recoveries of $12 million to replace property and equipment damaged by the Marshalltown tornado.
Net Cash Used in Financing Activities - Net cash used in financing activities in the nine months ended September 30, 2020 increased to $365 millionfrom $103 million in the same period of 2019. The increase was primarily due to lower net borrowings, which resulted from reduced working capitalrequirements, and was partially offset by fewer stock repurchases. We repurchased $100 million of shares for the nine months ended September 30, 2020and returned $89 million to shareholders through dividend payments. For additional information on share repurchases, refer to Note 5 in the Notes to theConsolidated Financial Statements.
Debt Position
The following table details our lines of credit and financing arrangements as of September 30, 2020 (in millions):
32

OutstandingBorrowings
Current maturities of long-term debt:Asset securitization program (2) $ — Finance lease obligations 9.6
Domestic credit facility (1) — Debt issuance costs (2.6) Total current maturities of long-term debt $ 7.0 Long-term debt:Finance lease obligations 28.8
Domestic credit facility (1) 34.5 Senior unsecured notes 950.0 Debt issuance costs (6.7) Total long-term debt 1,006.6 Total debt $ 1,013.6
(1) The available future borrowings on our domestic credit facility are $713.3 million, after being reduced by the outstanding borrowings and $2.2 million inoutstanding standby letters of credit. We also had $29.6 million in outstanding standby letters of credit outside of the domestic credit facility as ofSeptember 30, 2020. The domestic credit facility matures in August 2022.
(2) The maximum securitization amount ranges from $250.0 million to $400.0 million, depending on the period. The maximum capacity of the ASP is thelesser of the maximum securitization amount or 100% of the net pool balance less reserves, as defined under the ASP. Refer to Note 12 in the Notes tothe Consolidated Financial Statements for more information.
Financial Leverage
We periodically review our capital structure to ensure the appropriate levels of leverage and liquidity. We may access the capital markets, as necessary,based on business needs and to take advantage of favorable interest rate environments or other market conditions. We also evaluate our debt-to-capital anddebt-to-EBITDA ratios to determine, among other considerations, the appropriate targets for capital expenditures and share repurchases under our sharerepurchase programs. Our debt-to-total-capital ratio decreased to 112.9% at September 30, 2020 from 117.0% at December 31, 2019.
As of September 30, 2020, our senior credit ratings were Baa3 with a stable outlook, and BBB with a stable outlook, by Moody's Investors Service, Inc.("Moody's") and Standard & Poor's Rating Group ("S&P"), respectively. The security ratings are not a recommendation to buy, sell or hold securities andmay be subject to revision or withdrawal at any time by the assigning rating agency. Each rating should be evaluated independently of any other rating. Ourgoal is to maintain investment grade ratings from Moody's and S&P to help ensure the capital markets remain available to us.
Liquidity
We believe our cash and cash equivalents of $55 million, future cash generated from operations and available future borrowings are sufficient to fundoperations, planned capital expenditures, future contractual obligations, potential share repurchases and dividends and other needs in the foreseeable future.Included in our cash and cash equivalents of $55 million as of September 30, 2020 was $25 million of cash held in foreign locations. Our cash held inforeign locations is used for investing and operating activities in those locations, and we generally do not have the need or intent to repatriate those funds tothe United States. An actual repatriation in the future from our non-U.S. subsidiaries could be subject to foreign withholding taxes and U.S. state taxes.Guarantees related to our Debt Obligations
Our senior unsecured notes were issued by Lennox International Inc. (the "Parent") and are unconditionally guaranteed by certain of our subsidiaries(the "Guarantor Subsidiaries") and are not secured by our other subsidiaries. The Guarantor Subsidiaries are 100% owned and consolidated, all guaranteesare full and unconditional, and all guarantees are joint and several.
33
The following combined Parent and Guarantor Subsidiaries financial information is presented as of September 30, 2020 and December 31, 2019 and forthe three and nine months ended September 30, 2020 (in millions):
As of September 30,2020 As of December 31, 2019
Current assets $ 464.8 $ 594.5 Non-current assets $ 2,880.8 $ 2,297.8 Current liabilities $ 590.3 $ 619.7 Non-current liabilities $ 1,355.1 $ 1,169.4 Amounts due to non-guarantor subsidiaries $ (329.0) $ (339.2)
For the Three Months EndedSeptember 30, 2020
For the Nine Months EndedSeptember 30, 2020
For the Year EndedDecember 31, 2019
Net sales $ 960.0 $ 2,531.1 $ 3,479.8 Gross profit $ 294.6 $ 725.9 $ 966.6 Income from continuing operations $ 262.0 $ 500.2 $ 828.4 Net income $ 262.0 $ 500.2 $ 828.4 Net sales to non-guarantor subsidiaries $ 55.0 $ 178.0 $ 228.3
Off Balance Sheet Arrangements
An off-balance sheet arrangement is any transaction, agreement or other contractual arrangement involving an unconsolidated entity under which thecompany has: (1) made guarantees, (2) a retained or a contingent interest in transferred assets, (3) an obligation under derivative instruments classified asequity or (4) any obligation arising out of a material variable interest in an unconsolidated entity that provides financing, liquidity, market risk or credit risksupport to us, or that engages in leasing, hedging or research and development arrangements with us. We have no off-balance sheet arrangements that webelieve may have a material current or future effect on our financial condition, liquidity or results of operations.
Commitments, Contingencies and Guarantees
For information regarding our commitments, contingencies and guarantees, see Note 4 in the Notes to the Consolidated Financial Statements.
Recent Accounting Pronouncements
See Note 1 in the Notes to the Consolidated Financial Statements for disclosure of recent accounting pronouncements and the potential impact on ourfinancial statements and disclosures.
Item 3. Quantitative and Qualitative Disclosures About Market RiskFor quantitative and qualitative disclosures about market risk affecting LII, see "Quantitative and Qualitative Disclosures About Market Risk" in Item
7A of Part II of our Annual Report on Form 10-K for the fiscal year ended December 31, 2019. Our exposure to market risk has not changed materiallysince December 31, 2019.
34
Item 4. Controls and Procedures
Disclosure Controls and Procedures
As required by Rule 13a-15 under the Exchange Act, we carried out an evaluation, under the supervision and with the participation of our currentmanagement, including our Chief Executive Officer and Chief Financial Officer, of the effectiveness of our disclosure controls and procedures as of the endof the period covered by this report. There are inherent limitations to the effectiveness of any system of disclosure controls and procedures, including thepossibility of human error and circumvention or overriding of the controls and procedures. Accordingly, even effective disclosure controls and procedurescan only provide reasonable assurance of achieving their control objectives. Based on that evaluation, the Chief Executive Officer and Chief FinancialOfficer have concluded that, as of September 30, 2020, our disclosure controls and procedures were effective to provide reasonable assurance thatinformation required to be disclosed by us in the reports we file or submit under the Exchange Act is recorded, processed, summarized and reported withinthe time periods specified in the applicable rules and forms, and that such information is accumulated and communicated to management, including ourChief Executive Officer and Chief Financial Officer, to allow timely decisions regarding required disclosure.
Changes in Internal Control Over Financial Reporting
There were no changes in our internal control over financial reporting that materially affected, or are reasonably likely to materially affect, our internalcontrol over financial reporting.
Part II - Other Information
Item 1. Legal Proceedings
We are involved in a number of claims and lawsuits incident to the operation of our businesses. Insurance coverages are maintained and estimated costsare recorded for such claims and lawsuits. It is management's opinion that none of these claims or lawsuits will have a material adverse effect, individuallyor in the aggregate, on our financial position, results of operations or cash flows.
Item 1A. Risk Factors
In addition to the other information set forth in this Quarterly Report on Form 10-Q, you should carefully consider the risk factors discussed in Part I,“Item 1A. Risk Factors” in our Annual Report on Form 10-K for the year ended December 31, 2019, which could materially affect our business, financialcondition or results of operations. There have been no material changes to our risk factors from those disclosed in our Annual Report on Form 10-K for theyear ended December 31, 2019 and in Form 10-Q for the quarter ended June 30, 2020.
35

Item 2. Unregistered Sales of Equity Securities and Use of ProceedsIn the third quarter of 2020, we purchased shares of our common stock as follows:
Total Number ofShares Purchased (1)
Average Price Paidper Share (including
fees)
Total Number of SharesPurchased As Part of
Publicly Announced Plans
Approximate Dollar Value ofShares that may yet be
Purchased under our ShareRepurchase Plans
(in millions)July 1 through July 25 2,198 $ 255.17 — $ 446.0 July 26 through August 21 11,052 $ 270.51 — $ 446.0 August 22 through September 30 3,188 $ 283.75 — $ 446.0
16,438 —
(1) These shares of common stock were surrendered to LII to satisfy employee tax-withholding obligations in connection with the exercise of long-termincentive awards.
36

Item 6. Exhibits
1.1 Underwriting Agreement, dated as of July 22, 2020, by and among the Company, the guarantors party thereto, and J.P. Morgan Securities LLCand Wells Fargo Securities, LLC, as representatives of the several underwriters named therein (filed as Exhibit 1.1 to LII’s Current Report onForm 8-K filed on July 30, 2020, and incorporated herein by reference).
3.1 Restated Certificate of Incorporation of Lennox International Inc. (“LII”) (filed as Exhibit 3.1 to LII’s Registration Statement on Form S-1(Registration Statement No. 333-75725) filed on April 6, 1999 and incorporated herein by reference).
3.2 Amended and Restated Bylaws of LII (filed as Exhibit 3.1 to LII’s Current Report on Form 8-K filed on December 16, 2013 and incorporatedherein by reference).
4.1 Specimen Stock Certificate for the Common Stock, par value $.01 per share, of LII (filed as Exhibit 4.1 to LII’s Amendment to RegistrationStatement on Form S-1/A (Registration No. 333-75725) filed on June 16, 1999 and incorporated herein by reference).
4.2 Indenture, dated as of May 3, 2010, between LII and U.S. Bank National Association, as trustee (filed as Exhibit 4.3 to LII’s Post-EffectiveAmendment No. 1 to Registration Statement on S-3 (Registration No. 333-155796) filed on May 3, 2010, and incorporated herein byreference).
4.3 Form of Supplemental Indenture among LII, the guarantors party thereto and U.S. Bank National Association, as trustee (filed as Exhibit 4.11to LII’s Post-Effective Amendment No. 1 to Registration Statement on S-3 (Registration No. 333-155796) filed on May 3, 2010, andincorporated herein by reference).
4.4 Sixth Supplemental Indenture, dated as of November 3, 2016, among LII, each other existing Guarantor under the Indenture, dated as of May3, 2010, as subsequently supplemented, and US Bank National Association, as trustee (filed as Exhibit 4.2 to LII’s Current Report on Form 8-K filed on November 3, 2016, and incorporated herein by reference).
4.5 Seventh Supplemental Indenture, dated as of January 23, 2019, among LII Mexico Holdings Ltd., Lennox International Inc., each otherexisting Guarantor under the Indenture, dated as of May 3, 2010, as subsequently supplemented, and US Bank National Association, as trustee(filed as Exhibit 2.5 to LII's Annual Report on Form 10-K filed on February 19, 2019 and incorporated herein by reference).
4.6 Form of 3.000% Notes due 2023 (filed as Exhibit A in Exhibit 4.2 to LII’s Current Report on Form 8-K filed on November 3, 2016, andincorporated herein by reference).
4.7 Eighth Supplemental Indenture, dated as of May 22, 2020, among Lennox Switzerland GmbH, Lennox International Inc., each other existingGuarantor under the Indenture, dated as of May 3, 2010, as subsequently supplemented, and US Bank National Association, as trustee (filedas Exhibit 4.7 to LII’s Quarterly Report on Form 10-Q filed on July 20, 2020, and incorporated herein by reference).
4.8 Ninth Supplemental Indenture, dated July 30, 2020, among LII, each existing Guarantor under the Indenture, dated as of May 3, 2010, assubsequently supplemented, and U.S. Bank National Association, as trustee (filed as Exhibit 4.2 to LII’s Current Report on Form 8-K filed onJuly 30, 2020, and incorporated herein by reference).
4.9 Form of 1.350% Notes due 2025 (filed as Exhibit A in Exhibit 4.2 to LII’s Current Report on Form 8-K filed on July 30, 2020, andincorporated herein by reference).
4.10 Form of 1.700% Notes due 2027 (filed as Exhibit B in Exhibit 4.2 to LII’s Current Report on Form 8-K filed on July 30, 2020, andincorporated herein by reference).
10.1 Seventh Amended and Restated Credit Facility Agreement, dated as of July 30, 2020, among Lennox International Inc., a Delawarecorporation, the Lenders party thereto, and JPMorgan Chase Bank, N.A., as Administrative Agent (filed as Exhibit 10.1 to LII’s CurrentReport on Form 8-K filed on July 30, 2020, and incorporated herein by reference).
22.1 List of Guarantor Subsidiaries31.1 Certification of the principal executive officer (filed herewith).31.2 Certification of the principal financial officer (filed herewith)32.1 Certification of the principal executive officer and the principal financial officer pursuant to 18 U.S.C. Section 1350 (furnished herewith).101 INS XBRL Instance Document. The instance document does not appear in the Interactive Data File because its XBRL tags are embedded
within the Inline XBRL document.101 SCH Inline XBRL Taxonomy Extension Schema Document101 CAL Inline XBRL Taxonomy Extension Calculation Linkbase Document101 LAB Inline XBRL Taxonomy Extension Label Linkbase Document101 PRE Inline XBRL Taxonomy Extension Presentation Linkbase Document101 DEF Inline XBRL Taxonomy Extension Definition Linkbase Document104 Cover Page Interactive Data File (formatted as inline XBRL and contained in Exhibit 101)
37

38

SIGNATURE
Pursuant to the requirements of the Securities Exchange Act of 1934, the registrant has duly caused this report to be signed on its behalf by theundersigned, thereunto duly authorized.
LENNOX INTERNATIONAL INC.
By: /s/ Joseph W. ReitmeierJoseph W. ReitmeierChief Financial Officer(on behalf of registrant and as principal financial officer)
Date: October 19, 2020
39

Exhibit 22.1
List of Guarantor Subsidiaries
The following subsidiaries of Lennox International Inc. (the “Company”) are guarantors with respect to the Company’s 3.00%Notes due 2023:
Guarantor State or Other Jurisdiction of FormationAdvanced Distributor Products LLC DelawareAllied Air Enterprises LLC DelawareHeatcraft Inc. DelawareHeatcraft Refrigeration Products LLC DelawareLennox Global LLC DelawareLennox Industries Inc. DelawareLennox National Account Services LLC FloridaLGL Australia (US) Inc. DelawareLGL Europe Holding Co. DelawareLennox Switzerland GmbH Switzerland

Exhibit 31.1
CERTIFICATION
I, Todd M. Bluedorn, certify that:
1. I have reviewed this quarterly report on Form 10-Q of Lennox International Inc.;
2. Based on my knowledge, this report does not contain any untrue statement of a material fact or omit to state a material fact necessary to make thestatements made, in light of the circumstances under which such statements were made, not misleading with respect to the period covered by thisreport;
3. Based on my knowledge, the financial statements, and other financial information included in this report, fairly present in all material respects thefinancial condition, results of operations and cash flows of the registrant as of, and for, the periods presented in this report;
4. The registrant’s other certifying officer(s) and I are responsible for establishing and maintaining disclosure controls and procedures (as defined inExchange Act Rules 13a-15(e) and 15d-15(e)) and internal control over financial reporting (as defined in Exchange Act Rules 13a-15(f) and 15d-15(f)) for the registrant and have:
(a) Designed such disclosure controls and procedures, or caused such disclosure controls and procedures to be designed under our supervision, toensure that material information relating to the registrant, including its consolidated subsidiaries, is made known to us by others within thoseentities, particularly during the period in which this report is being prepared;
(b) Designed such internal control over financial reporting, or caused such internal control over financial reporting to be designed under oursupervision, to provide reasonable assurance regarding the reliability of financial reporting and the preparation of financial statements forexternal purposes in accordance with generally accepted accounting principles;
(c) Evaluated the effectiveness of the registrant’s disclosure controls and procedures and presented in this report our conclusions about theeffectiveness of the disclosure controls and procedures, as of the end of the period covered by this report based on such evaluation; and
(d) Disclosed in this report any change in the registrant’s internal control over financial reporting that occurred during the registrant’s most recentfiscal quarter (the registrant’s fourth fiscal quarter in the case of an annual report) that has materially affected, or is reasonably likely tomaterially affect, the registrant’s internal control over financial reporting; and
5. The registrant’s other certifying officer(s) and I have disclosed, based on our most recent evaluation of internal control over financial reporting, tothe registrant’s auditors and the audit committee of the registrant’s board of directors (or persons performing the equivalent functions):
(a) All significant deficiencies and material weaknesses in the design or operation of internal control over financial reporting which arereasonably likely to adversely affect the registrant’s ability to record, process, summarize and report financial information; and
(b) Any fraud, whether or not material, that involves management or other employees who have a significant role in the registrant’s internalcontrol over financial reporting.
Date: October 19, 2020
/s/ Todd M. BluedornTodd M. BluedornChief Executive Officer
Exhibit 31.2
CERTIFICATION
I, Joseph W. Reitmeier, certify that:
1. I have reviewed this quarterly report on Form 10-Q of Lennox International Inc.;
2. Based on my knowledge, this report does not contain any untrue statement of a material fact or omit to state a material fact necessary to make thestatements made, in light of the circumstances under which such statements were made, not misleading with respect to the period covered by thisreport;
3. Based on my knowledge, the financial statements, and other financial information included in this report, fairly present in all material respects thefinancial condition, results of operations and cash flows of the registrant as of, and for, the periods presented in this report;
4. The registrant’s other certifying officer(s) and I are responsible for establishing and maintaining disclosure controls and procedures (as defined inExchange Act Rules 13a-15(e) and 15d-15(e)) and internal control over financial reporting (as defined in Exchange Act Rules 13a-15(f) and 15d-15(f)) for the registrant and have:
(a) Designed such disclosure controls and procedures, or caused such disclosure controls and procedures to be designed under oursupervision, to ensure that material information relating to the registrant, including its consolidated subsidiaries, is made known to us byothers within those entities, particularly during the period in which this report is being prepared;
(b) Designed such internal control over financial reporting, or caused such internal control over financial reporting to be designed under oursupervision, to provide reasonable assurance regarding the reliability of financial reporting and the preparation of financial statements forexternal purposes in accordance with generally accepted accounting principles;
(c) Evaluated the effectiveness of the registrant’s disclosure controls and procedures and presented in this report our conclusions about theeffectiveness of the disclosure controls and procedures, as of the end of the period covered by this report based on such evaluation; and
(d) Disclosed in this report any change in the registrant’s internal control over financial reporting that occurred during the registrant’s mostrecent fiscal quarter (the registrant’s fourth fiscal quarter in the case of an annual report) that has materially affected, or is reasonablylikely to materially affect, the registrant’s internal control over financial reporting; and
5. The registrant’s other certifying officer(s) and I have disclosed, based on our most recent evaluation of internal control over financial reporting, tothe registrant’s auditors and the audit committee of the registrant’s board of directors (or persons performing the equivalent functions):
(a) All significant deficiencies and material weaknesses in the design or operation of internal control over financial reporting which arereasonably likely to adversely affect the registrant’s ability to record, process, summarize and report financial information; and
(b) Any fraud, whether or not material, that involves management or other employees who have a significant role in the registrant’s internalcontrol over financial reporting.
Date: October 19, 2020
/s/ Joseph W. ReitmeierJoseph W. ReitmeierChief Financial Officer
Exhibit 32.1
CERTIFICATION PURSUANT TO18 U.S.C. SECTION 1350,
AS ADOPTED PURSUANT TOSECTION 906 OF THE SARBANES-OXLEY ACT OF 2002
In connection with the Quarterly Report of Lennox International Inc. (the “Company”) on Form 10-Q for the quarter ended September 30, 2020 asfiled with the Securities and Exchange Commission on the date hereof (the “Report”), each of the undersigned, Todd M. Bluedorn, Chief Executive Officerof the Company, and Joseph W. Reitmeier, Chief Financial Officer of the Company, certifies, pursuant to 18 U.S.C. Section 1350, as adopted pursuant tosection 906 of the Sarbanes-Oxley Act of 2002, that to his or her knowledge:
(1) The Report fully complies with the requirements of Section 13(a) or 15(d) of the Securities Exchange Act of 1934; and
(2) The information contained in the Report fairly presents, in all material respects, the financial condition and results of operations of the Company.
/s/ Todd M. BluedornTodd M. BluedornChief Executive Officer
October 19, 2020
/s/ Joseph W. ReitmeierJoseph W. ReitmeierChief Financial Officer
October 19, 2020
A signed original of this written statement has been provided to the Company and will be retained by the Company and furnished to the Securitiesand Exchange Commission or its staff upon request. The foregoing certification is being furnished to the Securities and Exchange Commission as anexhibit to the report.