ky risk assessment guidance finalwaste.ky.gov/sfb/documents/ky risk assessment guidance _final_.pdf1...
TRANSCRIPT
Kentucky Risk Assessment Guidance
June 8, 2002
Natural Resources and
Environmental Protection Cabinet

1
Section 1. Introduction
Risk assessment is a formalized process for evaluating the potential human health and
ecological impacts based on the concentration of, exposure to, and toxicity of environmental
contaminants. Risk assessment has been used in environmental decision-making since the
process was outlined in a publication by the National Research Council – National Academy of
Sciences (1983) Red Book. The United States Environmental Protection Agency (U.S. EPA)
produced several guidance documents to assist in assessing risks (U.S. EPA, 1989; 1991).
Human health risk assessment, as outlined, is a four-part process. The first step, Data
Collection and Evaluation, assesses the available data and identifies chemicals of potential
concern (COPCs). The next part, Exposure Assessment, identifies potential receptors and
calculates their exposure to the COPCs. Toxicity Assessment, the third process, quantifies the
toxicity of the COPCs for carcinogenic and noncarcinogenic effects. The final step, Risk
Characterization, is the calculation of the potential effects on the receptors identified in the
Exposure Assessment, based on the toxicity of the chemicals identified in the Data Collection
and Evaluation step.
Risk assessment procedures are used in several stages of site assessment and closure.
During site scoping Preliminary Remediation Goals may be used to determine preferred
detection limits and to screen initial data to focus on areas of concern. Data from Site
Characterization are often screened against target risk-based concentrations (Preliminary
Remediation Goals) to identify whether a baseline risk assessment or further evaluation is
needed and, if so, which chemicals should be further assessed. Risk assessment is also used in
setting remedial goals, and as an exit criterion for closure of remediation activities. Risk
assessment is used as part of activities related to the Resource Conservation and Recovery Act
(RCRA), Comprehensive Environmental Response, Compensation, and Liability Act
(CERCLA), Clean Water Act, and Clean Air Act.
This document details the application of risk assessment to environmental remediation.
The document can be used to determine if site conditions are protective of human health and the
environment, or that risks are reduced to acceptable levels through removal of contaminants or
management. The risk-based procedures for the program are based on a tiered approach
allowing for screening against default risk-based screening values in lower tiers and
incorporating more site-related data in the higher tiers.
2
This document outlines the procedures for:
1. Comparing site data against risk-based screening values.
2. Preparing a baseline risk assessment to determine protectiveness of human health and
the environment.
3. Evaluating when an ecological assessment is necessary
4. Evaluating when to compare site soil data to Soil Screening Levels for protection of
groundwater.
5. Selecting remedial cleanup goals.
The following sections describe the process of evaluating the site data that were collected
during the site characterization. The data must be representative and complete. If statistical
procedures are used, a sufficient number of samples should be collected to meet the needs of
those statistical tests. Human health risk assessment is described in Section 2.0. The subsections
within Section 2.0 describe the application of risk assessment to the processes of environmental
assessment and remediation including: tiered risk assessment, groundwater evaluation, risk
management, selection of remedial goals, and presenting the results of the two tiers of risk
assessment. Section 3.0 details the ecological risk assessment procedures.
Section 2. Human Health Risk Assessment
This section provides methods for screening environmental data to identify Contaminants
of Concern, performing screening and baseline risk assessment, evaluating groundwater,
managing risks, and selecting remedial goals. Figures 1 and 2 outline the process for risk-based
procedures for residential and commercial/industrial scenarios in environmental remediation.
The remedial options listed in Figures 1 and 2 are those listed in KRS 224.01-400 (18)-(21).

3
Figure 1. Flowchart for Residential Cleanup Options
Tier I - Screening Risk AssessmentAnalytical Data (Separated by Media
Calculate mean and Exposure Concentration foreach chemical
Is mean concentration less than 95% UCL ofarithmetic mean of background, 1/2 of values below
60th percentile, and no detection about 95thpercentile?
Is chemical detected in less than 10% of samples?
Is contaminant level less than applicable standards?
Is Exposure Concentration less than 1/10th of theresidential screening value?
Chemical a Contaminant of Concern (COC)
Compute carcinogenic and noncarcinogenicscreening indices for identified COCs
SI (carcinogen) less than or equal to 1.0E-6AND
SI (noncarcinogen) less than or equal to 1.0
SI can be brought below target risk through removalof hazardous substances or petroleum
Reduction or elimination of pathway?
Tier II - Risk AssessmentDevelop baseline or site-specific risk assessment and
cleanup goalsOptions A, B, C or combination
Option B: Management. Propertyapproved for residential use with
appropriate institutional andengineering controls
Option C: Restoration. Propertyapproved for residential use
Option A: No Action Necessary.Property approved for residential use
Is any detected valuegreater than 10 times
the residentialscreening value?
Remove chemical fromfurther consideration
No
No
No
No
Yes
Yes
Yes
Yes
Yes
Yes
Yes
Yes
No
No
No
No
4
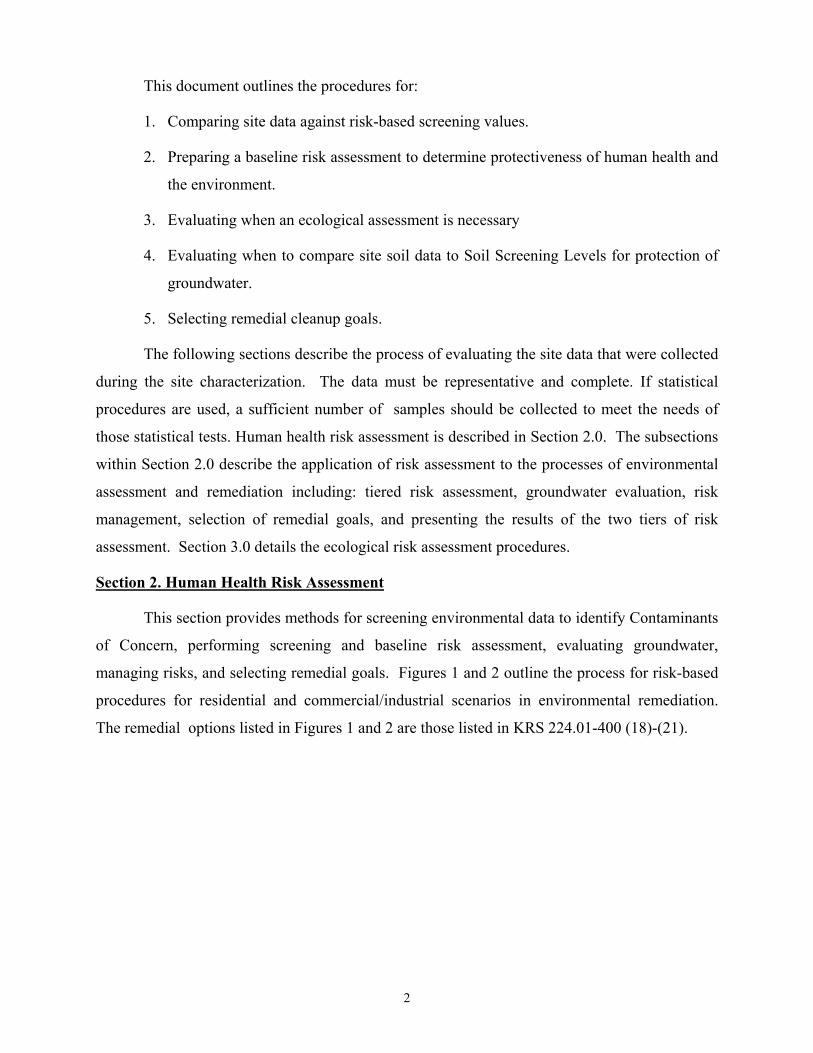
Figure 2. Flowchart for Commerical/Industrial Cleanup Options
Tier I - Screening Risk AssessmentAnalytical Data (Separated by Media
Calculate mean and Exposure Concentration foreach chemical
Is mean concentration less than 95% UCL ofarithmetic mean of background, 1/2 of values below
60th percentile, and no detection about 95thpercentile?
Is chemical detected in less than 10% of samples?
Is contaminant level less than applicable standards?
Is Exposure Concentration less than 1/10th of thecommercial/industrial screening value?
Chemical a Contaminant of Concern (COC)
Compute carcinogenic and noncarcinogenicscreening indices for identified COCs
SI (carcinogen) less than or equal to 1.0E-6AND
SI (noncarcinogen) less than or equal to 1.0
SI can be brought below target risk through removalof hazardous substances or petroleum or
management of exposure pathways
Tier II - Risk AssessmentDevelop baseline or site-specific risk assessment and
cleanup goalsOptions will vary
Option B: Management. Propertyapproved for commercial/industrial use
with appropriate engineering andinstitutional and controls
Option B: Management in Place.Property approved for commercial/
industrial use with appropriateinstitutional controls
Is any detected valuegreater than 10 times the
commercial/industrialscreening value?
Remove chemical fromfurther consideration
No
No
No
No
Yes
Yes
Yes
Yes
Yes
Yes
Yes
No
No
No
5
Section 2.1. Tier I. Human Health Risk-Based Screening
This initial tier identifies which contaminants contribute significantly to the risks associated
with the property and calculates the cumulative risk for all Contaminants of Concern (COCs).
For this guidance, hazardous substance or petroleum shall have the meaning as defined in KRS
224.01-512. The screening-level risk assessment should be completed for residential land use as
a baseline, and commercial or industrial land use if commercial or industrial use is part of the
management plan. The following steps should be followed when completing a screening-level
risk assessment for human health.
1. Segregate analytical data by medium. Further segregate soil data into surface (0-1 foot
depth) and subsurface (greater than one foot depth).
2. Calculate 95% Upper Confidence Limit (UCL) of the arithmetic mean as described in U.S.
EPA, 1992 (Supplemental Guidance to RAGS: Calculating the Concentration Term). Use all
samples of the property and site(s). Use one-half of the detection limit for non-detect sample
results. The Exposure Concentration shall be the lower of the 95% UCL of the arithmetic
mean and the maximum detected value for that medium (and horizon, for soil). Calculate the
mean of the site data for inorganic compounds in addition to the 95% UCL.
3. Compare the Exposure Concentration to 1/10th of the residential or commercial/industrial
screening value, as appropriate. When screening, use the Total Chromium value for
chromium, use carcinogenic effects for arsenic, and use Toxicity Equivalency Factors (TEFs)
to calculate a Toxicity Equivalency Quotient (TEQ) for dioxins. Instead of 1/10th of the
screening value for lead, use the Kentucky Lead Action Level of 50 mg/kg for soils for
residential, and 400 mg/kg for commercial/industrial soils. Appendix E contains the KY
Radiological Risk-Based Preliminary Remediation Goals, if applicable. Compare the
Exposure Concentration to the following standards when applicable: Maximum Contaminant
Levels (MCLs) for surface and ground water (401 KAR 8:250, 401 KAR 8:300, 401 KAR
8:400, 401 KAR 8:420), National Ambient Air Quality Standards (NAAQS) for air, and
Surface Water Standards (401 KAR 5:031) for surface water.
4. Calculate the frequency of detection of the hazardous substance or petroleum constituent.
Identify those compounds that are detected in at least 10 percent of the samples. If there is
any detection above ten times the residential or commercial/industrial screening value, as
6
appropriate, then the hazardous substance or petroleum should remain a Contaminant of
Concern (COC) regardless of the frequency of detection.
5. Compare the mean of the site data to the 95% UCL of background for inorganics. The
background value shall be the generic statewide background number listed on Table G-2 in
Appendix G, or site-specific background may be determined using the methods described in
401 KAR 100:100 Section 7 (6). In addition to the site mean being less that the 95% UCL of
background, at least half of the samples should fall below the 60th percentile on Table G-2 or
site-specific background, and no sample should exceed the 95th percentile listed on Table G-2
or site-specific background. The cabinet may approve other statistical methods proposed by
the VERP applicant or party.
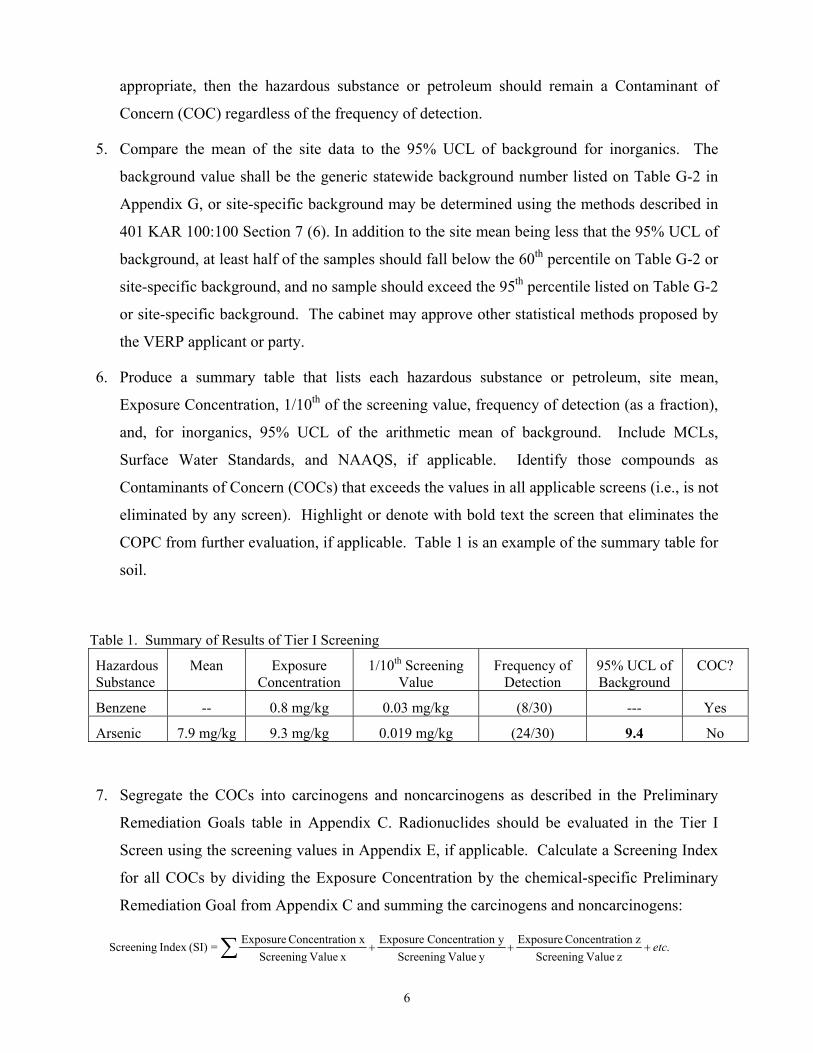
6. Produce a summary table that lists each hazardous substance or petroleum, site mean,
Exposure Concentration, 1/10th of the screening value, frequency of detection (as a fraction),
and, for inorganics, 95% UCL of the arithmetic mean of background. Include MCLs,
Surface Water Standards, and NAAQS, if applicable. Identify those compounds as
Contaminants of Concern (COCs) that exceeds the values in all applicable screens (i.e., is not
eliminated by any screen). Highlight or denote with bold text the screen that eliminates the
COPC from further evaluation, if applicable. Table 1 is an example of the summary table for
soil.
Table 1. Summary of Results of Tier I Screening
Hazardous Substance
Mean Exposure Concentration
1/10th Screening Value
Frequency of Detection
95% UCL of Background
COC?
Benzene -- 0.8 mg/kg 0.03 mg/kg (8/30) --- Yes
Arsenic 7.9 mg/kg 9.3 mg/kg 0.019 mg/kg (24/30) 9.4 No
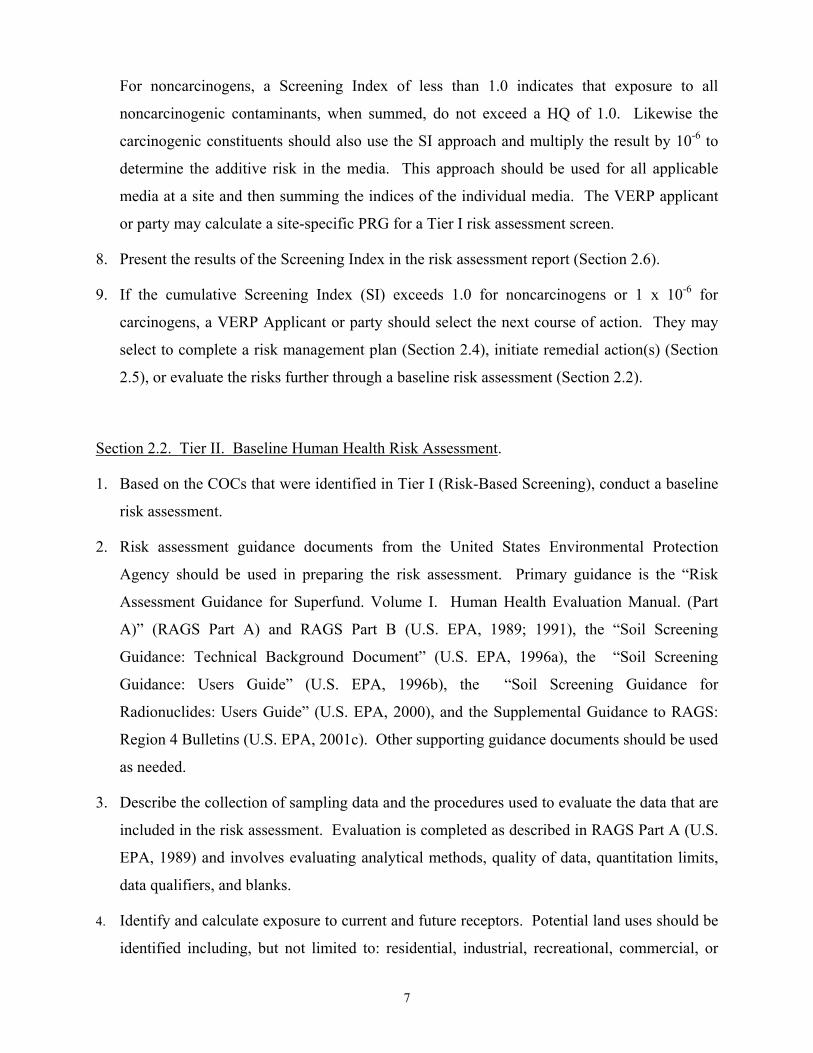
7. Segregate the COCs into carcinogens and noncarcinogens as described in the Preliminary
Remediation Goals table in Appendix C. Radionuclides should be evaluated in the Tier I
Screen using the screening values in Appendix E, if applicable. Calculate a Screening Index
for all COCs by dividing the Exposure Concentration by the chemical-specific Preliminary
Remediation Goal from Appendix C and summing the carcinogens and noncarcinogens:
.z Value Screening
zion Concentrat Exposurey Value Screening
yion ConcentratExposure xValue Screeningion xConcentrat Exposure=(SI)Index Screening etc+++∑
7
For noncarcinogens, a Screening Index of less than 1.0 indicates that exposure to all
noncarcinogenic contaminants, when summed, do not exceed a HQ of 1.0. Likewise the
carcinogenic constituents should also use the SI approach and multiply the result by 10-6 to
determine the additive risk in the media. This approach should be used for all applicable
media at a site and then summing the indices of the individual media. The VERP applicant
or party may calculate a site-specific PRG for a Tier I risk assessment screen.
8. Present the results of the Screening Index in the risk assessment report (Section 2.6).
9. If the cumulative Screening Index (SI) exceeds 1.0 for noncarcinogens or 1 x 10⁻⁶ for
carcinogens, a VERP Applicant or party should select the next course of action. They may
select to complete a risk management plan (Section 2.4), initiate remedial action(s) (Section
2.5), or evaluate the risks further through a baseline risk assessment (Section 2.2).
Section 2.2. Tier II. Baseline Human Health Risk Assessment.
1. Based on the COCs that were identified in Tier I (Risk-Based Screening), conduct a baseline
risk assessment.
2. Risk assessment guidance documents from the United States Environmental Protection
Agency should be used in preparing the risk assessment. Primary guidance is the “Risk
Assessment Guidance for Superfund. Volume I. Human Health Evaluation Manual. (Part
A)” (RAGS Part A) and RAGS Part B (U.S. EPA, 1989; 1991), the “Soil Screening
Guidance: Technical Background Document” (U.S. EPA, 1996a), the “Soil Screening
Guidance: Users Guide” (U.S. EPA, 1996b), the “Soil Screening Guidance for
Radionuclides: Users Guide” (U.S. EPA, 2000), and the Supplemental Guidance to RAGS:
Region 4 Bulletins (U.S. EPA, 2001c). Other supporting guidance documents should be used
as needed.
3. Describe the collection of sampling data and the procedures used to evaluate the data that are
included in the risk assessment. Evaluation is completed as described in RAGS Part A (U.S.
EPA, 1989) and involves evaluating analytical methods, quality of data, quantitation limits,
data qualifiers, and blanks.
4. Identify and calculate exposure to current and future receptors. Potential land uses should be
identified including, but not limited to: residential, industrial, recreational, commercial, or
8
agricultural. The baseline risk assessment should address all current and potential future
receptors including trespassers and residents. Exposure factors for common receptors are
listed in Appendix A. Site-specific factors may be used, subject to cabinet approval. The
factors and the rationale for their use should be documented in the risk assessment report.
5. Describe the toxicity of the COCs that were identified in Section 2.1. List the toxicity values
that are associated with the COCs. The hierarchy for sources of toxicity values is: (1) U.S.
EPA’s Integrated Risk Information System (IRIS), (2) U.S. EPA’s Health Effects
Assessment Summary Tables (HEAST), (3) provisional values from U.S. EPA’s National
Center for Environmental Assessment (NCEA), and (4) Other sources. Other sources may
include Agency for Toxic Substances and Disease Registry (ATSDR) Toxicological Profiles,
World Health Organization (WHO) documents, publications in the primary toxicological
literature, or values withdrawn from IRIS or HEAST, with cabinet approval.
6. Calculate the risks associated with the receptors that were identified in Step 4.
7. Identify and describe the uncertainties associated with the risk assessment. Potential sources
of uncertainty include COC selection, range of values for exposure parameters,
characterization of the site, and interaction between chemicals (additivity, synergism).
Uncertainty analysis is further discussed in RAGS Part A (U.S. EPA, 1989).
Section 2.3. Groundwater Evaluation.
Groundwater data from monitoring wells are evaluated in Tier I and II risk evaluations.
Recoverable water from soil borings can also be evaluated with groundwater numbers
(Preliminary Remediation Goals, MCLs) as described in Section 2.1 and 2.2. If no groundwater
monitoring data are available, or data are not adequate, then compare Exposure Concentration(s)
for soil to the Soil Screening Level(s) from the Preliminary Remediation Goals table in
Appendix C as described in 401 KAR 100:100 Section 5 (5). Radionuclides should be evaluated
using the Soil Screening Levels in Appendix E, if applicable.
If the bottom two sampling intervals in the soil boring do not exceed the SSL, modified
SSL, site-specific SSL, or subsurface background, then further groundwater evaluation of soil as
a potential source for groundwater contamination is not necessary. If soil concentrations in the
bottom two sampling intervals of the soil boring do exceed the Soil Screening Level, Modified
SSLs, or site-specific SSLs for protection of groundwater resources, and subsurface background,
then this indicates a need to manage for migration of contaminants to groundwater or for a

9
groundwater investigation. Submit a plan to assess and protect groundwater or provide site-
specific information that contamination doesn’t pose a threat to groundwater.
Identify if the site is in an area where contamination of a karst aquifer is possible, or the
contaminant(s) could result in a dense non-aqueous phase liquid (DNAPL) layer, or any other
circumstances exist that would indicate a higher potential for contamination of groundwater. If
such conditions exist, submit a plan for groundwater assessment and protection.
Section 2.4. Management of Risks.
1. Property Use. Management of risks can be accomplished by ensuring that a property is only
used by a certain receptor. For example, a property that meets criteria for commercial or
industrial use, but not residential, must remain commercial or industrial. Alternate land uses
can be evaluated by using commercial/industrial screening values in place of the residential
screening values that were used in Section 2.1, or in a baseline risk assessment.
2. Physical and Institutional Controls. Management of risks can be accomplished if exposure to
contaminated media is controlled using a combination of soil cover, restrictive covenants, dig
restrictions, fencing, or other approved methods.
3. Submit Corrective Action Plan for approval as described in 401 KAR 100:100 Section 8.
Section 2.5. Selection of Remedial Goals.
1. The primary goals of remediation is protection of human health at the hazard index of 1.0
and the carcinogenic risk of 1 x 10⁻⁶ at the point of exposure, and protection of ecological
health. Ecological risks are addressed in Section 3.0.
2. The primary goals of remediation do not excuse compliance with other applicable standards,
such as the National Ambient Air Quality Standards and the surface water standards.
3. The intended use must be ensured through physical and institutional controls and described
in the Corrective Action Plan. The risk-based Preliminary Remediation Goals are found in
the Appendix C table or derived based on approved receptor-specific values. Remedial goals

10
for radionuclides will be developed on a site-specific basis in consultation with the Kentucky
Cabinet for Health Services. Generic inorganic background values are listed in Appendix G
or may be derived using the guidance in 401 KAR 100:100 Section 7 (6).
4. The applicable risk-based remedial goals for surface soils are the residential and
commercial/industrial soil numbers in the Appendix C Preliminary Remediation Goals table
or those calculated based on approved receptor-specific values. Appendix E contains the
risk-based concentrations for radionuclides, if applicable. The remedial goal for certain
organic chemicals may be based on site-specific concentrations if it can be demonstrated to
the cabinet that concentrations are the result of natural sources or are a by-product of
combustion of fuels and not the result of activities on the property or site. For subsurface
soils, a VERP applicant or party may select ten times the surface soil risk-based
concentrations as an initial remedial goal with implementation of the institutional and
physical controls and should not be a source of groundwater contamination. If contaminants
are in the surface soil horizon, this can be attained through the use of cover (6 inches of
pavement (e.g., asphalt or concrete), 12 inches of soil, or other approved method). For
example, if the commercial/industrial soil number is 1.3 mg/kg on the risk-based PRGs table
in Appendix C, and the contamination is more than a foot below the surface or is covered
with a foot of clean soil, then the concentration that is left in place can be 13 mg/kg and the
use of the site would need to be restricted to commercial or industrial use with the soil cover
maintained in place.
Section 2.6. Human Health Risk Assessment Report Format.
The risk assessment results should be presented as part of the environmental remediation process
wherever risk assessment is used for environmental decision-making. This may be included as
part of the site characterization report, corrective action completion report, in an appendix to
those reports, or as a separate document.
1. Screening. The screening report should consist of a brief description of the property, site
characterization activities, a summary of the analytical data along with the statistical
calculations of the 95% UCL, the summary table as described in Section 2.1 6., and results of
the Screening Index.
11
2. Baseline Risk Assessment. The baseline risk assessment report should follow the general
outline shown in Appendix B. A copy of the screening risk assessment may be included with
the baseline risk assessment to provide information that was used in the baseline risk
assessment (selection of COCs, calculation of 95% UCL).
Section 3.0 Ecological Risk Assessment
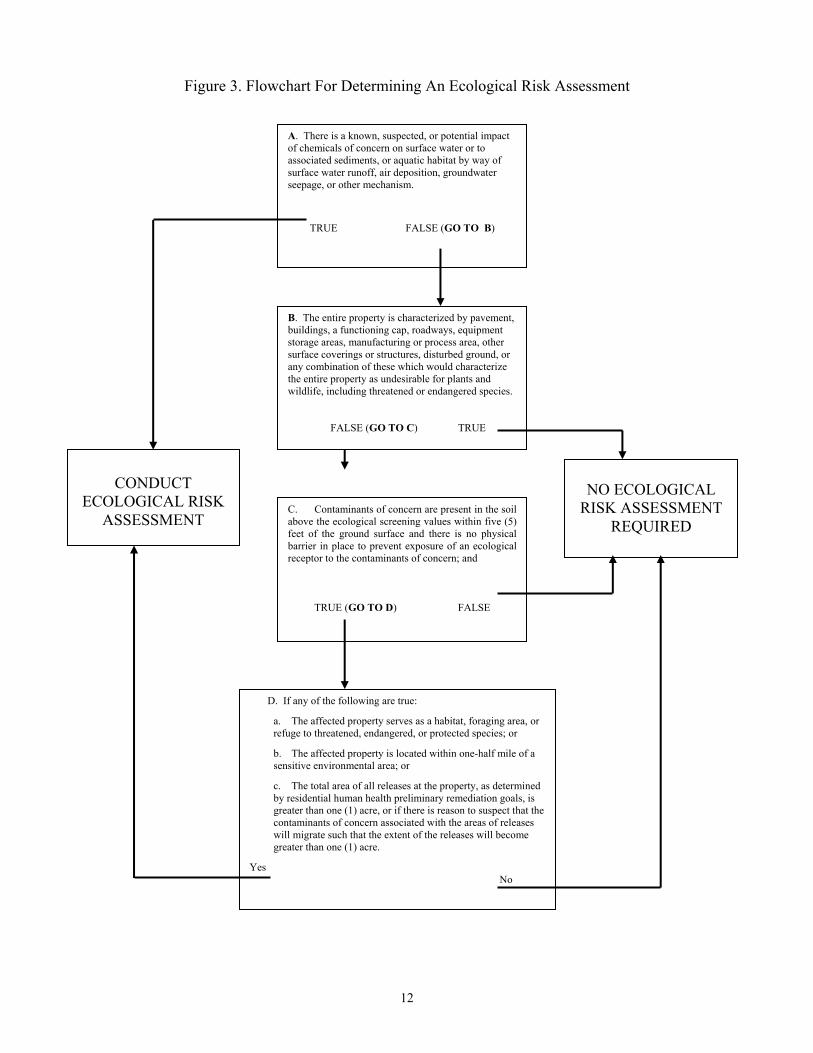
If it has been determined that an Ecological Risk Assessment (ERA) needs to be conducted (401
KAR 100:100 Section 5 (8)), this document provides the outline for that process. The flowchart
in Figure 3 is the process for determining if an ERA needs to be conducted. The checklist in
Appendix F can be used to identify features of the environmental setting that are related to
ecological receptors.
The phrase “ecological risk assessment” refers to a qualitative and/or quantitative
appraisal of the actual or potential impacts from a hazardous compound or physical stressor on
plants and animals. Documents from various federal programs (Simini et. al., 2000; USEPA
1993; USEPA 1997a; USEPA 1998) were consulted in the process of developing this document
and the procedures used in calculating risk-based concentrations. Figure 4 outlines the process
of the ERA.
12
Figure 3. Flowchart For Determining An Ecological Risk Assessment
A. There is a known, suspected, or potential impact of chemicals of concern on surface water or to associated sediments, or aquatic habitat by way of surface water runoff, air deposition, groundwater seepage, or other mechanism.
TRUE FALSE (GO TO B)
B. The entire property is characterized by pavement, buildings, a functioning cap, roadways, equipment storage areas, manufacturing or process area, other surface coverings or structures, disturbed ground, or any combination of these which would characterize the entire property as undesirable for plants and wildlife, including threatened or endangered species.
FALSE (GO TO C) TRUE
C. Contaminants of concern are present in the soil above the ecological screening values within five (5) feet of the ground surface and there is no physical barrier in place to prevent exposure of an ecological receptor to the contaminants of concern; and
TRUE (GO TO D) FALSE
D. If any of the following are true:
a. The affected property serves as a habitat, foraging area, or refuge to threatened, endangered, or protected species; or
b. The affected property is located within one-half mile of a sensitive environmental area; or
c. The total area of all releases at the property, as determined by residential human health preliminary remediation goals, is greater than one (1) acre, or if there is reason to suspect that the contaminants of concern associated with the areas of releases will migrate such that the extent of the releases will become greater than one (1) acre.
Yes No
CONDUCT
ECOLOGICAL RISK ASSESSMENT
NO ECOLOGICAL
RISK ASSESSMENT REQUIRED
13
The ERA process is based on two major elements: characterization of effects and
characterization of exposure. These provide the focus for conducting the phases of risk
assessment: planning, problem formulation, analysis, risk characterization, and risk management.
a) Planning – The Planning phase involves the determination of level-of-effort necessary for the
ERA. ERA management goals and objectives are determined (i.e., what plant, animal, or
ecosystem is at risk and might need protection), the focus of the ERA is laid out, and the time
frame for the assessment is set.
b) Problem Formulation – The overall strategy for estimating risk at a site is developed in
Problem Formulation. During this phase, the Conceptual Site Model (CSM) is created, the
receptors potentially at risk are defined, and a plan is written that describes the data to be
analyzed and the process to be used to calculate risk.
c) Analysis – This component of the ERA consists of data collection, the technical evaluation of
the data, the calculation of the existing and potential exposures, and corresponding ecological
effects.
d) Risk Characterization – The likelihood and severity of the risk is evaluated for the
assessment endpoints, and the ERA’s uncertainty is described in the Risk Characterization.
A good description of the risk, including the level of adverse effects, is important for
interpreting the risk results.
e) Risk Management – In this component, the results of the ERA are integrated with other
considerations to make and justify remedial decisions. In a screening level ERA, the risk
management decision is whether a baseline ERA is needed.
Section 3.1. Tier 1. Screening-Level Ecological Risk Assessment.
The purpose of the screening-level risk assessment is to evaluate whether existing data
justify a decision that site contaminants do not pose a risk to ecological receptors or whether
additional evaluation is necessary. If no potential for risk is identified in a screening-level risk
assessment, then risk managers can confidently conclude that no further action is required at the
site. Tier 1 of ERA consists of two steps:
Step 1. Screening-Level Problem Formulation and Ecological Effects Evaluation.
Step 2. Screening-Level Preliminary Exposure Estimate and Risk Calculation.

14
Steps 1 and 2 of the ERA process contain the following elements:
• Site visit
• Screening-level problem formulation (preliminary Conceptual Site Model)
• Exposure pathways and endpoints
• Screening-level effects evaluation (toxicity threshold benchmarks)
• Screening-level exposure estimate (site concentration data)
• Screening-level risk calculation (site concentration data screens)
• Documentation
a) Preliminary Conceptual Site Model (CSM). As part of Tier 1, Step 1 of the ERA, use
available information to develop a preliminary CSM. Available information may include
observations made during site visits, historical documents, existing data, and professional
judgement of technical experts who are familiar with the site. The preliminary CSM should
describe the environmental setting of the individual site, the site’s immediate surroundings,
and the contaminants known to exist at the site. The preliminary CSM should identify fate
and transport mechanisms of contaminants potentially moving off-site, and briefly discuss
the ways that site contaminants act on likely receptors.
b) Exposure Pathways and Endpoints. Based on the preliminary CSM, the ecological risk
assessor should identify the potentially complete exposure pathways and endpoints for the
screening assessment. The exposure pathways and endpoints for the site specify which
ecological effects data are required. The screening-level effects data are screening-level
benchmarks and concentrations of substances in the abiotic media (e.g., soil, air or water). If
groundwater potentially discharges to surface water, groundwater concentrations are
compared to surface water screening benchmarks.
c) Identify Chemicals of Potential Concern. As part of Tier 1, Step 2, determine (COPCs) by
eliminating COPCs from further evaluation:
• Background Comparisons. Compare the mean concentration for inorganic constituents
on-site against the 95% UCL of the mean concentrations of background for inorganic

15
constituents. At least ½ of the data points should be less than the 60th percentile, and no
data point above the 95th percentile. Generic inorganic background values are listed in
Appendix G or may be derived in accordance with 401 KAR 100:100 Section 7 (6).
• Screening Table Comparison. Compare the lesser of the maximum concentration or 95%
UCL on site for substances in a given exposure medium to the screening-level
benchmarks (Appendix D) for those substances. Compare site concentrations to
screening-level benchmarks for surface soil, sediment, surface water, and groundwater (if
site conditions will potentially result in exposure to ecological receptors).
d) Retaining Chemicals of Concern. If any constituent in an abiotic medium to which
organisms are potentially exposed is present at a concentration exceeding screening-level
benchmark and ambient background or if there is not a screening-level benchmark, then
further evaluation of the potential risk will be required. Chemicals with known synergistic
effects or that bioaccumulate will be retained as COPCs. If existing data does not have
adequate detection limits (i.e., detection limits above screening benchmarks) new data must
be collected to replace it.
e) Documentation. The documentation of Steps 1 and 2 should include the following:
• Brief habitat description, and map;
• Preliminary CSM;
• Tables of screening results;
• List of wildlife species actually or potentially occurring at the site, including threatened
and endangered plant and animal species;
• Discussion of uncertainties. The discussion of the uncertainties should identify
constituents for which there are no screening-level benchmarks or analytical chemistry
data.
At the end of Tier 1, the decision whether to collect additional data for screening, to proceed
with the ERA, or to take no further action can be documented in the report.
16
Section 3.2. Tier 2 Baseline Ecological Risk Assessment
The baseline ecological risk assessment is a continuation of the screening ERA. It
consists of 6 steps:
Step 3. Baseline Risk Assessment Problem Formulation
Step 4. Study Design and Data Quality Objectives
Step 5. Field Verification of Sampling Design
Step 6. Site Investigation and Analysis of Exposure and Effects
Step 7. Risk Characterization
Step 8. Risk Management
a) Step 3. Baseline Risk Assessment Problem Formulation. The Baseline Risk Assessment
Problem Formulation should provide sufficient information to support a risk management
decision concerning the need for additional evaluation of ecological risk. Further evaluation
may mean site-specific ecological investigation at the site. This will require a work plan,
documenting Step 4 of the process, and describing how the data will be used in Step 7 to
make a remedial decision for the site. Important inputs to this decision are:
• Site concentration data;
• Conceptual Site Model;
• Habitat Description;
• Preliminary Hazard Quotients. The Hazard Quotient should be calculated for COPCs
using toxicity values from current literature and intake factors from the Wildlife
Exposure Factors Handbook (USEPA 1993) for the species listed below. A Hazard
Quotient is calculated by dividing the site concentration (the lessor of the 95% UCL of
the mean or maximum) by the No-Observed Adverse Effect Level (NOAEL). If the
Hazard Quotient is above 1.0, that compound continues through the baseline ERA.
For terrestrial habitats, receptors must include (1) earthworm (Lumbricus
terrestris), (2) short-tailed shrew (Blarina brevicauda), (3) long-tailed weasel (Mustela
frenata), (4) meadow vole (Microtus pennsylvanicus) or prairie vole (Microtus
ochrogaster), and (5) American woodcock (Scolopax minor). For aquatic habitats,
receptors must include; mink (Mustela vison) little brown bat (Myotis lucifugus), and
belted kingfisher (Cerlye alcyon). The above list of species should not be considered
exclusive. If there are other species on site that exposure factors, intake rates, and
17
toxicity values are known, those species should be included in the ERA. Species that are
on the Federal and/or State Threatened or Endangered Species List and either known to
have been on or in the vicinity of the site or if the site contains habitat known to support
those species, then they should also be included in the ERA.
• The identification of COPCs that warrant further evaluation.
• An understanding of the effects of COPCs on ecological receptors (including toxicity
reference values).
• The identification of complete exposure pathways by which COPCs are brought into
contact with ecological receptors (include bioaccumulation factors and ingestion rates for
wildlife receptors).
• The identification of assessment endpoints (e.g., protection of fish eating birds from
eggshell thinning due to DDT exposure) and measurement endpoints (e.g., natural
population structure, feeding, resting, and reproductive cycles).
• Discussion of uncertainties should include the lack of site concentration or toxicity data
for COPCs.
b) In Step 4, the process identifies the study design and data quality objectives (DQOs) for the
site investigation. The work plan (WP) and the sampling and analysis plan (SAP) are the
primary products of Step 4. The WP and SAP must specify the study design in sufficient
detail to evaluate its adequacy for collecting the data necessary to answer the risk questions.
The WP or SAP should include the following:
• The number and location of samples of each medium for each purpose
• The comparison of analytical detection limits and threshold concentrations
• The full description of toxicity tests and population/community study designs
• A description of how the results of site investigations will be used in the risk
characterization (Step 7) to answer risk questions.
c) In Step 5, the Verification of Field Sampling Design process evaluates the probability of
successfully completing the study as designed. The WP or SAP should describe the methods
for verifying the study design. The verification process and any remaining uncertainties

18
about the study design should be discussed when the results of the site investigation are
reported.
d) Step 6, the Site Investigation and Data Analysis, is the implementation of the site
investigation designed in Step 4 and verified in Step 5. Approved alterations in the work
plan should be documented in the report containing the risk characterization (i.e., the baseline
risk report).
e) Risk Characterization (Step 7) is conducted after data collected during the site investigation
have been analyzed. The risk characterization evaluates the exposure and effects data to
assess the risk to the assessment endpoints (risk estimation). The risk characterization also
presents information necessary to interpret the risk assessment and to decide upon adverse
effect thresholds for the assessment endpoints (risk description). This presentation should
include a qualitative and quantitative summary of risk results and uncertainties.
In risk estimation, the lines of evidence, for which data were collected in the site
investigation, are integrated in the risk characterization to support a conclusion about the
significance of ecological risk. The different possible lines of evidence could be tissue
concentration data, toxicity test results, and/or population/community data.
If site-specific tissue concentration data are available from the site investigation, HQs for
wildlife receptors preying on those tissues are calculated. These HQs are calculated using
appropriate exposure estimates and toxicity reference values.
In the ERA, the risk characterization should put the level of risk at the site in context. The
risk description should identify threshold concentrations in source or exposure media for
effects on the assessment endpoint. All site-specific parameter values used to calculate HQs
must be described and the source of the values identified.
At Step 7, the uncertainty about the risk posed by a substance should have been reduced to a
level that allows risk managers to make a technically defensible remedial decision. The risk
characterization provides information to judge the ecological significance of the estimated
risk to assessment endpoints in the absence of any remedial action.
f) Step 8 of the ERA is Risk Management. The role of ecological risk assessors is to advise the
risk managers during the final actions. If the risk characterization concludes there is a risk to

19
ecological receptors, the risk management decision is whether to remediate the site or to
leave the constituents of concern in place with controls on exposure and monitoring.
20
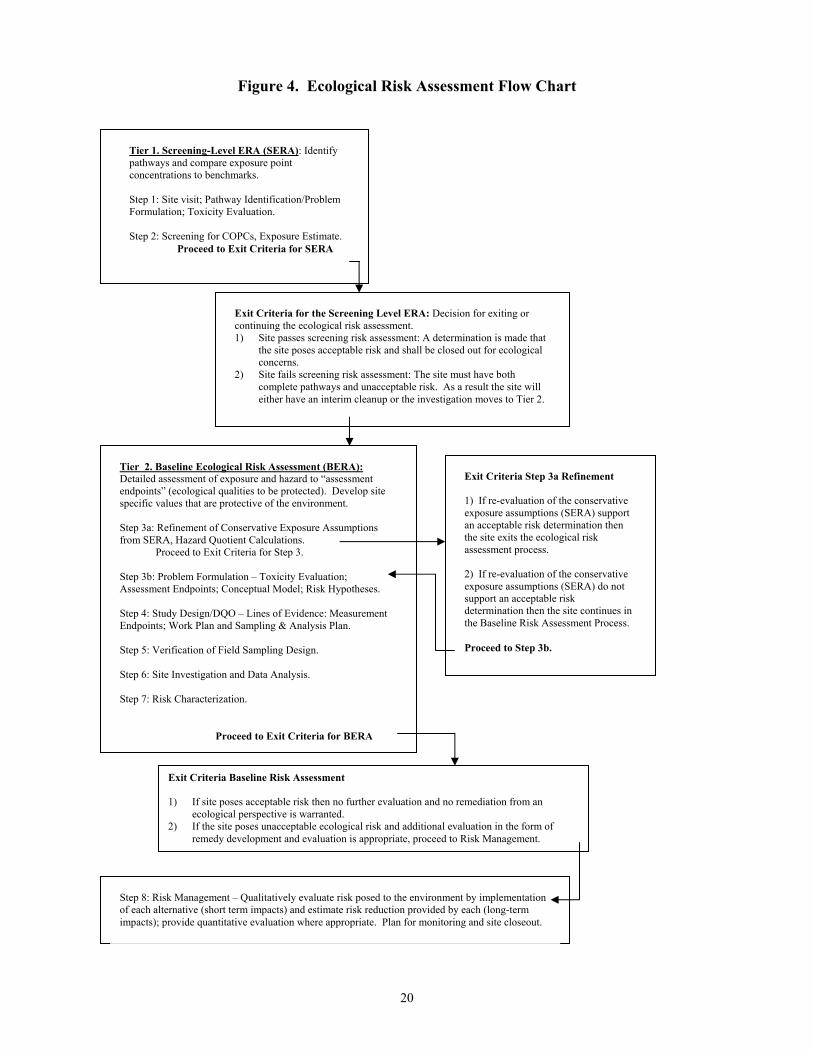
Figure 4. Ecological Risk Assessment Flow Chart
Exit Criteria Step 3a Refinement 1) If re-evaluation of the conservative exposure assumptions (SERA) support an acceptable risk determination then the site exits the ecological risk assessment process. 2) If re-evaluation of the conservative exposure assumptions (SERA) do not support an acceptable risk determination then the site continues in the Baseline Risk Assessment Process. Proceed to Step 3b.
Tier 2. Baseline Ecological Risk Assessment (BERA): Detailed assessment of exposure and hazard to “assessment endpoints” (ecological qualities to be protected). Develop site specific values that are protective of the environment. Step 3a: Refinement of Conservative Exposure Assumptions from SERA, Hazard Quotient Calculations.
Proceed to Exit Criteria for Step 3. Step 3b: Problem Formulation – Toxicity Evaluation; Assessment Endpoints; Conceptual Model; Risk Hypotheses.
Step 4: Study Design/DQO – Lines of Evidence: Measurement Endpoints; Work Plan and Sampling & Analysis Plan. Step 5: Verification of Field Sampling Design. Step 6: Site Investigation and Data Analysis. Step 7: Risk Characterization. Proceed to Exit Criteria for BERA
Exit Criteria for the Screening Level ERA: Decision for exiting or continuing the ecological risk assessment. 1) Site passes screening risk assessment: A determination is made that
the site poses acceptable risk and shall be closed out for ecological concerns.
2) Site fails screening risk assessment: The site must have both complete pathways and unacceptable risk. As a result the site will either have an interim cleanup or the investigation moves to Tier 2.
Tier 1. Screening-Level ERA (SERA): Identify pathways and compare exposure point concentrations to benchmarks. Step 1: Site visit; Pathway Identification/Problem Formulation; Toxicity Evaluation. Step 2: Screening for COPCs, Exposure Estimate. Proceed to Exit Criteria for SERA
Exit Criteria Baseline Risk Assessment 1) If site poses acceptable risk then no further evaluation and no remediation from an
ecological perspective is warranted. 2) If the site poses unacceptable ecological risk and additional evaluation in the form of
remedy development and evaluation is appropriate, proceed to Risk Management.
Step 8: Risk Management – Qualitatively evaluate risk posed to the environment by implementation of each alternative (short term impacts) and estimate risk reduction provided by each (long-term impacts); provide quantitative evaluation where appropriate. Plan for monitoring and site closeout.
21
References
Simini, M., Checkai, R.T., and Maly, M.E. 2000. Tri-Service Remedial Project Manager’s Handbook for Ecological Risk Assessment. Air Force Center for Environmental Excellance, Army Environmental Center, Navy Facilities Service Center. SFIM-AEC-ER-CR-200015.
United States Environmental Protection Agency (U.S. EPA). 1989. Risk Assessment Guidance for
Superfund Volume I Human Health Evaluation Manual (Part A). EPA/540/1-89/002. Office of Emergency and Remedial Response. Washington, D.C. 276 p.
United States Environmental Protection Agency (U.S. EPA). 1991. Risk Assessment Guidance for
Superfund: Volume I-Human Health Evaluation Manual (Part B, Development of Risk-based Preliminary Remediation Goals). Office of Emergency and Remedial Response. Washington, D.C. 54 p.
United States Environmental Protection Agency (U.S. EPA). 1992. Supplemental Guidance to
RAGS: Calculating the Concentration Term. Publication 9285.7-081. Office of Solid Waste and Emergency Response. Washington, D.C. 8 p.
United States Environmental Protection Agency (U.S. EPA). 1993. Wildlife Exposure Factors
Handbook. Office of Research and Development, Washington, DC. EPA/600/R-93/187a United States Environmental Protection Agency (U.S. EPA). 1996a. Soil Screening Guidance:
Technical Background Document. EPA/540/R-95/128. Office of Solid Waste and Emergency Response. Washington, D.C. 497 p.
United States Environmental Protection Agency (U.S. EPA). 1996b. Soil Screening Guidance:
Users Guide. Publication 9355.4-23. Office of Solid Waste and Emergency Response. Washington, D.C. 44 p.
USEPA. 1997a. Ecological Risk Assessment Guidance for Superfund: Process for Designing
and Conducting Ecological Risk Assessments. Interim Final. USEPA Environmental Response Team, Edison, NJ.
United States Environmental Protection Agency (U.S. EPA). 1997b. Health Effects Assessment
Summary Tables. Office of Emergency and Remedial Response. Washington, D.C. USEPA. 1998. Guidelines for Ecological Risk Assessment. Risk Assessment Forum,
Washington, DC. EPA/630/R-95/002F. United States Environmental Protection Agency (U.S. EPA). 2000. Soil Screening Guidance for
Radionuclides: Users Guide. Publication 9355.4-16A. Office of Radiation and Indoor Air. Office of Solid Waste and Emergency Response. Washington, D.C. 90 p.
United States Environmental Protection Agency (U.S. EPA). 2001a. Integrated Risk Information
System. Office of Research and Development. National Center for Environmental Assessment. Washington, D.C. Accessed November 2001. http://www.epa.gov/iris/index.html
22
United States Environmental Protection Agency (U.S. EPA). 2001b. Risk Assessment Guidance for Superfund: Volume I-Human Health Evaluation Manual (Part E) for Dermal Risk Assessment) Interim Guidance. Office of Emergency and Remedial Response. Washington, D.C. EPA/540/R/99/005. OSWER 9285.7-02EP. PB99-963312. September 2001.
United States Environmental Protection Agency (U.S. EPA). 2001c. Supplemental Guidance to
RAGS: Region 4 Bulletins. Office of Technical Services. Waste Management Division. U.S. EPA Region 4. Atlanta, GA. September 2001.
http://www.epa.gov/region4/waste/ots/otsguid.htm.

Appendix A Exposure Factors

A-1
Table 1 Incidental Soil Ingestion Pathway.
Parameter
Value
Chemical Concentration in Soil
95 % UCL of the mean or maximum
Ingestion Rate: Child less that 7 years Child 7 through 18 years, and Adult Adult Worker (8 hour work day) Outdoor Adult (landscaping, construction, Rural outdoor activities, tilling and gardening)
200 mg/day 100 mg/day 50 mg/day 480 mg/day
Exposure Frequency: Resident General Workers Adult Outdoors (urban) Adult Outdoors (rural) Outdoor Worker Child Outdoors (recreational or trespasser)
350 days/year 250 days/year 52 days/year 104 days/year 185 days/year 140 days/year
Fraction of Soil from a Source Impacted by a Release
1.0 (unitless)
Exposure Duration: Child less than 7 years Child 7 through 18 years Residential Urban Adult Residential Rural Adult Adult Worker
6 years 12 years 12 years 22 years 25 years
Ingestion Absorption Factor
1.0 (unitless) or chemical-specific
Body Weight: Child less than 7 years Child 7 through 18 years Adult
15 kg 43 kg 70 kg
Exposure Averaging Time
25,550 days for carcinogens Exposure Duration (years) x 365 days/year for noncarcinogens

A-2
Table 2 Dermal Contact with Stressors in Soil Pathway.
Parameter
Value
Chemical Concentration in Soil
95 % UCL of the mean or maximum
Skin Surface Area: Child less than 7 years Child 7 through 18 years Residential Adult Adult (Industrial) Outdoor Worker
2800 cm2/day (face, forearms, hands, lower legs, and feet) 7500 cm2/day (arms, hands, legs, and feet) 5700 cm2 (face, hands, forearms, and lower legs) 3300 cm2/day (face, forearms, and hands) 4700 cm2/day (arms, hands, and head)
Exposure Frequency: Resident General Workers Adult Outdoors (urban) Adult Outdoors (rural) Outdoor Worker Child Outdoors (recreational or trespasser)
350 days/year 250 days/year 52 days/year 104 days/year 185 days/year 140 days/year
Fraction of Soil from a Source Impacted by a Release
1.0 (unitless)
Exposure Duration: Child less than 7 years Child 7 through 18 years Residential Urban Adult Residential Rural Adult Adult Worker
6 years 12 years 12 years 22 years 25 years
Dermal Absorption Factor
0.25 Volatile Organics (unitless) 0.1 Semivolatiles (unitless) 0.05 Inorganics (unitless)
Skin Contact Time (fraction of day soil remains on skin): Residential Worker Recreational or Trespasser
12 hours/24 hours (0.5 unitless) 8 hours/24 hours (0.33 unitless) 12 hours/24 hours (0.5 unitless)
Soil to Skin Adherence Factor
1.0 mg/cm2
Body Weight: Child less than 7 years Child 7 through 18 years Adult
15 kg 43 kg 70 kg
Exposure Averaging Time
25,550 days for carcinogens Exposure Duration (years) x 365 days/year for noncarcinogens

A-3
Table 3 Inhalation of Particulate-phase Stressors from Soil Pathway.
Parameter
Value
Chemical Concentration in Soil
95 % UCL of the mean or maximum
Inhalation Rate: Resident (Children and Adults) Trespasser Worker (Indoor and Outdoor)
20 m3/day (0.833m3/hour, 24 hr/day) 20 m3/day (2.5 m3/hour, 8 hr/day) 12.5 m3/day (2.5 m3/hour, 5 hr/day)
Exposure Frequency: Resident General Worker Adult Outdoors (urban) Adult Outdoors (rural) Outdoor Worker Child Outdoors (recreational or trespasser)
350 days/year 250 days/year 52 days/year 104 days/year 185 days/year 140 days/year
Fraction of Soil from a Source Impacted by a Release
1.0 (unitless)
Exposure Duration: Child less than 7 years Child 7 through 18 years Residential Urban Adults Residential Rural Adults Adult Worker
6 years 12 years 12 years 22 years 25 years
Inhalation Absorption Factor
1.0 (unitless) or chemical-specific
Particulate Emission Factor: Residential Commercial/Industrial
9.3 x 10⁸ m3/kg or site-specific 6.2 x 10⁸ m3/kg or site-specific
Body Weight: Child less than 7 years Child 7 through 18 years Adults
15 kg 43 kg 70 kg
Exposure Averaging Time
25,550 days for carcinogens Exposure Duration (years) x 365 days/year for noncarcinogens
A-4
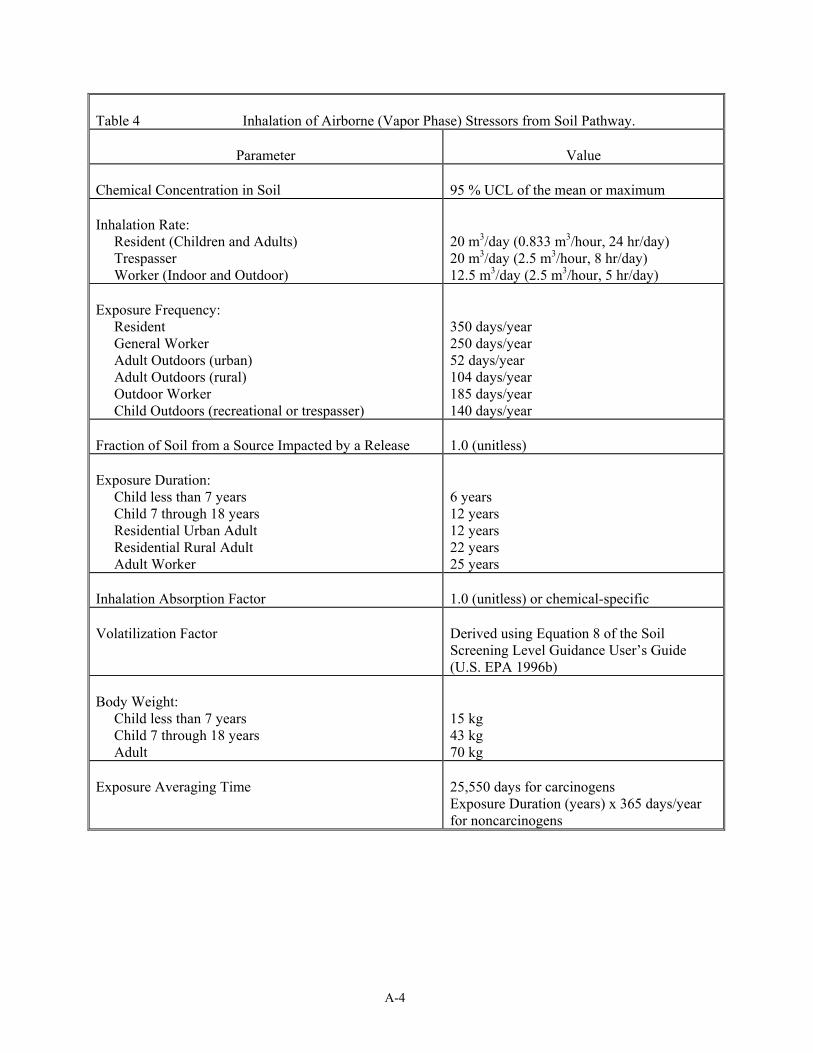
Table 4 Inhalation of Airborne (Vapor Phase) Stressors from Soil Pathway.
Parameter
Value
Chemical Concentration in Soil
95 % UCL of the mean or maximum
Inhalation Rate: Resident (Children and Adults) Trespasser Worker (Indoor and Outdoor)
20 m3/day (0.833 m3/hour, 24 hr/day) 20 m3/day (2.5 m3/hour, 8 hr/day) 12.5 m3/day (2.5 m3/hour, 5 hr/day)
Exposure Frequency: Resident General Worker Adult Outdoors (urban) Adult Outdoors (rural) Outdoor Worker Child Outdoors (recreational or trespasser)
350 days/year 250 days/year 52 days/year 104 days/year 185 days/year 140 days/year
Fraction of Soil from a Source Impacted by a Release
1.0 (unitless)
Exposure Duration: Child less than 7 years Child 7 through 18 years Residential Urban Adult Residential Rural Adult Adult Worker
6 years 12 years 12 years 22 years 25 years
Inhalation Absorption Factor
1.0 (unitless) or chemical-specific
Volatilization Factor
Derived using Equation 8 of the Soil Screening Level Guidance User’s Guide (U.S. EPA 1996b)
Body Weight: Child less than 7 years Child 7 through 18 years Adult
15 kg 43 kg 70 kg
Exposure Averaging Time
25,550 days for carcinogens Exposure Duration (years) x 365 days/year for noncarcinogens

A-5
Table 5 Ingestion of Stressors from Water Pathway.
Parameter
Value
Chemical Concentration in Water
95 % UCL of the mean or maximum
Ingestion Rate: Child less than 3 years old Child 3 through 18 years and Adult Adult Worker (up to an 8 hour work day)
1.0 liter/day 2.0 liters/day 1.0 liter/day
Exposure Frequency: Resident General Worker
350 days/year 250 days/year
Fraction of Soil from a Source Impacted by a Release
1.0 (unitless)
Exposure Duration: Child less than 7 years Child 7 through 18 years Residential Urban Adult Residential Rural Adult Adult Worker
6 years 12 years 12 years 22 years 25 years
Ingestion Absorption Factor
1.0 (unitless) or chemical-specific
Body Weight: Child less than 7 years Child 7 through 18 years Adult
15 kg 43 kg 70 kg
Exposure Averaging Time
25,550 days for carcinogens Exposure Duration (years) x 365 days/year for noncarcinogens

A-6
Table 6 Ingestion of Stressors in Surface Water While Swimming Pathway.
Parameter
Value
Chemical Concentration in Water
95 % UCL of the mean or maximum
Ingestion Rate:
50 milliliters/hour
Exposure Time:
2.6 hours/day
Exposure Frequency:
45 days/year
Fraction of Water from a Source Impacted by a Release
1.0 (unitless)
Exposure Duration: Child less than 7 years Child 7 through 18 years Residential Urban Adult Residential Rural Adult
6 years 12 years 12 years 22 years
Ingestion Absorption Factor
1.0 (unitless) or chemical-specific
Body Weight: Child less than 7 years Child 7 through 18 years Adults
15 kg 43 kg 70 kg
Exposure Averaging Time
25,550 days for carcinogens Exposure Duration (years) x 365 days/year for noncarcinogens
A-7
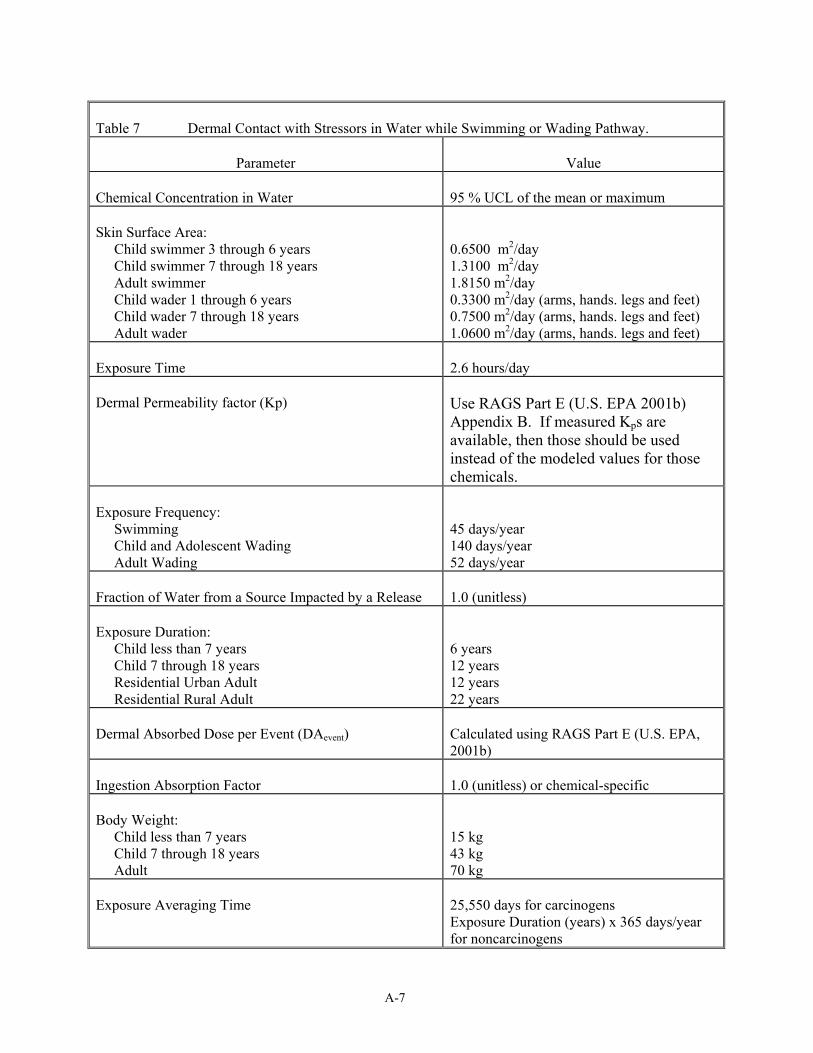
Table 7 Dermal Contact with Stressors in Water while Swimming or Wading Pathway.
Parameter
Value
Chemical Concentration in Water
95 % UCL of the mean or maximum
Skin Surface Area: Child swimmer 3 through 6 years Child swimmer 7 through 18 years Adult swimmer Child wader 1 through 6 years Child wader 7 through 18 years Adult wader
0.6500 m2/day 1.3100 m2/day 1.8150 m2/day 0.3300 m2/day (arms, hands. legs and feet) 0.7500 m2/day (arms, hands. legs and feet) 1.0600 m2/day (arms, hands. legs and feet)
Exposure Time
2.6 hours/day
Dermal Permeability factor (Kp)
Use RAGS Part E (U.S. EPA 2001b) Appendix B. If measured Kps are available, then those should be used instead of the modeled values for those chemicals.
Exposure Frequency: Swimming Child and Adolescent Wading Adult Wading
45 days/year 140 days/year 52 days/year
Fraction of Water from a Source Impacted by a Release
1.0 (unitless)
Exposure Duration: Child less than 7 years Child 7 through 18 years Residential Urban Adult Residential Rural Adult
6 years 12 years 12 years 22 years
Dermal Absorbed Dose per Event (DAevent)
Calculated using RAGS Part E (U.S. EPA, 2001b)
Ingestion Absorption Factor
1.0 (unitless) or chemical-specific
Body Weight: Child less than 7 years Child 7 through 18 years Adult
15 kg 43 kg 70 kg
Exposure Averaging Time
25,550 days for carcinogens Exposure Duration (years) x 365 days/year for noncarcinogens

A-8
Table 8 Dermal Contact with Stressors in Water during Showering or Bathing Pathway.
Parameter
Value
Chemical Concentration in Water
95 % UCL of the mean or maximum
Skin Surface Area: Child 3 through 6 years Child 7 through 18 years Adult
0.6500 m2/day 1.3100 m2/day 1.8150 m2/day
Exposure Time
0.2 hours/day
Dermal Permeability factor (Kp)
Use RAGS Part E (U.S. EPA 2001b) Appendix B. If measured Kps are available, then those should be used instead of the modeled values for those chemicals.
Exposure Frequency: Residents Workers in the work place
350 days/year 250 days/year
Fraction of Water from a Source Impacted by a Release
1.0 (unitless)
Exposure Duration: Child less than 7 years Child 7 through 18 years Residential Urban Adult Residential Rural Adult Adult Worker
6 years 12 years 12 years 22 years 25 years
Dermal Absorbed Dose per Event (DAevent)
Calculated using RAGS Part E (U.S. EPA, 2001b)
Ingestion Absorption Factor
1.0 (unitless) or chemical-specific
Body Weight: Child less than 7 years Child 7 through 18 years Adult
15 kg 43 kg 70 kg
Exposure Averaging Time
25,550 days for carcinogens Exposure Duration (years) x 365 days/year for noncarcinogens

A-9
Table 9 Inhalation of Airborne (Vapor Phase) Stressors in Water during Showering Pathway
Parameter
Value
Chemical Concentration in Water
95 % UCL of the mean or maximum
Concentration of Stressor in Air
Use Schaum, et al., 1994, Showering Exposure
Inhalation Rate
0.833 m3/day
Exposure Time
0.2 hours/day (12 minutes/day)
Exposure Frequency: Residents Workers in the work place
350 days/year 250 days/year
Fraction of Water from a Source Impacted by a Release
1.0 (unitless)
Exposure Duration: Child less than 7 years Child 7 through 18 years Residential Urban Adults Residential Rural Adults Adult Worker
6 years 12 years 12 years 22 years 25 years
Inhalation Absorption Factor
1.0 (unitless) or chemical-specific
Body Weight: Child less than 7 years Child 7 through 18 years Adults
15 kg 43 kg 70 kg
Exposure Averaging Time
25,550 days for carcinogens Exposure Duration (years) x 365 days/year for noncarcinogens
A-10
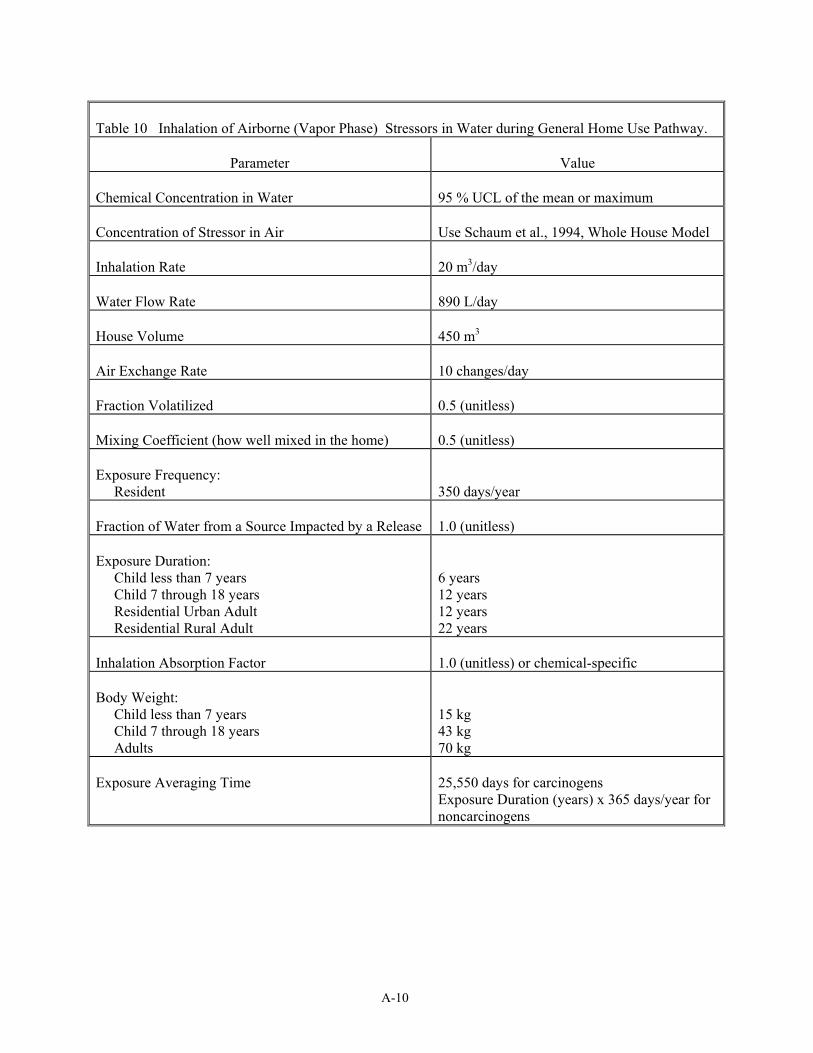
Table 10 Inhalation of Airborne (Vapor Phase) Stressors in Water during General Home Use Pathway.
Parameter
Value
Chemical Concentration in Water
95 % UCL of the mean or maximum
Concentration of Stressor in Air
Use Schaum et al., 1994, Whole House Model
Inhalation Rate
20 m3/day
Water Flow Rate
890 L/day
House Volume
450 m3
Air Exchange Rate
10 changes/day
Fraction Volatilized
0.5 (unitless)
Mixing Coefficient (how well mixed in the home)
0.5 (unitless)
Exposure Frequency: Resident
350 days/year
Fraction of Water from a Source Impacted by a Release
1.0 (unitless)
Exposure Duration: Child less than 7 years Child 7 through 18 years Residential Urban Adult Residential Rural Adult
6 years 12 years 12 years 22 years
Inhalation Absorption Factor
1.0 (unitless) or chemical-specific
Body Weight: Child less than 7 years Child 7 through 18 years Adults
15 kg 43 kg 70 kg
Exposure Averaging Time
25,550 days for carcinogens Exposure Duration (years) x 365 days/year for noncarcinogens

A-11
Other Pathways. Other pathways may be used at sites that have current or potential future pathways that are not listed in this Appendix. Examples include: consumption of contaminated fish, produce, and livestock. Exposure factors should be based on site-specific conditions and may be obtained from U.S. EPA documents including Exposure Factors Handbook, Risk Assessment Guidance for Superfund (Part A), and Risk Assessment Guidance for Superfund (Part B).

Appendix B General Outline for Baseline Risk Assessment
B-1
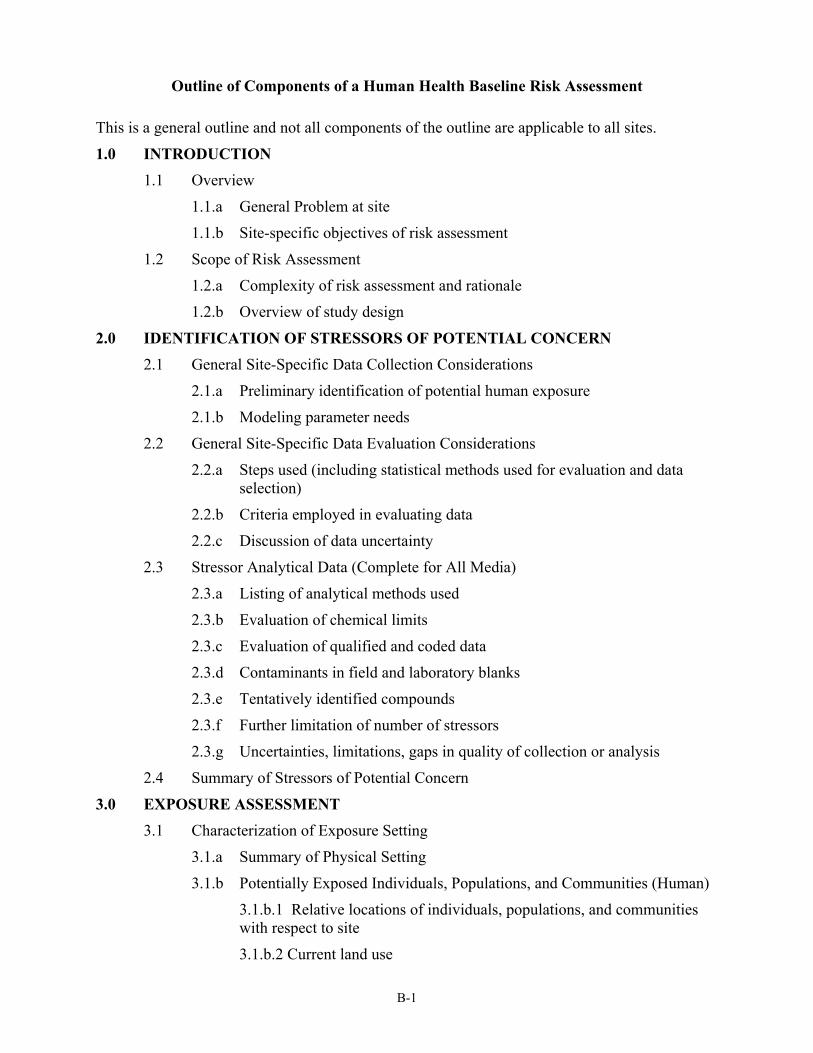
Outline of Components of a Human Health Baseline Risk Assessment
This is a general outline and not all components of the outline are applicable to all sites.
1.0 INTRODUCTION 1.1 Overview
1.1.a General Problem at site
1.1.b Site-specific objectives of risk assessment
1.2 Scope of Risk Assessment
1.2.a Complexity of risk assessment and rationale
1.2.b Overview of study design
2.0 IDENTIFICATION OF STRESSORS OF POTENTIAL CONCERN 2.1 General Site-Specific Data Collection Considerations
2.1.a Preliminary identification of potential human exposure
2.1.b Modeling parameter needs
2.2 General Site-Specific Data Evaluation Considerations
2.2.a Steps used (including statistical methods used for evaluation and data selection)
2.2.b Criteria employed in evaluating data
2.2.c Discussion of data uncertainty
2.3 Stressor Analytical Data (Complete for All Media)
2.3.a Listing of analytical methods used
2.3.b Evaluation of chemical limits
2.3.c Evaluation of qualified and coded data
2.3.d Contaminants in field and laboratory blanks
2.3.e Tentatively identified compounds
2.3.f Further limitation of number of stressors
2.3.g Uncertainties, limitations, gaps in quality of collection or analysis
2.4 Summary of Stressors of Potential Concern
3.0 EXPOSURE ASSESSMENT 3.1 Characterization of Exposure Setting
3.1.a Summary of Physical Setting
3.1.b Potentially Exposed Individuals, Populations, and Communities (Human)
3.1.b.1 Relative locations of individuals, populations, and communities with respect to site
3.1.b.2 Current land use
B-2
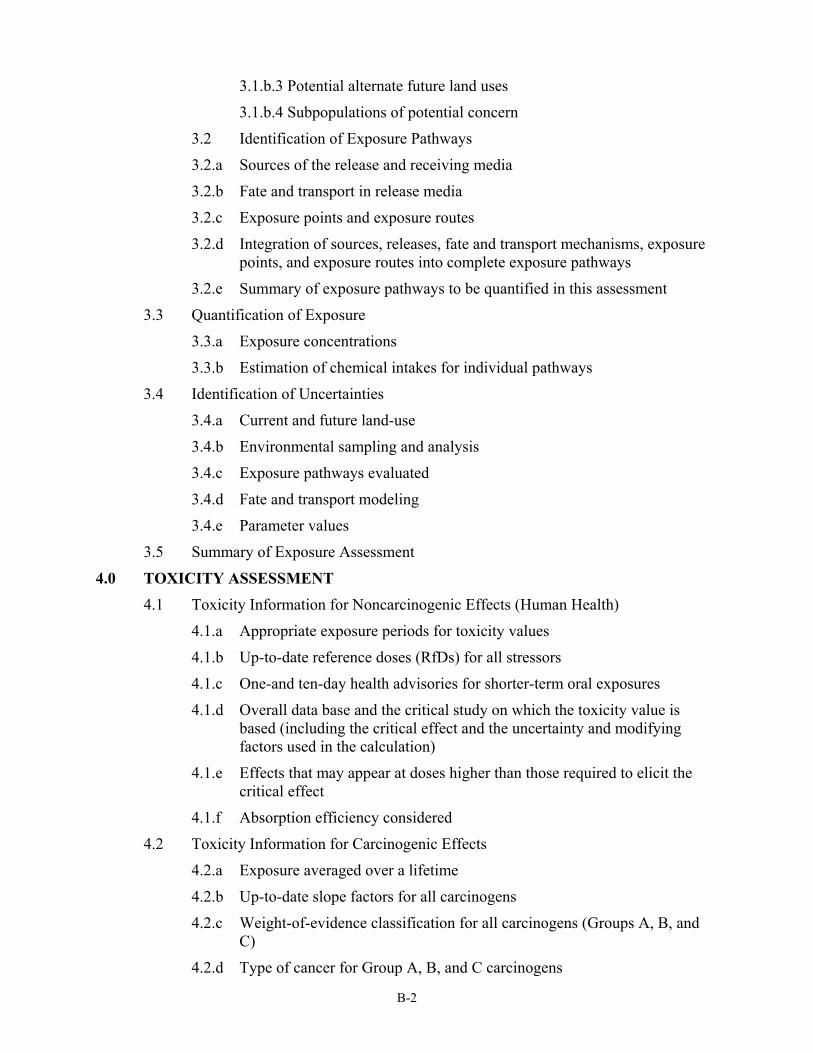
3.1.b.3 Potential alternate future land uses
3.1.b.4 Subpopulations of potential concern
3.2 Identification of Exposure Pathways
3.2.a Sources of the release and receiving media
3.2.b Fate and transport in release media
3.2.c Exposure points and exposure routes
3.2.d Integration of sources, releases, fate and transport mechanisms, exposure points, and exposure routes into complete exposure pathways
3.2.e Summary of exposure pathways to be quantified in this assessment
3.3 Quantification of Exposure
3.3.a Exposure concentrations
3.3.b Estimation of chemical intakes for individual pathways
3.4 Identification of Uncertainties
3.4.a Current and future land-use
3.4.b Environmental sampling and analysis
3.4.c Exposure pathways evaluated
3.4.d Fate and transport modeling
3.4.e Parameter values
3.5 Summary of Exposure Assessment
4.0 TOXICITY ASSESSMENT 4.1 Toxicity Information for Noncarcinogenic Effects (Human Health)
4.1.a Appropriate exposure periods for toxicity values
4.1.b Up-to-date reference doses (RfDs) for all stressors
4.1.c One-and ten-day health advisories for shorter-term oral exposures
4.1.d Overall data base and the critical study on which the toxicity value is based (including the critical effect and the uncertainty and modifying factors used in the calculation)
4.1.e Effects that may appear at doses higher than those required to elicit the critical effect
4.1.f Absorption efficiency considered
4.2 Toxicity Information for Carcinogenic Effects
4.2.a Exposure averaged over a lifetime
4.2.b Up-to-date slope factors for all carcinogens
4.2.c Weight-of-evidence classification for all carcinogens (Groups A, B, and C)
4.2.d Type of cancer for Group A, B, and C carcinogens

B-3
4.2.e Concentration above which the dose-response curve is no longer linear, if applicable
4.3 Stressors for Which No EPA Toxicity Values are Available
4.3.a Sources of values
4.3.b Qualitative evaluation
4.3.c Documentation or justification of any new toxicity values developed
4.4 Uncertainties Related to Toxicity Information
4.4.a Quality of the individual studies
4.4.b Completeness of the overall data base
4.5 Summary of Toxicity Information
5.0 RISK CHARACTERIZATION 5.1 Current Land-use Conditions (Human Health)
5.1.a Carcinogenic risk of individual stressors in individual pathways
5.1.b Chronic hazard quotient calculation (individual stressors, individual pathways)
5.1.c Subchronic hazard quotient calculation (individual stressors, individual pathways)
5.1.d Shorter-term hazard quotient calculation (individual stressors, individual pathways)
5.1.e Noncarcinogenic hazard index (individual stressors, all pathways)
5.1.f Carcinogenic risk (individual stressors, all pathways)
5.2 Future Land-Use Conditions (Human Health)
5.2.a Carcinogenic risk of individual stressors in individual pathways
5.2.b Chronic hazard quotient calculation (individual stressors, individual pathways)
5.2.c Subchronic hazard quotient calculation (individual stressors, individual pathways)
5.2.d Noncarcinogenic hazard index (individual stressors, all pathways)
5.2.e Carcinogenic risk (individual stressors, all pathways)
5.3 Uncertainties
5.3.a Site-specific uncertainty factors
5.3.a.1 Definition of physical setting
5.3.a.2 Model applicability and assumptions
5.3.a.3 Parameter values for fate or transport and exposure calculations
5.3.b Summary of toxicity assessment uncertainty
5.3.b.1 Uncertainty and identification of potential human health effects
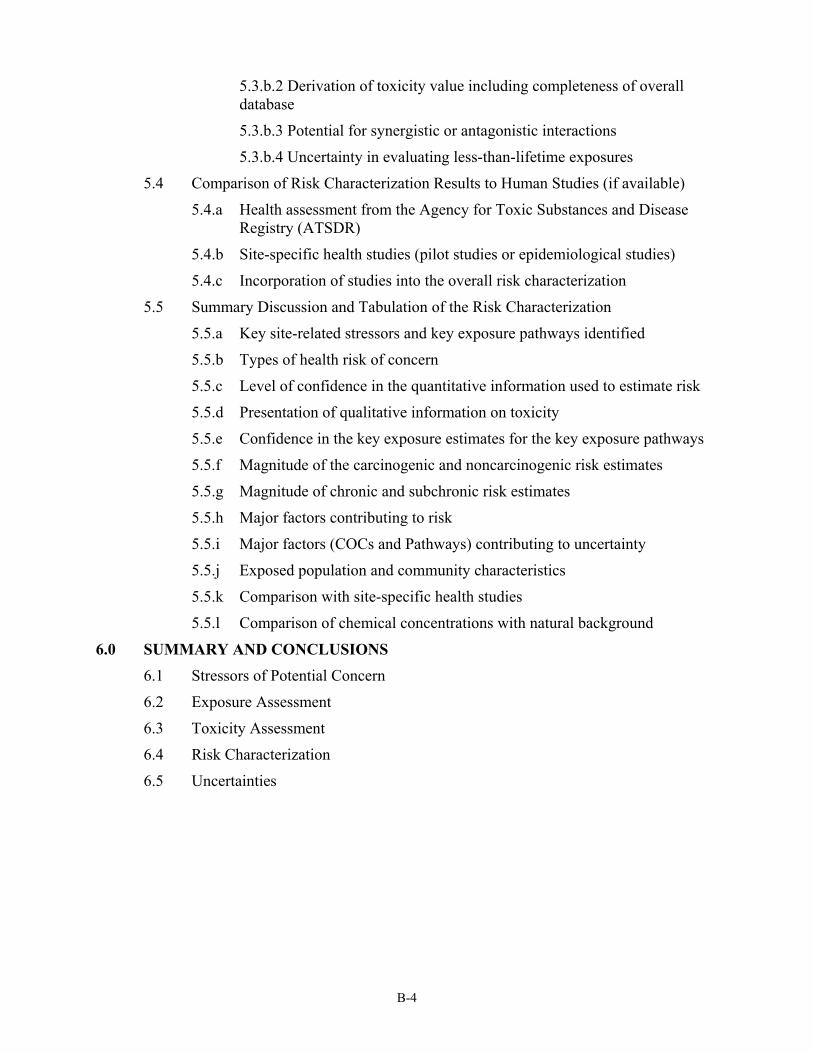
B-4
5.3.b.2 Derivation of toxicity value including completeness of overall database
5.3.b.3 Potential for synergistic or antagonistic interactions
5.3.b.4 Uncertainty in evaluating less-than-lifetime exposures
5.4 Comparison of Risk Characterization Results to Human Studies (if available)
5.4.a Health assessment from the Agency for Toxic Substances and Disease Registry (ATSDR)
5.4.b Site-specific health studies (pilot studies or epidemiological studies)
5.4.c Incorporation of studies into the overall risk characterization
5.5 Summary Discussion and Tabulation of the Risk Characterization
5.5.a Key site-related stressors and key exposure pathways identified
5.5.b Types of health risk of concern
5.5.c Level of confidence in the quantitative information used to estimate risk
5.5.d Presentation of qualitative information on toxicity
5.5.e Confidence in the key exposure estimates for the key exposure pathways
5.5.f Magnitude of the carcinogenic and noncarcinogenic risk estimates
5.5.g Magnitude of chronic and subchronic risk estimates
5.5.h Major factors contributing to risk
5.5.i Major factors (COCs and Pathways) contributing to uncertainty
5.5.j Exposed population and community characteristics
5.5.k Comparison with site-specific health studies
5.5.l Comparison of chemical concentrations with natural background
6.0 SUMMARY AND CONCLUSIONS
6.1 Stressors of Potential Concern
6.2 Exposure Assessment
6.3 Toxicity Assessment
6.4 Risk Characterization
6.5 Uncertainties
B-5
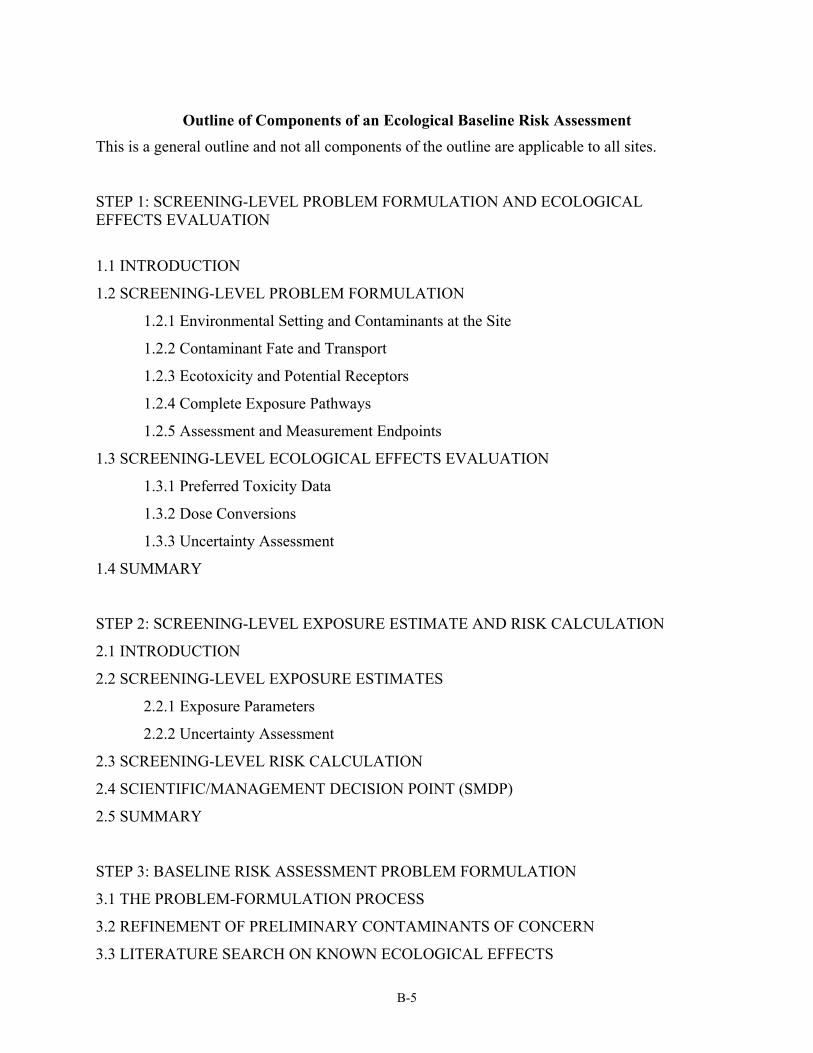
Outline of Components of an Ecological Baseline Risk Assessment This is a general outline and not all components of the outline are applicable to all sites.
STEP 1: SCREENING-LEVEL PROBLEM FORMULATION AND ECOLOGICAL EFFECTS EVALUATION
1.1 INTRODUCTION
1.2 SCREENING-LEVEL PROBLEM FORMULATION
1.2.1 Environmental Setting and Contaminants at the Site
1.2.2 Contaminant Fate and Transport
1.2.3 Ecotoxicity and Potential Receptors
1.2.4 Complete Exposure Pathways
1.2.5 Assessment and Measurement Endpoints
1.3 SCREENING-LEVEL ECOLOGICAL EFFECTS EVALUATION
1.3.1 Preferred Toxicity Data
1.3.2 Dose Conversions
1.3.3 Uncertainty Assessment
1.4 SUMMARY
STEP 2: SCREENING-LEVEL EXPOSURE ESTIMATE AND RISK CALCULATION
2.1 INTRODUCTION
2.2 SCREENING-LEVEL EXPOSURE ESTIMATES
2.2.1 Exposure Parameters
2.2.2 Uncertainty Assessment
2.3 SCREENING-LEVEL RISK CALCULATION
2.4 SCIENTIFIC/MANAGEMENT DECISION POINT (SMDP)
2.5 SUMMARY
STEP 3: BASELINE RISK ASSESSMENT PROBLEM FORMULATION
3.1 THE PROBLEM-FORMULATION PROCESS
3.2 REFINEMENT OF PRELIMINARY CONTAMINANTS OF CONCERN
3.3 LITERATURE SEARCH ON KNOWN ECOLOGICAL EFFECTS
B-6
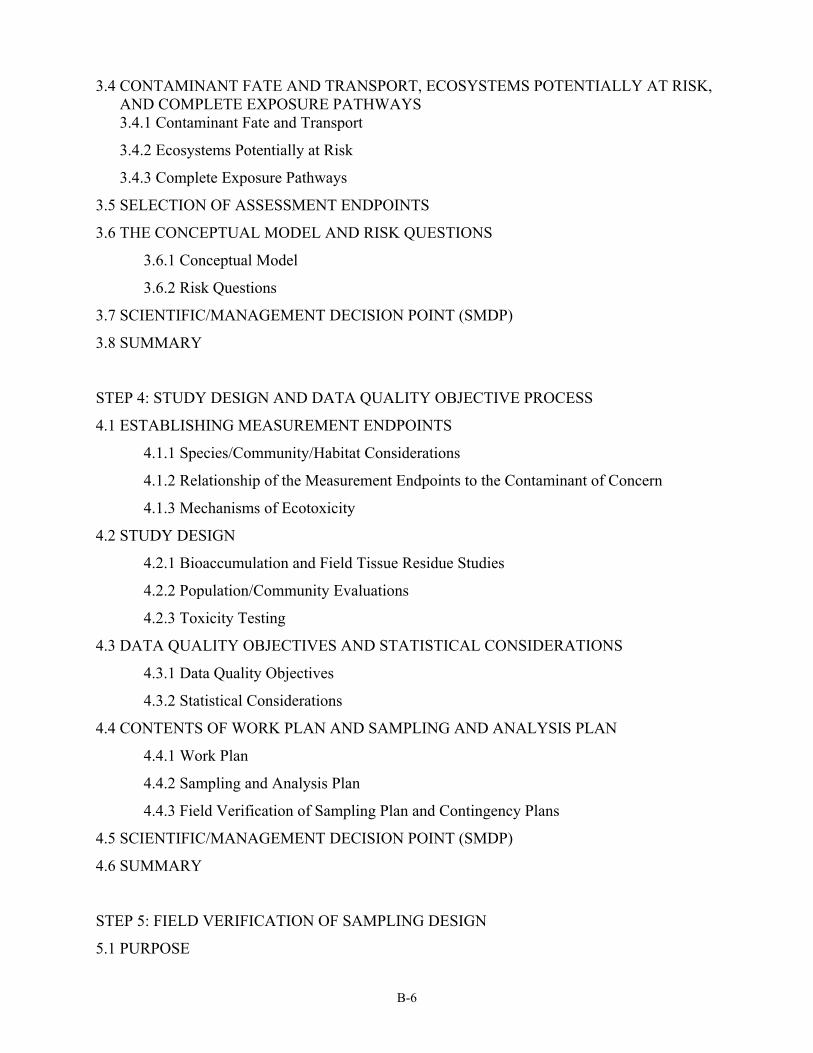
3.4 CONTAMINANT FATE AND TRANSPORT, ECOSYSTEMS POTENTIALLY AT RISK, AND COMPLETE EXPOSURE PATHWAYS 3.4.1 Contaminant Fate and Transport
3.4.2 Ecosystems Potentially at Risk
3.4.3 Complete Exposure Pathways
3.5 SELECTION OF ASSESSMENT ENDPOINTS
3.6 THE CONCEPTUAL MODEL AND RISK QUESTIONS
3.6.1 Conceptual Model
3.6.2 Risk Questions
3.7 SCIENTIFIC/MANAGEMENT DECISION POINT (SMDP)
3.8 SUMMARY
STEP 4: STUDY DESIGN AND DATA QUALITY OBJECTIVE PROCESS
4.1 ESTABLISHING MEASUREMENT ENDPOINTS
4.1.1 Species/Community/Habitat Considerations
4.1.2 Relationship of the Measurement Endpoints to the Contaminant of Concern
4.1.3 Mechanisms of Ecotoxicity
4.2 STUDY DESIGN
4.2.1 Bioaccumulation and Field Tissue Residue Studies
4.2.2 Population/Community Evaluations
4.2.3 Toxicity Testing
4.3 DATA QUALITY OBJECTIVES AND STATISTICAL CONSIDERATIONS
4.3.1 Data Quality Objectives
4.3.2 Statistical Considerations
4.4 CONTENTS OF WORK PLAN AND SAMPLING AND ANALYSIS PLAN
4.4.1 Work Plan
4.4.2 Sampling and Analysis Plan
4.4.3 Field Verification of Sampling Plan and Contingency Plans
4.5 SCIENTIFIC/MANAGEMENT DECISION POINT (SMDP)
4.6 SUMMARY
STEP 5: FIELD VERIFICATION OF SAMPLING DESIGN
5.1 PURPOSE
B-7
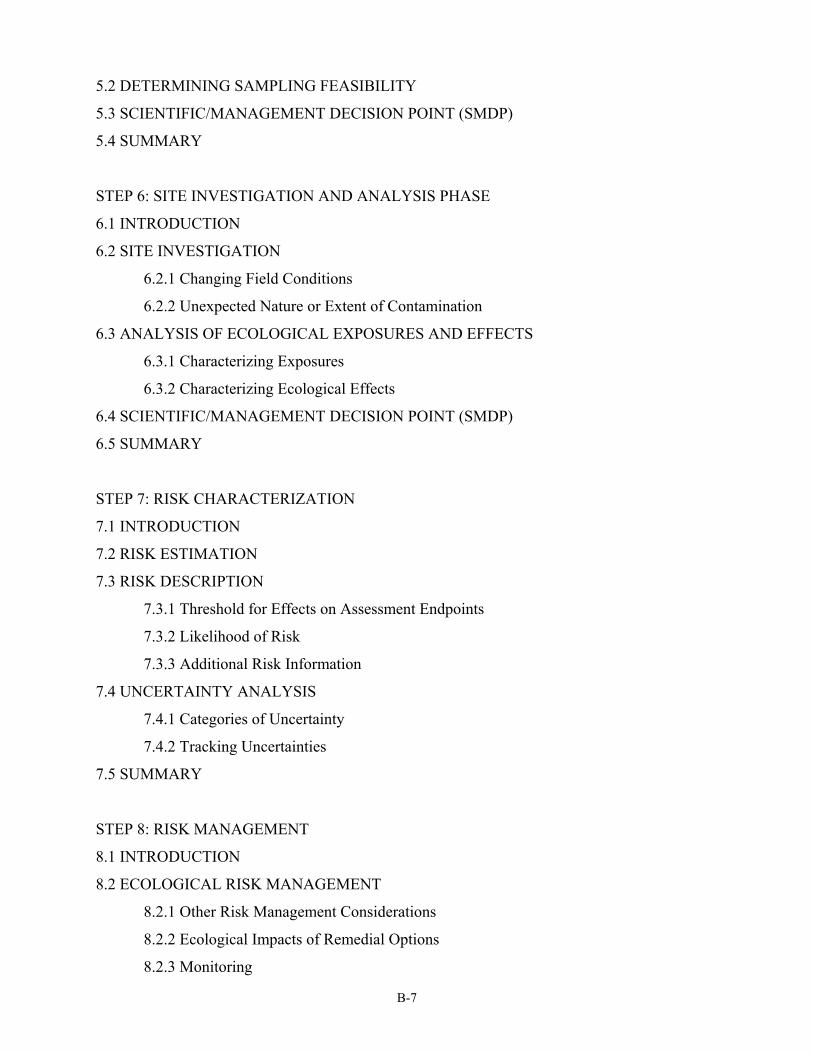
5.2 DETERMINING SAMPLING FEASIBILITY
5.3 SCIENTIFIC/MANAGEMENT DECISION POINT (SMDP)
5.4 SUMMARY
STEP 6: SITE INVESTIGATION AND ANALYSIS PHASE
6.1 INTRODUCTION
6.2 SITE INVESTIGATION
6.2.1 Changing Field Conditions
6.2.2 Unexpected Nature or Extent of Contamination
6.3 ANALYSIS OF ECOLOGICAL EXPOSURES AND EFFECTS
6.3.1 Characterizing Exposures
6.3.2 Characterizing Ecological Effects
6.4 SCIENTIFIC/MANAGEMENT DECISION POINT (SMDP)
6.5 SUMMARY
STEP 7: RISK CHARACTERIZATION
7.1 INTRODUCTION
7.2 RISK ESTIMATION
7.3 RISK DESCRIPTION
7.3.1 Threshold for Effects on Assessment Endpoints
7.3.2 Likelihood of Risk
7.3.3 Additional Risk Information
7.4 UNCERTAINTY ANALYSIS
7.4.1 Categories of Uncertainty
7.4.2 Tracking Uncertainties
7.5 SUMMARY
STEP 8: RISK MANAGEMENT
8.1 INTRODUCTION
8.2 ECOLOGICAL RISK MANAGEMENT
8.2.1 Other Risk Management Considerations
8.2.2 Ecological Impacts of Remedial Options
8.2.3 Monitoring

B-8
8.3 SCIENTIFIC/MANAGEMENT DECISION POINT (SMDP)
8.4 SUMMARY

Appendix C Human Health Screening Values

C-1
Development of Risk Based Concentrations for Environmental Remediation in Kentucky
Introduction
This appendix details the procedures used to develop risk-based concentrations that will
be used for the Voluntary Environmental Remediation Program, KRS 224.01-400 and KRS
224.01-405 cleanups, and other programs where risk-based concentrations are needed.
Documents from the United States Environmental Protection Agency were consulted in the
process of developing this document and the procedures used in calculating risk-based
concentrations.
Application
It is intended for this table to have several applications to sites undergoing environmental
remediation. Applications include: preliminary screening of site contaminants, closure of small
spills, determination of potential toxic conditions, and reduction and refinement of the number of
Chemicals of Concern (COCs) at a site during a baseline risk assessment. The values are also
one of the factors that should be considered when selecting remedial goals. The values consider
the more common exposure routes but if an individual site has other exposure routes that play a
major role in the site-related exposures, these values may underestimate the risk.
Calculation of Risk-Based Values
The formulae for calculating the risk-based concentrations are primarily from U.S. EPA
guidance including Risk Assessment Guidance for Superfund Volume I: Human Health
Evaluation Manual (Part A), commonly referred to as RAGS Part A (U.S. EPA, 1989), RAGS
part B (U.S. EPA, 1991), Soil Screening Guidance: Users Guide (U.S. EPA, 1996c), and Soil
Screening Guidance: Technical Background Document (U.S. EPA, 1996b). “Estimating Dermal
and Inhalation Exposure to Volatile Chemicals in Domestic Water” (Schaum et al., 1994) was
used to represent the inhalation exposure to water based on the Whole House Dispersion Model.
The assumptions that are used in estimating the risk-based concentrations are selected to be
protective of sensitive subpopulations.
KYDEP incorporated applicable exposure routes into each medium of exposure. For
residential and occupational exposure to soil; ingestion, dermal and inhalation exposure was
considered. Dermal exposure to soil used default absorption values of 0.25 for volatiles, 0.1 for
semivolatiles, and 0.05 for metals. Default dermal absorption factors were derived from
literature reviews of dermal absorption. The Agency for Toxic Substances and Disease Registry

C-2
(ATSDR) Toxicological Profiles were a valuable source of absorption and chemical specific
data. Ten compounds had chemical-specific dermal absorption rates as listed in RAGS Part E
(U.S, EPA, 2000a). Inhalation of contaminants found in soil used two factors: a Volatilization
Factor (VF), and a Particulate Emission Factor (PEF). Potential volatilization from soil to air
was represented for volatiles by the volatilization factor that was calculated using the formula in
the Soil Screening Guidance: User’s Guide (U.S. EPA, 1996c). A compound was assumed to be
volatile when the molecular weight was less than 200 mg/mol and the Henry’s Law Constant (H)
was greater than 10-5 atm-m3/mol. The respective default dispersion factor for residential and
commercial/industrial exposures were derived for Kentucky sites using exhibit 11 in U.S. EPA,
1996c. Climatic zone VII was used to calculate the dispersion factor term since that is the
logical zone for Kentucky sites. For a residential dispersion factor, the 90% lower confidence
limit was calculated for a 0.5-acre site size. A commercial/industrial value for dispersion factor
was calculated based the 90% lower confidence limit of the values listed under a site size of 5
acres.
Inhalation was the route that was used for air exposures. Tap water exposure used
ingestion and inhalation, the latter using the Schaum (1994) Whole House Exposure Model. The
model describes the average indoor air concentration as a result of water use throughout the
house. This model considers water use such as washing dishes, bathing, washing clothes, and
cooking. The formula is:
C WHF C fHV ER MCa
w=× ×
× ×
where:
Ca = concentration in air, mg/m3
Cw = concentration in water, mg/L
WHF = water flow rate in whole house, 890 L/day
HV = house volume, 450 m3
ER = exchange rate, 10 air changes/day
MC = mixing coefficient, 0.5 (unitless)
ƒ = fraction of contaminant that volatilizes, 0.5 (unitless)
The default values for these parameters were selected from the text of the Schaum (1994)
chapter and are listed following the description.

C-3
Formulae
The formulae for calculation of the risk-based values are the result of taking the standard
exposure equations used in risk assessments and solving for the concentration term. Toxicity
values were used to represent the potential toxicity of each compound. These values are
obtained from several sources. The source is listed next to each toxicity value. The
abbreviations in order of preference are: “i” U.S. EPA’s Integrated Risk Information System
(IRIS), “h” U.S. EPA’s Health Effects Assessment Summary Tables (HEAST), “n” U.S. EPA’s
National Center for Environmental Assessment (NCEA), “w” withdrawn from IRIS or HEAST,
“o” other EPA documents, “r” route extrapolation, and “s” when the toxicity value of a surrogate
compound was used based on physicochemical characteristics. The Risk-Based Screening
Values are based on a target risk of 1 x 10⁻⁶ for carcinogens and a Hazard Index of 1.0 for
noncarcinogens in each media. The carcinogenic risk of 1 x 10⁻⁶, or one excess cancer in one
million is standard practice in risk assessment for de minimis risk. The target Hazard Index of
1.0 indicates that the noncarcinogenic risk is below a toxicity threshold represented by the
reference dose. The basis for each screening value in the table is denoted by “ca” for a
carcinogenic endpoint, and “nc” for a noncarcinogenic endpoint. A soil saturation limit was
derived using the formula in U.S. EPA, 1996c. A ceiling limit was set at 10+5 as a maximum soil
concentration. If the risk-based screening value exceeded the saturation limit or the maximum,
then the soil screening value was set at the saturation limit (denoted as “sat”) or the maximum
ceiling limit (denoted as “max”) The following formulae were used to calculate the risk-based
screening values for each media.
Noncarcinogenic Effects
Residential Soil ( _ _ )
( _ ( / / _ ) _ _ / ) ( _ _ _ . / ) ( _ _ _ . / )ED c BW c THQ
IRA c VF PEF r EF r ED c RfDi SA c AF ABS EF r ED c RfDo IRS c EF r ED c RfDo× × ×
× + × × × + × × × × × × + × × × ×365
1 1 1 0000001 1 0000001 1
Commercial/Industrial Soil
)/1000001.0___()/1000001.0___()/1__)_/1/1(_()365__(
RfDooEDoEFoIRSRfDooEDoEFABSAFiSARfDioEDoEFoPEFVFaIRATHQaBWaED
××××+××××××+×××+××××

C-4
Ambient Air ( _ _ )
( _ _ _ )ED c BW c THQ RfDi
IRA c EF r ED c× × × × ×
× ×365 1000
Tap Water
)/1___)5.010450(
)5.0890(()/1__
_)33_()33_(
(
)1000365__(
RfDicEDrEFcIRARfDocEDrEFcED
cIRWcIRWTHQcEDcBW
××××××
×+×××
×>+×<××××
Carcinogenic Effects
Residential Soil ( )
( _ ( / / _ ) _ ) ( _ _ . ) ( _ _ . )AT TR
InF adj VF PEF r EF r SFi SFS adj AF ABS EF r SFo IFS adj EF r SFo× ×
× + × × + × × × × × + × × ×365
1 1 0000001 0000001
Commercial/Industrial Soil
)000001.0___()000001.0___()__)_/1/1(_()365_(
SFooEDoEFoIRSSFooEDoEFABSAFiSASFioEDoEFoPEFVFaIRATRaBWAT
××××+××××××+×××+××××
Ambient Air
)__()1000365(
SFirEFadjInhFTRAT
×××××
Tap Water
)__)5.010450(
)5.0890(()__(
)1000365(
SFirEFadjInhFSForEFadjIFW
TRAT
×××××
×+××
×××
Four age adjusted factors were calculated for carcinogenic exposure calculations. The
formula for each factor is shown below.
Ingestion Factor for Soil
IRS c ED cBW c
IRS a ED adolBW adol
IRS a ED aBW a
_ __
_ __
_ __
×
+
×
+
×
Skin Contact Factor for Soil
SA c ED cBW c
SA adol ED adolBW adol
SA a ED aBW a
_ __
_ __
_ __
×
+
×
+
×
C-5
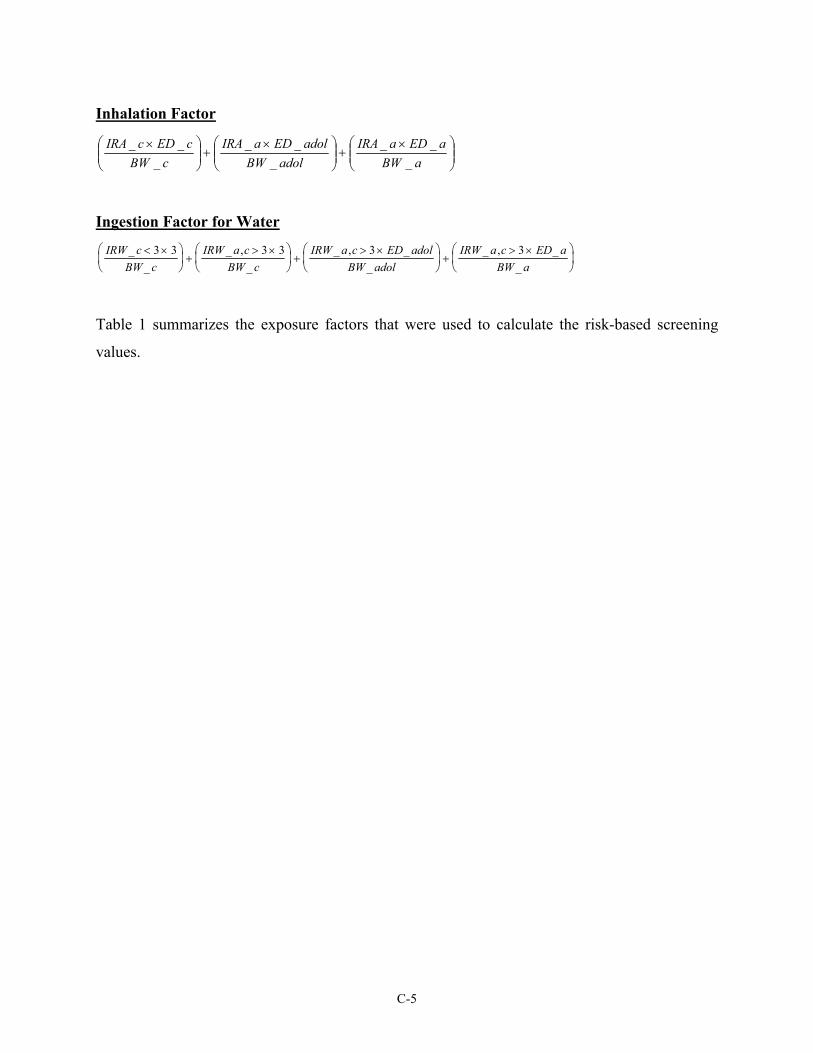
Inhalation Factor
×+
×+
×aBW
aEDaIRAadolBW
adolEDaIRAcBW
cEDcIRA_
___
___
__
Ingestion Factor for Water
IRW cBW c
IRW a cBW c
IRW a c ED adolBW adol
IRW a c ED aBW a
__
_ ,_
_ , __
_ , __
< ×
+
> ×
+
> ×
+
> ×
3 3 3 3 3 3
Table 1 summarizes the exposure factors that were used to calculate the risk-based screening
values.
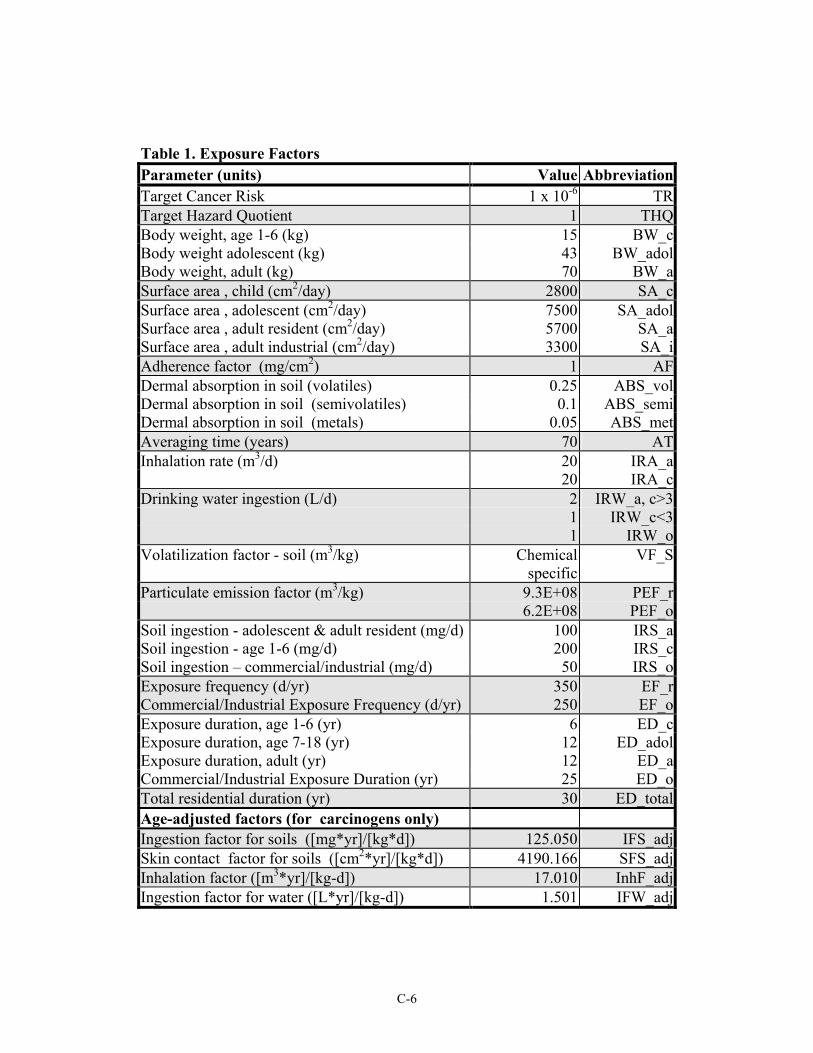
C-6
Table 1. Exposure Factors Parameter (units) Value AbbreviationTarget Cancer Risk 1 x 10⁻⁶ TRTarget Hazard Quotient 1 THQBody weight, age 1-6 (kg) 15 BW_cBody weight adolescent (kg) 43 BW_adolBody weight, adult (kg) 70 BW_aSurface area , child (cm2/day) 2800 SA_cSurface area , adolescent (cm2/day) 7500 SA_adolSurface area , adult resident (cm2/day) 5700 SA_aSurface area , adult industrial (cm2/day) 3300 SA_iAdherence factor (mg/cm2) 1 AFDermal absorption in soil (volatiles) 0.25 ABS_volDermal absorption in soil (semivolatiles) 0.1 ABS_semiDermal absorption in soil (metals) 0.05 ABS_metAveraging time (years) 70 ATInhalation rate (m3/d) 20 IRA_a
20 IRA_cDrinking water ingestion (L/d) 2 IRW_a, c>3
1 IRW_c<31 IRW_o
Volatilization factor - soil (m3/kg) Chemical specific
VF_S
Particulate emission factor (m3/kg) 9.3E+08 PEF_r6.2E+08 PEF_o
Soil ingestion - adolescent & adult resident (mg/d) 100 IRS_aSoil ingestion - age 1-6 (mg/d) 200 IRS_cSoil ingestion – commercial/industrial (mg/d) 50 IRS_oExposure frequency (d/yr) 350 EF_rCommercial/Industrial Exposure Frequency (d/yr) 250 EF_oExposure duration, age 1-6 (yr) 6 ED_cExposure duration, age 7-18 (yr) 12 ED_adolExposure duration, adult (yr) 12 ED_aCommercial/Industrial Exposure Duration (yr) 25 ED_oTotal residential duration (yr) 30 ED_totalAge-adjusted factors (for carcinogens only) Ingestion factor for soils ([mg*yr]/[kg*d]) 125.050 IFS_adjSkin contact factor for soils ([cm2*yr]/[kg*d]) 4190.166 SFS_adjInhalation factor ([m3*yr]/[kg-d]) 17.010 InhF_adjIngestion factor for water ([L*yr]/[kg-d]) 1.501 IFW_adj
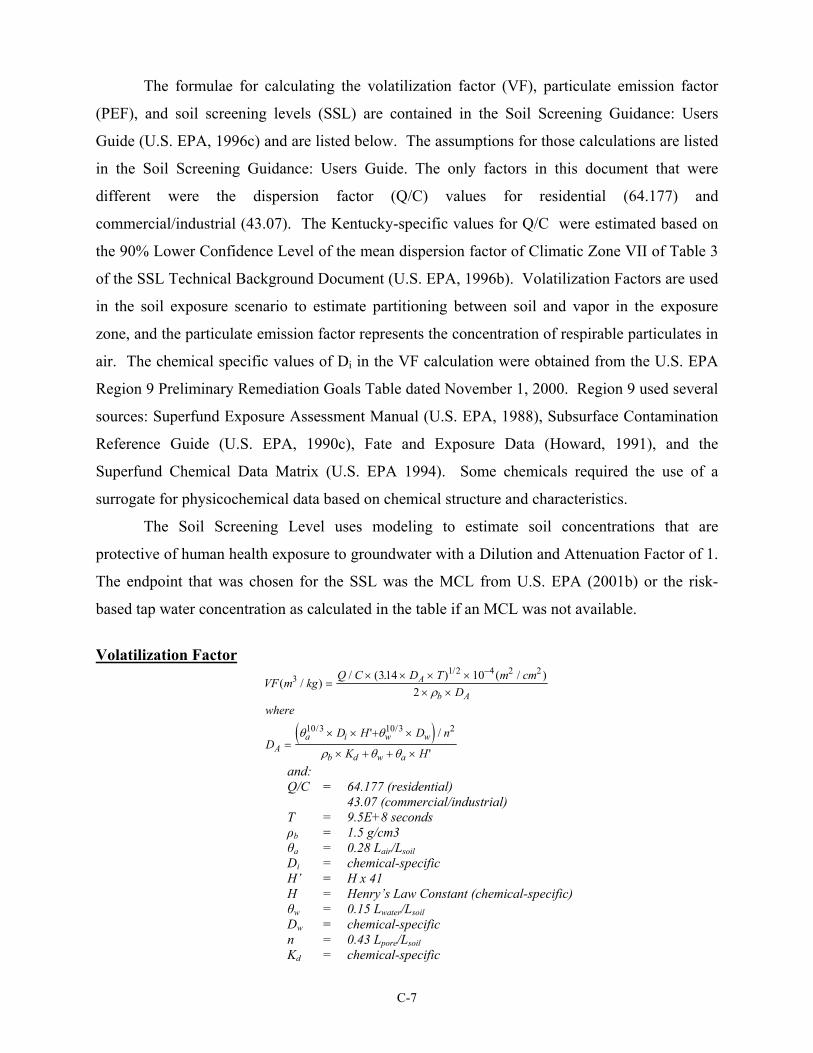
C-7
The formulae for calculating the volatilization factor (VF), particulate emission factor
(PEF), and soil screening levels (SSL) are contained in the Soil Screening Guidance: Users
Guide (U.S. EPA, 1996c) and are listed below. The assumptions for those calculations are listed
in the Soil Screening Guidance: Users Guide. The only factors in this document that were
different were the dispersion factor (Q/C) values for residential (64.177) and
commercial/industrial (43.07). The Kentucky-specific values for Q/C were estimated based on
the 90% Lower Confidence Level of the mean dispersion factor of Climatic Zone VII of Table 3
of the SSL Technical Background Document (U.S. EPA, 1996b). Volatilization Factors are used
in the soil exposure scenario to estimate partitioning between soil and vapor in the exposure
zone, and the particulate emission factor represents the concentration of respirable particulates in
air. The chemical specific values of Di in the VF calculation were obtained from the U.S. EPA
Region 9 Preliminary Remediation Goals Table dated November 1, 2000. Region 9 used several
sources: Superfund Exposure Assessment Manual (U.S. EPA, 1988), Subsurface Contamination
Reference Guide (U.S. EPA, 1990c), Fate and Exposure Data (Howard, 1991), and the
Superfund Chemical Data Matrix (U.S. EPA 1994). Some chemicals required the use of a
surrogate for physicochemical data based on chemical structure and characteristics.
The Soil Screening Level uses modeling to estimate soil concentrations that are
protective of human health exposure to groundwater with a Dilution and Attenuation Factor of 1.
The endpoint that was chosen for the SSL was the MCL from U.S. EPA (2001b) or the risk-
based tap water concentration as calculated in the table if an MCL was not available.
Volatilization Factor
( )
VF m kgQ C D T m cm
Dwhere
DD H D n
K H
A
b A
Aa i w w
b d w a
( / )/ ( . ) ( / )
' /
'
/
/ /
31 2 4 2 2
10 3 10 3 2
314 102
=× × × ×
× ×
=× × + ×
× + + ×
−
ρ
θ θ
ρ θ θ
and: Q/C = 64.177 (residential) 43.07 (commercial/industrial) T = 9.5E+8 seconds ρb = 1.5 g/cm3 θa = 0.28 Lair/Lsoil Di = chemical-specific H’ = H x 41 H = Henry’s Law Constant (chemical-specific) θw = 0.15 Lwater/Lsoil Dw = chemical-specific n = 0.43 Lpore/Lsoil Kd = chemical-specific
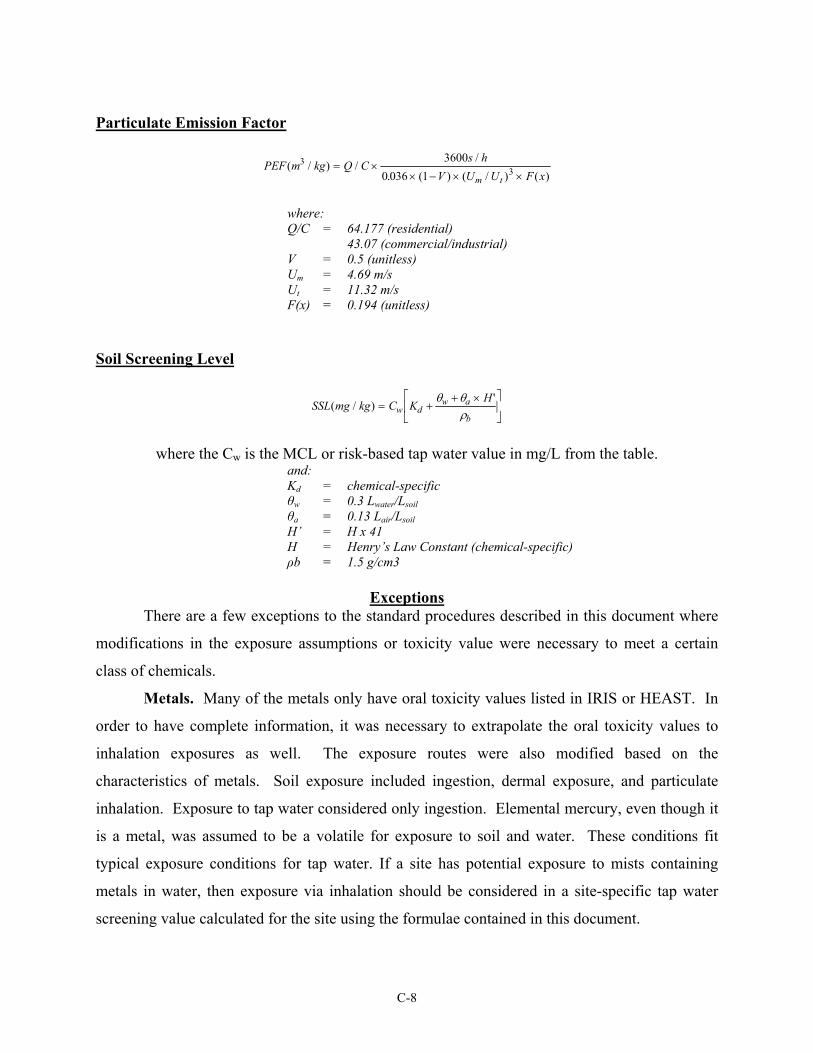
C-8
Particulate Emission Factor
PEF m kg Q Cs h
V U U F xm t( / ) /
/. ( ) ( / ) ( )
33
36000 036 1
= ×× − × ×
where: Q/C = 64.177 (residential)
43.07 (commercial/industrial) V = 0.5 (unitless) Um = 4.69 m/s Ut = 11.32 m/s F(x) = 0.194 (unitless)
Soil Screening Level
SSL mg kg C KH
w dw a
b( / )
'= +
+ ×
θ θρ
where the Cw is the MCL or risk-based tap water value in mg/L from the table.
and: Kd = chemical-specific θw = 0.3 Lwater/Lsoil θa = 0.13 Lair/Lsoil H’ = H x 41 H = Henry’s Law Constant (chemical-specific) ρb = 1.5 g/cm3
Exceptions
There are a few exceptions to the standard procedures described in this document where
modifications in the exposure assumptions or toxicity value were necessary to meet a certain
class of chemicals.
Metals. Many of the metals only have oral toxicity values listed in IRIS or HEAST. In
order to have complete information, it was necessary to extrapolate the oral toxicity values to
inhalation exposures as well. The exposure routes were also modified based on the
characteristics of metals. Soil exposure included ingestion, dermal exposure, and particulate
inhalation. Exposure to tap water considered only ingestion. Elemental mercury, even though it
is a metal, was assumed to be a volatile for exposure to soil and water. These conditions fit
typical exposure conditions for tap water. If a site has potential exposure to mists containing
metals in water, then exposure via inhalation should be considered in a site-specific tap water
screening value calculated for the site using the formulae contained in this document.
C-9
Gases. Some of the constituents on the table are considered to be gases or vapors at
standard temperature. In consideration of their physical state, both soil and water exposure
consider only inhalation since their residence time in soil would not be expected to be long for
ingestion or dermal exposure.
Extrapolation. Some chemicals had only oral or inhalation toxicity values listed on the
Region IX PRGs Table. In those cases, extrapolation was necessary. Literature reviews were
done to verify the potential for effects in other media of exposure.
Lead. U.S. EPA has implemented use of the IEUBK Model to estimate environmental
levels that will result in a target blood lead level. KYDEP performed a review of lead issues
(KYDEP, 1996) and determined that the most appropriate metric for lead risk assessment was
the RfDo and RfDi derived based on the LOAEL in laboratory rats. For further discussion of
lead see the Lead Issues document (KYDEP, 1996). KYDEP also has an action level of 50 ppm
in residential or unrestricted use in soil, 400 ppm in commercial or industrial soils, and a tap
water action level of 0.015 mg/L that are listed on the table. The soil value of 50 mg/kg was
originally developed in the UST program.
MTBE. Methyl t-Butyl Ether had an oral RfD issued by NCEA, which was withdrawn.
The RfD was retained and listed as withdrawn on the table. U.S. EPA has a Drinking Water
Advisory: Consumer Acceptability Advisory level in water of 20 µg/L to 40 µg/L based on odor
and taste, respectively. This is below the carcinogenic and noncarcinogenic risk-based numbers.
PCBs. PCBs also received special consideration. KYDEP has used the high risk value
of 2.0 (mg/kg-day)-1 based on the observation that as a mixture of PCBs weathers, the lower
chlorinated biphenyls are more likely to degrade, leaving the higher chlorinated biphenyls in a
higher proportion. Since the higher chlorinated biphenyl mixture (Arochlor 1260) exhibit more
toxicity, the high-risk value was used for the screening values. For noncarcinogenic effects, the
table has two mixtures listed. Arochlor 1254 is applied by KYDEP for the higher chlorinated
mixtures (Arochlor 1260, 1254, and 1248) and the Arochlor 1016 value is applied to mixtures
that are less chlorinated (1242, 1016).
How To Use the Table
When evaluating an area using the screening values, it is useful to develop a Conceptual
Site Model to verify that it fits into the assumptions that were used to derive the screening
values. The first step is to identify the areas of potential contamination and analyze grab samples
for a broad range of potential contaminants (typically the HSL, TAL/TCL, etc.) in several

C-10
samples to refine analytical parameters. The contaminants of potential concern are then
identified. The potential ecological and human health receptors should be determined and also
the potential pathways of exposure.
The screening values table is organized with the toxicity values in the left-hand columns,
each one followed by the source of the RfD or Slope Factor. The VOC Column identifies (with
“1” being volatile) which compounds use a volatilization factor in the soil exposure. The soil
dermal absorption value is shown for each compound, and the Chemical Abstract Service (CAS)
registry number and contaminant name are shown. The next four columns represent the risk-
based concentration associated with each of the contaminants for soil, air, and water.
The Soil Screening Levels are determined for most volatiles and the compounds listed in
the Soil Screening Guidance (U.S. EPA, 1996c). The Dilution and Attenuation Factor (DAF) of
1 is applicable for a screening value where there is the potential for shallow aquifers, karst
terranes (a major factor in Kentucky), and areas of significant permeability. It is possible to
develop Soil Screening Values for a higher DAF if site-specific information indicates that the
depth to groundwater, soil type, and geological formations support that there is significant
dilution between the contaminated zone and the groundwater. 401 KAR 100:100 Section 5(5)
establishes procedures to modify the SSL based on site-specific conditions.
C-11
References Kentucky Department for Environmental Protection (KYDEP). 1995. Risk Assessment Guidance. Guidance document part of 401 KAR 100:050 regulation package. August 1995. 92 p. Kentucky Department for Environmental Protection (KYDEP). 1996. Lead Issues. Prepared by Risk Assessment Review Group: Albert G. Westerman, Ph.D., Branch Manager, Michelle Nihei Shaw, Ph.D. and Sally L. Wiley, M.S., Analysts. August 5, 1996. 38 p. Howard, P.H. 1990. Handbook of Environmental Fate and Exposure Data for Organic Chemicals. Lewis Publishers, Chelsea, MI. 546 p. Schaum, J., K. Hoang, R. Kinerson, J. Moya, and R.G.M. Wang. 1994. Estimating Dermal and Inhalation Exposure to Volatile Chemicals in Domestic Water. In: Water Contamination and Health: Integration of Exposure Assessment, Toxicology, and Risk Assessment. Rhoda G.M. Wang, Editor. Marcel Dekker, Inc. New York, NY. P. 305-321. United States Environmental Protection Agency (U.S. EPA). 1988. Superfund Exposure Assessment Manual. EPA/540/1-88/001. Office of Remedial Response. Washington, D.C. 157 p. United States Environmental Protection Agency (U.S. EPA). 1989. Risk Assessment Guidance for Superfund Volume I Human Health Evaluation Manual (Part A). EPA/540/1-89/002. Office of Emergency and Remedial Response. Washington, D.C. 276 p. United States Environmental Protection Agency (U.S. EPA). 1990a. Exposure Factors Handbook. EPA/600/8-89/043. Office of Health and Environmental Assessment. Washington, D.C. 276 p. United States Environmental Protection Agency (U.S. EPA). 1990b. National Oil and Hazardous Substances Pollution Contingency Plan. 40 CFR Part 300. Office of Solid Waste and Emergency Response. Washington, D.C. 572 p. United States Environmental Protection Agency (U.S. EPA). 1990c. Subsurface Contamination Reference Guide. EPA/540/2-90/011. Office of Emergency and Remedial Response. Washington, D.C. United States Environmental Protection Agency (U.S. EPA). 1991. Risk Assessment Guidance for Superfund: Volume I-Human Health Evaluation Manual (Part B, Development of Risk-based Preliminary Remediation Goals). Office of Emergency and Remedial Response. Washington, D.C. 54 p. United States Environmental Protection Agency (U.S. EPA). 1994. Superfund Chemical Data Matrix. EPA/540/R-94/009. Office of Solid Waste and Emergency Response. Washington, D.C. United States Environmental Protection Agency (U.S. EPA). 1996a. Region 9 Preliminary Remediation Goals (PRGs). San Francisco, CA. August 1, 1996. 35 p.

C-12
United States Environmental Protection Agency (U.S. EPA). 1996b. Soil Screening Guidance: Technical Background Document. EPA/540/R-95/128. Office of Solid Waste and Emergency Response. Washington, D.C. 497 p. United States Environmental Protection Agency (U.S. EPA). 1996c. Soil Screening Guidance: Users Guide. Publication 9355.4-23. Office of Solid Waste and Emergency Response. Washington, D.C. 44 p. United States Environmental Protection Agency (U.S. EPA). 1997. Health Effects Assessment Summary Tables. Office of Emergency and Remedial Response. Washington, D.C. United States Environmental Protection Agency (U.S. EPA). 1998. Risk Based Concentration Table. U.S. EPA Region III. April 1, 1998. First Presented at EPA Superfund Risk Assessor's Conference, March, 1991. Philadelphia, PA. United States Environmental Protection Agency (U.S. EPA). 2000a. Drinking Water Standards and Health Advisories. Office of Water. Washington, D.C. EPA 822-B-00-001 Summer 2000. United States Environmental Protection Agency (U.S. EPA). 2000b. Region 9 Preliminary Remediation Goals (PRGs). San Francisco, CA. November 1, 2000. 35 p. United States Environmental Protection Agency (U.S. EPA). 2001a. Integrated Risk Information System. Office of Research and Development. National Center for Environmental Assessment. Washington, D.C. Accessed November 2001. http://www.epa.gov/iris/index.html United States Environmental Protection Agency (U.S. EPA). 2001b. National Primary Drinking Water Standards. EPA 816-F-01-007. Office of Water. Washington, D.C. March 2001. www.epa.gov/safewater 4 p. United States Environmental Protection Agency (U.S. EPA). 2001c. Risk Assessment Guidance for Superfund Volume I: Human Health Evaluation Manual (Part E, Supplemental Guidance for Dermal Risk Assessment). Interim Guidance. EPA/540/R-99/005. Office of Solid Waste and Emergency Response. Washington, D.C. PB99-963312.

Appendix D Ecological Screening Values

Appendix E Radionuclide Screening Values

Appendix F Checklist for Ecological Assessment/Sampling

F-1
Checklist for Ecological Assessment/Sampling
I. SITE DESCRIPTION
1. Site Name:
Location:
_______________________________________________________________________________
County: City: State:
2. Latitude: Longitude:
3. What is the approximate area of the site?
4. Please attach to the checklist USGS topographic map(s) of the site, if available.
5. Are aerial or other site photographs available? � yes � no If yes, please attach any available photo(s).
6. What type of facility is located at the site?
� Chemical � Manufacturing � Mixing � Waste disposal
� Other (specify)
7. What are the suspected contaminants of concern at the site? If known, what are the maximum concentration
levels?
8. Do any potentially sensitive environmental areas exist adjacent to or in proximity to the site, e.g., Federal
and State parks, National and State monuments, wetlands, lakes, streams? Remember, flood plains and
wetlands are not always obvious; do not answer "no" without confirming information.
9. Please provide the source(s) of information used to identify these sensitive areas, and indicate their general location on the site map.

F-2
10. The land use on the site is: The area surrounding the site is:
____________________ mile radius
_____% Urban _____% Urban
_____% Rural _____% Rural
_____% Residential _____% Residential
_____% Industrial (� light � heavy) _____% Industrial (� light � heavy)
_____% Agricultural _____% Agricultural
(Crops: ) (Crops: )
_____% Recreational _____% Recreational
(Describe; note if it is a park, etc.) (Describe; note if it is a park, etc.)
_____% Undisturbed _____% Undisturbed
_____% Other _____% Other
11. If known, what is the approximate depth to the water table?
12. Is the direction of surface runoff apparent from site observations? � yes � no If yes, to which of the
following does the surface runoff discharge? Indicate all that apply.
� Surface water � Groundwater � Sewer � Collection impoundment
13. Is there a navigable waterbody or tributary to a navigable waterbody? � yes � no
14. Is there a waterbody anywhere on or in the vicinity of the site?
� yes (approx. distance____________________) � no
15. Is there evidence of flooding? � yes � no Wetlands and flood plains are not always obvious; do not
answer "no" without confirming information.
16. Are any threatened and/or endangered species (plant or animal) known to inhabit the area of the site?
� yes � no
17. Are there any wooded areas at the site? � yes � no.

F-3
18. What percentage or area of the site is wooded? (_____% _____ acres). Indicate the wooded area on the site map which is attached to a copy of this checklist.
19. Is shrub/scrub vegetation present at the site? � yes � no.
20. What percentage of the site is covered by scrub/shrub vegetation? ( _____% _____ acres). Indicate the areas of shrub/scrub on the site map.
21. Are there open (bare, barren) field areas present at the site? � yes � no
22. What percentage of the site is open field? ( _____% _____ acres). Indicate the open fields on the
site map.
23. Based on observations and/or available information, are designated or known wetlands definitely present at
the site? � yes � no
24. Please note the sources of observations and information used (e.g., USGS Topographic Maps, National Wetland Inventory, Federal or State Agency, etc.) to make this determination.
25. CONTINUE WITH ECOLOGICAL RISK ASSESSMENT. YES_____ NO_____
Record weather conditions at the time this checklist was prepared:
DATE:
Temperature (EC/EF) Normal daily high temperature
Wind (direction/speed) Precipitation (rain, snow)
Cloud cover
Completed by Affiliation
Additional Preparers
Site Manager
Date

Appendix G Development of Generic Background
Concentrations for Kentucky Soils
G-1
Development of Generic Background Concentrations for Kentucky Soils
Background, as defined in 401 KAR 42:005 (definitions codified to support the Underground
Storage Tank regulations), means the concentration of substances consistently present in the
environment at, or regionally proximate to, a release but outside the influence of the release.
There are two types of background:
a) Natural background is the amount of naturally occurring substances in the environment,
exclusive of that from anthropogenic sources.
b) Ambient background means the concentrations of naturally-occurring inorganic substances
and ubiquitous anthropogenic inorganic substances in the environment that are representative
of the region surrounding the site and not attributable to activities on the property.
Since sites undergoing environmental assessment are often found in industrialized and
potentially contaminated areas, the determination of site-specific background concentrations is
difficult. Generic ambient background values applicable to all sites in Kentucky would be useful
for comparison to site data for the purpose of identifying those constituents requiring remedial
action (i.e., removal or exposure control). These generic ambient background values would
provide a party or VERP applicant an alternative to attempting to identify site-specific
background soils in areas that are likely contaminated.
To address this issue, the NREPC used background sample values provided by regulated
facilities, as well as background sample values collected by cabinet employees. These samples
were collected from areas generally considered to be outside of the influence of site activities,
but were potentially impacted by regional or citywide activity. Therefore, these samples
represent “ambient,” as opposed to “natural,” background. From 400 to over 800 samples for
each constituent were used in the analysis. For each constituent, a 95% Upper Confidence Limit
(UCL) of the arithmetic mean, 60th Percentile, and 95th percentile were calculated. The 95%
UCL is the value that represents that the mean of the data set falls below that value with 95%
confidence. The 60th and 95th percentiles indicate that 60 percent and 95 percent of the data falls
below those values.
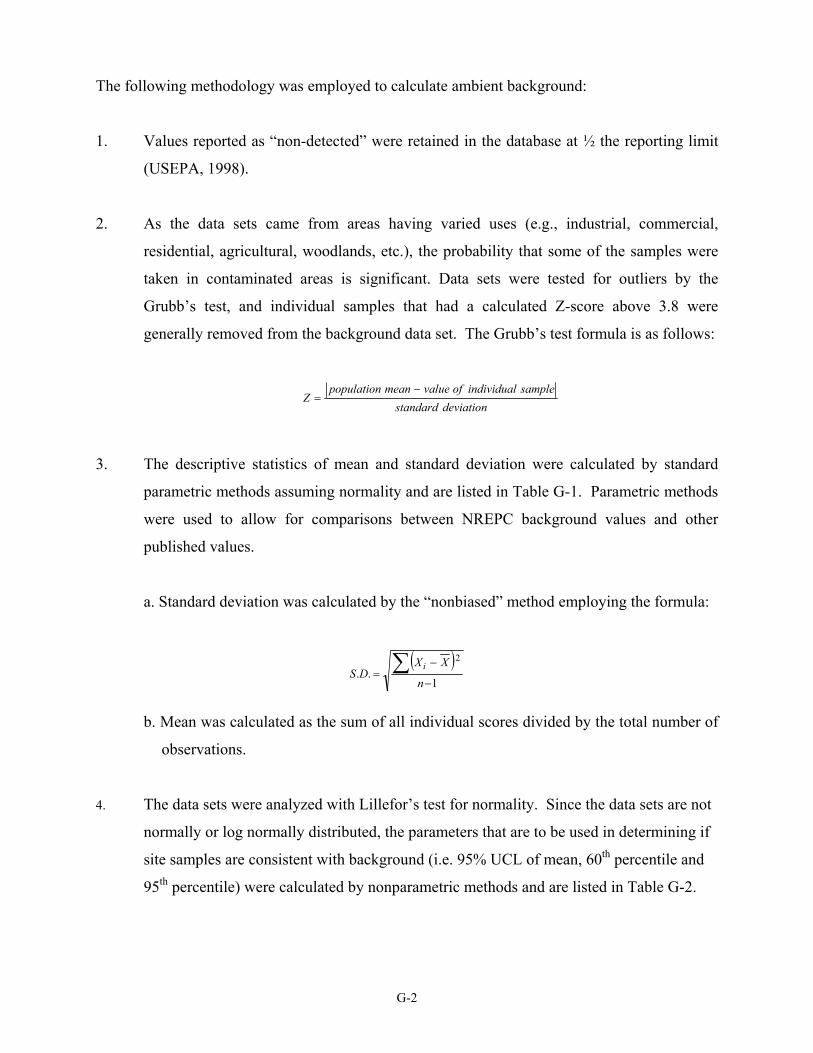
G-2
The following methodology was employed to calculate ambient background:
1. Values reported as “non-detected” were retained in the database at ½ the reporting limit
(USEPA, 1998).
2. As the data sets came from areas having varied uses (e.g., industrial, commercial,
residential, agricultural, woodlands, etc.), the probability that some of the samples were
taken in contaminated areas is significant. Data sets were tested for outliers by the
Grubb’s test, and individual samples that had a calculated Z-score above 3.8 were
generally removed from the background data set. The Grubb’s test formula is as follows:
deviationdardtanssampleindividualofvaluemeanpopulation
Z−
=
3. The descriptive statistics of mean and standard deviation were calculated by standard
parametric methods assuming normality and are listed in Table G-1. Parametric methods
were used to allow for comparisons between NREPC background values and other
published values.
a. Standard deviation was calculated by the “nonbiased” method employing the formula:
( )1
..2
−
−= ∑
n
XXDS
i
b. Mean was calculated as the sum of all individual scores divided by the total number of
observations.
4. The data sets were analyzed with Lillefor’s test for normality. Since the data sets are not
normally or log normally distributed, the parameters that are to be used in determining if
site samples are consistent with background (i.e. 95% UCL of mean, 60th percentile and
95th percentile) were calculated by nonparametric methods and are listed in Table G-2.
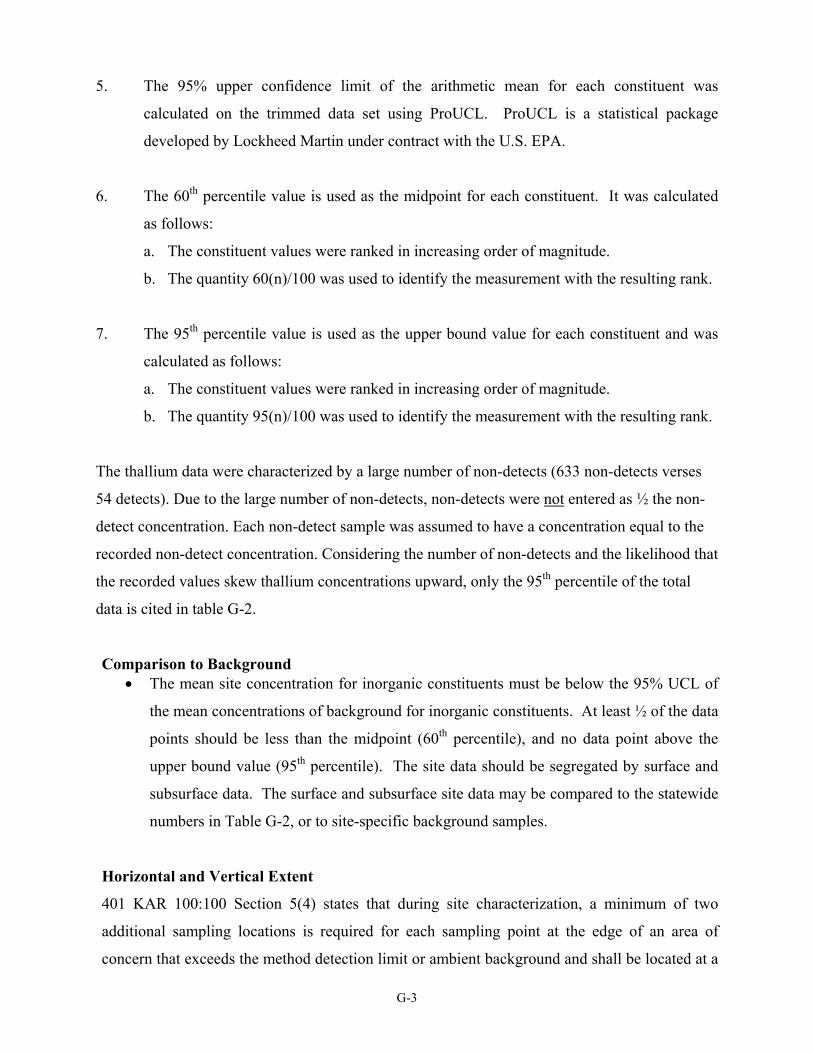
G-3
5. The 95% upper confidence limit of the arithmetic mean for each constituent was
calculated on the trimmed data set using ProUCL. ProUCL is a statistical package
developed by Lockheed Martin under contract with the U.S. EPA.
6. The 60th percentile value is used as the midpoint for each constituent. It was calculated
as follows:
a. The constituent values were ranked in increasing order of magnitude.
b. The quantity 60(n)/100 was used to identify the measurement with the resulting rank.
7. The 95th percentile value is used as the upper bound value for each constituent and was
calculated as follows:
a. The constituent values were ranked in increasing order of magnitude.
b. The quantity 95(n)/100 was used to identify the measurement with the resulting rank.
The thallium data were characterized by a large number of non-detects (633 non-detects verses
54 detects). Due to the large number of non-detects, non-detects were not entered as ½ the non-
detect concentration. Each non-detect sample was assumed to have a concentration equal to the
recorded non-detect concentration. Considering the number of non-detects and the likelihood that
the recorded values skew thallium concentrations upward, only the 95th percentile of the total
data is cited in table G-2.
Comparison to Background • The mean site concentration for inorganic constituents must be below the 95% UCL of
the mean concentrations of background for inorganic constituents. At least ½ of the data
points should be less than the midpoint (60th percentile), and no data point above the
upper bound value (95th percentile). The site data should be segregated by surface and
subsurface data. The surface and subsurface site data may be compared to the statewide
numbers in Table G-2, or to site-specific background samples.
Horizontal and Vertical Extent
401 KAR 100:100 Section 5(4) states that during site characterization, a minimum of two
additional sampling locations is required for each sampling point at the edge of an area of
concern that exceeds the method detection limit or ambient background and shall be located at a

G-4
minimum distance of ten (10) feet from the previous sampling point that had a confirmed
exceedance of method detection limits, or ambient background. The following criteria may be
used to determine if the sampling point exceeds generic or site-specific ambient background.
• If the value for the individual sample is less than the 95% UCL of the arithmetic mean
of background, then no additional samples are required.
• If the sampling point is greater than the 95th percentile of background, then a minimum
of two additional sampling points are required.
• If the sampling point is between the 95% UCL of background and the 95th percentile of
background, then the complete dataset needs to be evaluated to determine if two
additional sampling locations are required. If at least half of all data points at the edge
of the AOC are at or below the 95% UCL of background and the remaining data points
are between the 95% UCL of background and the 95th percentile of background, then no
additional samples are required. If this criteria is not met, then two additional sampling
points are required.
The cabinet may require additional sample locations if the data indicate that the extent of
contamination has not been determined.
G-5
Literature Cited
United States Environmental Protection Agency (USEPA), 1995. Determination of Background Concentrations of Inorganics in Soils and Sediments at Hazardous Waste Sites. Office of Research and Development. Office of Solid Waste and Emergency Response. EPA/540/S-96/500. December, 1995.
United States Environmental Protection Agency (USEPA), 1998. Statistical Tests for Background Comparison at Hazardous Waste Sites. Supplemental Guidance to RAGS: Region 4 Bulletins – Addition #1. Interim Draft. USEPA Region 4, Waste Management Division. Atlanta, Georgia. November, 1998.
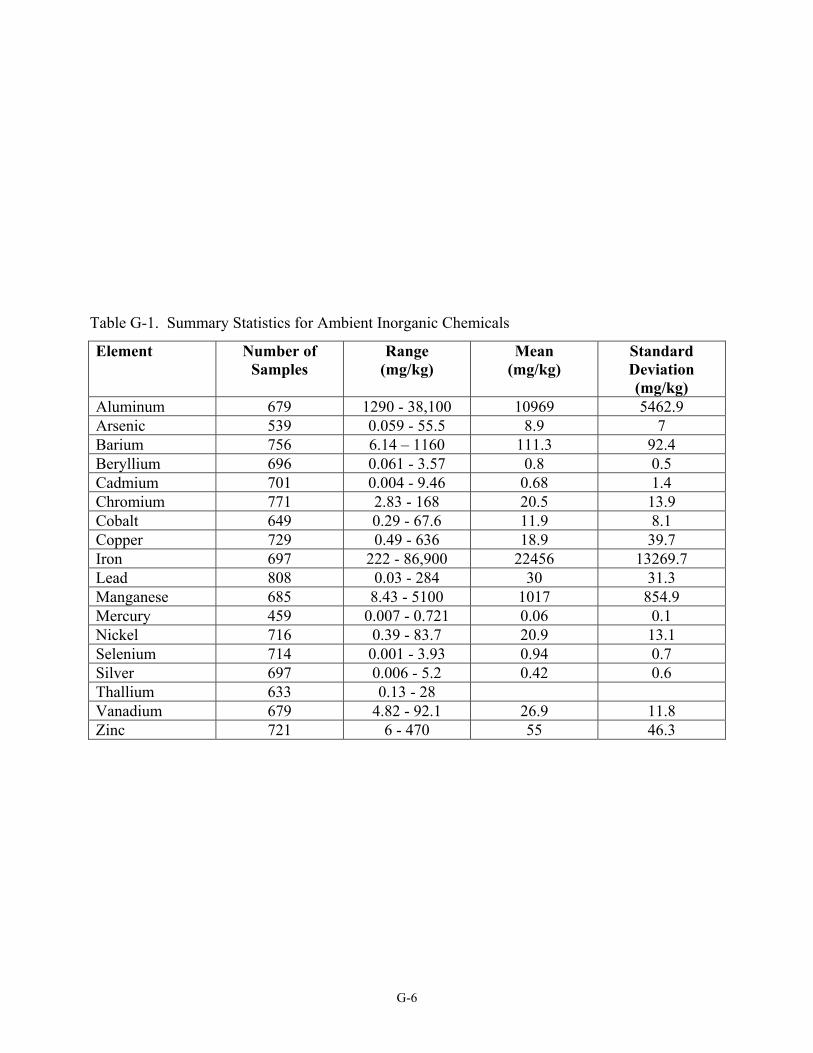
G-6
Table G-1. Summary Statistics for Ambient Inorganic Chemicals
Element Number of Samples
Range (mg/kg)
Mean (mg/kg)
Standard Deviation (mg/kg)
Aluminum 679 1290 - 38,100 10969 5462.9 Arsenic 539 0.059 - 55.5 8.9 7 Barium 756 6.14 – 1160 111.3 92.4 Beryllium 696 0.061 - 3.57 0.8 0.5 Cadmium 701 0.004 - 9.46 0.68 1.4 Chromium 771 2.83 - 168 20.5 13.9 Cobalt 649 0.29 - 67.6 11.9 8.1 Copper 729 0.49 - 636 18.9 39.7 Iron 697 222 - 86,900 22456 13269.7 Lead 808 0.03 - 284 30 31.3 Manganese 685 8.43 - 5100 1017 854.9 Mercury 459 0.007 - 0.721 0.06 0.1 Nickel 716 0.39 - 83.7 20.9 13.1 Selenium 714 0.001 - 3.93 0.94 0.7 Silver 697 0.006 - 5.2 0.42 0.6 Thallium 633 0.13 - 28 Vanadium 679 4.82 - 92.1 26.9 11.8 Zinc 721 6 - 470 55 46.3

G-7
Table G-2. Generic Statewide Ambient Background for Kentucky
Element Mean (mg/kg) 95% UCL of Mean (mg/kg)
60th Percentile (mg/kg)
95th Percentile (mg/kg)
Aluminum 10969 11314 10800 21000 Arsenic 8.9 9.4 8.3 21.2 Barium 111.3 116.9 100 241 Beryllium 0.8 0.83 0.75 1.8 Cadmium 0.68 0.78 0.27 3.9 Chromium 20.5 21.3 19.3 40 Cobalt 11.9 12.4 13.1 25.1 Copper 18.9 21.3 13.8 41.7 Iron 22456 23284 22000 47600 Lead 30 33 20.9 84.6 Manganese 1017 1071 948 2620 Mercury 0.06 0.07 0.059 0.14 Nickel 20.9 21.7 20.2 46.8 Selenium 0.94 0.99 1.38 2.1 Silver 0.42 0.45 0.257 1.2 Thallium 7.95 Vanadium 26.9 27.7 27.3 48.6 Zinc 55 57 48.6 115