kuoni water management manual for hotels - kuoni...
TRANSCRIPT

Kuoni Water Management
Manual for Hotels
thailand

About this Book Introduction Becoming a Kuoni Water Champion Skills Map 1 Planning 2 Data Collection 3 Cost Benefit Analysis 4 Defining the Action Plan 5 Monitoring 6 Training Staff 7 Creating Customer Awareness Conclusion
Annex I References & Online Tools II Sample Worksheets III Average Water Consumption Figures IV Rainwater Harvesting V Meter Installation Tips VI Water Saving Technologies VII Improving Irrigation Systems VIII Detecting Leaks IX Other Water Saving Technologies
Table of Contents
469131519293543475155
565858
80818283878889

4
about the Kuoni GroupKuoni’s head office is located in Zurich, Switzerland, where Alfred Kuoni founded the company in 1906 Over the years Kuoni has developed into today’s global travel services company, now employing around 12 000 people in more than 60 countries In its European source markets the company has more than 160 of its own retail outlets and tour operating offices
Its global destination travel services business has several different types of office: sales offices in the source markets, particularly in Asia for group travel business; agency offices that look after guests at the destinations; offices dedicated to buying in and selling online-based destination services; and offices specialising in MICE business (meetings, incentives, conferences and events) Visa services provider VFS Global (external consular services) runs a worldwide business through more than 500 offices spread across every continent Overall, counting all business activities, Kuoni has more than 700 offices in 62 countries around the world
www.kuoni.com
about the water consultant in thailandNicolas Dubrocard has been working on water and sustainability issues with hotels for the past decade He has been the International Director of Green Key, an international eco-label implemented in 40+ countries, and prior to that he managed the Every Drop Counts Programme for the Travel Foundation in Morocco Nicolas's knowledge of sustainability management is further strengthened through his work auditing more than 100 eco-hotels in 25 countries Most recently based in Bangkok he adapted Kuoni Water Management manual and tools for use in the Thai context, in addition to implementing the project in Thailand for partnering hotels
This book is designed to help hotels and tourism businesses that are interested in meeting consumer expectations and in contributing to a more sustainable tourism by committing to improved water management practices This manual aims to provide an introduction to the business skills required to measure, monitor, manage and reduce water consumption in hotels in order to have a more cost effective and environmentally sound water management system It was created as part of Kuoni’s commitment to improving sustainable management throughout its supply chain Upon success-ful completion of each step outlined in this manual, the participant should be well on their way to achieving the award status of Kuoni Water Champion and to use this award in any communication with its customers
After a successful roll-out of the Water Manual in Kenya in 2013, Kuoni has decided to replicate the project in another key destination, being Thailand To this end, the initial Kenyan Manual and tools were adapted to the Thai context and realities
The book begins with an introduction and an explanation of the Kuoni Water Champion program It is then split into seven sections based on a series of worksheets which should be completed in numerical order The sections are: Planning, Data Collection, Cost Benefit Analysis, Defining the Action Plan, Monitoring, Training Staff and Creating Customer Awareness Reference materials are located in the Annex and the user is guided to those relevant for each particular task
A memory stick accompanying the manual includes the worksheets in Excel format as well as videos in English and Thai languages It is recommended that the hotel’s facilities manager or the person in charge of implementing this project keep a master copy of the worksheet files and be responsible for updating them on a continual basis
It is recognised that economics is a strong driving factor in many decision making processes, therefore the manual and associated tools have been designed to enable the hotel’s facilities manager or water project manager to generate costs (both present and future) relating to water supply and consumption Armed with these figures, it is possible to compare current costs with those resulting from improved water management through a cost benefit analysis exercise For further information on this book and the project, please contact:
Kuoni GroupCorporate ResponsibilityNeue Hard 78010 ZurichSwitzerlandcr@kuoni comT +41 44 277 50 06
www.kuoni-group.com
About this Book

Such inequalities often lead to conflict between tourism businesses and local communities A survey by the World Travel Market showed that 53% of hotel managers felt their business was already impacted by water shortages (2007) In Zanzibar, for example, water scarcity has led some hotel managers to employ security guards to protect water pipes following sabotage attempts by angry locals, according to Tourism Concern (2011) It is also the responsibility of tourism businesses to respect human rights, as outlined in the UN Guiding Principles on Business and Human Rights, and in this light to respect the right to water of local communities in tourism destinations This is not only a moral obligation – rather this helps companies to identify and manage a range of operational, financial and reputation risks (UNHRC, 2011)
This book is targeted at hotels and tourism business that are interested in meeting consumer expectations and in contributing to a more sustainable tourism by committing to improved water management practices This manual, based on the Kenyan Water Management Manual published in 2013, aims to provide an introduction to the business skills required to measure, monitor, manage and reduce water consumption in hotels in order to have a more cost effective and environmentally sound water management system It has especially been designed for the context in Thailand, taking into account the different issues that Thai hotels are facing: less threat regarding salt damages to pipes and machines, more concerns about cooling towers, different levels of humidity, strong rainy season during monsoon, etc Any hotel committing to the step-by-step process outlined in this manual will be eligible for the Kuoni Water Champion Award and experience significant reductions in water consumption and costs, as described in more detail at a later point in this book
tourism and Water scarcity in thailand
Bangkok has beaten London to the number one spot as 2013's most popular tourist destination. Tourism is a major economic factor in the Kingdom of Thailand. On June 1, 2013, Time magazine reported that Bangkok was identified as the most visited city in the world by the 2013 Global Destination Cities Index, while Suvarnabhumi Airport was the world's most geotagged location on Instagram in 2013.
The total contribution of travel and tourism to gross domestic product (GDP) in Thailand is projected to rise by 0.1% in 2014 from 2.4 trillion baht recorded in 2013, according to a report by the World Travel & Tourism Council. The council said the industry contribution to GDP was 20.2% in 2013. The sector contributed to 15.4% of jobs in 2013, including those indirectly supported by the sector with a total of 6.01 million.
The Director of the Thai Meteorological Department's Central Weather Forecast Division, said after he studied several weather forecast models, that the El Nino phenomenon would start in Thailand in 2014.As a result, Thailand would not have enough water this year and next year as the phenomenon reduces rainfall. According to the Electricity Generating Authority of Thailand, water retained in Bhumibol and Sirikit dams, Thailand's biggest reservoirs, is well below the 10-year average. The agency warned that this could affect all activities that depend on water from the two reservoirs, either for agricultural or consumption purposes.
References: The Nation 8th April 2014 and 14th March 2014
Demand for sustainable tourism is on the rise Consumers are increasingly requesting that hotels and tourism business provide sustainable and environmentally friendly products According to a study by the Association of British Travel Agents (ABTA), one in three travellers now believes that their vacation products should have an environmental rating In 2012 TripAdvisor, the world's largest travel site announced the results of its eco-friendly travel survey of more than 700 U S travellers The green travel trend is gaining momentum among TripAdvisor members, as 71 percent said they plan to make more eco-friendly choices in the next 12 months compared to 65 percent that did so in the past 12 months
Taking a sustainable approach can also reduce costs and improve efficiency For example, according to the UK’s Environment Agency, Hotels can reduce the amount of water consumed per guest per night by up to 50% compared with establishments with poor performance in water consumption
However, despite its potential for positive contributions, tourism can sometimes be at odds with sustainable development as a whole and with environmental sustainability in particular Current research indicates that the disproportionate use of fresh water by tourists in developing country destinations is, in many cases, directly contributing to water scarcity, poverty and
inequity, through the appropriation of public water supplies, overexploitation of aquifers, and lowering of groundwater tables Furthermore, tourism business have been implicated in spreading diseases by contaminating freshwater by saltwater and sewage (Tourism Concern, 2011)
A recent study by Tapper et al (2011) found that on a per tourist basis, the tourism sector uses between one and a half to two and a half times the daily amount of water used by a local resident in the Mediterranean and Caribbean In North African destinations between four to ten times as much water was used Kenya and Sri Lanka were shown to have about 18 to 20 times as much water used per tourist
The UNFAO Aquastat database, a global information system on water and agriculture, indicates that in Thailand tourism activities need daily 6 to 8 times more water than local communities These statistics do not take into account unmonitored water extraction methods by the tourism industry, such as boreholes and wells, which can have an even greater impact Golf tourism in particular has an enormous impact on water withdrawals – according to UNESCO an eighteen-hole golf course can consume more than 2 3 million litres a day, which corresponds to the daily water needs of approximately 20,000 people
Intro- duction

9
corporate responsibility at Kuoni
Kuoni has been striving for over ten years now to enhance the positive impact of tourism on people and the environment and simultaneously minimise its negative ramifications Kuoni and its staff are convinced that the company can make a major contribu-tion to ensuring sustainable tourism development within its scope and the resources at its disposal
Over these ten years, Kuoni has extensively integrated its Corporate Responsibility activities into its overall business strategy On the basis of the overall Group CR strategy for 2013-2015, the CR risk assessment and the subsequent definition of the materiality matrix, the focus issues for corporate responsibility within the Kuoni Group are:
1. its employees;2. sustainable supply chain management;3. sustainable products;4. human and labour rights;5. natural resources and climate change and6. governance/compilance
For each of these focus issues, a road map has been developed and specific goals have been defined, which are available on the Kuoni Group website
Becoming a Kuoni Water Champion
Sustainability topics of relevance to Kuoni
Human Rightsh Child protection h Working conditions
Governance/Compilanceh Anti Corruptionh Ethics and transparency
Community engagement
Cultural Heritage
Social investments
HIGH
HIGHMoNIToRING / loW EFFoRT
Sustainable supply chain management
Natural Resourcesh Water scarcityh Loss of biodiversity
Impacts of Climate Change and regulations
Sust
aina
bilit
y to
pics
of
conc
ern
to s
take
hold
ers
Kuoni’s degree of influence
Sustainable Productsh Product
Innovationh Customer
satisfactionh Social Media
Employeesh Occupational
Health&Safetyh Employee
Engagementh Leadership
Active management / High risk areas

1110
As seen in the above Materiality Matrix, Kuoni places great impor-tance on engaging with suppliers toward a collaborative and more sustainable tourism The company has defined its minimal require-ments towards its suppliers in the Kuoni Supplier Code of Conduct, a policy document which requires suppliers to adhere to human and labour rights, compliance with local law and environmental standards, non-discrimination, anti-corruption, work place safety and hygiene and child protection Kuoni suppliers agree to report on their compliance and progress and allow their properties to be inspected by Kuoni upon request In case of a breach of the terms and conditions of the Supplier Code of Conduct Kuoni is entitled to terminate any contract and cooperation with the supplier with immediate effect and reserves the right to take any further legal action at its discretion To this purpose Kuoni monitors the sustain-ability performance of its core hotel partners biennially through an on-site check These core hotels cover more than 35% of Kuoni’s leisure travel guests out of Europe Furthermore, Kuoni plans to monitor 60% of its B2B business division guests in 2015
Kuoni aligns its monitoring process of core hotel partners with the internationally recognised system for sustainable tourism management, the Travelife Sustainability System, and shares data with other tour operators across Europe The Travelife Sustain-ability System invites hotels to conduct an online self-assessment which gives them an initial benchmark of their sustainability performance In a second step, an auditor trained by Travelife or another recognised sustainability scheme carries out an audit toassess the social and environmental performance of the hotel Hotels demonstrating excellent sustainability performance are awarded the Travelife label, enabling their achievement to be clearly communicated to customers There are 16 Travelife certified hotels in Thailand (October 2014)
Kuoni values its relationships with sustainable hotels and accommodation and aims to promote them with our customers by displaying the Travelife label in our catalogues and by highlighting hotels achieving sustainable water management practices through the Kuoni Water Champion Award as described below
Within its Corporate Responsibility program, Kuoni aims to ensure adequate access to precious water resources for all people at water-scarce destinations where conflicts arise between the requirements of the tourist sector and the needs of the local population
Water scarcity and its effective management in the supply chain is an integral part of Kuoni’s Statement of Commitment on the Environment published in 2013 and was the focus of the Kuoni Stakeholder Dialogue in 2010, a formalised dialogue process with approximately 30 representatives and experts from external organizations such as the World Water Council, the United Nations Environment Programme, as well as several internal representa-tives, meeting to suggest concrete opportunities for action
As a result of the Stakeholder Dialogue, four key areas for approaching the topic of freshwater management have been identified, namely promoting technical solutions and operational improvements in hotels, creating standards in the supply chain, investment in community projects to minimise adverse impacts of water competition and communication to customers Actions based on these working streams have been successfully implemented in the pilot destination – Kenya The outcome of the pilot project was; 60% of Kuoni suppliers participated in the workshops organized both in the northern and southern coasts of Mombasa and 3 hotel partners achieved the prestigious Kuoni Water Champion Award
Following the successful roll-out in Kenya, Kuoni has selected Thailand as follow-up project destination Thailand, same as Kenya was selected based on a multicriteria decision analysis Criteria used included passenger volume and water scarcity statistics from the World Business Council for Sustainable Development’s Global Water Tool among others Even if the Water Management Manual covers the same areas where improvements may be made with regards to water consumption, differences exist between Kenya and Thailand Participating hotels in Thailand were selected based on customer volumes in Bangkok and Phuket, providing a wide range of case studies In Bangkok, the Municipality Network delivers most of the water to the hotels while, in Phuket, water can be sourced from wells, rainwater reservoirs and even from water trucks The climate is also playing an important role as the monsoon in Thailand has a dramatic impact on water resources Moreover, the high level of humidity in Thailand has consequences on water consumption Most hotels in Bangkok use cooling towers, which represent up to 30% of the entire water consumption
Working with our Suppliers
Launched by Kuoni, in collaboration with Green Water under the framework of the Water Management Project in Kenya in 2013 the Water Champion Award aims at recognising outstand-ing water management practices of hotels
Participation in the program can substantially reduce costs and improve efficiency It is recognised that economics is a strong driving factor in many decision making processes, therefore the manual and associated tools have been designed to enable the hotel manager to generate cost benefit analysis resulting from improved water management Having a Water Management Program (in place is the only way these costs may be quantified and represents a powerful tool for decision makers to implement water saving activities
Participants in the Kuoni Water Champion program in Thailand have found, for example:h A potential reduction in water consumption of 24,000m³
per year could be achieved, with an equivalent value of 500,000THB (15,715 USD) per year
h Staff showers were utilising a far higher flow rate than necessary Replacing these fixtures at a cost of 38,000THB (1,170 USD) would result in savings of 173,000THB (5,383 USD) per year, with a payback period of 2-3 months Water saved amounted to 25,000 m3 per year, equivalent to nearly 10% of the hotel’s total water consumption
h Harvesting rainwater from the roofs of the hotel allowed 2,000 cubic meters yearly saving, equivalent to 200,000 THB (6,297 USD) per year as the water is sourced from expensive water trucks
In addition, committing to achieve Kuoni Water Champion sta-tus has various other benefits, which go beyond the bottom line Participation in the program can help reduce the risk of conflict with the local community and thereby help legitimise the tourism business It also increases staff engagement According to Business in the Community, 75% of employees who believe their organization is focused on sustainable development show high levels of commitment
Generally, participating in the program can help you gain a competitive edge and market your tourism business towards a more environmentally conscious consumer And, as mentioned previously, this market segment is growing A recent survey from the Institute of Tourism (Lucerne University of Applied Sciences and Arts) found that 22% of customers consider sustainability as one of their Top 3 deciding factors when choosing a hotel Visitors want to know that their trip is not having a negative impact on the environment, and with the Kuoni Water Champion Award you can let them know what you are doing
The Kuoni Water Management Project
Benefits to Achieving the Kuoni Water Champion Award
Kuoni Water champion candidate: indra regentPRoFIlE: City hotel based in Bangkok, capacity of 920 PAX INITIAl WATER CoNSuMPTIoN 740 litres/bednight RESulTING WATER CoNSuMPTIoN 622 litres/bednight
= 16% savingsImprovement plan included: h Installation of multiple meters to establish where water is being used
h Installation of efficient showerheads h Installation of new toilets using either 3 or 4,5 litres per flush h Training of staff on water saving
Kuoni Water champion candidate: amari Watergate
PRoFIlE: City hotel based in Bangkok, capacity of 1100 PAX INITIAl WATER CoNSuMPTIoN 720 litres/bednight RESulTING WATER CoNSuMPTIoN 600 litres/bednight
= 20% savingsImprovement plan included: h Installation of multiple meters to establish where water is being usedh Installation of efficient showerheads h Implementation of a waste water treatment system to reuse the water for cooling towers (100m3 saved per day)
h Training of staff on water saving
Kuoni Water champion candidate: KatathaniPRoFIlE: Hotel along the southern coast of Phuket, capacity of 1400 PAX INITIAl WATER CoNSuMPTIoN 500 litres/bednight RESulTING WATER CoNSuMPTIoN 425 litres/bednight
= 15% savingsImprovement plan included: h Implementation of a new towel and bed linen reuse program rewarding the participating guests
h Training of staff on water saving

1312 | sKills map
✓ Commit to a long-term engagement on sustainable water management together with Kuoni
✓ Purchase and install water meters in strategic locations in order to define water consumption throughout the hotel (e.g. laundry, kitchen, pool, gardens/lawns, guest rooms, staff rooms, spa, etc.)
✓ Collect basic water consumption data and complete simple calculations through the worksheets detailed within this manual
✓ Log water consumption over a period of a few weeks and analyse consumption per guest night
✓ Implement water saving practices (technical solutions, staff training, etc.)
✓ Continue logging consumption data and calculate savings achieved
✓ Report on your success and action plan to Kuoni
✓ Commit to ‘access to water’ (or improved quality of water) related community project
✓ Demonstrate an increased level of guest awareness and participation
✓ Show off your Kuoni Water Champion Award!
10 Steps to Become a Kuoni Water Champion
Section After completing thiS Section, you will:
1. planning • Have an understanding of the steps involved for a successful water management in
your hotel
• Be able to form a water management team in your hotel
• Know the skills required to run a water management program
2. Data Collection
• Know where water is supplied from
• Know where and how water is used and in what quantities
• Know the importance of logging water consumption by using several meters
throughout the hotel property
• Know what costs are associated with the current system
3. Cost Benefit
Analysis
• Know what water and cost savings are achievable throughout your water systems
• Have an overview of which plumbing fixtures can work as cost-effective replacements
for outdated systems
• Be familiar with the benefits of installing a water treatment system
4. Defining the
Action Plan
• Understand how to choose the right water consumption reduction targets for your
business• Have an overview of what kinds of improvements can be achieved in what time
frame
5. Monitoring • Understand why continuing to monitor your water consumption in the long-term is
key to successful water managemen
6. Training Staff • Know which departments in your hotel would benefit from a training session on
water management
• Know what training resources are already available
7. Creating Customer
Awareness
• Have an overview of how to communicate your sustainable water management with
clients• Gather ideas on how to include your clients in water-related local community projects
Skills Map

Planning
1
Which stakeholders and em-ployees in the hotel are involved in effective water management? What are their roles and re-sponsibilities? How can they best prepare for their individ-ual tasks? This section provides information on how to plan and prepare for a successful water management in your hotel
1716
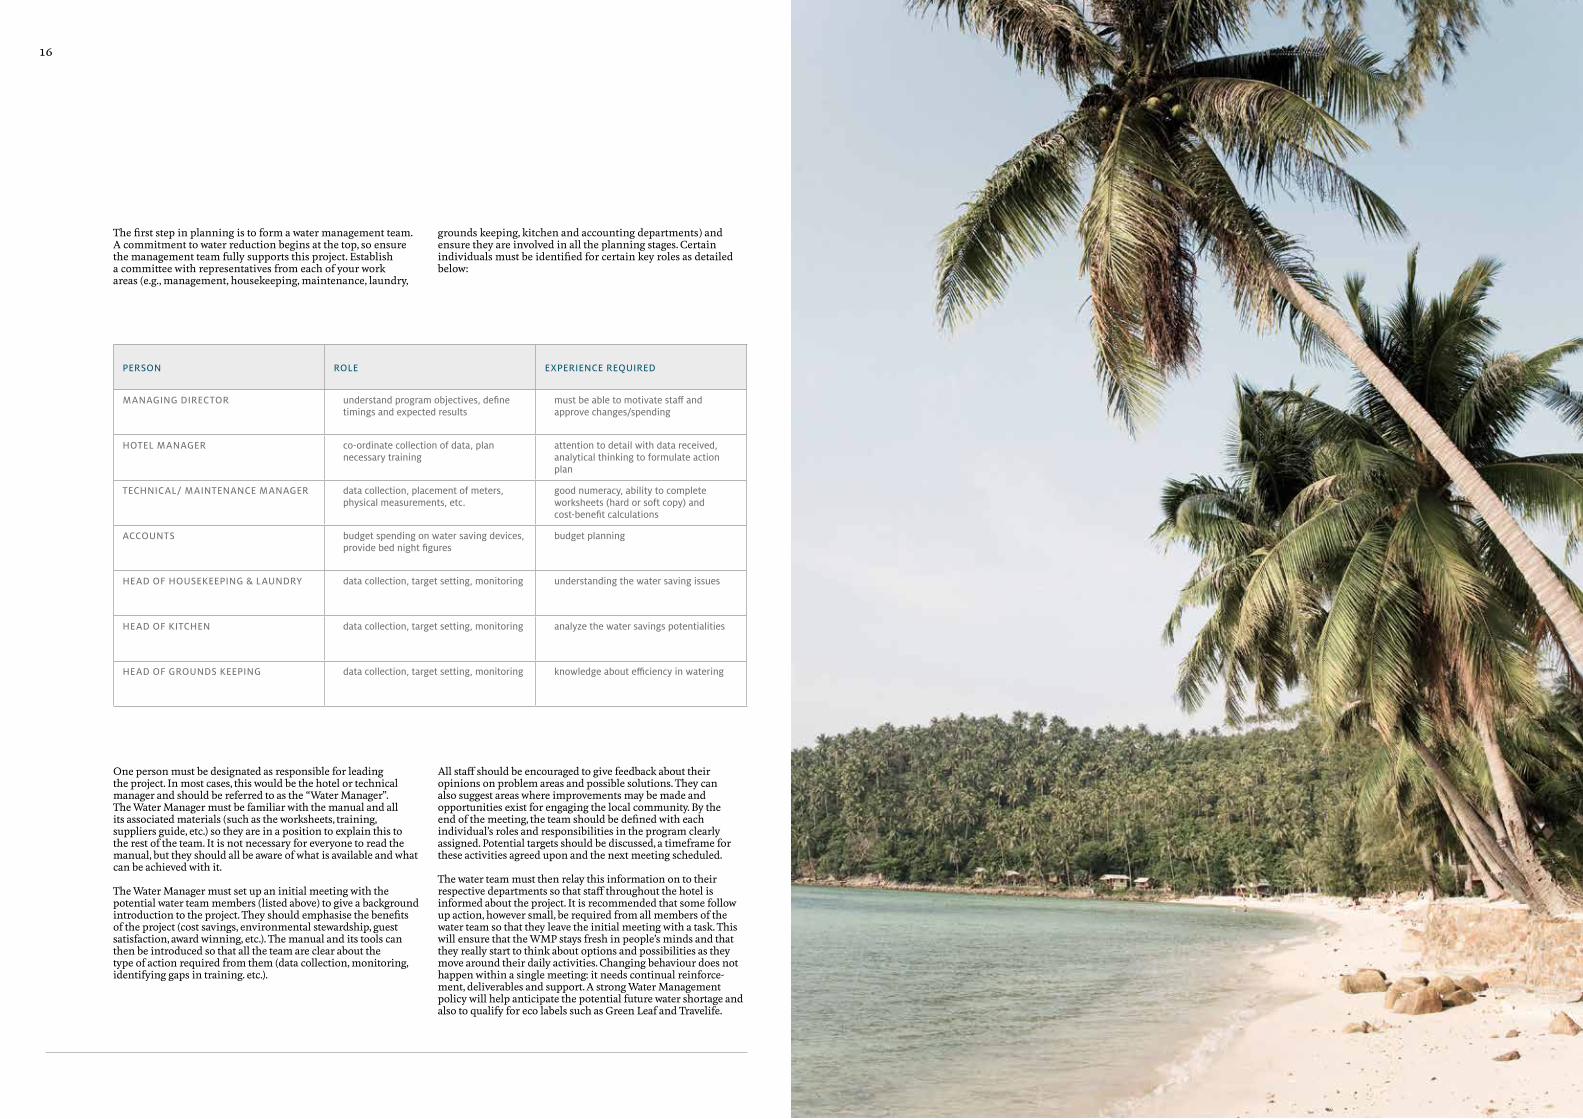
The first step in planning is to form a water management team A commitment to water reduction begins at the top, so ensure the management team fully supports this project Establish a committee with representatives from each of your work areas (e g , management, housekeeping, maintenance, laundry,
grounds keeping, kitchen and accounting departments) and ensure they are involved in all the planning stages Certain individuals must be identified for certain key roles as detailed below:
One person must be designated as responsible for leading the project In most cases, this would be the hotel or technical manager and should be referred to as the “Water Manager” The Water Manager must be familiar with the manual and all its associated materials (such as the worksheets, training, suppliers guide, etc ) so they are in a position to explain this to the rest of the team It is not necessary for everyone to read the manual, but they should all be aware of what is available and what can be achieved with it
The Water Manager must set up an initial meeting with the potential water team members (listed above) to give a background introduction to the project They should emphasise the benefits of the project (cost savings, environmental stewardship, guest satisfaction, award winning, etc ) The manual and its tools can then be introduced so that all the team are clear about the type of action required from them (data collection, monitoring, identifying gaps in training etc )
All staff should be encouraged to give feedback about their opinions on problem areas and possible solutions They can also suggest areas where improvements may be made and opportunities exist for engaging the local community By the end of the meeting, the team should be defined with each individual’s roles and responsibilities in the program clearly assigned Potential targets should be discussed, a timeframe for these activities agreed upon and the next meeting scheduled
The water team must then relay this information on to their respective departments so that staff throughout the hotel is informed about the project It is recommended that some follow up action, however small, be required from all members of the water team so that they leave the initial meeting with a task This will ensure that the WMP stays fresh in people’s minds and that they really start to think about options and possibilities as they move around their daily activities Changing behaviour does not happen within a single meeting: it needs continual reinforce-ment, deliverables and support A strong Water Management policy will help anticipate the potential future water shortage and also to qualify for eco labels such as Green Leaf and Travelife
PERSoN ROLe EXPERIENCE REquIRED
MANAGING DIRECToR understand program objectives, define timings and expected results
must be able to motivate staff and approve changes/spending
HoTEl MANAGER co-ordinate collection of data, plan necessary training
attention to detail with data received, analytical thinking to formulate action plan
TECHNICAl/ MAINTENANCE MANAGER data collection, placement of meters, physical measurements, etc.
good numeracy, ability to complete worksheets (hard or soft copy) and cost-benefit calculations
ACCouNTS budget spending on water saving devices, provide bed night figures
budget planning
HEAD oF HouSEKEEPING & lAuNDRy data collection, target setting, monitoring understanding the water saving issues
HEAD oF KITCHEN data collection, target setting, monitoring analyze the water savings potentialities
HEAD oF GRouNDS KEEPING data collection, target setting, monitoring knowledge about efficiency in watering

18
Data Collection
2
What you don’t measure, you can’t manage This section out-lines the importance of meas-uring your baseline water con-sumption on a regular basis and guides the user on how to find out the hotel’s full water cost, while seeing where water con-sumption is the highest

2120
In order to be able to observe monthly variation, the user should first establish the baseline consumption and develop a good understanding of “normal” figures Once this is in place, any changes to these figures can be detected and explained For instance, if the user is familiar with the water consumption pattern, a sudden increase in consumption of 20% may be readily explained as, for example, resulting from additional irrigation during the dry season Data will allow the user to measure results and gauge the effectiveness of any water saving plan
Comparing baseline figures (Worksheets 1-7) with industry “best practice” figures (these are available in Annex III) will allow the user to gauge how much improvement may be possible, allow for cost benefit calculations, guide decision making and help formulate your action plan You will be guided through these tasks in the following sections The worksheets in this chapter have been designed as a step-by-step process to generate your baseline figures They should be filled out in numerical order as follows:
NO SHeeT TITLe uSE THIS SHEET To….. DATA you WIll NEED TIME NEEDED
1 WATER CoNT-SuMPTIoN PER BED NIGHT
calculate volume of water used for one bed night and how this varies from month to month
monthly water consumption from borehole, municipal, rainwater and water tanker sources, monthly bed night figures
2hrs
2 uNIT CoST CAlCulATIoN FoR WATER
calculate the actual cost of one cubic meter of water from different sources (groundwater, municipal, tanker, rainwater, treated water)
local water costs (water rates, tankers, rainwater infrastructure cost and collection potential), pump power requirement, groundwater treatment and maintenance costs
4hrs
3 uNIT CoST CAlCulATIoN FoR HoT WATER
calculate your heating costs for one litre of water from different sources (solar, electric, boiler)
capacity, installation costs and running costs of all water heating devices
2hr
4 lAuNDRy BuDGET SHEET
calculate the unit cost of washing one item of laundry such as a bed sheet or towel
laundry washer, dryer and presser power & water ratings and purchase costs, monthly laundry logs, detergent and labour costs
3hrs
5 FloW RATE MEASuREMENTS
record & calculate flow rates from different parts of the hotel (such as showers, sinks, etc.)
this is a physical measurement, so it can be collected directly
2hr
6 WATER BAlANCE SHeeT
compile your water budget, factoring in water consumed in different departments using measurements or estimations
water volumes used in different areas of hotel (sub-metering)
2.5hrs
7 ToWEl RE-uSE CAlCulATIoN
monitor with housekeeping staff number of towels re-used throughout one week and calculate % re-use
this is a record sheet so data can be collected directly
0.5hr intro, 0.5hr compiling
Completing a worksheet may require the user to consult various data sheets, perform measurements, collect information and complete calculations The worksheets may be found in Excel format in the memory stick located inside the back cover of this book The user may print them and fill them in manually (such as for Worksheet 7: Towel re-use record sheets) or complete them electronically
It is strongly advised that the electronic version be used wherever possible, as many final figures and calculations will be automatically filled in The user should only fill in the blue boxes. Using the electronic version of the worksheets will also facilitate changing variables (such as when comparing prices)
Initially, there may be some data which is unavailable, therefore average figures have been provided These should be refined as soon as possible with site specific data to ensure correct results
The automatic results provided in the worksheet will guide the user to the next worksheet or will be used for cost-benefit analyses For example, the user takes the results from Worksheet 4 (Laundry Cost) and Worksheet 7 (Towel re-use record sheet) to complete a cost-benefit calculation (see Section 3) Suggestions for the Action Plan (see Section 4) may also be provided
Annex II contains worked examples of the worksheets based on a hypothetical hotel called “Gwaylo Springs” These examples may be used as guidance on how the worksheets should be completed and interpreted
The “Water consumption per bed night” figure represents how much water is required for one guest for a 24hr period The calculation takes into account the total amount of water con-sumption divided by the number of guests present in the hotel This value is global and doesn’t indicate what the guests have really used during their stay in their room, as it also includes gardening, laundry, kitchen etc
To calculate this, water usage and bed night data are required (the total amount of water used will vary depending on the number of guests) Your water supply can come from a variety of sources such as a borehole, water tanker, rainwater harvesting or the municipal supply Data on water usage from these sources can be taken from a variety of sources such as:
h meter readings from the municipal supply (or the monthly bills),
h meter readings from a borehole, h meters around the site, h estimations based on tank volumes
(filling/emptying frequency),h receipts for payments made to water tankers,
water licenses & fees
If you have no data available related to water consumption at your site, it is essential to install meters on your supply and distribution lines To achieve a maximum benefit, the meters should be placed on the distribution lines to different depart-ments (kitchen, laundry, swimming pool, irrigation, guest rooms, cooling towers, etc ) on both hot and cold water supply (See Annex V for guidance on meter installation)
It is beneficial to have readings over a long period of time so that any daily variables (such as filling a swimming pool, a burst pipeline, etc ) will be averaged and consumption can be correlated with bed nights Therefore, in the Worksheet 1, you are asked to fulfil data covering 24 months You should also be able to provide bed night data for the same time period for which you collect water consumption data
Water can be sourced from a number of different locations and this can be factored into Worksheet 2 to allow the user to determine the average cost of their current supply The worksheet will calculate the average cost per cubic meter of water (cost/m3) This is based on the proportion of water used from each source (automatically defined by the inputs in Worksheet 1 “Water consumption per bed night”) combined with the costs associated with each particular source
Water sources may comprise one or more of the following:h groundwaterh municipal water (via pipeline)h water tankers (bowsers/trucks)h rainwater harvestingh treated wastewater
How to calculate per capita water consump-tion (Worksheet 1)
How much does one cubic meter of water cost? (Worksheet 2)
2322
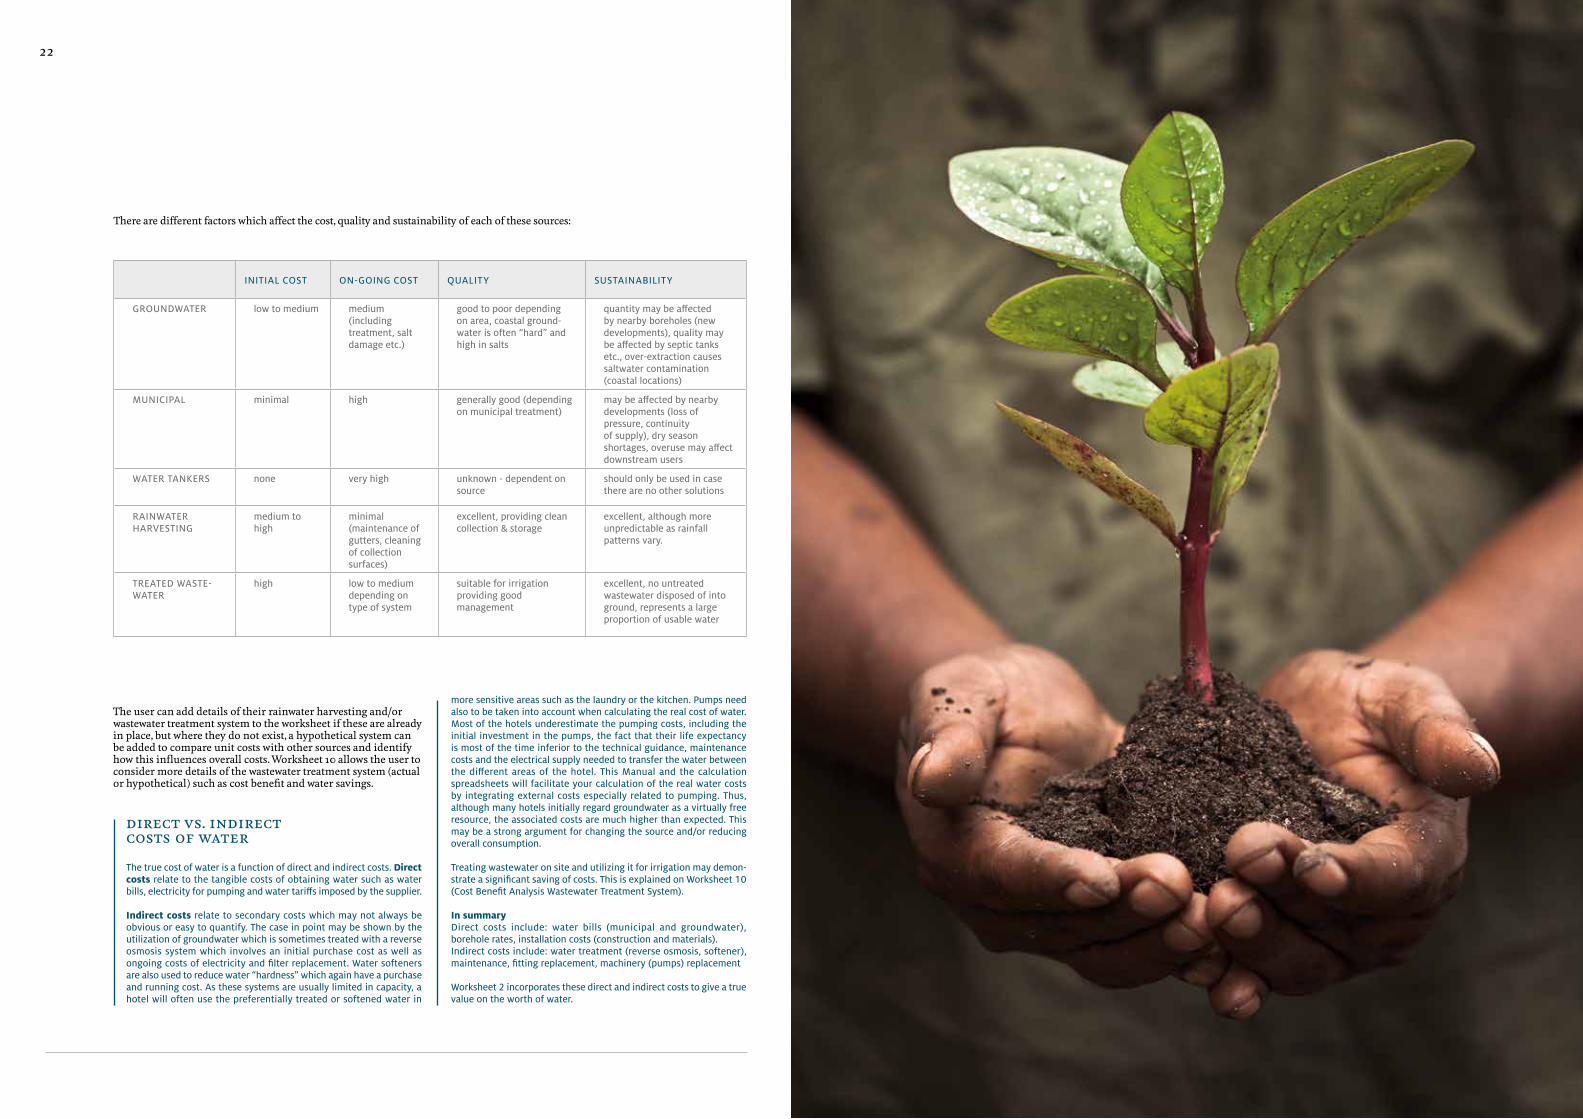
The user can add details of their rainwater harvesting and/or wastewater treatment system to the worksheet if these are already in place, but where they do not exist, a hypothetical system can be added to compare unit costs with other sources and identify how this influences overall costs Worksheet 10 allows the user to consider more details of the wastewater treatment system (actual or hypothetical) such as cost benefit and water savings
INITIAl CoST oN-GoING CoST quAlITy SuSTAINABIlITy
GRouNDWATER low to medium medium (including treatment, salt damage etc.)
good to poor depending on area, coastal ground-water is often “hard” and high in salts
quantity may be affected by nearby boreholes (new developments), quality may be affected by septic tanks etc., over-extraction causes saltwater contamination (coastal locations)
MuNICIPAl minimal high generally good (depending on municipal treatment)
may be affected by nearby developments (loss of pressure, continuity of supply), dry season shortages, overuse may affect downstream users
WATER TANKERS none very high unknown - dependent on source
should only be used in case there are no other solutions
RAINWATER HARvESTING
medium to high
minimal (maintenance of gutters, cleaning of collection surfaces)
excellent, providing clean collection & storage
excellent, although more unpredictable as rainfall patterns vary.
TREATED WASTE-WATER
high low to medium depending on type of system
suitable for irrigation providing good management
excellent, no untreated wastewater disposed of into ground, represents a large proportion of usable water
There are different factors which affect the cost, quality and sustainability of each of these sources:
direct vs indirect costs of Water
The true cost of water is a function of direct and indirect costs. direct costs relate to the tangible costs of obtaining water such as water bills, electricity for pumping and water tariffs imposed by the supplier.
indirect costs relate to secondary costs which may not always be obvious or easy to quantify. The case in point may be shown by the utilization of groundwater which is sometimes treated with a reverse osmosis system which involves an initial purchase cost as well as ongoing costs of electricity and filter replacement. Water softeners are also used to reduce water “hardness” which again have a purchase and running cost. As these systems are usually limited in capacity, a hotel will often use the preferentially treated or softened water in
more sensitive areas such as the laundry or the kitchen. Pumps need also to be taken into account when calculating the real cost of water. Most of the hotels underestimate the pumping costs, including the initial investment in the pumps, the fact that their life expectancy is most of the time inferior to the technical guidance, maintenance costs and the electrical supply needed to transfer the water between the different areas of the hotel. This Manual and the calculation spreadsheets will facilitate your calculation of the real water costs by integrating external costs especially related to pumping. Thus, although many hotels initially regard groundwater as a virtually free resource, the associated costs are much higher than expected. This may be a strong argument for changing the source and/or reducing overall consumption.
Treating wastewater on site and utilizing it for irrigation may demon-strate a significant saving of costs. This is explained on Worksheet 10 (Cost Benefit Analysis Wastewater Treatment System).
in summary Direct costs include: water bills (municipal and groundwater), borehole rates, installation costs (construction and materials).Indirect costs include: water treatment (reverse osmosis, softener), maintenance, fitting replacement, machinery (pumps) replacement
Worksheet 2 incorporates these direct and indirect costs to give a true value on the worth of water.
2524
How much does your hot water cost? (Worksheet 3)
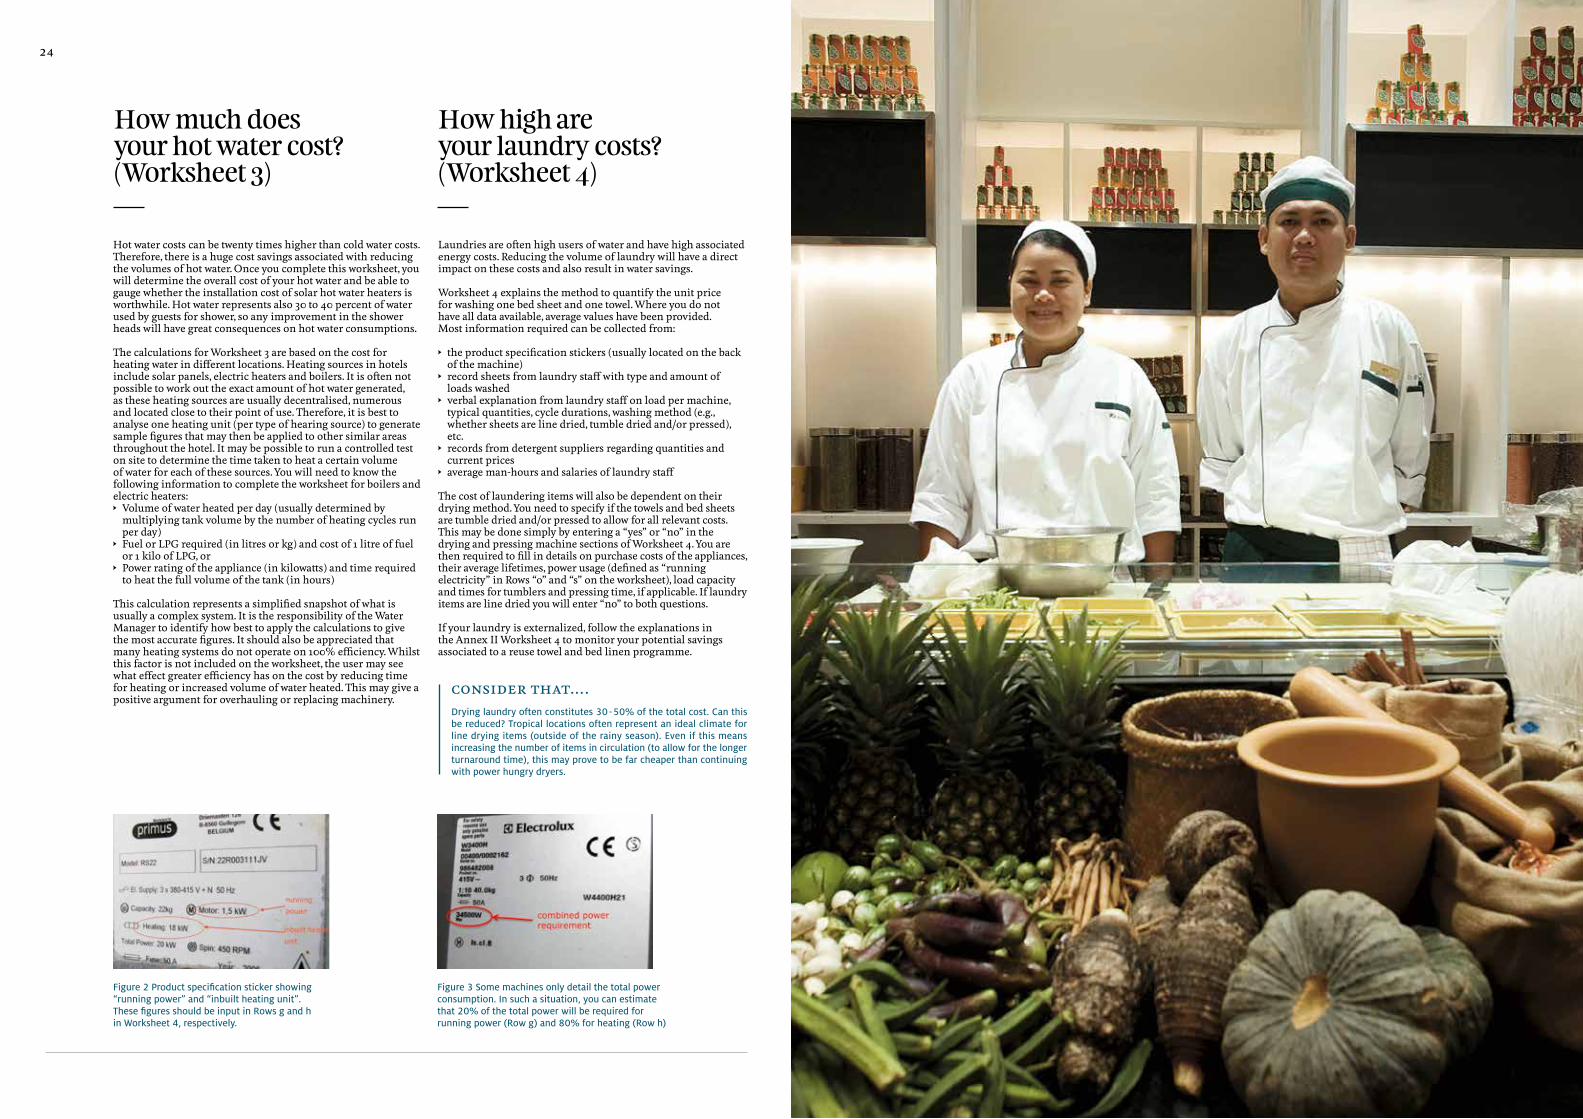
Figure 2 Product specification sticker showing “running power” and “inbuilt heating unit”. These figures should be input in Rows g and h in Worksheet 4, respectively.
Figure 3 Some machines only detail the total power consumption. In such a situation, you can estimate that 20% of the total power will be required for running power (Row g) and 80% for heating (Row h)
Hot water costs can be twenty times higher than cold water costs Therefore, there is a huge cost savings associated with reducing the volumes of hot water Once you complete this worksheet, you will determine the overall cost of your hot water and be able to gauge whether the installation cost of solar hot water heaters is worthwhile Hot water represents also 30 to 40 percent of water used by guests for shower, so any improvement in the shower heads will have great consequences on hot water consumptions
The calculations for Worksheet 3 are based on the cost for heating water in different locations Heating sources in hotels include solar panels, electric heaters and boilers It is often not possible to work out the exact amount of hot water generated, as these heating sources are usually decentralised, numerous and located close to their point of use Therefore, it is best to analyse one heating unit (per type of hearing source) to generate sample figures that may then be applied to other similar areas throughout the hotel It may be possible to run a controlled test on site to determine the time taken to heat a certain volume of water for each of these sources You will need to know the following information to complete the worksheet for boilers and electric heaters:h Volume of water heated per day (usually determined by
multiplying tank volume by the number of heating cycles run per day)
h Fuel or LPG required (in litres or kg) and cost of 1 litre of fuel or 1 kilo of LPG, or
h Power rating of the appliance (in kilowatts) and time required to heat the full volume of the tank (in hours)
This calculation represents a simplified snapshot of what is usually a complex system It is the responsibility of the Water Manager to identify how best to apply the calculations to give the most accurate figures It should also be appreciated that many heating systems do not operate on 100% efficiency Whilst this factor is not included on the worksheet, the user may see what effect greater efficiency has on the cost by reducing time for heating or increased volume of water heated This may give a positive argument for overhauling or replacing machinery
Laundries are often high users of water and have high associated energy costs Reducing the volume of laundry will have a direct impact on these costs and also result in water savings
Worksheet 4 explains the method to quantify the unit price for washing one bed sheet and one towel Where you do not have all data available, average values have been provided Most information required can be collected from:
h the product specification stickers (usually located on the back of the machine)
h record sheets from laundry staff with type and amount of loads washed
h verbal explanation from laundry staff on load per machine, typical quantities, cycle durations, washing method (e g , whether sheets are line dried, tumble dried and/or pressed), etc
h records from detergent suppliers regarding quantities and current prices
h average man-hours and salaries of laundry staff
The cost of laundering items will also be dependent on their drying method You need to specify if the towels and bed sheets are tumble dried and/or pressed to allow for all relevant costs This may be done simply by entering a “yes” or “no” in the drying and pressing machine sections of Worksheet 4 You are then required to fill in details on purchase costs of the appliances, their average lifetimes, power usage (defined as “running electricity” in Rows “o” and “s” on the worksheet), load capacity and times for tumblers and pressing time, if applicable If laundry items are line dried you will enter “no” to both questions
If your laundry is externalized, follow the explanations in the Annex II Worksheet 4 to monitor your potential savings associated to a reuse towel and bed linen programme
consider that… Drying laundry often constitutes 30-50% of the total cost. Can this be reduced? Tropical locations often represent an ideal climate for line drying items (outside of the rainy season). Even if this means increasing the number of items in circulation (to allow for the longer turnaround time), this may prove to be far cheaper than continuing with power hungry dryers.
xxxxxx |
How high are your laundry costs? (Worksheet 4)

2726
To determine flow rates, you will need to physically measure the water coming from a number of taps and showers You should do this from five different locations in order to get a good average Record which locations are measured and when so that you can test the same taps and showers at different times of the day There is usually less pressure when all guests take their showers between 7AM and 9AM and between 6PM and 8PM (these timings are indicative and will depend on the purpose of your guest visit: business or holidays) Also note if the taps or showers are low flow models or standard
Measurements (five from each) are needed from the following:
h guest bathroom showersh guest bathroom sinksh staff washroom showersh staff washroom sinksh irrigation lines (tapstands, hydrants or other)
Follow these steps to gauge the flow rates:
1) Turn on the shower or sink taps at full flow (i e , both the hot and the cold taps should be fully open)
2) Place a suitable container (5L is generally appropriate, although a smaller container may be necessary for the sink) under the flow and measure how much time it takes to fill with water
3) If the flow is not steady, repeat the measurement three times and calculate the average time needed to fill the container
It is important to note that the frequency of use of staff facilities is often higher and therefore increases wear and tear This often results in fixtures becoming modified to avoid continual repair, which may result in high flow rates (for example, where shower heads are removed) A cost benefit analysis (see Section 3) can be beneficial in determining if such modifications should be avoided
A video in English and Thai languages is available on the memory stick It explains how to physically measure shower head water flow
consider that… Acceptable flow rates for taps should not be in excess of 6 litres per minute. Showerheads should not have a higher flow rate than 10 litres per minute. If your figures are higher, you may be wasting a lot of water. Worksheet 9 (Cost Benefit Calculations for Plumbing Fixtures) will help you to identify the savings you can make. Bear in mind that flow rates may vary throughout the day depending on other users and distance from supply tank.
This worksheet considers where water is used throughout the hotel and is a vital tool in understanding where and how your water is used Once you have a good idea of these figures, you will be better placed to assess: What is normal? What can be improved? What changes have shown success? You will only be able to use this worksheet and benefit from it if you have placed meters strategically so that consumption to different areas of the hotel and/or from different sources may be recorded For example, you may have a meter on your borehole, which will allow a comparison of the proportion of borehole vs municipal water, or you may have a meter on the irrigation line which will show the proportion of this usage as compared with the total See Annex V for an explanation on how to place meters for maximum benefit and how they should be properly read
Consumption may be estimated in areas which are not metered Typical figures are listed in the Annex III and can be compared with calculations generated in the worksheet An allowance has been made for bathtubs (guests only) if these are installed These do not include flow ratings as they are based on water volume only, as are the toilets General information regarding irrigation is listed in Annex VII
Familiarisation with actual volumes and comparison with estimated and best practice volumes will allow the Water Manager to quickly see where discrepancies occur Using this information will determine the course and content of the Action Plan, described in Section 3 Discrepancies are red flags and could indicate leakages (see Annex VIII) for information of detecting leaks, poor water usage (see Section 6 Training Staff for remedies) or an inefficient irrigation system (see Annex VII), for example It is the Water Manager’s role to identify these red flags
consider that… The “estimate” column reflects a snapshot of an average month, whilst the “measured” column reflects the actual volume used. If the difference between the two is greater than can be attributable by variable guest numbers and/or irrigation requirement, the Water Manager should investigate possible reasons for this.
How to measure tap flow rates (Worksheet 5)
Determining the water balance (Worksheet 6)
How much do visitors re-use their towels? (Worksheet 7)
Towel re-use programs have been promoted for a number of years and most hotels have a system of encouraging their guests to hang up towels which do not need washing Before encouraging a towel re-use program, it is necessary to know how much the guests are currently participating in the program (if at all) This worksheet allows the user to monitor this on a weekly basis so it should be completed at the start of the study period (for pre-existing programs) and then every month to check progress Completing the worksheet will help management determine if the program needs re-emphasizing through training of staff (Section 6) or guest sensitization (Section 7)
Having a towel re-use program that is functioning properly is an easy and tangible way of channelling saved funds towards a community water project if existing and getting customers involved in the local community as well See how you can encourage your guests to increase their participation in towel re-use programs in Section 7
hoW to explain the WorK sheet to houseKeeping staff
you may use the following text to introduce Worksheet 7 to the housekeeping staff. Consult the worked example in Annex II for further explanation.
“Guests are informed about the towel and/or bed linen reuse program, thanks to the communication in the rooms. Washing a towel or sheet requires about 10 litres of water and costs between 10-15 THB (0.35 - 0.45 uSD). our hotel has a towel re-use program in place but how many guests really follow this? This brief study captures how many of our visitors actually do re-use their towels. Please make a note of the necessary numbers as you do your rounds every day for one week, it will take no more than a couple of minutes to complete.
Please enter your name in the table and add the number of guests you have cleaned for and how many towels you found hung up (i.e. you didn't take them for washing). If you are aware that the guests are leaving the same day then please exclude these numbers from the record, as all the laundry is washed at that time.”

28
Cost Benefit
Analysis
3
This section presents three cost benefit analyses – related to laundry, plumbing fixtures and wastewater treatment systems – available in this manual and accompanying memory stick Completing these worksheets enables the Water Manager to have strong arguments for lev-eraging change within the hotel
3130
NO SHeeT TITLe uSE THIS SHEET To….. DATA you WIll NEED TIME NEEDED
8 laundry Cost-Benefit Calculations
assess the potential savings of a towel or bed sheet re-use program
data from Worksheets 1, 4 & 7
2hrs
9 Cost-Benefit calculations for plumbing fixtures
assess the potential savings from modified plumbing fixtures
data from Worksheets 1, 2, 3, 5, 8 and Annex vI
2hrs
10 Wastewater treatment plant Cost-Benefit
establish the cost of treating 1m3 of waste water and how much this saves you on an annual basis
construction and running costs of existing or proposed system, data from Worksheets 1, 2 & 6
0.5hrs (plus external consultation on system design)
As the cost benefit is closely associated with meas-ured flow rates from Worksheet 5 and figures from Worksheet 4, it is a valuable exercise to recheck these figures to ensure absolute accuracy
This means it is essential to re-measure flows and double check laundry figures Any mistakes made in the data can have ramifications in the final results and distort the CBA
A cost benefit analysis (CBA) considers the money saved through implementing a particular measure compared with the cost of putting that measure in place The savings can result from reduced bills, less regular maintenance, lower running costs and extended lifespan of appliances (amongst others) and are expressed per unit of time Implementation cost refers to material purchases, training costs and anything else needed to get the new system working These figures are then compared to generate a payback period, i e how long the system takes to pay for itself
The CBA allows the Water Manager to produce a convincing argument for change within their establishment Armed with such figures, it is possible to demonstrate a purely economic advantage to implementing a particular device, system or technique
A soundly calculated CBA may be the reason a suggestion achieves reality where budget constraints may hold more emphasis than environmental matters The CBA can also take into account the less tangible benefits of a water reduction system, such as the improved supply of water to a community further down the pipeline, or the reduced carbon emissions from less water heating Whilst this last point is not covered within the context of this manual, it is valid to say that reducing your water footprint will achieve cost savings with the added incentive of environmental and social benefits (even if these can’t be quantified) Therefore, with the correct figures to hand, the Water Manager is in a very strong position to suggest change
Cost benefit calculations can be applied to any area of hotel operations and should be completed as a matter of course prior to any purchasing decisions This manual considers three water-related CBA calculations as follows:
1 costs savings associated with a towel re-use program2 cost savings from replacing inefficient plumbing
fixtures3 cost-benefit assessment of installing a wastewater
treatment system
arguments for convincingmanagement
Completing the three worksheets in this section generates a number of figures that allows the Water Manager to quantify the cost-benefit of various options (for the existing situation or proposed action). This represents a critical step in decision making as numbers often speak more loudly than words. Consider the difference in presentation to your manager of the following:
“I think we should replace our guest showerheads with low flow models because they save water”
vERSuS
“If we install low flow showerheads we will save 500,000 baht (15,720 uSD) per year on our water and power bills, and we’ll also save 25,000 m3 of water which is nearly 17% of our current total”
Payback period = Implementation Costs Savings

3332
Cost Benefit Analysis for Plumbing Fixtures (Worksheet 9)
Cost Benefit Analysis Wastewater Treatment System (Worksheet 10)
This sheet calculates how much water could be saved by regulat-ing plumbing fixtures such as taps, showerheads and toilets As usage varies throughout the hotel in terms of frequency and duration, guest and staff fixtures are considered separately Water saving devices will result in a saving of both water (see Worksheet 9, Column E) and money (see Worksheet 9, Column F) for those fixtures which are using more than the optimal amount of water (industry recommended averages are found in Annex III) For fixtures which utilize hot water, savings will be significantly higher due to the cost of heating water (see Worksheet 3) It is assumed that guests will have hot water for their showers, but the user must indicate if employees also have hot water for their showers (insert “yes” or “no” in the blue box in column A)
The user then decides which type of fittings they would like to purchase to replace current fixtures Some suitable fittings with typical prices for Thailand are shown in Annex VI The savings are then compared with the installation costs of new fittings to generate the cost benefit analysis This is displayed as the payback period, which represents the time it takes for the installation cost to be absorbed by the savings
The user can then assess which option to follow up on based on the water savings, cost savings and payback period for each of the areas studied (guest rooms, staff facilities, etc )
please noteEven if the CBA argument is not enough to warrant changing certain fixtures immediately (in particular, for example, the more expensive showerheads or toilets), it does not mean these options should be rejected On the contrary, the fittings can just be installed as part of the next planned replacement/refurbishment program This is important information to pass on to the hotel’s procurement officer straight away so that the calculations will not have to be re-done and the items can be factored into future budgets
Where no sewerage network exists, it is necessary to take steps to ensure your wastewater is not contaminating the environment This can occur when water which has not undergone sufficient treatment is discharged into soak pits, streams, the sea, lakes, etc and then causes pollution in the receiving body This is particu-larly problematic for groundwater, as there may be extraction wells close by whose water quality is compromised If you are currently operating a wastewater treatment system, Worksheet 10 allows you to calculate the cost of treating one cubic meter of this water If you are considering installing a system, you will need to have an idea of type, size and design of the system you would be interested in Wastewater treatment systems come in many shapes and sizes, some of which are relatively high-tech and fairly compact (often underground) and others which utilize natural processes through constructed wetlands and reed beds, requiring more land but utilizing a more simple technology
All types of systems should produce water of a quality that is within the so-called “discharge to environment” levels providing they are designed, constructed and operated correctly Informa-tion on different types of system can be reviewed at http://www.sswm.info/category/implementation-tools/wastewater-treatment Biological additives are sometimes used to improve water quality, but these are often not sufficient on their own, they have a relatively high on-going cost and their availability cannot be guaranteed in the long term
Treated wastewater may be used for irrigation providing its qual-ity is within certain guidelines (consult your local regulations) Based on the quantity of irrigation water required, Worksheet 10 displays the water and cost savings associated with utilizing this source of water Treated wastewater may also be used for cooling towers, see Annex IX for more details
Using data from previous worksheets, this calculation will identify cost savings associated with reducing the number of towels or bed sheets that a guest uses during his stay Laundries operate differently between hotels, but most record every wash completed (in kilograms) and what it comprises This is impor-tant information and should be collected if not already done so
Providing you know how many towels or sheets comprise a full load, you can relate this to number of items per day Where this information is already being recorded it may also be logged in a spreadsheet that will allow for a more rapid calculation of daily and monthly totals If not, it will be necessary to go through the logs and add up all the values Data required is:
h weight of bath towels laundered per monthh weight of pool towels laundered per monthh weight of bed sheets laundered per month h weight of total items laundered per month
extrapolating average annual figures
If it is not possible to obtain data for the whole year, then using data from a few months will suffice to give a reasonable approximation for the average annual value. Simply extrapolate the values as follows:
extrapolated total =
Weight of items laundered for time period logged x 12 months Number of months the data was logged for
So, if you had logged 5,000 kilograms of bath towels laundered over three months, you would extrapolate the value of 20,000 kilograms of bath towels laundered for the year.
The worksheet incorporates existing towel re-use programs that will have been quantified by Worksheet 7 The user then specifies the improved re-use value to see the savings achieved Encourag-ing guests to hang up their towels is an easy way to engage them in water saving They can do something achievable, which also results in significant, tangible cost savings for the hotel
Improved re-use will only be effective if all staff and guests are aware of the program, in particular if guests are verbally informed of the program during check in for example and have clear signs and information in their rooms More information on communicating a towel re-use program is explained in Section 6 and Section 7
tip concerning bath toWelsThe size of the bath towel has an impact on the total amount of laundry. In some hotels the bath towel can be as big as 100 x 140 cm when the minimal size would be 60 x 120 cm. The smallest bath towel is twice lighter than the biggest, 500g versus 1kg. In the case of a hotel washing 500 bath towels per day, switching from heavy to light towels, there would be annual potential laundry savings of:
500 x 0.5 x 365 = 91,250 kg = more than 90 tonnes
Annual potential savings: 90,000 x 14* = 1,260,000 THB (39,060 uSD)
Annual water savings: 90,000 X 8* = 720 m3
Think about it when you buy new bath towels!
*Gwaylo Springs data: washing one kg of laundry costs 14 THB and uses 8 litres
Cost Benefit Analysis for Laundry (Worksheet 8)

34
Defining the Action Plan
4
The key to developing a great Action Plan is to tap into areas whose improvement makes fi-nancial sense This is a great way to get initial buy-in from hotel management and own-ers The worksheets provided in the accompanying memory stick automatically generate summaries of your data collec-tion process to give insight on where to focus efforts first Im-proving your water manage-ment can be easy to accomplish by setting short-, mid- and long-term goals Examples of possi-ble goals are provided

3736
After completing Worksheets 1- 10 as outlined in Section 2 & 3 of this manual, the results are automatically pulled in from each sheet and displayed in two summary sheets as shown below (the Action Plan and Water Champions Summary Sheets)
The Action Plan Summary sheet allows the user to have an overview of key facts and figures that may be used to formulate the Action Plan
sample of action plan summary sheet for Gwaylo sprinGs.
1 CoNSuMPTIoN PER BED NIGHT
your average daily consumption is 1.016 m3/day
your average consumption per bednight is 1,11 m3/bednight
your maximum was 1,71 m3/bednight
your minimum was 0,56 m3/bednight
The industry average is 0,75 m3/bednight
your average value is 1,48 times greater than the industry average
Best practice 0,5 m3/bednight (note 1)
your average value is 2,23 times greater than the industry best practice
2 WATER CoSTS
Primary supply of water is groundwater
This constitues 77,5% of your total supply
Average overall cost of water 10,2 THB/m3
Softened water 7,8 THB/m3
Desalinated water 9,7 THB/m3
Rainwater 1 THB/m3
Water Trucks 100,0 THB/m3
3 HoT WATER CoSTS
Hot water - solar cost 0,05 THB/litre
Hot water - electric heater cost 0,082 THB/litre
Hot water - lPG boiler cost 0,10 THB/litre
4 lAuNDRy CoSTS
laundering one towel costs you 11,2 THB
And uses 6,8 litres of water per item
laundering one sheet costs you 14,1 THB
And uses 8,6 litres of water per item
5 FloW MEASuREMENTS FRoM FITTINGS
Average flow rates in the following areas are
Guest bathroom sink 2,7 times greater than optimal flow
Guest bathroom shower 2,1 times greater than optimal flow
Staff washroom sink 1,95 times greater than optimal flow
Staff washroom shower 2,5 times greater than optimal flow
6 WATER BuDGET ANAlySIS
Water is used in departments as follows (estimate) m3/day % of total
laundry 105 10%
Guests 438 43%
Staff 77 8%
Health club/spa 2 0,1%
Irrigation 174 17%
Kitchen 45 5%
Pool 19 2%
Cooling Tower 150 15%
others (watersports, golf club etc) 0 0%
Total average daily consumption (estimate) 1010 m3/day
Summary of Worksheet Results
This data is summarised on the following page
Note 1: Katathani Beach Resort Phuket (autonomous water treatment plant, low flow devices installed)
7 ToWEl RE-uSE
Current re-use of towels is 9%
This is 21% less than best practice
8 CBA lAuNDRy
With an improved re-use figure of 25%
you will reduce items laundered by 61.948 per year
Saving a laundry cost of 783.570 THB/year
With a water saving of 476.691 litres/year
Which is equivalent to 0,13% of total water consumption
9 CBA PluMBING FIXTuRES
The total water wasted by fittings is 97.133 m3/year
Which is equivalent to 26% of total consumption
Which costs an extra 2.009.326 THB/year
The total cost of replacing all wasteful fittings is 5.880.000 THB
The payback period for all fittings is 2,9 years
The fittings wasting the most amount of water are guest showers
Which waste a total of 35.482 m3/year
The fittings costing the most in wasted water are guest showers
Which cost an extra of 1.381.709 THB/year
The fittings with the fastest payback period are staff sinks
With a payback period of 0,2 years
The fittings with the longest payback period are guest toilets
With a payback period of 25 years
10 WASTEWATER TREATMENT SySTEM
Type of system proposed constructed wetland
Reduction in water required from other sources 63.491 m3/year
Which is equivalent to 17% of total consumption
Equivalent cost 473.102 THB/year
8% staff
5% kitchen
2% pool
15% cooling tower
17% irrigation
0% health spa/club
43% guests
10% laundry

3938
Kuoni Water Champion Summary Sheet
The Water Champion Summary sheet is also generated which displays the data specific to the Kuoni Water Champion Award This sheet indicates how consumption per bed night varies from month to month and encourages the user to note what this variation can be attributable to An example sheet is shown below
MoNTH M3/BEDNIGHT % CHANGE NOTeS
indicate month and year data from worksheet 3.1 (column F)
(m3/bednight - previous month)/previous month x 100% e.g. ((b-a)/b x 100%
note events which may affect consumption such as training, modifications, rainy season etc
Jan 13 0 , 8 7
Feb 13 1 , 1 9 3 6 , 4 1
Mrz 13 1 , 62 35 , 5 5
Apr 13 1 , 3 0 - 1 9 , 6 1
Mai 13 1 , 1 8 - 8 , 8 6
Jun 13 1 , 5 1 2 7 , 9 1
Jul 13 0 , 8 5 -44 , 0 9
Aug 13 0 , 9 2 8 , 24
Sep 13 0 , 9 8 7 , 1 3
Okt 13 0 , 7 9 - 1 9 , 8 5
Nov 13 0 , 9 2 1 6 , 6 5
Dez 13 1 , 0 3 12 , 1 4
Jan 14 1 , 0 0 -2 , 6 5
Feb 14 1 , 1 4 1 4 , 1 9
Mrz 14 1 , 6 7 45 , 7 5
Apr 14 1 , 5 1 - 9 , 3 6
Mai 14 1 , 7 1 1 3 , 1 9
Jun 14 1 , 6 1 -5 , 8 2%
Jul 14 1 , 24 -2 3 , 0 1 %
Aug 14 1 , 0 9 - 1 2 , 1 6 % start of Kuoni WMP + meters in place
Sep 14 0 , 8 9 - 1 8 , 0 6 %
Okt 14 0 , 5 6 - 3 7 , 3 7% leaks identified and repaired
Nov 14 0 , 8 8 5 7 , 1 9 % max capacity
Dez 14 0 , 8 5 - 3 , 5 0 % new showerheads installed
water champion summary sheet HoTEl NAME: Gwaylo Springs loCATIoN: Phuket CoST oF WATER: 10 THB/m3 (from worksheet 2)
Worksheets 1 to 10 should be submitted to Kuoni (along with the Action Plan Summary and Water Champion Summary) to prove that consumption per bed night has been successfully reduced through implementation of a water management program

4140
How to create your Action Plan
By this stage, the Water Manager and his/her team will have collected useful data and developed a good understanding of how much water is being used for different purposes throughout the hotel They will also be aware of how much their current system is costing them and where the best opportunities lie for making savings This information can be used to formulate a plan in which achievable targets are set and scheduled This is referred to as the Action Plan and should involve the following steps: 1. Define areas needing improvementThe worksheets highlight areas of potential savings which allow targets to be defined, improvements to be scheduled and costs to be estimated This can then be built into budgets and changes implemented at agreed times 2. Develop a monitoring regimeDescribed in Section 5, the monitoring system must be closely quality controlled when first set up and continually checked for accuracy
3. Define best practice measures for inclusion This includes areas such as guest sensitization, staff training, modification of irrigation regime, etc and also defines time frames and staffing requirements
4. Define reduction targets for water consumption These may be short, medium and long terms targets based on Steps 1 and 3 Some possible targets based on various timeframes are listed below An example of an Action Plan generated by a hotel implementing a WMP is displayed below (the template can be found in the memory stick) It will be necessary to update the plan on a regular basis so that the tasks may be defined and scheduled as the project progresses It will not be possible to define these at project out-set as the data set may not be complete The work-sheets and in particular the Action Plan Summary sheet should be utilized to guide this process
The Planning stage, as described in Section 1, is really the first step in the implementation of the WMP and focuses on putting in meters and collecting information It is essential, therefore, that this stage be completed as soon as possible so that you are in a position to define a really useful and achievable Action Plan
DATEWoRKSHEETS To CoMPlETE
TASKS MEETINGS DETAIlS
WK 1 05 Aug 14 1,2,3,7 form water team and assign roles Water 1WK 2 12-Aug-14 4,5,6,7 procure metersWK 3 19-Aug-14 8,9,10 install meters & initiatite monitoring
(quality control)WK 4 26-Aug-14 analyse results define target areas and complete
sections belowWater 2 baseline established
WK 5 02-Sep-14 initiate short term goals (good practice, leaks, training)
aim to reduce water consumption per bed night by 10%
WK 6 09-Sep-14WK 7 16-Sep-14WK 8 23-Sep-14 Water 3WK 9 30-Sep-14 Initiate medium term goals
(irrigation regime)aim to reduce water consumption bed night by 10%
WK 10 07-Okt-14WK 11 14-Okt-14WK 12 21-Okt-14 Water 4WK 13 28-Okt-14 Initiate long term goals
(replacing fittings)aim to reduce water consumption per bed night by 10%
WK 14 04-Nov-14WK 15 11-Nov-14WK 16 18-Nov-14 Water5WK 17 25-Nov-14 update all
worksheets and reanalyse
WK 18 02-Dez-14 compile data (WC summary, AC summary)
apply for Kuoni Water Champion Award
action plan
Types of Targets & Their Timeframes
Short term goals (0-2 months) h install meters throughout the supply and distribution system h in large kitchens, install mixer taps or push taps with integral spray hoses h install infra-red controlled spray or push taps h install infra-red controlled urinal flushing h install waterless urinals h improve recovery rate of the rainwater harvesting system (if present) i e fix gutters, pipework, tanks, h conduct staff training on efficient water use (with housekeeping, groundskeepers, maintenance, kitchen and laundry staff), h using your water budget analysis, conduct an assessment of the plumbing system to identify and fix leaks
along pipe network and storage tanks (see Annex VIII)h repair or replace leaking plumbing fixtures h replace the least efficient plumbing fixtures
Medium term goals (3-6 months) h replace laundry appliances with water and energy efficient models h analyse feasibility of rainwater harvesting system (if not in place) or expand the present system (wherever possible), h implement or re-establish a towel re-use program (staff and guest education) h modify any inefficiencies in the irrigation system h replace inefficient plumbing fixtures
Long term goals (+6 months) h design and construction of a wastewater treatment system h design and construction of a rainwater harvesting system (if not present) h gradual replacement of guest toilets with 6 litre or dual flush models h replacement of all other inefficient plumbing fixtures
Whilst some immediate costs savings can often be
very easily obtained, it is well worth keeping an eye
on the longer-term cost savings that can be achieved.
This means being prepared to be visionary and make
capital investments in order to fully appreciate these
long-term savings.

42
Monitoring
5
Monitoring your water con-sumption as a regular matter of course is vital to understand developing trends in your rate of consumption and to detect anomalies, which could indi-cate leaks It is also key in know-ing just how much progress your WMP is making
4544
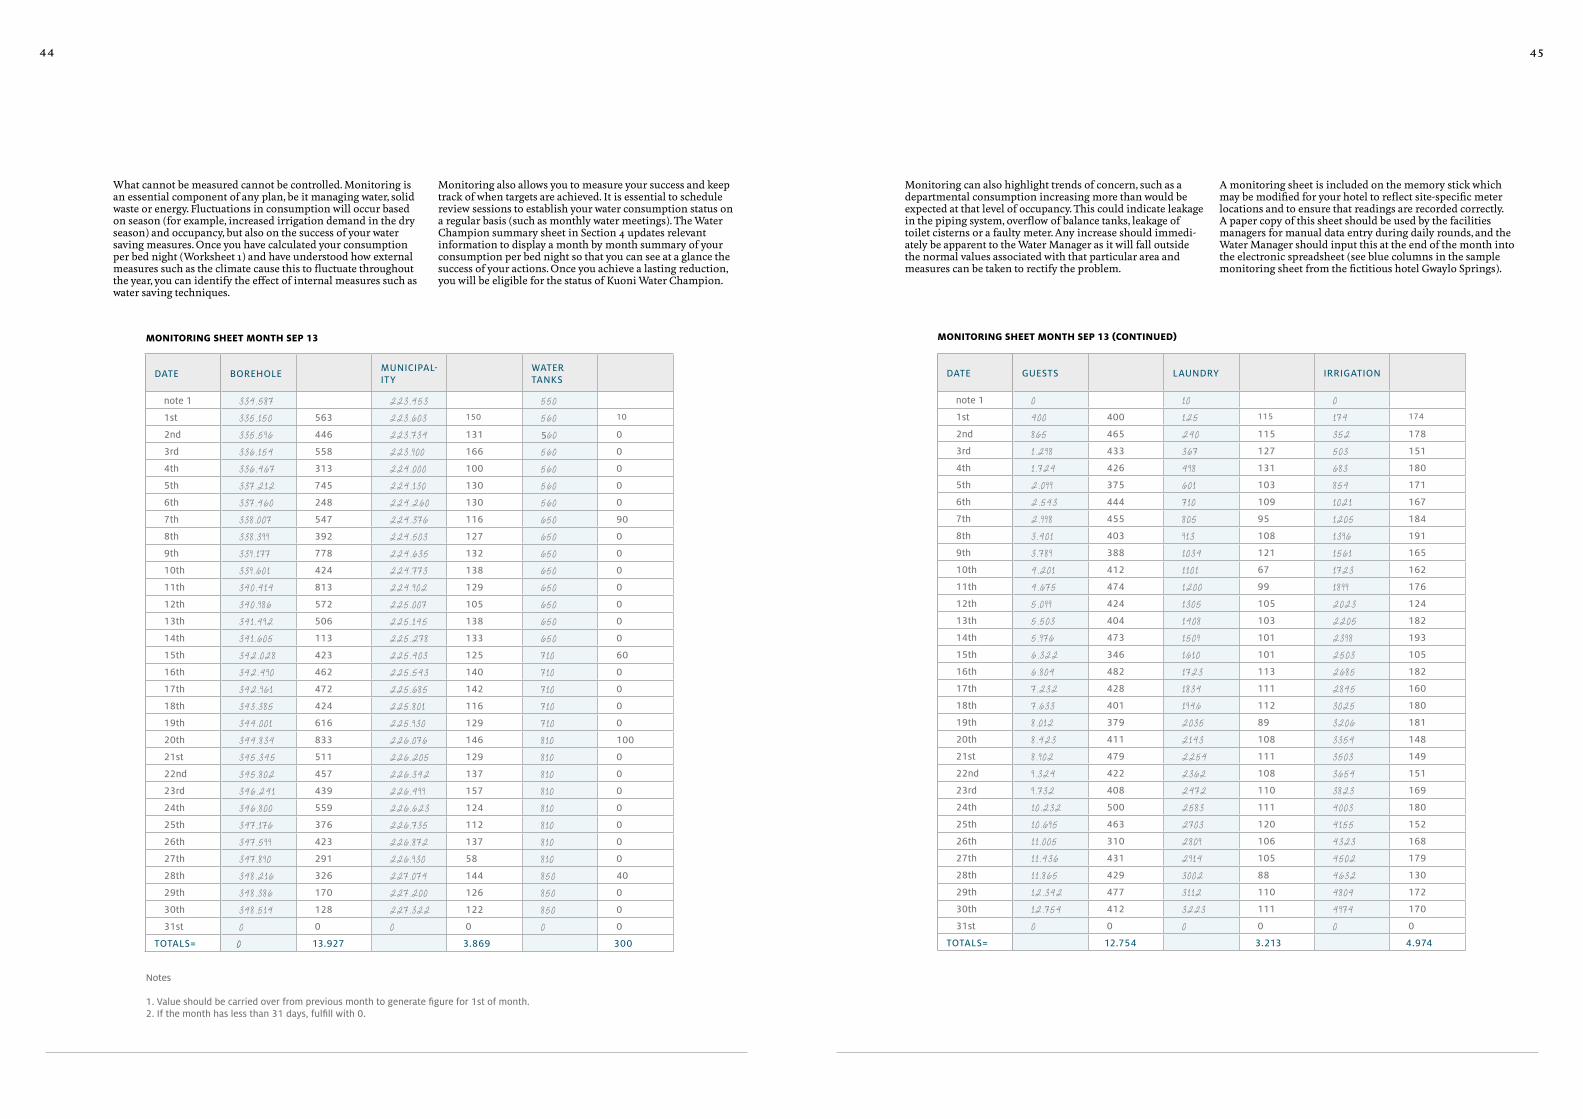
What cannot be measured cannot be controlled Monitoring is an essential component of any plan, be it managing water, solid waste or energy Fluctuations in consumption will occur based on season (for example, increased irrigation demand in the dry season) and occupancy, but also on the success of your water saving measures Once you have calculated your consumption per bed night (Worksheet 1) and have understood how external measures such as the climate cause this to fluctuate throughout the year, you can identify the effect of internal measures such as water saving techniques
Monitoring also allows you to measure your success and keep track of when targets are achieved It is essential to schedule review sessions to establish your water consumption status on a regular basis (such as monthly water meetings) The Water Champion summary sheet in Section 4 updates relevant information to display a month by month summary of your consumption per bed night so that you can see at a glance the success of your actions Once you achieve a lasting reduction, you will be eligible for the status of Kuoni Water Champion
DATE BOReHOLe MuNICIPAl-ITy
WATER TANKS
note 1 334.587 223.453 5501st 335.150 563 223.603 150 560 10
2nd 335.596 446 223.734 131 560 0
3rd 336.154 558 223.900 166 560 0
4th 336.467 313 224.000 100 560 0
5th 337 .212 745 224.130 130 560 0
6th 337 .460 248 224.260 130 560 0
7th 338 .007 547 224.376 116 650 90
8th 338 .39 9 392 224.503 127 650 0
9th 339 . 177 778 224.635 132 650 0
10th 339 .601 424 224.773 138 650 0
11th 340 .414 813 224.902 129 650 0
12th 340 . 986 572 225.007 105 650 0
13th 341 .492 506 225.145 138 650 0
14th 341 .605 113 225.278 133 650 0
15th 342.028 423 225.403 125 710 60
16th 342.490 462 225.543 140 710 0
17th 342.961 472 225.685 142 710 0
18th 343.385 424 225.801 116 710 0
19th 344.001 616 225.930 129 710 0
20th 344.834 833 226.076 146 810 100
21st 345.345 511 226.205 129 810 0
22nd 345.802 457 226.342 137 810 0
23rd 346.241 439 226.499 157 810 0
24th 346.800 559 226.623 124 810 0
25th 347.176 376 226.735 112 810 0
26th 347.599 423 226.872 137 810 0
27th 347.890 291 226.930 58 810 0
28th 348 .216 326 227.074 144 850 40
29th 348 .386 170 227.200 126 850 0
30th 348 .514 128 227.322 122 850 0
31st 0 0 0 0 0 0
ToTAlS= 0 13.927 3.869 300
DATE GuESTS lAuNDRy IRRIGATIoN
note 1 0 10 01st 400 400 125 115 174 174
2nd 865 465 240 115 352 178
3rd 1 .298 433 367 127 503 151
4th 1 .724 426 498 131 683 180
5th 2.099 375 601 103 854 171
6th 2.543 444 710 109 1021 167
7th 2.998 455 805 95 1205 184
8th 3 .401 403 9 13 108 1396 191
9th 3 .789 388 1034 121 1561 165
10th 4.201 412 1101 67 1723 162
11th 4.675 474 1200 99 189 9 176
12th 5.099 424 1305 105 2023 124
13th 5.503 404 1408 103 2205 182
14th 5.976 473 1509 101 2398 193
15th 6.322 346 1610 101 2503 105
16th 6.804 482 1723 113 2685 182
17th 7 .232 428 1834 111 2845 160
18th 7 .633 401 1 946 112 3025 180
19th 8 .012 379 2035 89 3206 181
20th 8 .423 411 2143 108 3354 148
21st 8 . 902 479 2254 111 3503 149
22nd 9 .324 422 2362 108 3654 151
23rd 9 .732 408 2472 110 3823 169
24th 10 .232 500 2583 111 4003 180
25th 10 .695 463 2703 120 4155 152
26th 11 .005 310 2809 106 4323 168
27th 11 .436 431 2914 105 4502 179
28th 11 . 865 429 3002 88 4632 130
29th 12.342 477 3112 110 4804 172
30th 12.754 412 3223 111 4974 170
31st 0 0 0 0 0 0
ToTAlS= 12.754 3.213 4.974
monitorinG sheet month sep 13 MONITORING SHEET MONTH SEp 13 (cONTINuEd)
Notes
1. value should be carried over from previous month to generate figure for 1st of month.2. If the month has less than 31 days, fulfill with 0.
Monitoring can also highlight trends of concern, such as a departmental consumption increasing more than would be expected at that level of occupancy This could indicate leakage in the piping system, overflow of balance tanks, leakage of toilet cisterns or a faulty meter Any increase should immedi-ately be apparent to the Water Manager as it will fall outside the normal values associated with that particular area and measures can be taken to rectify the problem
A monitoring sheet is included on the memory stick which may be modified for your hotel to reflect site-specific meter locations and to ensure that readings are recorded correctly A paper copy of this sheet should be used by the facilities managers for manual data entry during daily rounds, and the Water Manager should input this at the end of the month into the electronic spreadsheet (see blue columns in the sample monitoring sheet from the fictitious hotel Gwaylo Springs)
46
Training Staff
6
Sustainable water management is truly a team effort All the technological gadgets in the world won’t help if staff mem-bers leave taps running, for ex-ample It is essential that all staff members are aware of the WMP and know how they can also contribute to its success
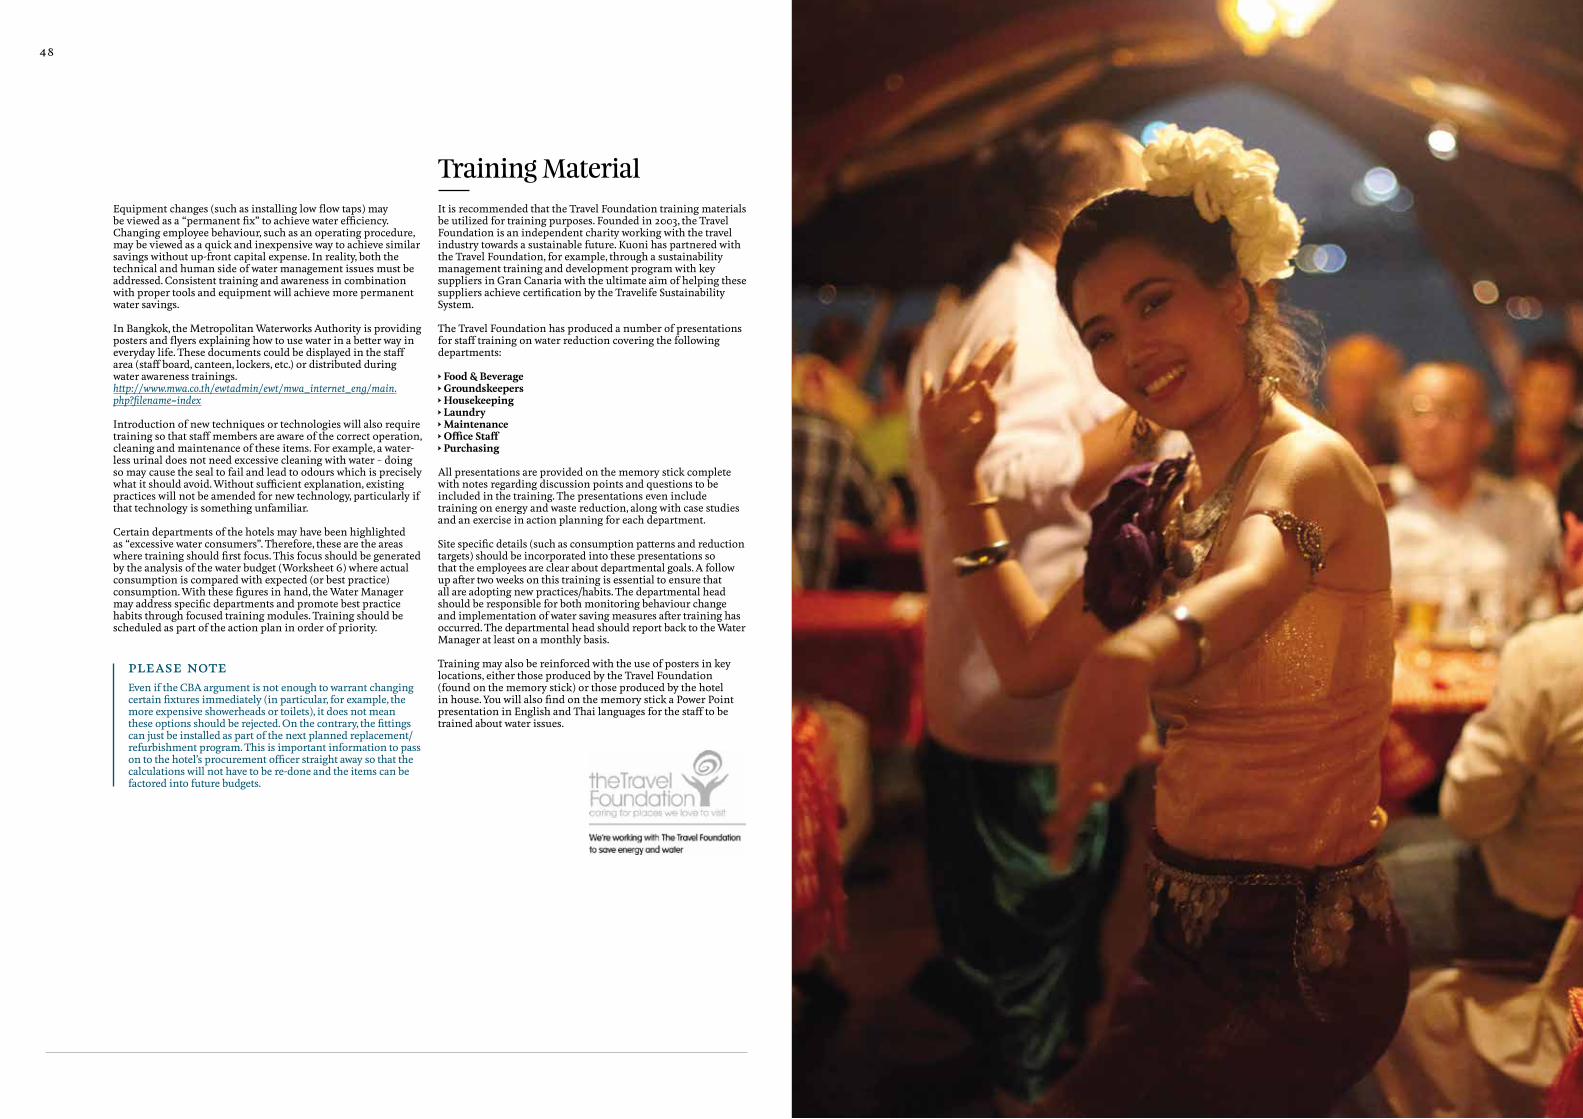
4948 marKeting and sales |
Equipment changes (such as installing low flow taps) may be viewed as a “permanent fix” to achieve water efficiency Changing employee behaviour, such as an operating procedure, may be viewed as a quick and inexpensive way to achieve similar savings without up-front capital expense In reality, both the technical and human side of water management issues must be addressed Consistent training and awareness in combination with proper tools and equipment will achieve more permanent water savings
In Bangkok, the Metropolitan Waterworks Authority is providing posters and flyers explaining how to use water in a better way in everyday life These documents could be displayed in the staff area (staff board, canteen, lockers, etc ) or distributed during water awareness trainings http://www.mwa.co.th/ewtadmin/ewt/mwa_internet_eng/main.php?filename=index Introduction of new techniques or technologies will also require training so that staff members are aware of the correct operation, cleaning and maintenance of these items For example, a water-less urinal does not need excessive cleaning with water – doing so may cause the seal to fail and lead to odours which is precisely what it should avoid Without sufficient explanation, existing practices will not be amended for new technology, particularly if that technology is something unfamiliar
Certain departments of the hotels may have been highlighted as “excessive water consumers” Therefore, these are the areas where training should first focus This focus should be generated by the analysis of the water budget (Worksheet 6) where actual consumption is compared with expected (or best practice) consumption With these figures in hand, the Water Manager may address specific departments and promote best practice habits through focused training modules Training should be scheduled as part of the action plan in order of priority
It is recommended that the Travel Foundation training materials be utilized for training purposes Founded in 2003, the Travel Foundation is an independent charity working with the travel industry towards a sustainable future Kuoni has partnered with the Travel Foundation, for example, through a sustainability management training and development program with key suppliers in Gran Canaria with the ultimate aim of helping these suppliers achieve certification by the Travelife Sustainability System
The Travel Foundation has produced a number of presentations for staff training on water reduction covering the following departments: h Food & Beverage h Groundskeepers h Housekeeping h Laundry h Maintenance h Office Staff h Purchasing All presentations are provided on the memory stick complete with notes regarding discussion points and questions to be included in the training The presentations even include training on energy and waste reduction, along with case studies and an exercise in action planning for each department Site specific details (such as consumption patterns and reduction targets) should be incorporated into these presentations so that the employees are clear about departmental goals A follow up after two weeks on this training is essential to ensure that all are adopting new practices/habits The departmental head should be responsible for both monitoring behaviour change and implementation of water saving measures after training has occurred The departmental head should report back to the Water Manager at least on a monthly basis
Training may also be reinforced with the use of posters in key locations, either those produced by the Travel Foundation (found on the memory stick) or those produced by the hotel in house You will also find on the memory stick a Power Point presentation in English and Thai languages for the staff to be trained about water issues
Training Material
please noteEven if the CBA argument is not enough to warrant changing certain fixtures immediately (in particular, for example, the more expensive showerheads or toilets), it does not mean these options should be rejected On the contrary, the fittings can just be installed as part of the next planned replacement/refurbishment program This is important information to pass on to the hotel’s procurement officer straight away so that the calculations will not have to be re-done and the items can be factored into future budgets

50
Creating Customer Awareness
7
Your clients want to know that their trip is not having a nega-tive impact on the environment, and the Kuoni Water Champion Award is a great way to let them know just that When intro-duced and promoted correctly, guests will not only assist with your water reduction measures but will respect your establish-ment for its duty of care to the environment

5352
Hoteliers are often concerned that by asking guests to change their behaviour or reduce their consumption of something, that this will negatively affect their holiday experience This is not the case if adequate information is provided at all relevant locations so that clients feel good if they participate in the environmental efforts If guests consider their contribution and sustainability efforts an asset rather than a nuisance, they will be happy to participate
Communication with the guests on particular issues is referred to as sensitisation Sensitisation will alert them to the fact the hotel is working hard on the issue of water reduction and allow them to become involved and offer feedback Specific ways of engaging guests may include the following: 1 Briefing during check in to explain WMP aims and objectives
as well as the hotel sustainability award(s) or environmental policy,
2 Information in guest folder (in room), 3 Information in the hotel lobby (on an environment board, for
example) regarding water reduction actions, water availability in a community context and engagement with the local community to improve access to water
4 Re-emphasis of a towel re-use program, 5 Encourage reduction of tap and shower use, 6 Encourage reporting leaking taps, showers & cisterns, 7 Encourage feedback on other potential water saving measures
in standard guest satisfaction surveys8 Rewarding guests participating in water reduction programs
Upon qualification as a Water Champion, you will have a distinctive award to display at reception, which provides an easy way for guests to be introduced to the project If your hotel already achieved any sustainability awards, certificates or plaques, they should also be displayed at the reception, not in the sales or owners office All staff members must be well informed about the WMP so that they may communicate this to guests and give details regarding specific actions or further sources of information An example of engaging visitors to take part in a laundry re-use scheme is indicated below In this scheme, the customer is encouraged to act in an environmentally-friendly way and is rewarded by knowing that he can donate funds to a local com-munity project or get a voucher reward
There is a new trend regarding towel and bed linen reuse program that was initiated at a large scale by Starwood Interna-tional Hotel Chain, implementing a system called Make A Green Choice, which will be described in the following pages Guests are invited to decline housekeeping during one day and receive a reward for this choice, which can be a donation to a local charity, fidelity points or a voucher (equivalent to the estimated cost of cleaning a room, around 150 THB, 5 USD) Guests feel more comfortable with this scheme as they get a reward for their positive behaviour From the housekeeping operational point of view it’s also easier for the staff to understand when they need to change or not the towels and there is no confusion in the message sent to housekeeping staff: or they clean the room, or they don’t
Gwaylo sprinGs case study
The team of Gwaylo Springs hotel is committing to reduce its environmental footprint by reducing water, energy consumption and waste production (read more in our environmental guide) Our efforts were awarded in 2014 by XXX sustainability labels
We kindly ask you to participate in our “Make A Green Choice” programme For each night you decline housekeeping services (except day of departure), you can receive a voucher for our bar and restaurant or donate this money to the charity we support: Gwaylokids
Thanks to your support we managed to reduce our water consumption by 10 percent last year and to donate 50 000 THB (1 550 USD) to the charity
This means there will be no cleaning, replenishment of toiletries and change of bed linen and towels To participate, please contact the reception before midnight to decline the following day’s services Together we can leave a better planet for our children! Guests need to be informed about the program during check in
http://www frompointato com/wp-content/uploads/2014/04/Sheraton-Westin-Starwood-Make-A-Green-Choice-Program png
this system allows avoidinG two biG concerns.1 Often staff replaces towels although the guests wanted to
reuse them In this case the hotel is sending a bad message to the guests previously informed about the possibility to reuse their towels This is counterproductive and damages the image of the hotel as well as the guest’s experience If your staff is replacing towels in every room, every day, you’d better remove all communication inviting your guests to reuse their towels
2 Another issue is when guests would have liked new towels, but did not receive one As a consequence, they are disappointed and this might even lead to negative reviews on TripAdvisor
tips to create and implement your own towel/bed linen reuse communication in the bedroomh Use readable texts and font size, avoid small letters
Your communication cardboard should measure at least 15x15 cm and should be easy to read
h Consider your guests languages and translate your text depending on where your guests mainly come from (Thai, English, German, Russian, Chinese, etc )
h Mention your sustainability involvement and commitment and refer to your environmental policy, action plan and award(s) if you have any
h Give the guests the choice, the message should encourage rather than put pressure
h Provide the data that you monitor, for example your water or energy savings
h Engage your guests to participate in the reuse programme by rewarding them or donate the equivalent money to a charity and communicate about it
h Implement first your reuse programme in a limited area of the hotel to test your communication tools and monitor the results before you launch the programme in the whole property
h Discuss the programme with your guests: Did they understand the system? Why didn’t they participate? How to make it more efficient?
remarKWhen you implement a decline housekeeping policy you must keep in mind that the bedrooms still need to be regularly cleaned and visited for health and safety reasons It’s particu-larly important in humid locations where it’s not possible to keep bed sheets or towels more than a few days before they start to be impacted by moisture In this case propose the decline housekeeping service for a determined period like two nights, three days for example

5554
Conclusion
SAMPlE PoSTER
WATER SAVING TIPS FOR OUR CUSTOMERS
you can assist this hotel in reaching its target to keep the environment clean and to save precious drinking water. very simple measures,
which do not demand a high effort, can save up to 40 litres per day. If you keep doing the same things at home you could save
4 800 THB (150 uSD) per person a year from your water bill.
✓ Keep the taps closed while you don’t need the water, e. g. when you brush your teeth
✓ Read the instructions for towels in the bathroom and help us save water and detergents
✓ Keep the same pool towel for the whole day
✓ Inform housekeeping immediately if you notice any leaks or running water in your bathroom or anywhere else in the hotel
✓ let us know if you have any water saving ideas of your own!
The business world of today is changing fast Adaptation to these changes at an early stage is key to being well placed for the future and the uncertainties which lie ahead Some things we know for a fact – the climate is less predictable, the world economy is challenging, and natural resources are becoming stretched, especially water in Asia Some things are uncertain – such as the security of our region in years to come Whilst we can’t change or influence many of these factors, we can be prepared; and it will be the best prepared hotels which are able to survive the storms ahead
“Sustainability will become a defining issue for the industry in 2015 and beyond
Rising populations and increasingly scarce resources will provide a challenging business
environment in which sustainability will need to be embedded withinall facets of the industry, rather than regarded as a standalone issue ”
deloitte hospitality 2015
We recognise that all decisions are made within certain limitations and essentially boil down to “Is this worth it?” This manual has given you the tools to be able to answer this question with facts and figures and enhance your ability to make good business decisions Happily, the decisions that make economic sense are often in line with sustainable and responsible management, provid-ing these are considered with an adequate timeframe It is no longer possible to work with a short term view To prosper in today’s dynamic, challenging and exciting environment, you have to think to the future

5756
Annex
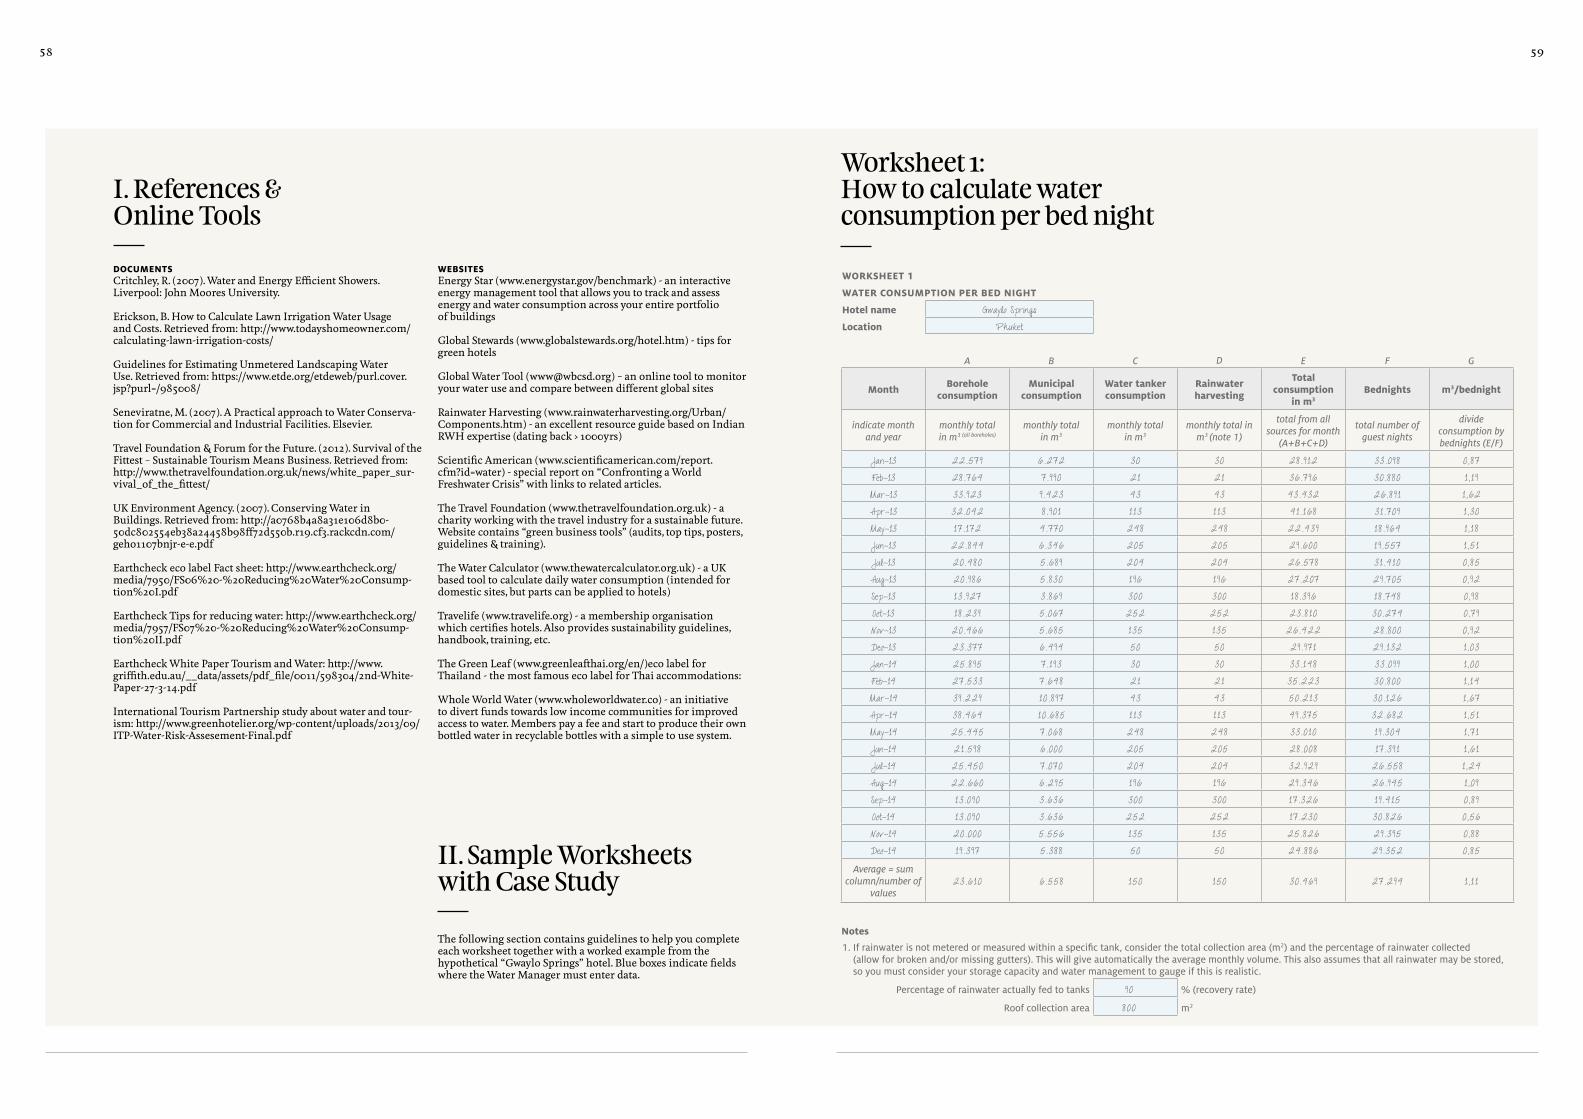
5958
worKsheet 1
water consumption per bed niGht
hotel name Gwaylo Springslocation Phuket
A B C D E F G
month borehole consumption
municipal consumption
water tanker consumption
rainwater harvesting
total consumption
in m3bednights m3/bednight
indicate month and year
monthly total in m3 (all boreholes)
monthly total in m3
monthly total in m3
monthly total in m3 (note 1)
total from all sources for month
(A+B+C+D)
total number of guest nights
divide consumption by bednights (E/F)
Jan-13 22.579 6 .272 30 30 28 . 9 12 33 .098 0 ,87Feb-13 28 .764 7. 9 90 21 21 36.796 30 .880 1 , 1 9Mar-13 33 . 923 9 .423 43 43 43.432 26.891 1 ,62Apr-13 32.042 8 . 901 113 113 41 . 168 31 .709 1 ,30May-13 17 . 172 4.770 248 248 22.439 18 . 964 1 , 18Jun-13 22.844 6.346 205 205 29 .600 19 .557 1 ,51Jul-13 20 .480 5 .689 204 204 26.578 31 .410 0 ,85Aug-13 20. 986 5.830 196 196 27.207 29 .705 0 , 92Sep-13 13 . 927 3 .869 300 300 18 .396 18 .748 0 , 98Oct-13 18 .239 5 .067 252 252 23.810 30 .274 0 ,79Nov-13 20.466 5.685 135 135 26.422 28.800 0 , 92Dec-13 23.377 6.494 50 50 29 . 971 29 . 132 1 ,03Jan-14 25.895 7 . 1 93 30 30 33 . 148 33 .09 9 1 , 00Feb-14 27.533 7 .648 21 21 35.223 30 .800 1 , 14Mar-14 39 .229 10 .8 97 43 43 50 .213 30 . 126 1 ,67Apr-14 38 .464 10 .685 113 113 49 .375 32.682 1 ,51May-14 25.445 7.068 248 248 33 .010 19 .304 1 ,71Jun-14 21 .598 6 .000 205 205 28.008 17 .391 1 ,61Jul-14 25.450 7 .070 204 204 32.929 26.558 1 ,24Aug-14 22.660 6.295 196 196 29 .346 26.945 1 ,0 9Sep-14 13 .090 3 .636 300 300 17 .326 19 .415 0 ,8 9Oct-14 13 .090 3 .636 252 252 17 .230 30 .826 0 ,56Nov-14 20.000 5 .556 135 135 25.826 29 .395 0 ,88Dec-14 19 .397 5 .388 50 50 24.886 29 .352 0 ,85
Average = sum column/number of
values23.610 6 .558 150 150 30 .469 27.294 1 , 1 1
documents Critchley, R (2007) Water and Energy Efficient Showers Liverpool: John Moores University Erickson, B How to Calculate Lawn Irrigation Water Usage and Costs Retrieved from: http://www todayshomeowner com/calculating-lawn-irrigation-costs/ Guidelines for Estimating Unmetered Landscaping Water Use Retrieved from: https://www etde org/etdeweb/purl cover jsp?purl=/985008/ Seneviratne, M (2007) A Practical approach to Water Conserva-tion for Commercial and Industrial Facilities Elsevier Travel Foundation & Forum for the Future (2012) Survival of the Fittest – Sustainable Tourism Means Business Retrieved from: http://www thetravelfoundation org uk/news/white_paper_sur-vival_of_the_fittest/ UK Environment Agency (2007) Conserving Water in Buildings Retrieved from: http://a0768b4a8a31e106d8b0-50dc802554eb38a24458b98ff72d550b r19 cf3 rackcdn com/geho1107bnjr-e-e pdf Earthcheck eco label Fact sheet: http://www earthcheck org/media/7950/FS06%20-%20Reducing%20Water%20Consump-tion%20I pdf
Earthcheck Tips for reducing water: http://www earthcheck org/media/7957/FS07%20-%20Reducing%20Water%20Consump-tion%20II pdf
Earthcheck White Paper Tourism and Water: http://www griffith edu au/__data/assets/pdf_file/0011/598304/2nd-White-Paper-27-3-14 pdf
International Tourism Partnership study about water and tour-ism: http://www greenhotelier org/wp-content/uploads/2013/09/ITP-Water-Risk-Assesement-Final pdf
websitesEnergy Star (www energystar gov/benchmark) - an interactive energy management tool that allows you to track and assess energy and water consumption across your entire portfolio of buildings Global Stewards (www globalstewards org/hotel htm) - tips for green hotels Global Water Tool (www@wbcsd org) – an online tool to monitor your water use and compare between different global sites Rainwater Harvesting (www rainwaterharvesting org/Urban/Components htm) - an excellent resource guide based on Indian RWH expertise (dating back > 1000yrs)
Scientific American (www scientificamerican com/report cfm?id=water) - special report on “Confronting a World Freshwater Crisis” with links to related articles The Travel Foundation (www thetravelfoundation org uk) - a charity working with the travel industry for a sustainable future Website contains “green business tools” (audits, top tips, posters, guidelines & training) The Water Calculator (www thewatercalculator org uk) - a UK based tool to calculate daily water consumption (intended for domestic sites, but parts can be applied to hotels) Travelife (www travelife org) - a membership organisation which certifies hotels Also provides sustainability guidelines, handbook, training, etc The Green Leaf (www greenleafthai org/en/)eco label for Thailand - the most famous eco label for Thai accommodations: Whole World Water (www wholeworldwater co) - an initiative to divert funds towards low income communities for improved access to water Members pay a fee and start to produce their own bottled water in recyclable bottles with a simple to use system
I. References & Online Tools
II. Sample Worksheets with Case Study
The following section contains guidelines to help you complete each worksheet together with a worked example from the hypothetical “Gwaylo Springs” hotel Blue boxes indicate fields where the Water Manager must enter data
Worksheet 1: How to calculate water consumption per bed night
notes
1. If rainwater is not metered or measured within a specific tank, consider the total collection area (m2) and the percentage of rainwater collected (allow for broken and/or missing gutters). This will give automatically the average monthly volume. This also assumes that all rainwater may be stored, so you must consider your storage capacity and water management to gauge if this is realistic.
Percentage of rainwater actually fed to tanks 90 % (recovery rate)
Roof collection area 800 m2

6160
unit cost calculation for water
hotel Gwaylo Springsaverage daily consumption (m3) Ψ 1015 ,6 see worksheet 1 column E average/30
number of rooms Φ 750
Groundwater - supply costs
a proportion of supply 77 ,5% % from worksheet 1 =A/E (averages) x 100%
b Groundwater authority license 600 THB per well
c Groundwater authority rates 3 ,0 THB/m3 standard rate in Phuket is 3 THB/m3
d Well/borehole development 100 .000 THB borehole/well construction
e Lifetime 20 yrs estimate life expectancy of well
f Pump(s) - intial cost 40.000 THB
g Lifetime 5 yrs estimate life expectancy of pump(s)
h Pumping cost - electricity consumption 1 ,7 THB/m3 note 1
i reservoir, tanks investment 15 .000 .000 THB including also equipment
j reservoir, tanks lifetime 25,0 yrs
k number of wells 14 wells
Groundwater - associated costs
i Water softener - intial cost 150 .000 THB installation price
j Water softener - lifetime 15 yrs estimate length of time until replacement
k Water softener -annual costs 50 .000 THB filters/materials/maintenance
l Amount of water processed 500 m3/day
m Reverse osmosis plant - intial cost 500 .000 THB installation price
n Reverse osmosis plant - lifetime 15 yrs estimate length of time until replacement
o Reverse osmosis plant - annual costs 50 .000 THB filters/materials/maintenance
p Amount of water processed 100 m3/day
Groundwater - salt damage costs(only complete this section if groundwater is saline)
q labour for cleaning of pipes/fittings 5 man days/month where salt has caused scaling & blockages
r Daily labour cost 500 THB/day average salary of maintenance staff
s Fittings - optimal lifetime 15 yrsestimate optimal number of years of operation of pipes, taps, shower heads
t Actual lifetime 8 ,0 yrsestimate the actual lifetime as a result of salt damage
u Cost of fittings affected 900 THB/room estimate per room (note 2)
v Machinery - optimal lifetime 15 yrsestimate for machinery the optimal number of years of operation (note 3)
w Actual lifetime 12 yrs estimate the actual number of years of operation
x Machinery cost 500 .000 THBcombined cost of solar and electric boilers, washing machines, dishwashers etc
Worksheet 2: How much does one cubic meter of water cost?
Gwaylo sprinGs case study
This hotel sources water from all kind of origins: borehole (wells), municipal, water tanker and rainwater Note that the rainwater calculation is automatically generated from the data you will provide (water harvesting surface + recovery estimation) at the bottom of the sheet In this example, rainwater is collected from a roof area of 800m2 and the recovery rate is 90% as gutters are new When you complete Column A, B, C, F, you need to provide two years data The best would be to start from January but you can also start from another month of the year
If you have no data for one of the A,B,C columns, please fill in “0” The data we are looking for is the average bed night water consumption in litres per bed night
In this example the result is 1 11 m3 / day (1,110 litres per day) This data will be useful to benchmark your hotel consump-tions with the other hotels in Thailand and it will also represent a reference for your own calculations, to monitor the impact of your Water Management (as this data is linked to your occupancy it could also register huge variation if your hotel has seasonal activity with low and high occupancies)

6362
municipal water - supply costs
a proportion of supply 22% % (worksheet 1) =B/E (averages) x 100%
b Total monthly water consumption 6.558 m3/month (worksheet 1)
c Total monthly water cost 103 .623 THBprogressive scale, >200m3/month = 15,8 THB/m3 (see 'water rates' sheet)
d Total annual water cost 1 .243.480 THB
e water cost (thb/m3) 15 ,8 =d/(b*12)
water tanKer (bowser)
a proportion of supply 0 ,49% % (worksheet 1) =C/E (averages) x 100%
b Size of tankers 6.000 litres per truck
c Cost of tanker 600 THB
d water cost (thb/m3) 100 =1000*c/b
rainwater (note 4)
a Proportion of supply 0 ,5% % (worksheet 1) =D/E (averages) x 100%
b Initial cost 20.000 THB gutters and tanks
c Lifetime 15 yrs estimated time until replacing
d Collection area (m2) 800 m2 (worksheet 1) sum plan area of all rooves with gutters
Location PHenter “BK” for Bangkok, “PH” for Phuket or “CM” for Chang Mai
e Annual rainfall 2.499 mm (sheet RWH) average annual rainfall figures
f Recovery rate 90% (worksheet 1) based on missing/broken gutters and pipelines
g Annual volume (m3) 1 .79 9 =d*e*f/1000
h water cost (thb/m3) 0 ,7 =b/c/g
treated wastewater (note 5)
a Initial cost 15 .000 .000 THB installation, infrastructure req.
b Lifetime 25 yrs estimated time until system needs replacing
c Running cost - power requirement 4,0 kW
d Running cost - hrs running/day 12 hrs
e Running cost - additives/labour etc 300 .000 THB/yrongoing costs associated with the system (not infrastructure)
f Treated effluent produced (m3/day) 406 =daily flow(i)* % of total water used into system (approx 40% if irrigating)
g Total annual water cost (THB) 900 . 187 =(a/b)+(c*d*3,9)+e
h water cost (thb/m3) 6,1 =g/(365*f)
Gwaylo sprinGs case study
Groundwater:Most of the hotel water is supplied by fourteen wells, each costing 100,000 THB (3,113 USD) to develop and 40,000 THB (1,245 USD) for the pump A huge water reservoir was built for a cost of 15,000,000 THB (407,063 USD) A water softener and a reverse osmosis are in place and treat 100 m3/day which are used for drinking water for staff and guests This results show a net cost of treated groundwater of 8 1 THB/m3 (0 25 USD/ m3)
Municipal water:Municipal water is providing 22% of the total water supply, at a cost of 15 8 THB per m3 (0 5 USD/ m3), almost twice more expensive as groundwater
Water tanker:Occasionally water tankers are required to deliver water with an average cost of 100 THB/m3 (3 1 USD/m3) so they are only used in times of emergency Water tankers represent the most expensive and less sustainable way to supply water to a hotel
Rainwater:There is a rainwater harvesting system on the utility build-ings covering a total surface area of 800 m2 which contributes 0 5% of the total water requirement at a cost of only 0 7 THB/m3 (0 02 USD/m3) Rainwater harvesting represents a huge potential for offsetting expensive other water supplies
Treated wastewater:There is a waste water treatment plant on site processing 40% of the total water consumed in the hotel Most of this water is used for gardens The cost of this treated water is 6 1 THB per m3 (0 18 USD/m3)
now do the calculations……
water cost (THB/m3)
proportion of supply (%)
a Groundwater 8 , 1 77% pull figures from relevant section above
b Municipal 15 ,8 22% pull figures from relevant section above
c Water tanker 100 ,0 0% pull figures from relevant section above
d Rainwater harvesting 0 ,7 0% pull figures from relevant section above
Do you pay sewerage fees? note 3 no answer "yes" or "no"
e Sewerage cost note 6 0 only if you pay sewerage fees
average water cost (thb/m3) 10 ,2 =(a*a%)+(b*b%)+(c*c%)+(d*d%)+(b*b%*75%)
notes
1. In general groundwater is found at 20-40m on the Thai coast. Pumps can move approximately 2m3/hr per kW of power rating at this head. As 1kWhr = 1 unit = 3,6 THB, this means 1m3 = 1,7 THB.
2. Consider the combined cost of the shower head, taps, toilet cistern etc. which are affected by salt.
3. Consider only the machinery which is affected by salt damage e.g. if clothes washing machines utilise softened water do not include.
4. If no Rain Water Harvesting system is currently in place, you can add a hypothetical system to see the cost implications and savings, more details in Annex Iv.
5. Worksheet 10 allows you to propose a system to calculate relative water cost.
6. only add this section if you are connected to a municipal sewer and pay rates.
now do the calculations……
y Total annual water consumption (m3/yr) 287.260 =Ψ*a*365
z Groundwater supply costs (THB/yr) 2.140 .520 =k*(b + d/e + f/g) + (c+h)*+j/i installation, running and rates
A Groundwater salt cost (labour) 30 .000 =q*r*12 time needed for fixing damaged fittings
B Groundwater salt cost (fittings) 39 .375 =(u*Φ)*(1/t - 1/s) replacement cost of damaged fittings
C Groundwater salt cost (machinery) 8 .333 =x*(1/w - 1/v) replacement/maintenance of machinery
D Softened water costs an additional (THB/m3) 0 ,33 =(i/j +k)/l*365
e Desalinated water costs an additional (THB/m3) 2 =(m/n +o)/p*365
water cost (thb/m3) 8 , 1 =((z+A+B+C)/y)+(D*l/Ψ)+(E*p/Ψ)
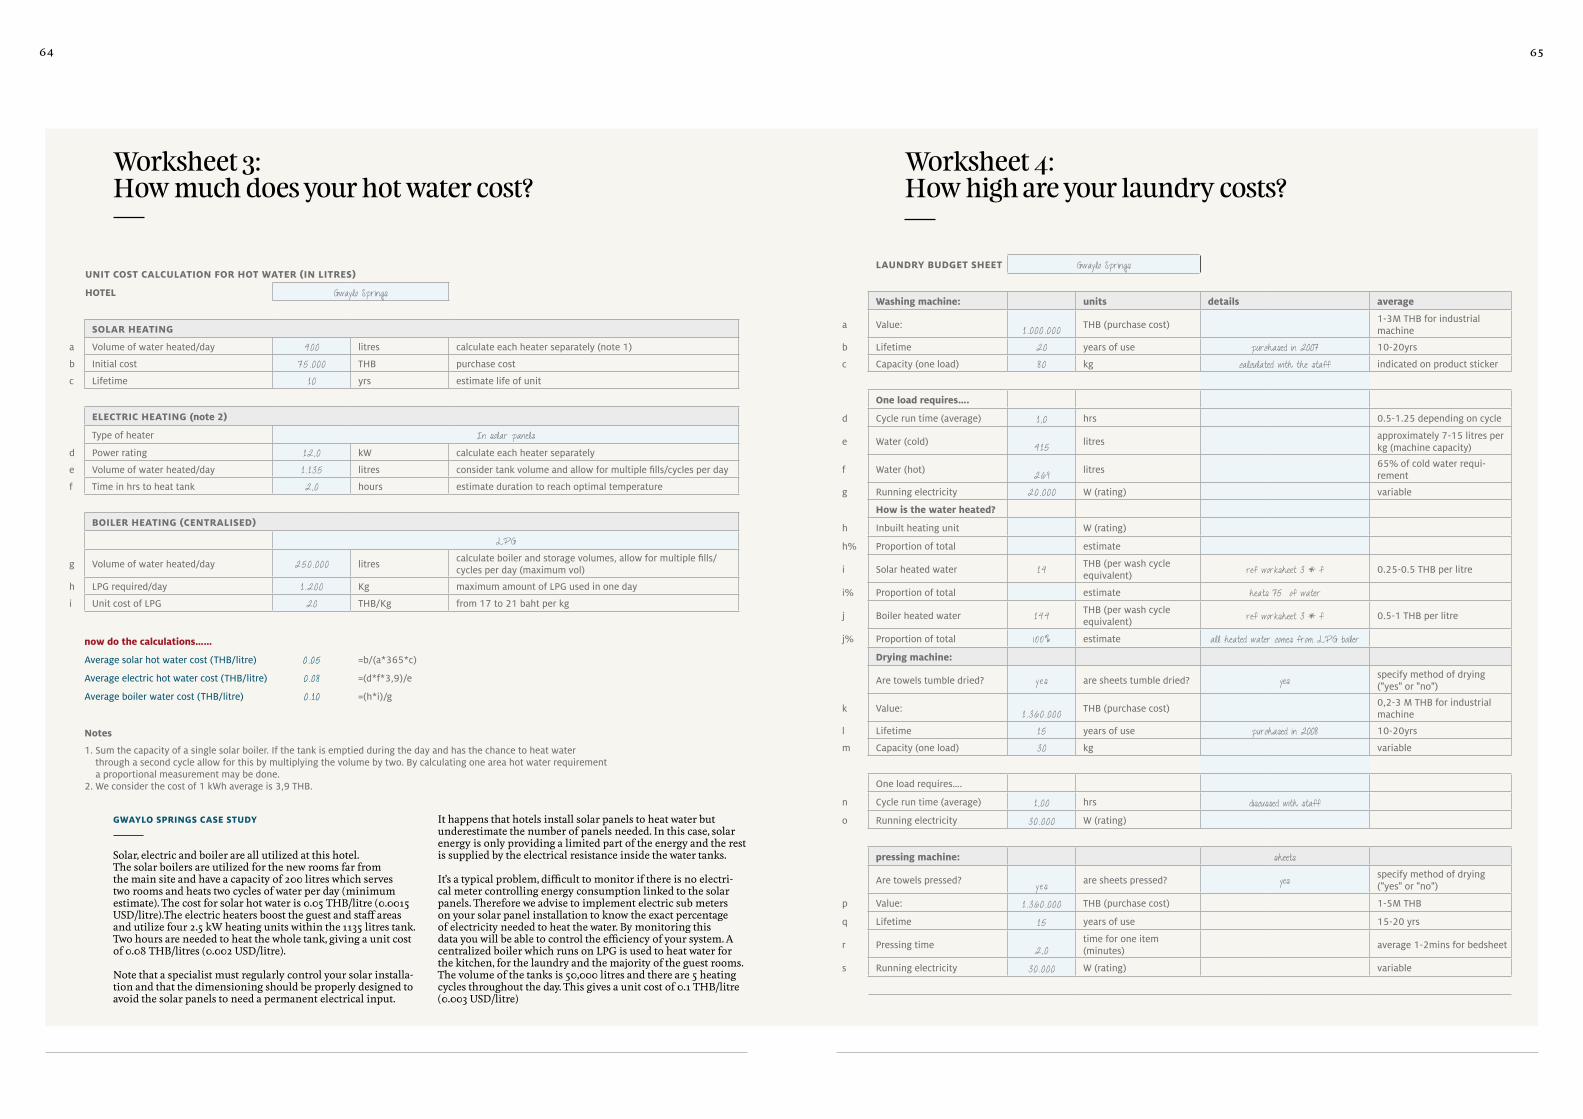
6564
uNIT cOST calculaTION fOR HOT WaTER (IN lITRES)
hotel Gwaylo Springs
solar heatinG
a volume of water heated/day 400 litres calculate each heater separately (note 1)
b Initial cost 75.000 THB purchase cost
c Lifetime 10 yrs estimate life of unit
electric heatinG (note 2)
Type of heater In solar panelsd Power rating 12 ,0 kW calculate each heater separately
e volume of water heated/day 1 . 135 litres consider tank volume and allow for multiple fills/cycles per day
f Time in hrs to heat tank 2,0 hours estimate duration to reach optimal temperature
BOIlER HEaTING (cENTRalISEd)
LPG
g volume of water heated/day 250.000 litrescalculate boiler and storage volumes, allow for multiple fills/cycles per day (maximum vol)
h lPG required/day 1 .200 Kg maximum amount of lPG used in one day
i unit cost of lPG 20 THB/Kg from 17 to 21 baht per kg
now do the calculations……
Average solar hot water cost (THB/litre) 0 .05 =b/(a*365*c)
Average electric hot water cost (THB/litre) 0 .08 =(d*f*3,9)/e
Average boiler water cost (THB/litre) 0 . 10 =(h*i)/g
notes
1. Sum the capacity of a single solar boiler. If the tank is emptied during the day and has the chance to heat water through a second cycle allow for this by multiplying the volume by two. By calculating one area hot water requirement a proportional measurement may be done.
2. We consider the cost of 1 kWh average is 3,9 THB.
Worksheet 3: How much does your hot water cost?
Gwaylo sprinGs case study
Solar, electric and boiler are all utilized at this hotel The solar boilers are utilized for the new rooms far from the main site and have a capacity of 200 litres which serves two rooms and heats two cycles of water per day (minimum estimate) The cost for solar hot water is 0 05 THB/litre (0 0015 USD/litre) The electric heaters boost the guest and staff areas and utilize four 2 5 kW heating units within the 1135 litres tank Two hours are needed to heat the whole tank, giving a unit cost of 0 08 THB/litres (0 002 USD/litre)
Note that a specialist must regularly control your solar installa-tion and that the dimensioning should be properly designed to avoid the solar panels to need a permanent electrical input
It happens that hotels install solar panels to heat water but underestimate the number of panels needed In this case, solar energy is only providing a limited part of the energy and the rest is supplied by the electrical resistance inside the water tanks
It’s a typical problem, difficult to monitor if there is no electri-cal meter controlling energy consumption linked to the solar panels Therefore we advise to implement electric sub meters on your solar panel installation to know the exact percentage of electricity needed to heat the water By monitoring this data you will be able to control the efficiency of your system A centralized boiler which runs on LPG is used to heat water for the kitchen, for the laundry and the majority of the guest rooms The volume of the tanks is 50,000 litres and there are 5 heating cycles throughout the day This gives a unit cost of 0 1 THB/litre (0 003 USD/litre)
Worksheet 4: How high are your laundry costs?
laundry budGet sheet Gwaylo Springs
washing machine: units details average
a value: 1 .000 .000 THB (purchase cost)1-3M THB for industrial machine
b Lifetime 20 years of use purchased in 2007 10-20yrs
c Capacity (one load) 80 kg calculated with the staff indicated on product sticker
one load requires….
d Cycle run time (average) 1 , 0 hrs 0.5-1.25 depending on cycle
e Water (cold) 415 litresapproximately 7-15 litres per kg (machine capacity)
f Water (hot) 269 litres65% of cold water requi-rement
g Running electricity 20.000 W (rating) variable
how is the water heated?
h Inbuilt heating unit W (rating)
h% Proportion of total estimate
i Solar heated water 14 THB (per wash cycle equivalent) ref worksheet 3 * f 0.25-0.5 THB per litre
i% Proportion of total estimate heats 75% of water
j Boiler heated water 144 THB (per wash cycle equivalent) ref worksheet 3 * f 0.5-1 THB per litre
j% Proportion of total 1 00% estimate all heated water comes from LPG boiler
drying machine:
Are towels tumble dried? yes are sheets tumble dried? yes specify method of drying ("yes" or "no")
k value: 1 .360 .000 THB (purchase cost)0,2-3 M THB for industrial machine
l Lifetime 15 years of use purchased in 2008 10-20yrs
m Capacity (one load) 30 kg variable
one load requires….
n Cycle run time (average) 1 , 00 hrs discussed with staffo Running electricity 30 .000 W (rating)
pressing machine: sheets
Are towels pressed? yes are sheets pressed? yes specify method of drying ("yes" or "no")
p value: 1 .360 .000 THB (purchase cost) 1-5M THB
q Lifetime 15 years of use 15-20 yrs
r Pressing time 2,0time for one item (minutes)
average 1-2mins for bedsheet
s Running electricity 30 .000 W (rating) variable

6766
Gwaylo sprinGs case study
The laundry is large with a workforce of 35, and approximately 7 tonnes of washing is processed every day utilizing six different washing machines Machines are automated for detergent dosing All towels and sheets are tumble dried and sheets are then pressed, leading to high power costs Average cost of wash-ing one towel is 11 2 THB (0 3 USD) and one sheet is 14 1 THB (0 43 USD), the majority of which stems from the power requirement for washing and drying (plus pressing for the sheets), labour and chemicals If your laundry is externalized, collect the data from your invoices to fulfil the bottom lines (in blue in the case study), cost per item in THB for one towel in the left column and for one bed sheet in the right column
To complete the last line, you can ask your supplier if water consumption is monitored in m3 per tonne of laundry Then, calculate the amount of water needed to wash one kg of laundry and weigh one towel and one bed sheet
Example: your supplier indicates that 10 m3 of water per tonne of laundry are being used This means: 10,000 litres / 1,000 kg = 10 litres per kgEach towel weighs 0 7 kg, meaning that it needs 0 7 x 10 = 7 litres to be washed Each bed sheet weighs 0 9 kg, meaning that it needs 9 litres to be washed
If above data is not available, you can use as approximate reference: 7 litres per washed towel and 9 litres per bed sheet
all other costs
t Labour 17 .500 THB (total staff cost for one day) 35 people on 400 Baht/day, plus manager depends on size of laundry
u Production 7 .000average kg washed in one day
depends on size of laundry
v Total machine capacity 480 kgs (all washing machines) 6 X 80kgw Total dryer capacity 60 kgs (all drying machines) 2 X 30kgx Towel 200 THB (purchase cost) 250-1000THB
y Lifetime 180 washes/lifetime based on washing every 2nd day for 1yr 200-1000
z Bedsheet 400 THB (purchase cost) 250-1200THB
A Lifetime 360 washes/lifetime based on washing every 2nd day for 2yrs 300-1500
B Chemicals (towels) 0 ,5 THB/kg from Ecolab0,5-1 if autodosing, 1-1,5 if manual
C Chemicals (sheets) 0 ,5 THB/kg from Ecolab0,5-1 if autodosing, 0,9-1,2 if manual
D Sheet weight 1 , 0 kg 18-20 sheets/load variable
e Towel weight 0 ,8 kg 25 towels/load variable
F PoWER 4 THB/kWh (unit) current price MEA costs 2014
G WATER 10 THB/m3 from worksheet 2 “average cost of water”
5 to 100 THB depending on source
now do the calculations…… (note that formulae are case sensitive)
towels (thb per kg)
bedsheet (thb per kg)
water 0 , 1 =(e+f)*G/1000/c 0 , 1 =(e+f)*G/1000/c
hot water - inbuilt unit 0 ,0 =c*d*h*h%*F/1000 0 ,0 =c*d*h*h%*F/1000
hot water - solar (preheat) 0 ,0 =i*i%/c 0 ,0 =i*i%/c
hot water - boiler (preheat) 1 , 8 =j*j%/c 1 , 8 =j*j%/c
power -washing 0 , 9 =g*d*F/c 0 , 9 =g*d*F/c
power - drying 3 ,5 =n*o*F/1000/m 3 ,5 =n*o*F/1000/m
power - pressing 3 ,5 =s*r/60*F/1000 3 ,5 =s*r/60*F/1000
labour 2,5 =t/u 2,5 =t/u
chemicals (detergents) 0 ,5 =B 0 ,5 =C
materials 1 , 1 =x/y 1 , 1 =z/A
machinery - washer 0 ,0 =(c/v)*a/(365*b*u) 0 ,0 =(c/v)*a/(365*b*u)
machinery - dryer 0 , 1 =(m/w)*k/(365*l*u) 0 , 1 =(m/w)*k/(365*l*u)
machinery - presser 0 , 1 =p/(365*q*u) 0 , 1 =p/(365*q*u)
total 14 , 1 =sum all costs 14 , 1 =sum all costs
cost per item in thb 11 ,2 =total*E 14 , 1 =total*D
water per item in litres 6,8 =E*(e+f)/c 8 ,6 =D*(e+f)/c
flow rate measurements
hotel name Gwaylo Springs
location Phuket
A B C D E F G
location size of measuring container Time to fill flowrate (litres/min)
in litrestake five separate readings and record in seconds. insert specific location
e.g. room number, ladies staff toilet, tapstand location etc. =60*A / average(B,C,D,E,F)
rm 223 rm 225 rm 112 rm 86 rm 166
Guest bathroom sink 5 16 19 18 17 21 16 .5
rm 223 rm 225 rm 112 rm 86 rm 166
Guest bathroom shower 5 13 16 10 17 16 20.8
laidies 1 laidies 2 ladies 3 men 1 men 2
Staff washroom sink 5 32 30 25 19 22 11 ,7
laidies 1 laidies 2 ladies 3 men 1 men 2
Staff washroom shower 5 10 13 14 12 11 25.0
garden 1 garden 2 garden 3 garden 4 garden 5
Hosepipes 5 15 17 14 13 15 20 ,3
garden 6 garden 7 garden 8 garden 9 garden 10
Manual sprinklers 5 26 29 22 23 21 12.4
garden 11 garden 12 garden 13 garden 14 garden 15
Auto sprinklers 5 35 35 35 35 32 8 ,7
Worksheet 5: How to measure tap flow rates
Gwaylo sprinGs case study
Flow measurements varied considerably between rooms (as measured in different blocks and floors) Staff showers were in a poor state of repair A few guest taps had the aerator missing, leading to high measured flows (Rooms 223 and 86) Flows around the grounds (labelled “Garden 1” to “Garden 15”) are for estimating the irrigation requirement
It can be seen immediately that the flows for the guest sink and shower, plus staff shower are excessive (if in doubt about the validity of these readings, they should be re-measured) The values that should be reached are around 10 litres per minute for the showers and 6 litres per minute for the taps You can also have a look at the videos, available in the memory stick, explaining in English and Thai, how to measure the water flow

6968
Worksheet 6: Determining the Water Balance
water balance sheet
hotel Gwaylo Springs
average daily consumption (m3) 1015 ,6 i - see worksheet 1 column E average/30
hotel capacity 1500 ii - maximum number of guests
average occupancy 61% iii - see worksheet 1 column F average/30/ii
Number of staff 700
average daily volume (m3) metered estimated best practice
use meter readings if available (or leave blank)
A
calculations below will autofill column
B
optimal figures to aim for
C
laundry 105 ,0 105 ,0
guests 438 ,5 183 ,6
staff 76 , 9 68 ,6
health club/spa 1 ,5 1 ,5
irrigation 174 56
kitchen 45,5
pool 1 9 , 0
cooling tower 150 ,0
others (watersports, golf club etc) 0
1015 ,6 1010 ,2
laundry (estimate)
Average kg washed per day 7 .000 See worksheet 4, row u. Most machines use approximately 15-20litres of hot and cold (combined) water per kg of laundry, consult your machine data sheet
Average consumption (m3/day) 105 ,0 =daily kg * 0.015
Guests (estimate)
locationflowrate (l/min) or flush
volume (l)usage/day (mins or number of flushes)
volume/day (litres) = A*B
notes
A B C
from worksheet 5 note 1
guest bathroom sink flowrate 16 ,5 5 82
guest bathroom shower flowrate 20,8 15 313
guest toilet flush volume 15 ,0 5 75
guest bathtub volume 120 ,0 0 , 1 12 estimate bath capacity and frequency of use
Average total guest usage = sum C values*ii*iii/1000 438 ,5 m3/day
Staff (estimate)
locationflowrate (l/min) or flush
volume (l)usage/day (mins or number of flushes)
volume/day (litres) = A*B
notes
A B C
from worksheet 5 note 1
staff washroom sink 16 ,5 5 82
staff washroom shower 20,8 15 313
staff toilet 15 ,0 5 75
guest bathtub volume 120 ,0 0 , 1 12 est imate bath capac i t y and frequency of use
Average staff usage = sum C values*number of staff/1000 438 ,5 m3/day
health club/spa/Gym (estimate)
number of users/day 30 ,0 5Average consumption (m3/day) 1 ,5 =users*0.05m3/day
irrigation (estimate)
Total irrigated area (m2) 15 .000 a note 2
Manual - hosepipe proportion 50% b
number of hosepipes 50 c
hours of use per day 4 d
flowrate (l/min) 20 e note 3
Manual - sprinkler proportion 0% f
number of sprinklers g
hours of use per day h
flowrate (l/min) 12 i note 3
Automatic - spinkler proportion 50% j
number of sprinklers 50 k
hours of use per day 4 l
flowrate (l/min) 9 m note 3
Average consumption (m3/day) =0.06*((b*c*d*e)+(f*g*h*i)+(j*k*l*m)) 174 water point calc
optimal consumption (m3/day) =a*0.005*75% 56 note 4 - green grass calc
Kitchen (estimate)
Average consumption (m3/day) 45,5 =ii*iii*0.05m3/day note 5
pool (estimate)
total surface area (m2) 3 .000 a add all pools surface area
backwash volume per day (l) 10 .000 b add all pools backwash volume (estimate)
Average consumption (m3/day) 1 9 , 0 =(a*0.003)+(b/1000) note 6
cooling tower (estimate)
number of cooling towers 2monthly fresh water supply 4.500 Average consumption (m3/day) 150

7170
Gwaylo sprinGs case study
There were no sub meters in place when the case study work-sheet was completed All the data provided permit to estimate the water consumptions for each department As soon as the sub meters will be in place it will be possible to compare these estimations with the real data
Laundry – the estimated consumption of 105 m3 per day is the same as the estimated “best practice” Tips:h Ensure machines operate with full load to reduce water and
chemicals used per tonne washed h Explore the possibility to reuse water from previous rinse
cycles by installing holding tanks This used water could also be utilized in staff toilets
h Control the leaks and repair any water loss as fast as possible
Guest Rooms - the estimated values for the guest consumption are high at 438 5 m3 per day based on the measured tap and shower flows and toilet flush volume Regarding the bathtub it was estimated that an average of 10% guests take one bath everyday The best practice consumption of 183 1 m3 per day suggests that it should be easy to reduce water consumption by implementing new water saving devices in showers and taps
Staff Facilities – the estimated values were based on tap and shower flows and are a bit higher than the best practice values
Health Club/Spa – this is anticipated to be a minimal amount but there is no meter to prove this
Irrigation – The estimate value was based on tap flows and wa-tering regime to be 174 m3/day Best practice value is based on 5 mm/m2 of water per day, meaning 5 litres per m2 In our example the garden size is 15,000 m2, so the best practice would be 15,000 X 5 = 75,000 litres, we also consider an irrigation efficiency of 75%, then the final estimated best practice data is: 75,000 X 75% = 56,250 litres (56 in the spreadsheet as it’s cubic meters)This indicates the irrigation system could be improved and water volumes significantly reduced The discrepancy between estimated and best practice could indicate leakages The differ-ence may also be attributable to high irrigation during the dry season, so monthly variations should be analyzed
Kitchen – the kitchen is not metered but is anticipated to use approximately 45 5m3/day based on reasonable kitchen practices In this calculation we propose a reference value of 50 litres per guest per day This data should be carefully analyzed depending on how many meals usually your guests have in the hotel There is also a difference between buffet and individually served plates If your guests are only having buffet breakfast and lunch, you should change the value in case C68, to 0 03 instead of 0 05 (=C6*C5*0 03)
Pool – The pool is not metered but was estimated to use 19m3/day based on maintaining levels All swimming pools require pool filtration systems to keep the water clean, including pumps, filters, drains and skimmers Filter cleaning represents the greatest use of water Although water use depends on the type of filter system installed and the extent to which the pool is used, consider the following:
h Clean filters only when necessary and not on a set schedule (i e , clean only when the filter is no longer operating effectively and not once every day) h Utilize the sight glass if one is installed to monitor the visual quality of the backwash water running through the filter and determine when backwashing is complete, rather than back-washing for a predetermined set amount of time
notes
1. Guests will take longer showers than staff. Hot water showers will last longer than cold water showers. Toilet usage reflects number of flushes. values are noted per person (guest or staff).
2. use a site map, building plans or google earth image to measure areas.
3. Do a direct measurement on a selection of taps/pipes as per worksheet 5, for sprinklers also consult product data sheets.
4.The optimal amount of irrigation required is approximately 5mm per day (see Annex vII for details) and an irrigation efficiency of 75% is assumed.
5. Where no information is available on kitchen consumption, a value of 50l/p/day is used. However, this figure is highly dependent on kitchen practices and should be used as an indication only.
6. Water required to keep pools topped up due to losses from evaporation and backwashing, average estimated is 3l per square meter.
Cooling tower – the estimated consumption for the cooling tower indicates that they consume 16% of the total amount of water Water is added to cooling tower systems to balance two main causes of loss: evaporation and blowdown
Evaporation The goal of the cooling tower is to remove heat from the water Therefore evaporation is the main process to reach this goal By improving the energy efficiency of the cooling towers, it will reduce the evaporative load in the tower and the amount of water needed
Blowdown This operation is necessary to evacuate the dissolved solids left after water evaporates from the tower If the concentra-tion of total dissolved solids (TDS) increases, it can cause scale and corrosion The blowdown consists in evacuating a part of water concentrating high level of TDS Controlling the amount of blowdowns will allow you to save water The best mechanism being automatised adding chemicals and starting blowdown depending on the level of TDS in the water
LESS CHEMICALS = LESS WATER FOR BLOWDOWN
As presented in the case study below, it’s also possible to reuse water from the hotel for the cooling towers make-up (fresh water input) It could be waste water after treatment but it could also be water produced by other equipment like air handler condensate or air conditioning splits units, these types of water are especially interesting because they don’t need treatment and contain low levels of minerals
best practiseBest practice: Amari Watergate is recycling a part of its waste water; they are filtered and reused for cooling towers This system will allow saving 36,500 cubic meter per year equivalent to 584,000 THB (18,104 USD)
Cooling towers’ water consumption needs monitoring and represents a priority location to install sub meters In some city hotels, cooling towers can represent up to 40% of the total water consumption Keep in mind that the estimated data represents guidelines and best practices In our example the sum of the metered and estimated total results are very similar with 1010 2 and 1015 6 m3 per day Eventually this might deviate from your calculation results
Kuoni Water Management Manual aims to provide you with the best tools to monitor your water consumption in the different departments of the hotel To get a realistic picture it is fundamental that you implement sub meters and monitor regularly the data You will then identify the areas where you need to focus your attention on to reduce water consumption

7372
worKsheet 8
laundry cost benefit calculations
hotel Gwaylo Springs
a annual bednights 327.531 average bednight figure from worksheet 1 x months of hotel operation in one year
b volume laundered (kg/yr) 2.000 .000 total kgs (note 1)
c item average weight (kg) 0 ,85 Example: 7 items per room weighting 6 kg: average= 6/7= 0,85 kg/item (note 2)
d average item/bednight 7 ,2 =b/c/a
e current re-use 9% from worksheet 7, concerns only the bathtowels (1kg out of 6kg=16,6%) (note 3)
f items currently washed 2.352.941 =a*d, total amount of items washed per year
g improved re-use 25% insert target value
h items potentially washed 2.290 . 9 93 =f*(1-((g-e)*0,166)) (note 4)
i items saved 61 . 948 =f-h
saving (THB/yr) 783 .570 =i*laundry cost from worksheet 4 (average cost)
savings (litres/yr) 476.691 =i*water volume from worksheet 4 (average litres used)
notes
1. Collect data from laundry logs and sum for the year. often logs are indicated as "1 load of white towels" for a certain machine. Relate this to the machine capacity to get kgs laundered.
2. Consider the small and big towels, the carpet, the pillowcases and all bed linen.3. Towels represent only a part of the total laundry, in this example 1kg out of 6kg = 16,6%4. This calculation is including only bath towel percentage: in this example 16,6% = 0,166
Gwaylo sprinGs case study
Laundry logs were studied to obtain information regarding total weight of laundry throughout one calendar year, plus the total weight in kilograms of bath towels and bed sheets laundered during this time You need to calculate the average amount of laundry used in one bedroom during one night to evaluate the impact of the towel reuse programme on the total amount of items laundered Therefore, calculate the number of items, including towels, carpet, bed linen, pillowcases, beach towels, etc and the total weight of these items You divide the total weight by the
number of items and you use this data in the case “c” In our example we found 0 85 kg per item average weight The towel weight is 1kg and the average weight of laundry for one bedroom is 6kg, so the towel reuse programme will have an impact on only 1/6=16 6% of the laundry The current bath towels re-use value from Worksheet 7 is 9% A target value of 25% was deemed by the water team to be achiev-able The hotel will enjoy yearly savings on laundry costs of 783,570 THB (24,290 USD) if this is achieved, in addition to 476 m3 of water saved The reuse programme would have a much bigger impact on cost savings and water if it also includes the bed linen
Worksheet 8: Laundry Cost Benefit Calculations
Worksheet 7: How much do visitors re-use their towels?
Gwaylo sprinGs case study
On Sunday, Pharatah has cleaned 6 rooms of 2 guests each (12 guests), 5 rooms of single guests (5 guests) for a total of 17 guests Out of these 17, she knows that 5 are checking out so we are only interested in the remaining guests
Of these 12 people for whom she has cleaned, if only 2 of them have hung their towels then she would write “12” and “2” respectively in the Sunday column next to her name The same process is continued throughout the week and with other housekeepers
worKsheet 7
TOWEl RE-uSE calculaTION Gwaylo Springs
start date: 31-Aug-14
name
sunday monday tuesday wednesday thursday friday saturdaynumber
of guestshung
towels number
of guestshung
towels number
of guestshung
towels number
of guestshung
towels number
of guestshung
towels number
of guestshung
towels number
of guestshung
towels
Pharatah 12 2 15 1 13 1 12 2 12 2 15 4 11 1
Nawarat 13 1 15 1 11 1 12 1 12 0 15 2 15 2
Kanoskri 12 1 14 2 12 1 13 2 14 1 13 1 15 1
Kulpramote 14 0 13 1 12 0 15 1 14 0 13 1 15 1
total = 51 4 57 5 48 3 52 6 52 3 56 8 56 5A B A B A B A B A B A B A B
now do the calculations…..
C total bednights = 372 sum of all “A” values
D total towels hung = 34 sum of all “B” values
e towels per guest = 1 bathtowels in room (note 1)
% re-use = 9% =D/C/E
notes
1. Hung towels should refer to the main towel the guest is provided with. If more than one such towel is provided in the room you must indicate this in row E.

7574
Gwaylo sprinGs case study
For this hotel the total water savings achievable are approximately 100,000 m3 per year, which is equivalent to more than 2 million THB (62,000 USD) The greatest water and cost savings can be made in the guest showers, due tothe cost of the hot water (this value was used in Row iv) Following this is the staff showers, guest toilet, guest taps and staff taps (in order of savings)
The fastest payback periods are found in the staff sink at approximately two months and a half The guest toilets have the highest installation cost (due to the large number of fittings required and their higher price) and the longest payback period However, the average payback time for all refurbishments combined (including guest toilets) is 2 9 years Therefore, full refurbishment is still a worthwhile investment
calculating payback period J K L
Number of fittings
Installation cost in THB
Payback period (years)
note 2J x cost (G, H
or I))(installation cost/savings = K/F)
Guest bathroom sink 750 225.000 1 ,29Guest bathroom shower 750 900 .000 0 ,65Guest toilet 750 4.500 .000 24,54Staff washroom sink 50 15 .000 0 ,20Staff washroom shower 50 60 .000 0 ,31Staff toilet 30 180 .000 2, 98
Total cost (sum of calculations in column l) 5.880 .000Total payback (M/F total) in year 2,9
notes
1. calculation based on cost of water plus cost of hot water (guest showers only and assuming 30% of total water is hot) = E x (iii +(1000 x iv x 30%))
2. based on number of rooms x fittings per room (i.e. if hot and cold taps separate or via mixer) or number of staff facilities
Worksheet 9: Cost Benefit Analysis for Plumbing Fixtures
worKsheet 9
cost benefit calculations for plumbinG fiXtures
hotel name Gwaylo Springs
location Phuketnumber of rooms 750 worksheet 2
average bednight/yr i 327.531 average bednight figure from worksheet 1 x months of hotel operation in one year
Number of staff (in 24hrs) ii 700
average cost of water iii 10 , 18 THB/m3 (refer to worksheet 2) = 10 .5 x 5 x 327 ,531/1000cost of hot water to rooms iv 0 , 10 THB/litre (refer to worksheet 3)
calculating potential savings A B C D E F
Current flow rate (l/min)
optimal flow rate (l/min)
Difference (l/min)
usage/day (mins)
Potential savings/yr (m3) Savings/yr (THB) note 1
worksheet 5 column E
Annex III =A-B worksheet 6guests = C x D x i/1000 staff = C x D x ii x 0.365
=E x iii
Guest bathroom sink 16 ,5 6 10 ,5 5 ,00 17 . 168 174.777Guest bathroom shower 20,8 10 10 , 8 10 35 .482 1 .381 .709Guest toilet 15 4 11 ,0 5 18 .014 183 .388Do staff washroom showers have hot water?
noanswer “ y es ” or “no ”
Staff washroom sink 11 ,7 6 5 ,7 5 7 .306 74.374Staff washroom shower 25,0 10 15 ,0 5 19 . 163 195 .078Staff toilet 12 4,25 7 ,75 3 5. 940 60 .474
total = 97 . 133 2.009 .326
calculating installation cost for low flow fittings (consult annex vi to select appropriate items)
Sink fitting low flow tap
Product details flow restrictor
Cost (THB) 300 G
Shower fitting low flow showerhead
Product details Cotto Z54 10l/mn
Cost (THB) 1 .200 H
Toilet fitting low flow toilet
Product details American Toilet Ref:2108 4,5/3l/flush
Cost (THB) 6.000 I

7776
action plan summary for Gwaylo Springs
1 CoNSuMPTIoN PER BED NIGHT
your average daily consumption is 1.016 m3/day
your average consumption per bednight is 1,11 m3/bednight
your maximum was 1,71 m3/bednight
your minimum was 0,56 m3/bednight
The industry average is 0,75 m3/bednight
your average value is 1,48 times greater than the industry average
Best practice 0,5 m3/bednight (note 1)
your average value is 2,23 times greater than the industry best practice
2 WATER CoSTS
Primary supply of water is groundwater
This constitues 77,5% of your total supply
Average overall cost of water 10,2 THB/m3
Softened water 7,8 THB/m3
Desalinated water 9,7 THB/m3
Rainwater 1 THB/m3
Water Trucks 100,0 THB/m3
3 HoT WATER CoSTS
Hot water - solar cost 0,05 THB/litre
Hot water - electric heater cost 0,082 THB/litre
Hot water - lPG boiler cost 0,10 THB/litre
4 lAuNDRy CoSTS
laundering one towel costs you 11,2 THB
And uses 6,8 litres of water per item
laundering one sheet costs you 14,1 THB
And uses 8,6 litres of water per item
5 FloW MEASuREMENTS FRoM FITTINGS
Average flow rates in the following areas are
Guest bathroom sink 2,7 times greater than optimal flow
Guest bathroom shower 2,1 times greater than optimal flow
Staff washroom sink 1,95 times greater than optimal flow
Staff washroom shower 2,5 times greater than optimal flow
6 WATER BuDGET ANAlySIS
Water is used in departments as follows (estimate) m3/day % of total
laundry 105 10%
Guests 438 43%
Staff 77 8%
Health club/spa 2 0,1%
Irrigation 174 17%
Kitchen 45 5%
Pool 19 2%
Cooling Tower 150 15%
Others 0 0%
Total average daily consumption (estimate) 1010 m3/day
This data is summarised on the following page
summary of results
worKsheet 10
waste water treatment plant cost benefit
hotel name Gwaylo Springs
location Phuket
irrigation requirement (m3/day) i 174 from worksheet 6 “irrigation daily volume”
average daily consumption (m3/day) ii 1 .016 from worksheet 1 column E/30days
cost of current irrigation water (thb) iii 7 from worksheet 2 row z/y (groundwater) note 1
cost of treated water (thb) iv 6,1 for pre-exisiting system use worksheet 2 row h (treated water), if proposed system complete table below
wastewater treatment system
type of system (note 2) constructed wetland - proposeda Initial cost 1 .500 .000 THB installation, infrastructure req.
b Lifetime 15 yrs estimated time until system needs replacing
c Running cost - power requirement 1 , 0 kW pumps/aerators etc
d Running cost - hrs running/day 12 hrs operating hours (for power only)
e Running cost - additives/labour etc 120 .000 THB/yrongoing costs associated with the system (not infrastructure)
f Water recovery rate (%) 75% proportion of non-irrigation water going into drainage system
g Treated effluent produced (m3/day) 631 =(ii-i)*f total water recovered after treatment
h Total annual running cost (THB) 220.047 =(a/b)+(c*d*3,9)+e
Was the wastewater formerly discharging to a public sewer? note 3 no answer “yes” or “no”
j Sewerage cost saving 0 this should be reflected by your sewerage rates being reduced
average water cost (thb/m3) 1 , 0 =h/(365*g)
k water savings (m3/yr) = 63.491 m3
cost savings (thb/yr) = 473.102 =k*iii
1. Most hotels will utilise groundwater prior to any treatment for irrigation, therefore, this value represents basic pumping/supply costs only.
2. It will be necessary to consult a wastewater engineer to compare various systems.
3. If you were previously discharging into a public sewer you will no longer have to pay these rates.
Gwaylo sprinGs case study
A hypothetical treatment system is proposed here by a wastewater engineer The constructed wetland system utilizes a number of gravel and sand beds, plants and ponds to repli-cate natural conditions It is low in energy requirement – the only power needed being that of the pumps to lift the water to the system No additives are needed, and man hours are low with only 5 days per month for two workers being needed to keep the system clear and perform simple maintenance
Treating this water costs the site 1 THB/m3 (0 03 USD/m3) But more importantly, it saves the hotel from using the more expensive groundwater, saving over 473,000 THB (14,730 USD) every year and reducing groundwater extraction by nearly 64,000 m3 on an annual basis This system requires space for the different basins, which is not always available in the hotel property There are also other water treatment systems on the market, using less space Check with your local suppliers for more details
Worksheet 10: Cost Benefit Analysis of a Wastewater Treatment System

7978
Gwaylo sprinGs case study
The WMP was initiated in August when the consumption per bed night was 1 09 m3/day and meters were placed throughout the site In October the rate decreased to 0 56 m3/day (the lowest value since records began) As a result of sub meters readings and their interpretation (through completion of the worksheets) it was determined that leaks existed These were identified and fixed by October and consumption reduced by nearly 38%
November showed an increase in consumption to 0 88 m3/day which was attributed to the hotel operating on maximum capacity and hosting a number of outside daytime visitors (not reflected by the bed night figures) December showed a further reduction to 0 85 m3/day which is very positive based on this being the driest month of the year and irrigation being at a maximum Guests’ showers were fixed as these had been identified as significant water wasters With these figures to hand, it is anticipated that consumption will continue to fall based on the improvements to the system as a result of the WMP implementation
Kuoni Water Champion Summary
water champion summary sheet
hotel name Gwaylo Springs
location Phuket
cost of water 10 THB/m3 (from worksheet 2)
MoNTH M3/BEDNIGHT % CHANGE NOTeS
Indicate month and year
Insert data from worksheet 3.1 (column F)
(m3/bednight - previous month)/previous month x 100% e.g. ((b-a)/b x 100%
Note events which may affect consumption such as training, modifications, rainy season etc.
a Jan 13 0,87
b Feb 13 1,19 36,41%
c Mrz 13 1,62 35,55%
d Apr 13 1,30 -19,61%
e Mai 13 1,18 -8,86%
f Jun 13 1,51 27,91%
g Jul 13 0,85 -44,09%
h Aug 13 0,92 8,24%
i Sep 13 0,98 7,13%
j Okt 13 0,79 -19,85%
k Nov 13 0,92 16,65%
l Dez 13 1,03 12,14%
m Jan 14 1,00 -2,65%
n Feb 14 1,14 14,19%
o Mrz 14 1,67 45,75%
p Apr 14 1,51 -9,36%
q Mai 14 1,71 13,19%
Jun 14 1,61 -5,82%
Jul 14 1,24 -23,01%
Aug 14 1,09 -12,16%
Sep 14 0,89 -18,06%
okt 14 0,56 -37,37%
Nov 14 0,88 57,19%
Dez 14 0,85 -3,50%
7 ToWEl RE-uSE
Current re-use of towels is 9%
This is 21% less than best practice
8 CBA lAuNDRy
With an improved re-use figure of 25%
you will reduce items laundered by 61.948 per year
Saving a laundry cost of 783.570 THB/year
With a water saving of 476.691 litres/year
Which is equivalent to 0,13% of total water consumption
9 CBA PluMBING FIXTuRES
The total water wasted by fittings is 97.133 m3/year
Which is equivalent to 26% of total consumption
Which costs an extra 2.009.326 THB/year
The total cost of replacing all wasteful fittings is 5.880.000 THB
The payback period for all fittings is 2,9 years
The fittings wasting the most amount of water are guest showers
Which waste a total of 35.482 m3/year
The fittings costing the most in wasted water are guest showers
Which cost an extra of 1.381.709 THB/year
the fittings with the fastest payback period are staff sinks
With a payback period of 0,2 years
The fittings with the longest payback period are guest toilets
With a payback period of 25 years
10 WASTEWATER TREATMENT SySTEM
Type of system proposed constructed wetland
Reduction in water required from other sources 63.491 m3/year
Which is equivalent to 17% of total consumption
Equivalent cost 473.102 THB/year
Gwaylo sprinGs case study
The bed night consumption is much higher than the industry average As the hotel is large, the total volume of water required per day is more than a million litres We can see that ground-water is the primary supply and costs the hotel 10 2 THB/m3 (0 32 USD/m3) Hot water is supplied by solar, electricity and a boiler, the solar and the electric heated water being the cheapest options Laundering towel and sheet costs are 11 2 and 14 1 THB (0 3 and 0 42 USD) respectively Tap and shower flow rates exceed the recommended rates
Guest rooms and irrigation account for the majority of water used at the hotel (combined, they are 60% of the total) Cooling towers, laundry and staff areas are the next greatest consumers (in order) Towel re-use is currently low at 9%, but were this to be improved to 25% then savings of 783,570 THB (24,307 USD) could be realized 26% of total water consumption could be saved with adjusted flow rates, the highest proportion being from guest showers (for both water and cost savings) An investment of 5,880,000 THB (183,390 USD) would pay for itself within 2 9 years based on an annual savings of 2,009,326 THB (62,300 USD) A wastewater treatment system would show great savings in terms of water by reducing consumption by 17%
8% staff
5% kitchen
2% pool
15% cooling tower
17% irrigation
0% health spa/club
43% guests
10% laundry
0% water for each department0% other
notes
1. Katathani Beach Resort Phuket (autonomous water treatment plant, low flow devices installed)
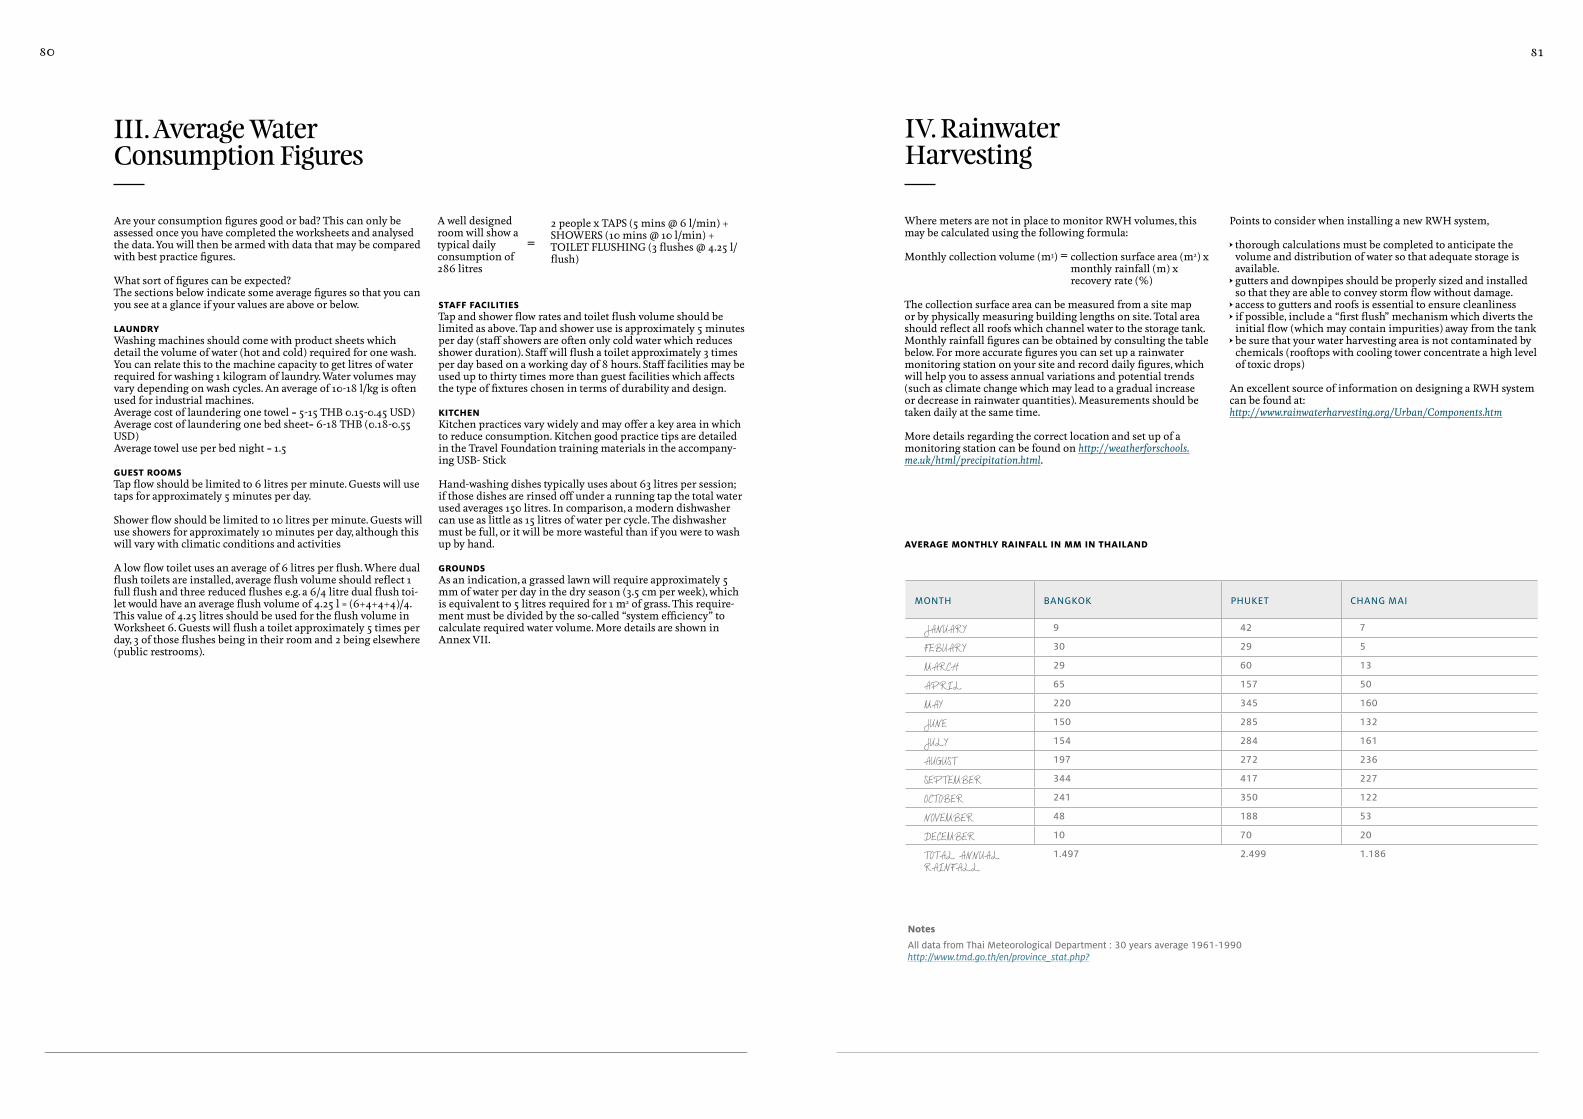
8180
averaGe monthly rainfall in mm in thailand
MoNTH BANGKoK PHuKET CHANG MAI
JANUARY 9 42 7
FEBUARY 30 29 5
MARCH 29 60 13
APRIL 65 157 50
MAY 220 345 160
JUNE 150 285 132
JULY 154 284 161
AUGUST 197 272 236
SEPTEMBER 344 417 227
OCTOBER 241 350 122
NOVEMBER 48 188 53
DECEMBER 10 70 20
TOTAL ANNUAL RAINFALL
1.497 2.499 1.186
notes
All data from Thai Meteorological Department : 30 years average 1961-1990http://www.tmd.go.th/en/province_stat.php?
Are your consumption figures good or bad? This can only be assessed once you have completed the worksheets and analysed the data You will then be armed with data that may be compared with best practice figures What sort of figures can be expected? The sections below indicate some average figures so that you can you see at a glance if your values are above or below laundryWashing machines should come with product sheets which detail the volume of water (hot and cold) required for one wash You can relate this to the machine capacity to get litres of water required for washing 1 kilogram of laundry Water volumes may vary depending on wash cycles An average of 10-18 l/kg is often used for industrial machines Average cost of laundering one towel = 5-15 THB 0 15-0 45 USD)Average cost of laundering one bed sheet= 6-18 THB (0 18-0 55 USD)Average towel use per bed night = 1 5 Guest rooms Tap flow should be limited to 6 litres per minute Guests will use taps for approximately 5 minutes per day Shower flow should be limited to 10 litres per minute Guests will use showers for approximately 10 minutes per day, although this will vary with climatic conditions and activities A low flow toilet uses an average of 6 litres per flush Where dual flush toilets are installed, average flush volume should reflect 1 full flush and three reduced flushes e g a 6/4 litre dual flush toi-let would have an average flush volume of 4 25 l = (6+4+4+4)/4 This value of 4 25 litres should be used for the flush volume in Worksheet 6 Guests will flush a toilet approximately 5 times per day, 3 of those flushes being in their room and 2 being elsewhere (public restrooms)
staff facilitiesTap and shower flow rates and toilet flush volume should be limited as above Tap and shower use is approximately 5 minutes per day (staff showers are often only cold water which reduces shower duration) Staff will flush a toilet approximately 3 times per day based on a working day of 8 hours Staff facilities may be used up to thirty times more than guest facilities which affects the type of fixtures chosen in terms of durability and design KitchenKitchen practices vary widely and may offer a key area in which to reduce consumption Kitchen good practice tips are detailed in the Travel Foundation training materials in the accompany-ing USB- Stick Hand-washing dishes typically uses about 63 litres per session; if those dishes are rinsed off under a running tap the total water used averages 150 litres In comparison, a modern dishwasher can use as little as 15 litres of water per cycle The dishwasher must be full, or it will be more wasteful than if you were to wash up by hand
GroundsAs an indication, a grassed lawn will require approximately 5 mm of water per day in the dry season (3 5 cm per week), which is equivalent to 5 litres required for 1 m2 of grass This require-ment must be divided by the so-called “system efficiency” to calculate required water volume More details are shown in Annex VII
III. Average Water Consumption Figures
IV. Rainwater Harvesting
A well designed room will show a typical daily consumption of 286 litres
2 people x TAPS (5 mins @ 6 l/min) +SHOWERS (10 mins @ 10 l/min) + TOILET FLUSHING (3 flushes @ 4 25 l/flush)
=Where meters are not in place to monitor RWH volumes, this may be calculated using the following formula: Monthly collection volume (m3) = collection surface area (m2) x
monthly rainfall (m) x recovery rate (%)
The collection surface area can be measured from a site map or by physically measuring building lengths on site Total area should reflect all roofs which channel water to the storage tank Monthly rainfall figures can be obtained by consulting the table below For more accurate figures you can set up a rainwater monitoring station on your site and record daily figures, which will help you to assess annual variations and potential trends (such as climate change which may lead to a gradual increase or decrease in rainwater quantities) Measurements should be taken daily at the same time More details regarding the correct location and set up of a monitoring station can be found on http://weatherforschools.me.uk/html/precipitation.html
Points to consider when installing a new RWH system, h thorough calculations must be completed to anticipate the
volume and distribution of water so that adequate storage is available
h gutters and downpipes should be properly sized and installed so that they are able to convey storm flow without damage
h access to gutters and roofs is essential to ensure cleanlinessh if possible, include a “first flush” mechanism which diverts the
initial flow (which may contain impurities) away from the tankh be sure that your water harvesting area is not contaminated by
chemicals (rooftops with cooling tower concentrate a high level of toxic drops)
An excellent source of information on designing a RWH system can be found at: http://www.rainwaterharvesting.org/Urban/Components.htm
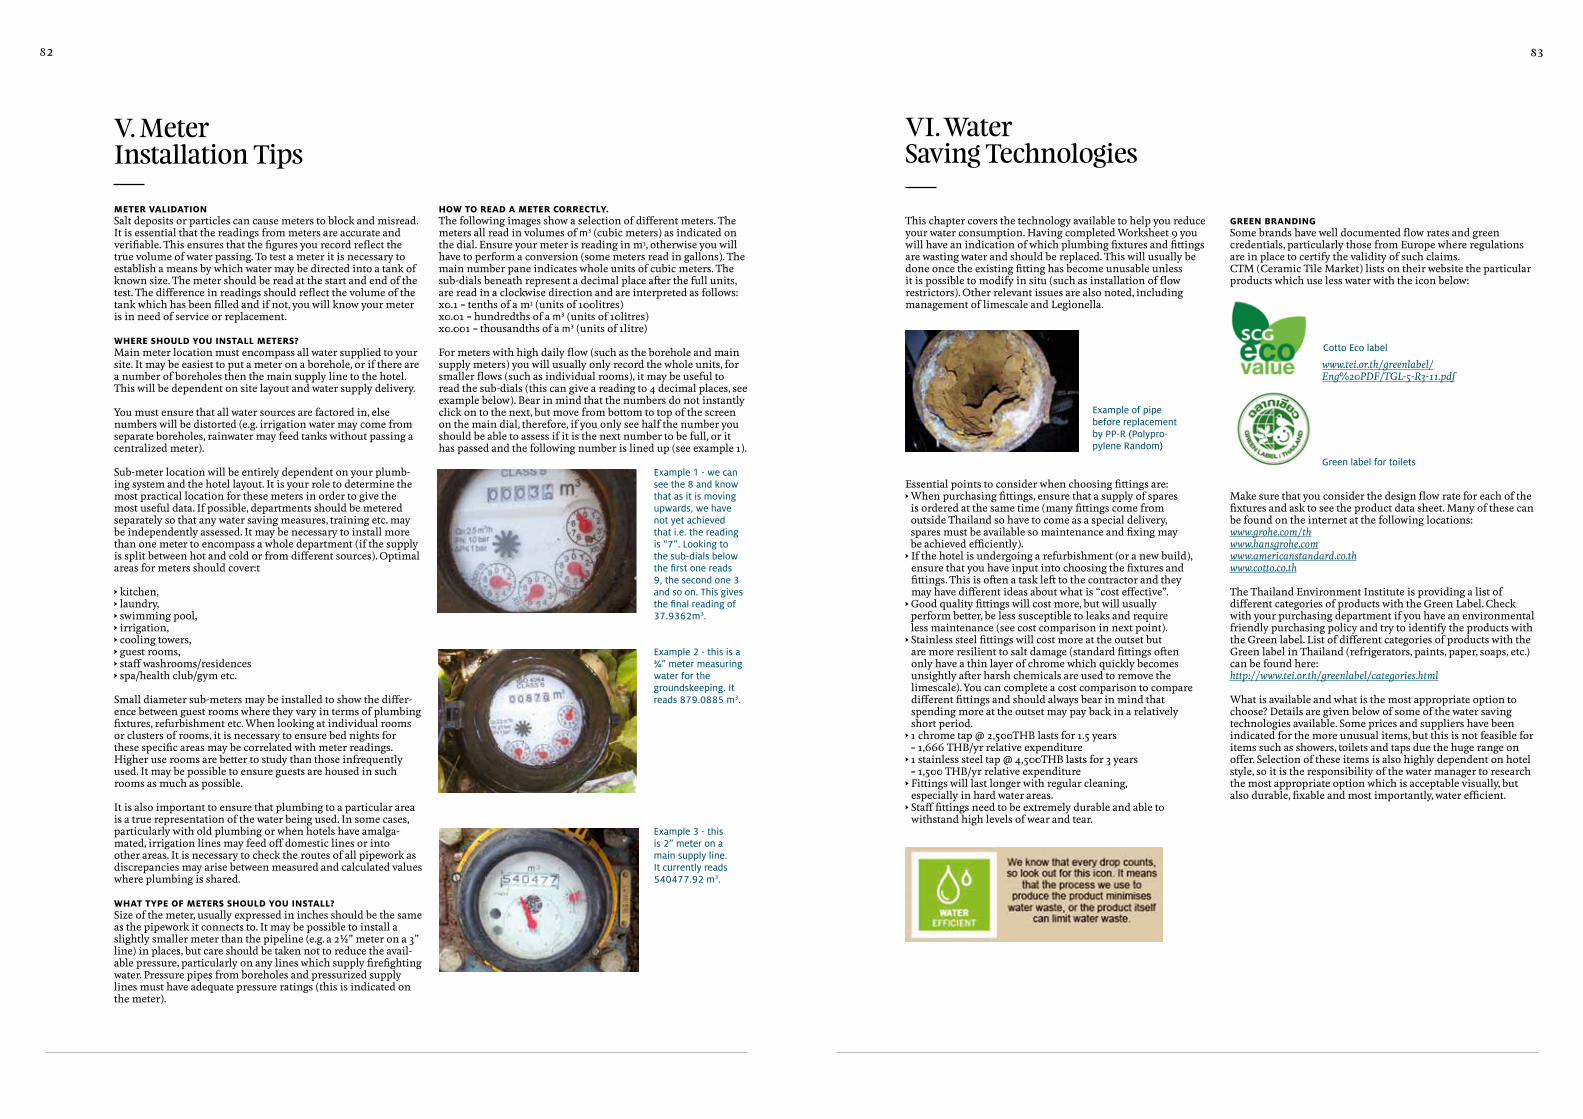
8382
This chapter covers the technology available to help you reduce your water consumption Having completed Worksheet 9 you will have an indication of which plumbing fixtures and fittings are wasting water and should be replaced This will usually be done once the existing fitting has become unusable unless it is possible to modify in situ (such as installation of flow restrictors) Other relevant issues are also noted, including management of limescale and Legionella
Essential points to consider when choosing fittings are: h When purchasing fittings, ensure that a supply of spares
is ordered at the same time (many fittings come from outside Thailand so have to come as a special delivery, spares must be available so maintenance and fixing may be achieved efficiently)
h If the hotel is undergoing a refurbishment (or a new build), ensure that you have input into choosing the fixtures and fittings This is often a task left to the contractor and they may have different ideas about what is “cost effective”
h Good quality fittings will cost more, but will usually perform better, be less susceptible to leaks and require less maintenance (see cost comparison in next point)
h Stainless steel fittings will cost more at the outset but are more resilient to salt damage (standard fittings often only have a thin layer of chrome which quickly becomes unsightly after harsh chemicals are used to remove the limescale) You can complete a cost comparison to compare different fittings and should always bear in mind that spending more at the outset may pay back in a relatively short period
h 1 chrome tap @ 2,500THB lasts for 1 5 years = 1,666 THB/yr relative expenditure
h 1 stainless steel tap @ 4,500THB lasts for 3 years = 1,500 THB/yr relative expenditure
h Fittings will last longer with regular cleaning, especially in hard water areas
h Staff fittings need to be extremely durable and able to withstand high levels of wear and tear
Green brandinG Some brands have well documented flow rates and green credentials, particularly those from Europe where regulations are in place to certify the validity of such claims CTM (Ceramic Tile Market) lists on their website the particular products which use less water with the icon below:
Make sure that you consider the design flow rate for each of the fixtures and ask to see the product data sheet Many of these can be found on the internet at the following locations: www.grohe.com/thwww.hansgrohe.comwww.americanstandard.co.thwww.cotto.co.th
The Thailand Environment Institute is providing a list of different categories of products with the Green Label Check with your purchasing department if you have an environmental friendly purchasing policy and try to identify the products with the Green label List of different categories of products with the Green label in Thailand (refrigerators, paints, paper, soaps, etc ) can be found here: http://www.tei.or.th/greenlabel/categories.html
What is available and what is the most appropriate option to choose? Details are given below of some of the water saving technologies available Some prices and suppliers have been indicated for the more unusual items, but this is not feasible for items such as showers, toilets and taps due the huge range on offer Selection of these items is also highly dependent on hotel style, so it is the responsibility of the water manager to research the most appropriate option which is acceptable visually, but also durable, fixable and most importantly, water efficient
VI. Water Saving Technologies
example of pipe before replacement by PP-R (Polypro-pylene Random)
Green label for toilets
www.tei.or.th/greenlabel/Eng%20PDF/TGL-5-R3-11.pdf
Cotto eco label
meter validation Salt deposits or particles can cause meters to block and misread It is essential that the readings from meters are accurate and verifiable This ensures that the figures you record reflect the true volume of water passing To test a meter it is necessary to establish a means by which water may be directed into a tank of known size The meter should be read at the start and end of the test The difference in readings should reflect the volume of the tank which has been filled and if not, you will know your meter is in need of service or replacement where should you install meters? Main meter location must encompass all water supplied to your site It may be easiest to put a meter on a borehole, or if there are a number of boreholes then the main supply line to the hotel This will be dependent on site layout and water supply delivery
You must ensure that all water sources are factored in, else numbers will be distorted (e g irrigation water may come from separate boreholes, rainwater may feed tanks without passing a centralized meter) Sub-meter location will be entirely dependent on your plumb-ing system and the hotel layout It is your role to determine the most practical location for these meters in order to give the most useful data If possible, departments should be metered separately so that any water saving measures, training etc may be independently assessed It may be necessary to install more than one meter to encompass a whole department (if the supply is split between hot and cold or from different sources) Optimal areas for meters should cover:t h kitchen, h laundry, h swimming pool, h irrigation, h cooling towers,h guest rooms,h staff washrooms/residencesh spa/health club/gym etc
Small diameter sub-meters may be installed to show the differ-ence between guest rooms where they vary in terms of plumbing fixtures, refurbishment etc When looking at individual rooms or clusters of rooms, it is necessary to ensure bed nights for these specific areas may be correlated with meter readings Higher use rooms are better to study than those infrequently used It may be possible to ensure guests are housed in such rooms as much as possible It is also important to ensure that plumbing to a particular area is a true representation of the water being used In some cases, particularly with old plumbing or when hotels have amalga-mated, irrigation lines may feed off domestic lines or into other areas It is necessary to check the routes of all pipework as discrepancies may arise between measured and calculated values where plumbing is shared what type of meters should you install? Size of the meter, usually expressed in inches should be the same as the pipework it connects to It may be possible to install a slightly smaller meter than the pipeline (e g a 2½” meter on a 3” line) in places, but care should be taken not to reduce the avail-able pressure, particularly on any lines which supply firefighting water Pressure pipes from boreholes and pressurized supply lines must have adequate pressure ratings (this is indicated on the meter)
how to read a meter correctly. The following images show a selection of different meters The meters all read in volumes of m3 (cubic meters) as indicated on the dial Ensure your meter is reading in m3, otherwise you will have to perform a conversion (some meters read in gallons) The main number pane indicates whole units of cubic meters The sub-dials beneath represent a decimal place after the full units, are read in a clockwise direction and are interpreted as follows:x0 1 = tenths of a m3 (units of 100litres)x0 01 = hundredths of a m3 (units of 10litres)x0 001 = thousandths of a m3 (units of 1litre) For meters with high daily flow (such as the borehole and main supply meters) you will usually only record the whole units, for smaller flows (such as individual rooms), it may be useful to read the sub-dials (this can give a reading to 4 decimal places, see example below) Bear in mind that the numbers do not instantly click on to the next, but move from bottom to top of the screen on the main dial, therefore, if you only see half the number you should be able to assess if it is the next number to be full, or it has passed and the following number is lined up (see example 1)
V. Meter Installation Tips
Example 1 - we can see the 8 and know that as it is moving upwards, we have not yet achieved that i.e. the reading is “7”. Looking to the sub-dials below the first one reads 9, the second one 3 and so on. This gives the final reading of 37.9362m3.
Example 2 - this is a ¾” meter measuring water for the groundskeeping. It reads 879.0885 m3.
Example 3 - this is 2” meter on a main supply line. It currently reads 540477.92 m3.

8584
low flow showerheadsThese shower heads aim to provide the user with the same quality of shower but with significantly less water 1 Plumbing and pressure distribution within each system may cause flows to vary between locations, but should still be within the acceptable range
’Water-saver’ showerheads usually work by creating finer drops or by incorporating air into the flow Typically, these showerheads require a pressure of at least one bar, which is available from mains pressure and pumped systems but rarely from gravity-feed hot water systems These water-saver showers typically work at a flow rate of between four and nine litres per minute, and the effect is usually perceived as a ‘power shower’ but with perhaps half the flow rate
This showerhead model Z 10 (HM) by Cotto is using between 5 and 6 litres per minute, depending on the pressure.
0
2
4
6
8
10
12
14
16
18
20
0,5
3,754,84
5,82 5,60 5,60 5,71 5,81 5,936,39
1,0 1,5 2,0 2,5 3,0 3,5 4,0
Pressure (Bar)
Flow Rate Z10(HM)L/Min
4,5
tap aerators Unfortunately, it is often not possible to obtain spare aerators for those broken or blocked from salt deposits Therefore, in many hotels with low flow taps, once the aerators become unusable it is necessary to replace the whole tap This may not be done due the cost implication (when the tap itself is still in good condition), which can result in “water saving” taps displaying excessive flows (as a result of the missing aerator) It is essential to make sure that spares are available for any fixtures you purchase, or if not, that the supplier offers a warranty
The pictures below indicate the difference in flow with and without an aerator (note the amount of air bubbles in the first picture) The measured flows were 5 8l/min and 11 2l/min respectively
flow constrictors and reGulatorsThese are devices fitted onto the bottom of the shower hose or inside the tap to physically reduce the diameter of the supply line This ensures that only the optimal flow is transmitted to the shower or tap
Flow constrictors in taps can convert flow to a water saving spray saving approximately 70% of water which is ideal for places where there is no plug in a basin (all water supplied runs away) These are suitable for hot and cold water applications and for mixer taps They are easily removed for cleaning and de-scaling if required Where not locally available, rubber washers have been manufactured in house by some hotels These will need to be tested and installed carefully to ensure that they result in the correct flow
Flow regulators in showers use a similar principal to ensure the correct flow reaches the shower head They are extremely quick to install and can be easily cleaned These should not be used on direct feed electric showers as that the hot/cold balance may be compromised
A tap with an aerator in place
A tap with no aerator in place.
Flow constrictors for taps
Flow regulator for a shower
Flow restrictor for taps
Flow restrictors for taps made of plastic need to be regularly controlled to ensure a good maintenance and avoid that they get worn outor block the water flow 1
A uK trial showed fitting an aerated showerhead was effective in reducing flow- rate by 28% (3.2 l/min) on average, whilst improving or only marginally reducing customer satisfaction with the shower performance. Despite the reduced flow rate, eight of the nine households where an aerated showerhead was fitted asked to keep it.

8786
lOW flOW TOIlETS (aNd dual fluSH) It is essential that toilets flush effectively to maintain standards of hygiene, but designs are now available that use significantly less water than was required in the past Many toilets currently utilize a flush volume of 9litres, yet toilets now available can operate effectively at 4litres In domestic properties, flushing the toilet can represent more than 30% of total water consumption In hotels, this may be approximately 10% (based on a different distribution of water usage) lOW-cOST RETROfIT OpTIONS One of the most cost effective domestic water efficiency measures is to convert an existing toilet to variable flush and/or to optimise the full flush volume Retaining the original siphon avoids the problem of leaking valves effective flushinG volumes An effective flush volume is the volume of water needed to clear the toilet pan and transport solids far enough to avoid blocking the drain In reality, few toilets when fitted, flush with the optimum volume of water Too little water will lead to double flushing and increased risk of the drain blocking, whilst too much will waste water Many devices are available to avoid wast-ing water Cistern displacement devices known as “hippos” are widely available in Europe which are flexible bags full of crystals which expand when wet to occupy 1litre of space, thereby reduc-ing flush volume by that amount As an alternative a suitable plastic bottle from which you will remove any paper or plastic coverage filled with water can be placed in the cistern Before and after you fit this type of device check that the flush works well, that the inlet valve does not leak and that it is adjusted so that the water is up to the level marked in the cistern Lowering the water level will reduce the flush volume, but may also make the flush less efficient If double flushing is needed to clear the pan, the amount of water used could actually increase If there are problems with flushing, remove the cistern displacement device immediately
urinalsUncontrolled urinal flushing can account for large volumes of water used in public and commercial buildings Fitting flush controllers or waterless urinals overcomes this problem Infra-red sensor urinals are also available which will only flush after the sensor detects movement within 1m (after someone has used the unit) Waterless urinals that use no water, other than for daily cleaning, are now widely available and the best designs effectively eliminate odour and trap blockage problems Either option can be a cost effective solution for reducing the amount of water used
Waterless urinals collect simply undiluted urine, which can then be easily treated and used or transported into the drainage system Low flush urinals are also available, where the urine is diluted with water There have been no significant acceptance problems with water- less urinals for men as it does not call for a change of behaviour on their part, but cleaning methodology must be slightly altered i e staff training Waterless urinals come in many shapes and materials and are available both as high quality products and as low-cost options
From a functional point of view the main distinguishing feature of urinals is the type of stench barrier that prevents the emission of gases and odours from urine pipes Such a product is called the EcoSmellStop (ESS) as shown below
meters Specific information regarding meter selection, installation and reading can be found in Annex V Consult local hardware and plumbing stores for 1/2” and ¾” meters (they usually will not hold in stock larger diameter items)
Points to consider limescale Scale forms in areas of “hard” water, i e where the water contains a high proportion of dissolved calcium and/or magnesium This is common in coastal areas where groundwater is pumped from coral aquifers, but also may occur anywhere depending on the local geology Calcium deposits can form on any part of the plumbing system, from showerheads, taps, toilet flush mecha-nisms, dishwashing and laundry machinery, irrigation systems and even on pump impellors and meters This problem occurs with greater intensity where water is heated, such as in water boilers and solar units This “limescale” causes inefficient opera-tion of fixtures and may even give faulty readings on meters It also looks unsightly on fittings and during cleaning (usually with acid based products) may result in permanent tarnishing The ongoing cleaning, maintenance and replacement costs associated with limescale are reflected in Worksheet 2 leGionella The risk from Legionella growing in peripheral parts of the domestic water system such as deadlegs off the recirculating hot water system may be minimised by regular use of these outlets When outlets are not in regular use, weekly flushing of these devices for several minutes can significantly reduce the number of Legionella discharged from the outlet Once started, this procedure has to be sustained and logged, as lapses can result in a critical increase in Legionella at the outlet Where it is difficult to carry out weekly flushing, the stagnant and potentially contaminated water from within the shower/tap and associated dead-leg needs to be purged to drain before the appliance is used It is important that this procedure is carried out with minimum production of aerosols, eg additional piping may be used to purge contaminated water to drain
Automatic drain valves fitted to showers to drain the mixer valve and shower hose after use, can produce conditions within the shower that support the growth of Legionella, and are not recommended as a method for controlling the risk of exposure to Legionella Concern has been raised that spray fittings and aerators might introduce a risk of Legionella by creating aerosols that could be inhaled In practice, well-designed and regulated spray fittings provide a very gentle flow with little or no splashing Laminar flow fittings are an alternative to aerators for high-risk applica-tions such as care homes The temperature of the water is an important factor in the occurrence of Legionella outbreaks Sufficiently hot water will kill off the Legionella Also, regular de-scaling and regulating the flow of water to taps will reduce the amount of aerosol droplets produced, which is how Legionella usually enters the body Water sitting in warm pipes for long periods is another concern that could be made worse by reduced flows However, good water and energy efficient design aims to reduce dead legs and these issues should be considered on a case-by-case basis
more information may be found at: Health & Safety Executive, Legionnaires' disease (www.hse.gov.uk/legionnaires)
Ground staff has a remit to maintain grounds in a good condi-tion and are often not aware of exact quantities of water required to achieve this Irrigation may constitute more than half of the total daily water requirement of a tropical hotel and therefore represents a valuable opportunity for achieving reduction This must however, be done in such a way that the appearance of the grounds is not compromised estimation of actual amount An irrigation survey can yield information regarding current irrigation practices around the site Firstly, document all avail-able irrigation points and how they are used, these can include tap stands (with or without sprinklers), pop up sprinklers, fire hydrants and drip irrigation systems Quantify the flow rate at each point (as per Worksheet 5) and determine the hours of use per day Incorporate this information into Worksheet 6 to calculate the estimated total daily irrigation To check how much water is actually applied during an irrigation session, you can position a number of straight-sided containers in the irrigation zone and measure the depth of water after the irrigation cycle has been completed This should be over the course of 24hours and 1 week so that an average figure may be obtained calculation of optimal amount The amount of water actually required will be highly dependent on climate, plant type and irrigation technique As an indication, a grassed lawn will require approximately 5mm of water per day in the dry season (3 5 cm per week), which is equivalent to 5litres required for 1m2 of grass This requirement must be multiplied by the system efficiency rating explained below
System efficiency relates to how much irrigation water is actu-ally being used by your turf or plants Your system efficiency is based on the type of irrigation equipment installed as well as the maintenance and scheduling of the system A perfect system, op-erating at 100% efficiency, would have no leaks, losses, or waste But no system is 100% efficient - water is lost from runoff, leaks, and evaporation for example Efficiency can also be impacted by poor maintenance such as broken sprinkler heads or caused by scheduling problems such as watering during windy periods or in the middle of the day when evaporation rates are higher The type of irrigation equipment that is used to water the landscape has a big impact on system efficiency For turf and landscape irrigation, there are two main types of equipment: h Sprinkler systems: water delivered across a wide area through
sprinkler heads such as pop-up and rotor heads h Micro irrigation: water delivered at lower pressures directly to
the root zone of the plant via drip or micro- spray equipment h Sprinkler systems tend to have a lower equipment efficiency
ranging between 50% to 70% where micro irrigation have less losses with efficiency ratings between 70% and 90% [Alliance for Water Efficiency 2009]
In addition, many sites utilise hosepipes to manually water some areas (where sprinklers are not available or inappropriate) Whilst losses may be small as all water is applied in some form to the grass, it is extremely inefficient due to irregular coverage and unequal volumes applied
VII. Improving Irrigation Systems

8988
To determine your system efficiency, choose the efficiency rating from the list below that best matches the characteristics of your system [Alliance for Water Efficiency 2009]: h Low Efficiency – 50%: sprinkler type systems that are aging
with poor maintenance and lack of proper scheduling or hosepipes
h Medium Efficiency – 65%: sprinkler type systems that have regular maintenance and proper scheduling
h High Efficiency – 85%: micro irrigation systems that have regular maintenance and proper scheduling
The optimal daily irrigation requirement for your site can be calculated by the following formula: Volume per day = irrigated area (m2) x 3 6 / efficiency (%) Good practice irriGation tips Specific training for groundskeepers is available in the Travelife Foundation training material in the accompanying USB-Stick Other Best Practice guides are: h Test drought resistant grass for suitability within your grounds h Cultivate the soil deeply and dig in large quantities of organic
matter to improve soil structure, soil water retention and water availability for plants Well-rotted garden compost, composted bark and well-rotted farmyard manure are all suitable forms of organic matter
h Replanting grass areas with rockery or alternative low water demand species
h Irrigate between the hours of 5PM till 5AM (where possible) to reduce evapo-transpiration These losses represent water given out to the atmosphere via plants, the rate of which may be twice as fast during sunny daytime periods as at night
h Utilise grey water or treated wastewater for irrigationh Keep equipment well maintained to improve efficiency h Consider installation of proper irrigation system to reduce
wastage and improve efficiency (such as drip irrigation system and soil moisture sensors)
Regular maintenance is crucial if savings are not to be lost through leakage or malfunction Even slow leaks can lead to significant amounts of water being lost if they are not fixed promptly checKinG for leaKs Sub-meters must be installed for this check to be viable at a hotel Take a meter reading last thing at night when everyone has gone home and first thing in the morning before everyone arrives If the reading has changed, indicating water has been used, this is likely to be a leak Any water normally used at night will have to be shut off or accounted for Reading the water meter regularly and calculating the amount of water used per person will allow you to check efficiency measures against benchmarks and previous performance, and can help to identify leaks or other problems quickly
overflows Most hotel toilets and water tanks will have overflows which could indicate cistern mechanism or float-operated-valve leakage Where pressure or temperature relief valves are used, these must discharge in a safe and clear way When valve flush mechanisms and internal overflows for toilets are introduced, leaks are harder to spot than with traditional overflow warning pipes detectinG leaKs automatically There are products on the market that are designed to detect leaking and burst pipes, and either sound an alarm or shut off the water supply to reduce damage and the amount of water wasted Most provide a simple switch to turn off the water when the building is unoccupied for any length of time Since the devices are usually fitted indoors, they do not detect leaks in the pipe between the water meter and the building The main reason for installing these types of devices is to protect the property rather than to conserve water, but the most sophisticated devices can actually help to save water as they can detect very low but continuous flows, for example a leaking ball valve or toilet flush valve The Ecoflo Waterfuse is claimed to detect flows as low as two litres per hour dETEcTING a lEakING fluSH valvE (TOIlETS)
Small leaks can easily go unnoticed but may be detected by the following test: If the toilet has been flushed recently, allow the water under the rim to drain for about a minute Wearing rubber gloves, dry the back of the pan below the rim with toilet paper Any leak should be obvious If you can’t see a leak, hold a sheet of toilet paper against the back of the pan for about 30 seconds and check that it stays dry Since most cisterns with valves have an internal overflow that discharges into the pan, a leak could be due to either the inlet or the flush valve If turning off the water to the toilet quickly stops the leak, check the inlet valve
Finally, one of the most effective methods of leak detection is human observation An underground leakage will gradually saturate the surrounding ground and may result in prolific plant growth on the surface It is extremely valuable to complete regular walk round surveys of the hotel (with the head grounds-man if possible) in order to identify overly green patches which are not attributable to irrigation All staff can also be watchful for surface leaks and overflows during their daily routines By doing so, leaks will more chance of being detected at an early stage before too much water has been lost
Leaks in one bedroom calculation:
If your hotel has 10 rooms with leakage problems, it would mean: 1,200 m3 and 19,200 THB lost every year just because of non reactive maintenance procedures
Small streams make big rivers traditional proverb
VIII. Detecting Leaks
WHERE WATER loSS PER yEARCOST 1M3=16 THB
Tap wasting one drop per second 20,000 litres 320 THB
Toilet with audible leaking 100,000 litres 1,600 THB
TOTAL 120 m3 1,920 THB
IX. Other water saving technologies
micro fibre cleaninG clothes: they are used for all types of glass and mirror cleaning in the bathrooms and need less water and chemicals Ask your detergent supplier if they have this product
air water Generator: this machine transforms humidity into drinkable water thanks to series of filters (electrostatic, sediment, pre-carbon, reverse osmosis membrane, post carbon, micro molecular), allowing for a two-fold advantage by reducing humidity levels and producing drinking water http://www.pure-aqua-thailand.com/
ozone for coolinG tower and laundry: these machines allow to reduce the amount of chemicals and water needed in both cooling towers and laundry http://www.energica.co.th
liquid pool blanKet: to avoid evaporation, you can use this liquid which is harmless for the users, it will conserve between 30-50% of the water that is normally lost to evaporation Ask your swimming pool supplier about the available products in Thailand
waste water treatment system to recycle water and use it for coolinG towersIt’s now possible to recycle a part of your waste water and use it for the cooling towers You will need enough space for the treatment plant (30 m2) plus a reserve tank (5 m3) and a pumping system Thanks to this technology it’s possible to recycle 100m3 per day SynergyComplete, a company based in Bangkok pro-poses to install the system for free and get paid on the savings during a certain amount of years, which makes the operation financially very interesting and viable
Note: 100m3 water reused every day represent a yearly saving of: 100 x 365 x 18 = 657,000 THB (20,367 USD)
build your own rain water reservoirThis solution is only possible for resorts with large land areas and the opportunity to collect rain water from the surroundings These dispositions are unique but can provide important results
Evason Phuket hotel managed to build such a reservoir and is tremendously reducing it needs for external water supplies The water is captured in the reservoir, pumped and treated, before being distributed to the resort The installation cost was 1,160,000 THB (36,000 USD), leading to an annual saving of 10,646,700 THB (330,000 USD) Previous to this reservoir, water was transported to the hotel by means of trucks (WWF, Horwath HTL & HICAP 2010)
9190
published by: Kuoni Group, Zurich, Switzerland
copyright: © 2014 Kuoni Group
Reproduction of this publication for educational or other non-commercial purposes is authorized without prior written permission from the copyright holder provided the source is fully acknowledged. Reproduction of this publication for resale or other commercial purposes is prohibited without prior written permission of the copyright holder.
citation: Kuoni Water Management Manual for Hotels. Thailand: Kuoni. 90pp.
cover design by: Büroecco Kommunikationsdesign GmbH
layout by: Büroecco Kommunikationsdesign GmbH
produced by: Kuoni Group with support of Nicolas Dubrocard, Water Consultant
printed by: Ziegler Digital Portal, Switzerland
available from: Kuoni Group Corporate Responsibility Neue Hard 7 8010 Zurich Switzerland T +41 44 277 52 44 [email protected] www.kuoni.com
photos: © Kuoni
case study photos: Wooden pier on Ko Samui island, p1; longtale boats at the beautiful beach, Thailand, p2 & p3; longtailboat In Phang Nga Area, p6 & p7; Floating market of Damnoen Saduak, Bangkok, p8; Hat yao beach Ko Phangan, Thailand, p17; tropical sunset swimming pool scene with palm tree silhouettes at koh samui, thailand, p90 & p91
For printing this report we used Balance Pure Paperstock. Balance Pure delivers a low carbon footprint and is manufactured from FSC 100% recycled pulp, supporting responsible use of forest resources. Balance Pure, age resistant ISo 9706 certified, is produced in 2 mills in France, which are both ISo 9001, ISo 14001 and FSC certified SGS-CoC-2782/FSC-MIX
Imprint
neutralPrinted Matter
No. 01-14-683490 – www.myclimate.org© myclimate – The Climate Protection Partnership
PERFORMANCE

www.kuoni.com