kuktem interactive map (a comparison between static and
TRANSCRIPT
KUKTEM INTERACTIVE MAP (A COMPARISON BETWEEN STATIC AND INTERACTIVE MAP)
MOHD ROFIZAL BIN MUSTAPA
A report submitted in partial fulfilment of the requirements for the award
of the degree of Bachelor of Computer Science (Software Engineering)
Faculty of Computer Systems & Software Engineering University College of Engineering & Technology Malaysia
NOVEMBER, 2005
ABSTRACT
Nowadays, many map developer are moving toward an electronics era by
converting the static map to the electronic interactive map. It is because an electronics
map offer more beneficial features such as data retrieval, attractive, great for fast
orientation and the important things is the map must be easy to use and helpful. Besides,
by implementing in the web base platform, it also can be use as a marketing tool for
outsider's attraction for a promotion. However, this system had not been implementing
yet in KUKTEM. So, the idea to transform the available static map into an interactive
map had leaded in the process to develop this system. The system should have a usable
interface by implementing location based query. The system will involve data
visualization in order to perform the map in an interactive way. The expected result from
this system is it will help KUKTEM community and outsiders to know more about
KUKTEM which user can see KUKTEM in the interactive map.
iv
ABSTRAK
Dewasa mi, kebanyakan pembangun-pembangun peta telah mula menerajui
bidang penghasilan peta elektronik ataupun e-map. Hal mi kerana peta elektronik
menawarkan banyak ciri-ciri menarik dan bermanfaat seperti kemudahan memanggil
data dari fail data, lebih bersifat menarik, mudah dikendalikan pengguna dan berfungsi
sebagai alat yang mesra pengguna. Selain itu, dengan pengaplikasian sistem berasaskan
web, peta tersebutjuga boleh dijadikan sebagai alat pemasaran bagi sesuatu tempat
terutamanya tempat yang baru dibangunkan. Walaupun begitu, sistem mi belum lagi
dilaksanakan di KUKTEM. OIeh itu, idea untuk menukarkan peta statik KUKTEM
kepada Peta Interaktif KUKTEM telah terhasil. Sistem mi sepatutnya berjaya
menghasilkan peta mudah digunakan di samping bersifat mesra pengguna. Peta
Interaktif mi melibatkan pemaparan data secara grafik dan semua aplikasi adalah
dijalankan melalui grafik tersebut. Keputusan yang diharapkan dengan penghasilan Peta
Interaktif mi adalah untuk kegunaan semua pihak yang terlibat dengan KUKTEM,
mahasiwa dan mahasiswi KUKTEM dan semua pihak yang ingin mengetahui KUKTEM
secara maya.
V
TABLE OF CONTENTS
vi
CHAPTER TITLE PAGE
DECLARATION i
DEDICATION
ACKNOWLEDGEMENT
ABSTRACT iv
ABSTRAK v
TABLE OF CONTENTS vi
LIST OF TABLES x
LIST OF FIGURES xi
LIST OF ABBREVIATION xiii
LIST OF APPENDICES xiv
INTRODUCTION 1
1.1 Overview 1
1.2 Problem Statements 2
1.3 Objectives 3
1.4 Scopes 4
2 LITERATURE REVIEWS 5
2.1 Introduction 5
2.1 .1 History of Graphic Presentation 6
2.2 What is Static map 7
viii
3.2.4.4 XML 30
3.2.5 Project Implementation 30
3.2.5.1 Data Binding and Action Script in
Flash Interface 33
- 3.2.5.2 Creating table in MySQL 37
3.2.5.3 PHP Coding 38
3.2.5.4 XML Code 39
3.2.6 Project Maintenance 40
3.3 Software Tools 41
3.3.1 Macromedia Flash MX 2004 41
3.3.2 PHP Scripting Language 42
3.3.3 Microsoft SQL Server 42
3.4 PC Requirement 43
3.5 Discussion 43
4 PROJECT DISCUSSION 44
4.1 Introduction 44
4.2 Testing Environment 44
4.3 Output for KUKTEM Interactive Map System 45
4.3.1 Interface of the system 45
4.4 Project Objectives Achievement 48
4.5 Advantages of KUKTEM Interactive Map 52
4.6 Disadvantage of the system 52
4.7 Assumption and Further Research 53

lx
5 CONCLUSION
54
REFERENCES
APPENDIX A - Gantt Chart
APPENDIX B - Questionnaire
APPENDIX C -User Manual
APPENDIX D - Reference Document
56
57
58
59
60

LIST OF TABLES
TABLE NO. TITLE PAGE
3.1 Comparisons between Interactive and Static Map. 26
LIST OF FIGURES
FIGURE NO. TITLE PAGE
1.1 Normal eye-scanning processes 3
2.1 Egyptians cave painting (hieroglyphics) 7
2.2 KUKTEM Static Maps 10
2.3 Kuantan Parade Static Maps 11
2.4 Housing Area Map 12
2.5 UVM Interactive Map 13
2.6 Kuala Lumpur Interactive Map 15
2.7 Perak Interactive Map 16
2.8 Comparison between Bitmap Image and Vector Image 20
3.1 Prototyping model (SDLC model) 24
3.2 Database design for KUKTEM Interactive Map 28
3.3 Flow of system implementation 31
3.4 Flow of retrieval data process 32
3.5 Binding process in Flash 33
3.6 Set the schema for XML files 34
3.7 Action Frame in Flash 34
3.8 Action Script to triggers xml files (XML Connector Component) 35
3.9 Action Script to sets values for the following components 36
3.10 SQL statements to create 'Cafeteria' database 37
3.11 SQL statements to create table 'category' 37
3.12 SQL statements to create table 'directory' 37
3.13 PHP Configuration code to connect database 38
3.14 PHP code to output the XML files (category.xml) 38
xi
LIST OF FIGURES
FIGURE NO. TITLE PAGE
3.15 PHP code to output the XML files (business.xml) 39
3.16 Set the schema for 'Category' section 39
3.17 Set the schema for 'Business Details' section 40
4.1 KUKTEM Interactive Map main interfaces 45
4.2 Sub interfaces for Building Info 46
4.3 Sub interfaces Cafeteria Info 47
4.4 Retrieval data for Cafeteria 47
4.5 Map preference between static and interactive map 50
4.6 Interactive Map effectiveness 50
4.7 Usability test on using object-based information 51
4.8 Usability test on Multimedia Element 51
xli
LIST OF ABBREVIATIONS
KUKTEM Kolej Universiti Kejuruteraan & Teknologi
Malaysia
KIM KUKTEM Interactive Map
PHP PHP scripting language
UIVM University of Vermont's Campus
MySQL Microsoft SQL Server Database
KL Kuala Lumpur
SDLC System Development Life Cycle
IT Information Technology
OS Operating System
XML Extensible Markup Language
RIA Rich Internet Application
xl"
LIST OF APPENDICES
APPENDIX TITLE PAGE
A Gantt chart 57
B Questionnaire 58
C User Manual 59
D Reference Document 60
xlv
CHAPTER 1
INTRODUCTION
1.1 Overview
The usages of web base map system are very common now. The usage of
interactive maps is and effective enhancement for the traditional static map. It is because
the information organized by system which can interact with the user will help more in
giving information. The information organized by system provides automatic, updated,
fast and cost effective data organization. Data visualization is a process of putting data
into visible form by creation of graphical images. The main advantage of visual
presentation is its convenience for human perception (J.B Watson, 1922, pg 155-158).
Furthermore, multimedia element will help to turn the static map into an
interactive, easy to use and give useful navigator to use the map. Interactive map is an
overcoming method to replace the traditional map that only had a static mode. By using
interactive map, people can navigate trough the system and it will guide user through the
system. Besides, by using this interactive map, user can navigate through this system
and it can reduce time respond in searching for a specific place. It is believed that
human ability to gather information will increase when the information are given in an
interactive way (Tapscott, 1998, pg 255-267). The Interactive Map System has created a
new way to take advantage of the system to display graphic images, including maps and
information about the image.
Z
The interactive nature of the Interactive Map System allows people to create
pages that put control over the creation and display of maps and other images into the
bands of computer users. We believe that, as new high performance computers become
available, the role of interactive maps should be widened. Currently, a map is used more
and more as a tool for analysis of data rather than for illustrative or demonstration
purposes. Such exploratory analysis requires adequately designed, highly interactive
and transformable map displays (McLellan, 1996).
1.2 Problem Statement
Currently, there is no Interactive map yet had been implemented in KUKTEM
Gainbang. Therefore, we decided to create an electronic map with multimedia element
to enhance the old static map that just only provides several data in a static mode.
Besides, by using this interactive approach, user can navigate through the system and it
is believe can reduce time respond in searching for specific places. Actually the current
map in KUKTEM now just had been put statically on the map board. The map is static
and only shows several general information's about all places in the campus. We
believe by implementing the graphical data visualization element in this system, it will
help to perform the map in the interactive way. This approach will provide and easy
way because it is highly believed that can be easy understand compare to text data
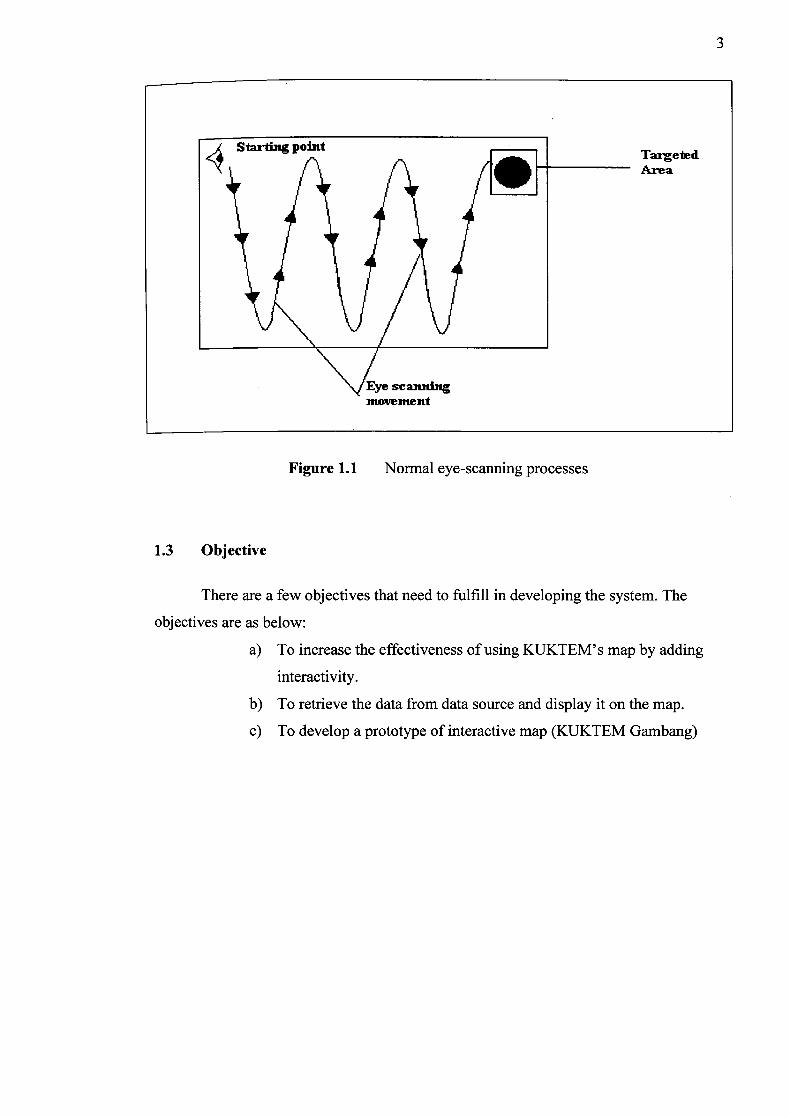
presentation (Tapscott, 1998, pg 255-267). Furthermore, by using the traditional static
map, the eye capturing process need to cover all point of the map until the targeted data
is captured. For an example, if the targeted area is situated at the up right side of the
presentation, and the eye scanning start at the up left of the presentation, the eye
scanning process to capture the targeted data need to cover almost all of the area until
the targeted area is reached (refer Figure 1.1). This method will cause longer time taken
or need to discover the area.
3
Starting point Targeted
•b Area
\\\\/E scanning inoventent
Figure 1.1 Normal eye-scanning processes
1.3 Objective
There are a few objectives that need to fulfill in developing the system. The
objectives are as below:
a) To increase the effectiveness of using KUKTEM's map by adding
interactivity.
b) To retrieve the data from data source and display it on the map.
-
4
c) To develop a prototype of interactive map (KUKTEM Gambang)
4
1.4 Scope
The scope of my thesis is to develop the interactive maps which only consist of
KUKTEM Gambang map only. To perform the data retrieval function and the map
visualization, the focUs is only on certain building due to time constrain. Those scopes
are:
a) Increase 10% time response by adding a usability and attractivity on
the map.
b) Object defined to retrieve data from data source in this project are
cafeteria and C8 Student Hostel. Only consist of retrieve data, no
update, insert data involved. The specific data retrieved are from
XML files and MySQL database.
c) The prototype follows the current static map criteria with additional
function.
i. Filter (Public Phone, Parking Area, Internet Access Point,
Mosque, Astaka, Dining Area, Guard Post, Academic
Building, Bus Stop and ATM.)
ii. Building Labeling (All building)
iii. Road Guide (from second entrance to Mosque, Astaka,
Cafeteria and Academic Building only)
CHAPTER 2
LITERATURE REVIEW
2.1 Introduction
This chapter takes a brief look at the sample of Static Map and Interactive
Map which had already existed nowadays. This chapter also will discuss the
comparison of static and interactive map and how graphical presentation affect the
information capture process..
Humans are able to navigate through geographic space to their spatial-
cognitive abilities, which have similar value in the exploration and understanding of
non-geographic complex information. Maps are powerful graphic tools that classify,
represent and communicate spatial or specialized relations. Maps are also a method
to visualize and navigate a world that is too large and complex to be seen directly
(Monmonier, 1996, pg 167-272). A map shows us more in less space, enabling us
to plan our route in advance.
In order to understand the large geographical space into a smaller viewing
mode, we need a map or set of maps for this purpose. When a specialized web
information space is rendered in the form of an interactive map, the spatial
representation (map) becomes the territory and also the means in which to navigate
this territory. Links on such map are not just a representation of corresponding web
resources, but can also directly launch (take users to) these resources. This is not
true for conventional real world maps, which were never meant to be the territory;
they just allow users to visualize land and routes, then users will need to drive along
to physically reach their destination.
An Image map is an image that contains multiple links within its borders.
Basically it looks just like any other image you can see on the web. However, an
image map contains several areas that once clicked on take the user to different
locations (links). It can be said that an image map is navigation through picture.
2.1.1 History of Graphic Presentation
Long time ago, there wasn't any specific method to deliver message. People
use many methods to deliver the message and they try to make it as easy as possible
for others to understand what messages try to be sent. As there were no such thing
like alphabet or character have been invented yet, they try to send the message by
using graphical presentation.
This method lead to the use of sketch and image drawing to represent what
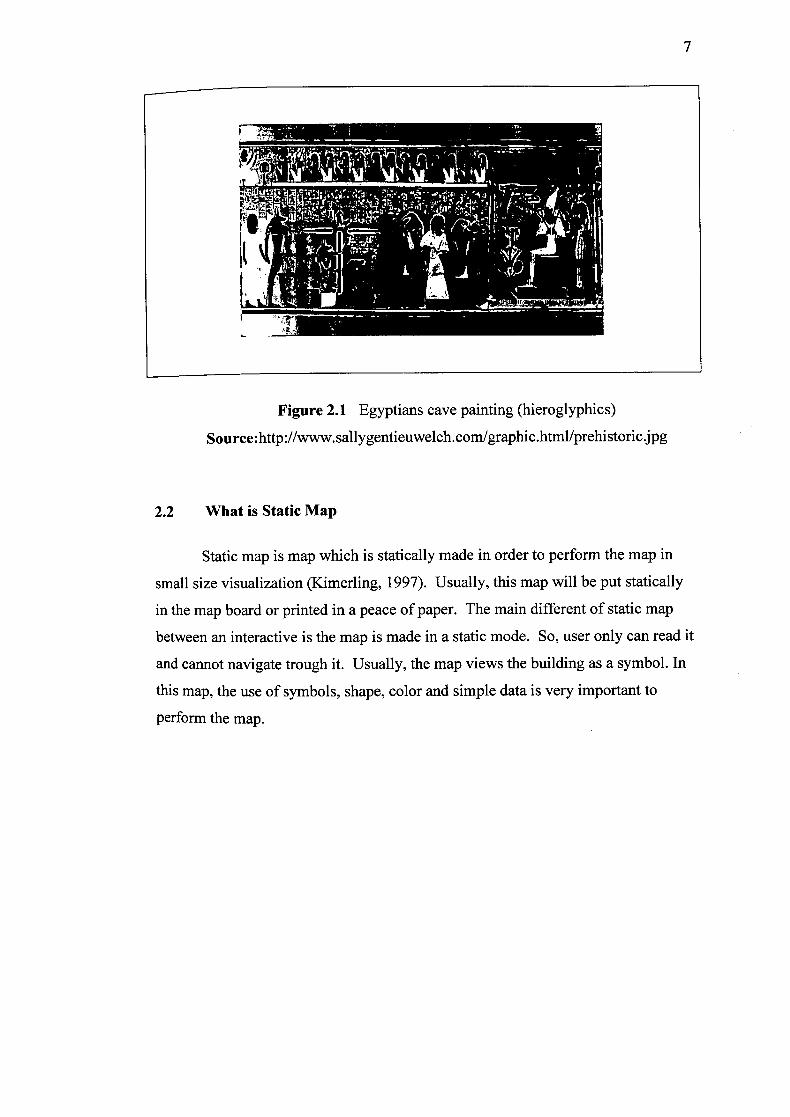
the message try to be sent. For an example, in 35000 B.C. the Egyptians created a
picture language called hieroglyphics. This is the first graphic presentation being
found. The presentation is a cave painting to describe what they have observed in
their daily activities such as painting of animal and human. Cave drawings were
murals that people painted onto the walls of caves and canyons to tell the story of
their culture (refer Figure 2.1). They would tell stories of battles, hunts and culture.
Only in 3000 B.C. the Sumerian invented the first writing system (Phillip B. Meggs,
1998).
The method of deliver message or information by using graphic become
very familiar and it is still being used until today.
VA
Figure 2.1 Egyptians cave painting (hieroglyphics)
Source:http://www.sallygentieuwelch.comlgraphic.html/prehiStOric.ipg
2.2 What is Static Map
Static map is map which is statically made in order to perform the map in
small size visualization (Kimerling, 1997). Usually, this map will be put statically
in the map board or printed in a peace of paper. The main different of static map
between an interactive is the map is made in a static mode. So, user only can read it
and cannot navigate trough it. Usually, the map views the building as a symbol. In
this map, the use of symbols, shape, color and simple data is very important to
perform the map.
8
2.2.1 What are the Static Map's features and benefits
Static map usually had been situated at the main entrance of the certain
place. The main features of this map are to show the location inside the places.
Usually, this map show the direction and the simple symbols were used to represent
the thing shown in the map. The features of the static map are:
a) Usually are place in the map board.
b) Use symbols and simple shape to visualize the map.
C) Below the map, usually the map developer will give
information about what are the symbols represent for.
d) Labels are used to represent the visualization.
e) Basic shape, color, and simple symbols always been use to
represent the map.
2.3 What is Interactive Map
Interactive mapping is defined as any map in which the user can manipulate
the display of the map, from simply zooming and panning on the map to querying,
retrieve and analyzing the data displayed. The simplest interactive map system is
image maps which are publish on the web (Thoen, 1995 pg 255-267).
The user should be able not only to display data in order to get an overview
but also to use map visualizations to browse and manipulate data. Besides, a user
should be able to select an object like an exhibitor on the fair from a list, to get a
map on which the location of this object is highlighted, and to assign new attributes
to this objects like being element of the user's tour or a point of interest. This
requires the generation of the map view from a geographical database and the
possibility to access this database by actions on the map view. The interaction
design must provide intuitive means to perform the relevant actions on objects and
to switch between list and map views. In interactive map, this was realized by a
context menu which offered actions on particular objects, like taking an exhibitor to
a tour or displaying more detailed information.
2.3.1 Interactive Map's Features and Benefits
a) Great for Fast Orientation: Interactive map will give user great
and fast orientation because user can navigate by just clicking on the
image available.
b) Great way to Link to Attractions: Allow users to click to attraction
descriptions in two ways: they can click on the map itself or on the
name of the site in the list. It's more convenient that way.
c) More than a Picture: Many maps on the web are simply a scanned
image, with hard to read lettering. Interactive map are designed for
optimum computer viewing.
d) Multifunctional: Peoples may have seen maps on the Web where
portions are hotspots linked to other pages. This is done by using the
Flash action script function which usually involves the tedious
manual job of defining the significant points which outline the
overlaying graphic.
e) Attractive: Interactive map can be seen as more than a picture, user
can navigate through the system by viewing the interactive picture
and by using an interactive button. The whole map are using
multimedia element that will make it more fun and easy to use.
f) Show Road Guide: User can use this interactive map as a location
guide by choosing the where they want to go. The map then will
generate the route that will show them how to go to that specific
place. This will help user easily reach their destination. This
feasibility will help user to save time by asking other people which is
the right way to reach their target place.
10
2.4 Available System
2.4.1 Available Static Map
2.4.1.1 KUKTEM (Gambang)
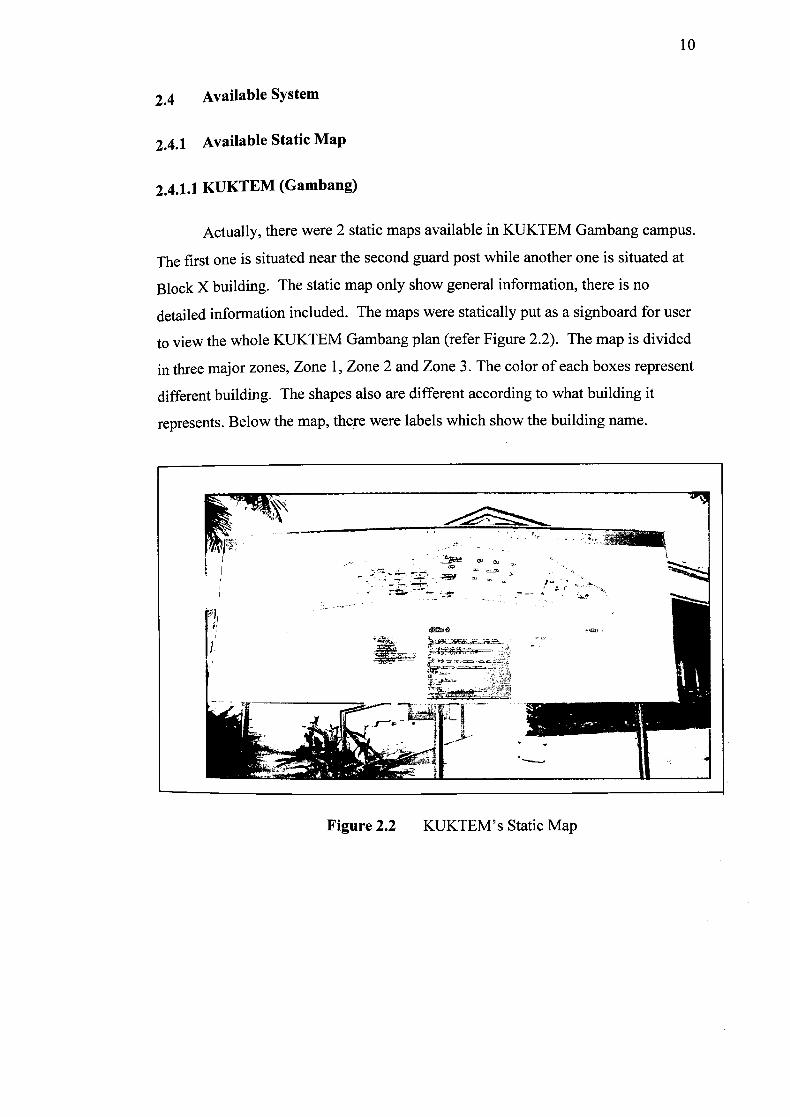
Actually, there were 2 static maps available in KUKTEM Gambang campus.
The first one is situated near the second guard post while another one is situated at
Block X building. The static map only show general information, there is no
detailed information included. The maps were statically put as a signboard for user
to view the whole KUKTEM Gambang plan (refer Figure 2.2). The map is divided
in three major zones, Zone 1, Zone 2 and Zone 3. The color of each boxes represent
different building. The shapes also are different according to what building it
represents. Below the map, there were labels which show the building name.
Figure 2.2 KUKTEM's Static Map
SHOP 11 S]Il)P LOT LOT
I
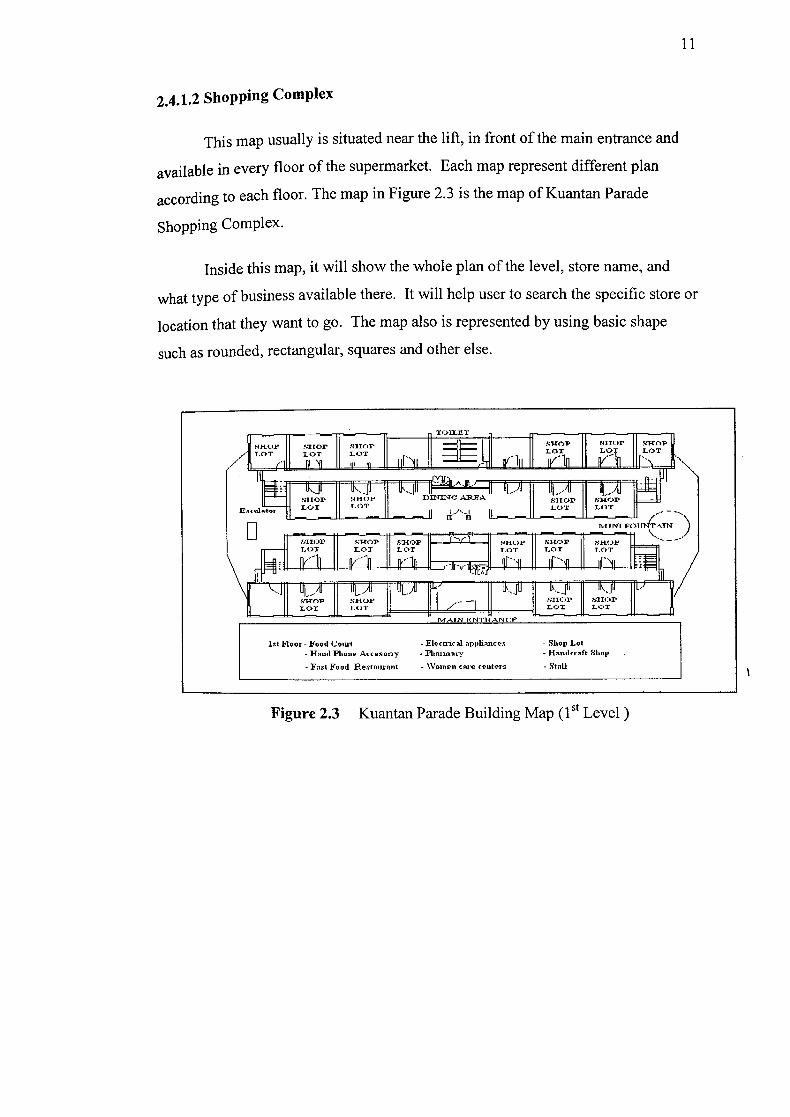
2.4.1.2 shopping Complex
This map usually is situated near the lift, in front of the main entrance and
available in every floor of the supermarket. Each map represent different plan
according to each floor. The map in Figure 2.3 is the map of Kuantan Parade
Shopping Complex.
Inside this map, it will show the whole plan of the level, store name, and
what type of business available there. It will help user to search the specific store or
location that they want to go. The map also is represented by using basic shape
such as rounded, rectangular, squares and other else.
TOfl!TW()P ]lop 11 snrop
LOT LOT 11 Li)T ROk .TlOp JtOP
ill A
Eli -i--H LOT
=T-
IILOT1
T'.tlNl O1TN1\TN
Lctoor - Food Cowl - toclrica1 appliances - Shop Lot - Hand Phone Accesonv - Fhannocy - HainInaft Shop
- Fast Food Resrainant - Women cole ceiiters - Stall
Figure 2.3 Kuantan Parade Building Map (15t Level)
IL
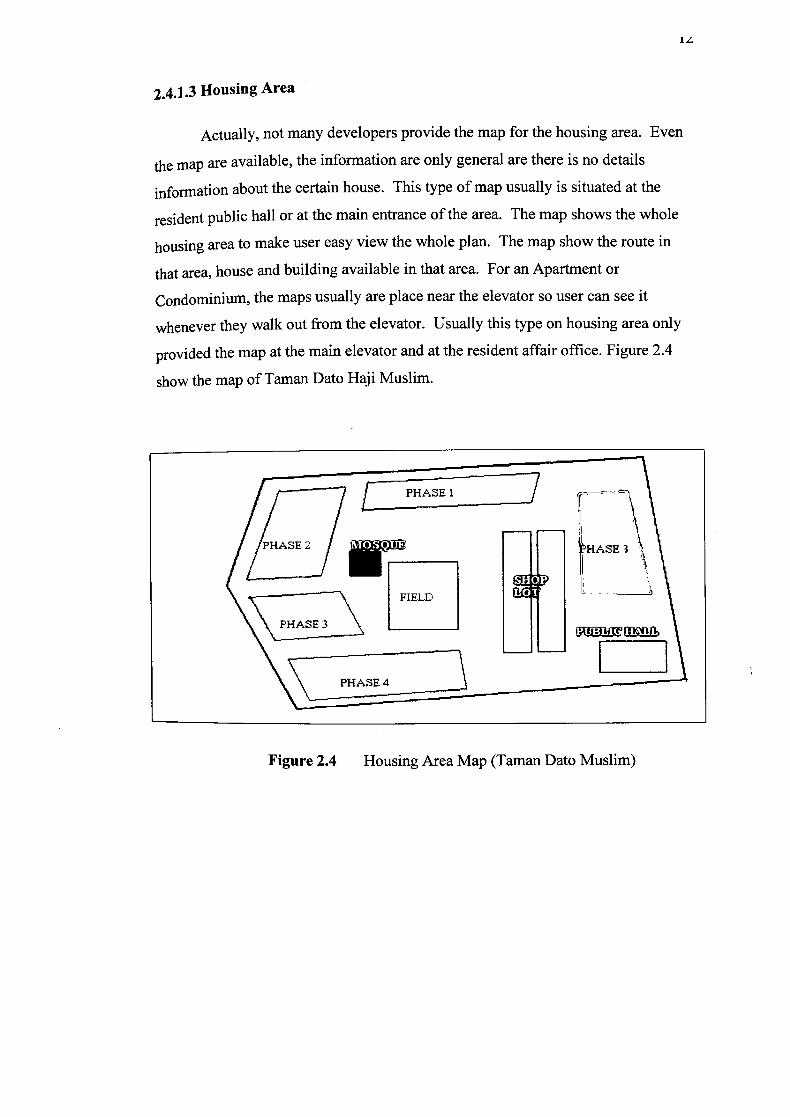
2.4.1.3 Housing Area
Actually, not many developers provide the map for the housing area. Even
the map are available, the information are only general are there is no details
information about the certain house. This type of map usually is situated at the
resident public hall or at the main entrance of the area. The map shows the whole
housing area to make user easy view the whole plan. The map show the route in
that area, house and building available in that area. For an Apartment or
Condominium, the maps usually are place near the elevator so user can see it
whenever they walk out from the elevator. Usually this type on housing area only
provided the map at the main elevator and at the resident affair office. Figure 2.4
show the map of Taman Dato Haji Muslim.
r0/7=P IIII7 HASE 3
FIELD I if I
\
Figure 2.4 Housing Area Map (Taman Dato Muslim)
Ii
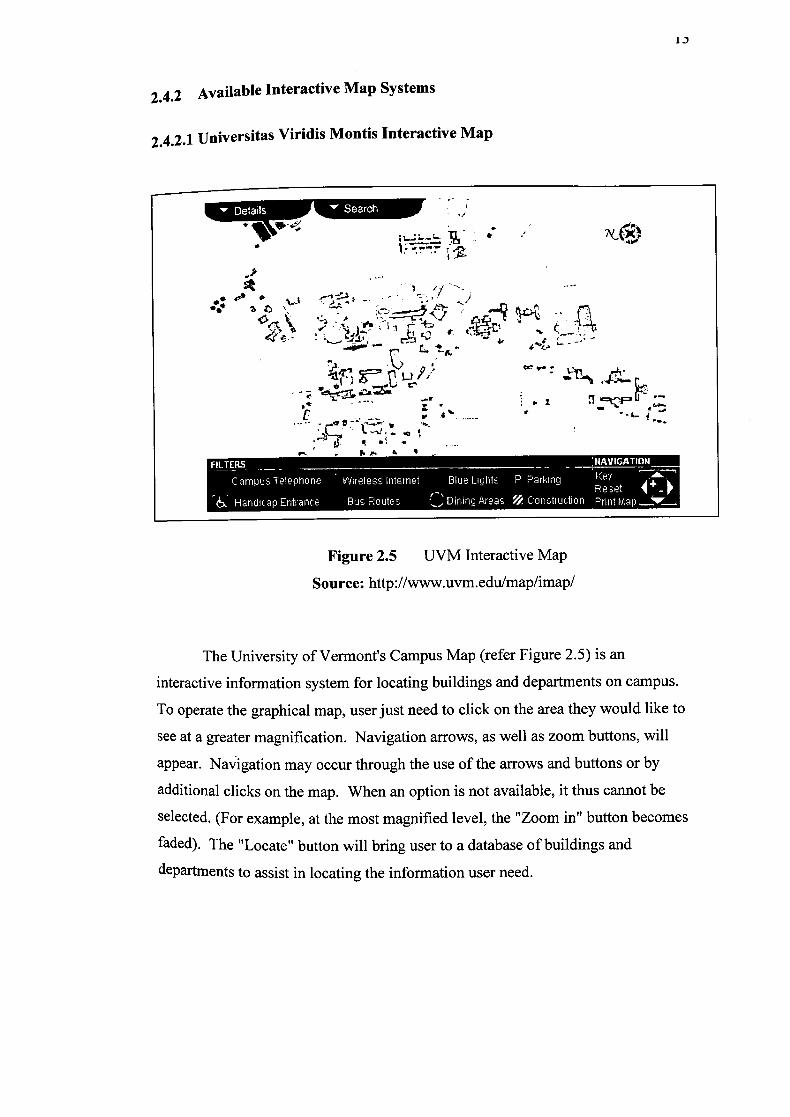
2.4.2 Available Interactive Map Systems
2.4.2.1 Universitas Viridis Montis Interactive Map
Search Details
'-- c-
Sc\i:1rt:.
-I I t=t?J=' :z v -
Figure 2.5 UVM Interactive Map
Source: http://www.uvm.edu/map/imap/
The University of Vermont's Campus Map (refer Figure 2.5) is an
interactive information system for locating buildings and departments on campus.
To operate the graphical map, user just need to click on the area they would like to
see at a greater magnification. Navigation arrows, as well as zoom buttons, will
appear. Navigation may occur through the use of the arrows and buttons or by
additional clicks on the map. When an option is not available, it thus cannot be
selected. (For example, at the most magnified level, the "Zoom in" button becomes
faded). The "Locate" button will bring user to a database of buildings and
departments to assist in locating the information user need.