kriging and mapping of copper, lead, and mercury contents in surface soil in shenzhen area
TRANSCRIPT

KRIGING AND MAPPING OF COPPER, LEAD, AND MERCURY
CONTENTS IN SURFACE SOIL IN SHENZHEN AREA *
SHU TAO Dept. of Geography, Peking University, Beijing 100871, China
(Received 3 November, 1993; accepted in final form 22 April, 1994)
Abstract. Two-dimensional ordinary block kriging as an optimal interpolation technique was applied to produce regular grids of predicted estimates of copper, lead, and mercury contents in surface soil in the Shenzhen area for mapping purposes. The kriging analysis was based on theoretical variograms calculated from measured data of eighty three top soil samples. The appropriateness of the whole procedure of kriging analysis was evaluated by both cross-validation and kriging standard deviation mapping. The similarity in area variation between the distribution of soil parent material and the mapped results of copper and lead is demonstrated. The possible influence of agricultural contamination on the spatial distribution pattern of mercurcy is also discussed.
Introduction
One of the important elements of the geochemical data is their location. To re- cognize the pattern in the spatial distribution of a trace element content in soil, it is often necessary to present the data by mapping technique as aids to comparison of the element content with geological and geographical infoixnation in map form and to interpretation of the origin and the fate of the trace element in the soil. Since raw data of soil surveys are usually results of chemical analysis of soil samples from discrete and irregular locations of relatively low density, spatial interpolation of various kinds is a common practice to create maps emphasizing the regional geochemical distribution of the element.
Of many procedures developed for this purpose, one alternative known as kriging after D. G. Krige is firmly grouped in the theory of regionalized variables [1,2] and is applied not only on the estimation of ore reserves in mining but also on mapping of many properties on the earth's surface, which vary continuously but irregularly [3,4]. The procedure provides statistically optimal and unbiased prediction as well as certain estimates on the error of the interpolation.
The aim of current study is to apply the kriging technique on interpolation and mapping of copper, lead, and mercury contents in surface soil in Shenzhen, based on measured results of these elements in soil samples collected from eighty three locations of the area and the spatial Structure models derived from variogram analysis.
* Under auspices of Fund for Excellent Young University Teachers of the State Education Com- mission of China
Water, Air and Soil Pollution 83: 161-172, 1995. @ 1995 Kluwer Academic Publishers. Printed in the Netherlands.

162 SHU TAO
Data Preparation
Surface soil samples were collected from eighty three locations in Shenzhen area. Copper, lead, and mercury contents of the samples were determined. The sampling locations are shown in Figure 1 and the detailed procedures for samples analysis were given elsewhere [5].
The objective of this study is to map the distribution pattern in element contents in soil at sampled scale, the outliers in raw data set may lead to skewed interpolation in local area surrounding the locations where outliers are found. For this reason, the outliers in measured data were eliminated statistically prior to kriging analysis. The outliers were determined from the results of a principle component analysis of the contents of twelve elements including copper, lead, and mercury [6]. The factor scores of the multivariate analysis were tested using Grubb's procedure at a significant level of 0.05 for each stratigraphic unit respectively and four outliers were identified. In addition to the statistical outliers, data of four other samples were not included in the kriging simply because they are too close to other sampling locations comparing to average distance between sampling sites. Data from seventy five samples were then used for interpolation, the eight samples not used are indicated by solid dots in Figure 1.
Interpolation Methods
A number of approaches have been applied to predict trace element contents at unrecorded sites for mapping purpose. Among them, spatial classification as the basis for estimation has a long history in the earth sciences. Since this procedure takes no account of the spatial arrangement of the data points and their relation to predicted points and fails to describe the gradual variation in values across boundaries between units [7], it is not recommended except when the measured data are sparse and there is enough information on making such classification.
Based on the obvious shortcomings of the classification approach, means of prediction and mapping that uses the spatial information is to be preferred. The methods often used are essentially interpolation procedures such as trend surface analysis and arbitrarily weighted averages of local data [8]. In most cases, a com- plete description by a simple mathematical surface is actually not feasible. In practice, the residuals of such a surface fitted by polynomial function of relatively low order are usually too high to be accepted. Attempts to reduce that residuals and to improve the fitting accuracy by increasing the order of the function, on the other hand, will almost certainly cause serious distortion, remarkable border effect, and erratic interpolation surfaces, all of which leads to serious deviation [7]. Trend surface analysis, therefore, is appropriate in limited circumstances, such as on alluvial plane where the element contents are relatively homogeneous.
Compared to the trend surface analysis, most other interpolation methods are local in the sense of the data points used for prediction. The classical ones proposed

KRIGING AND MAPPING OF COPPER, LEAD, AND MERCURY 163
11r 00' 114' 30'
o'X o " o o 22
40' X~ o n o
% oO ~176 o ,
tH"
Guangdong
o ~ ~ ~ ~ o o r-v> /
0 1~km 00' 114" 30 '
Fig. 1. Sampling locations.
for soil properties mapping are linear interpolation methods such as polygons of influence, inverse distance, and inverse-square distance. These methods may seem reasonable for many applications, but they are empirical without a theoretical model when the selection of a specific procedure is considered. They are more or less biased, their errors are unknown and some are frankly cosmetic. Above all, like trend surface analysis, they are mathematical but not statistical [9].
An alternative to conventional interpolation to predict values at unvisited sites and to form continuous statistical surface over the map plane is a procedure known as kriging. The method was first developed for the estimation of ore reserves in mining and has been used increasingly in many areas since [1, 2, 3, 4]. It is theoretically optimal in the sense that it provides estimates without bias and with minimal and known variance.
For the reason mentioned above, the kriging analysis, or geostatistical analysis in general, was selected in this study. All computation were performed using GEO- EAS from USEPA [10].
Interpolation Model
The importance of the variogram analysis in practical geostatistics is two fold. It reveals the configuration of the geographic variation in the property under inves- tigation and provides an essential interpolation model for kriging. The results of variogram analysis based on the measured data of copper, lead, and mercury con- tents in surface soil from Shenzhen has been presented elsewhere [5]. Bounded

164 suu TAO
TABLE I Parameters of theoretical variograms
Sill Major range Major range Minor range (rag kg-l) direction (km) (km)
Cu 48 SE-NW 12.3 9.9 Pb 390 E-W 12.0 7.5 Hg 0.0035 isotropic 6.0 6.0
spherical models which are anisotropic for copper and lead, and isotropic for mer- cury, all without nugget, were found to fit well to the experimental variograms [5]. The parameters of the suitable models are listed in Table I.
The geometric nested models for copper and lead and the isotropic model for mercury were then used for kriging interpolation.
Kriging
The whole area of Shenzhen was divided into 200 (east-west) x 107 (north- south) square blocks (450 x 450 m). Two-dimensional ordinary block kriging was applied to estimate values of element contents for each block. Only eight data inside a neighborhood centered on the block are considered for calculation and the estimation neighborhoods were anisotropic for copper and lead, and isotropic for mercury according to the two-dimensional models adopted. The mean values of estimates for 2 • 2 discrete data points within a block was computed instead of using multiple integration.
The statistical surfaces so constructed were mapped in a cell form, using kriging blocks as ceils, to avoid the computational overheads of contour-threading, while still presenting the spatial pattern of variations efficiently [11]. Eight distinct grades with different shadings were selected and the class-intervals were decided by a roughly arithmetic progression of area occupied by each class so as to emphasize the fight-skewed frequency distribution pattern of the element contents in surface soil of the area [6]. Three kriged maps of copper, lead, and mercury contents are illustrated in Figures 2, 3, and 4, respectively.
Evfluafion
Since block kriging, rather than punctual kriging, was applied, the interpolated errors at blocks where samples had been taken were able to be evaluated by cross- validation. The results are shown in Figures 5, 6, and 7 for copper, lead, and

i!!~i~!~
ii!i!~!~iii
ii!iiii!
!~!~i{
i::~~~
-ii!~::
;J:i.
i. i. i:i.
:. :. !. i
-i, i, i, i
. i:~i'i ~:
!iiii!i!!!
:i~::-!:
.~!ii!!ii
::iiiiii!i
i i
'iii!i!
iiiiiiy
r i LE
GEN
D
(mg/
kg)
17
--3
0
30
--5
0
50
--7
5
75
--1
00
10
0 --
t3
0
13
0 --
16
0
16
0 --
22
0
22
0 --
43
6
7~
>
�9
~3
�9
t"
> w
>
:Z
Fig
. 2
Map
of
copp
er c
onte
nt in
soi
l.

i:i::
�9 .-
..~
.
.','
.'.:
:
"'"":i
:!:i:i
:i:!:i
:!:
..
..
..
j
LEG
EN
D
(mgl
kg)
5 0
--
17
,0
17
o-~
3.o
23
0--
33
.5
33 5--50,0
50
0--
60
.0
60
0--
70
.0
70 0--85.0
85
0 --
19
0.6
�9
Fig
. 3
Map
of
lead
con
tent
in
soil
.
[---]
LEG
END
(mg
/kg
)
020
--
04
5
--
060
--
080
--
100
--
130
--
180
--
26
0
--
045
060
080
100
130
180
260
620
z > z �9
c3
�9
3-
Z
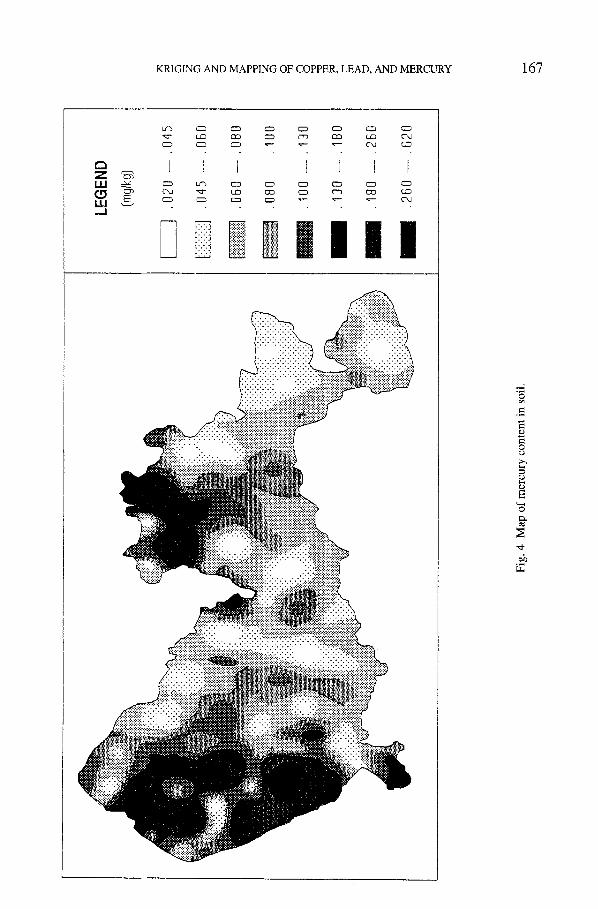
Fig
. 4
Map
of
mer
cury
co
nte
nt
in s
oil.

168 s n u XAO
§ �9
Fig. 5. Cross-validation for kriging analysis of copper content.
Fig. 6. Cross-validation for kriging analysis of lead content.
mercury, respectively. The differences between measured and calculated values for all eighty three sampled locations, including those not used during the variogram analysis as outliers, are illustrated. The positive deviation of the predicted values from those actually measured are presented by '+' and the negative ones by ' x ' . The size of the crosses indicates the magnitude of the deviation.
Comparing with element content maps shown in Figures 3 to 5, it is clear that the estimated values with large error detected by cross-validation were found at locations where the element contents in soil vary dramatically. A typical example is copper content along west coast. The soil in this narrow plain is derived from marine sediment rich in copper, while the soil developed in granite distributed

KRIGING AND MAPPING OF COPPER, LEAD, AND MERCURY 169
Fig. 7. Cross-validation for kriging analysis of mercury content.
mountain area east to it has very low content of the element. The content of copper in soil decreases sharply from west to east across the boundary between the coast plain and felsic rock mountain area in short distance. For lead, the largest error appears near the Wuton Mountain in middle of the region, where very high content of lead was measured locally with extremely low values detected nearby. The large error found in these locations are in fact the results of over smoothing of the procedure. The models used for kriging were constructed based on the data structure over the whole area and the variation in element contents is more gentle on average. In spite of the large error at individual locations, the results of the cross- validation are acceptable. 86% of data points fall in the same grades as measured ones in the 8-grade system used for mapping. Considering there are 8 data points (9.6%) not used during the variogram analysis as outliers, the results are considered satisfactory.
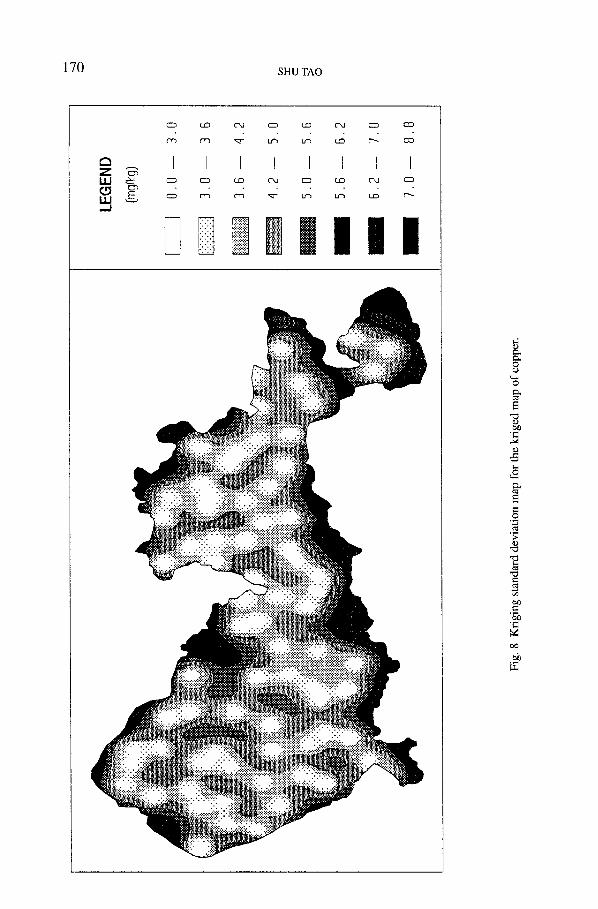
By cross-validation, the accuracy of the interpolation can be evaluated only for those values at sampled locations. For all interpolated results, the calculation of corresponding kriging standard deviation (KSD) provides a superior measure of probable, but not exact, error term compared with the more usual variance of residues from a fitted surface. For all three elements studied, the grids of kriging standard deviation values of all blocks were produced during the kriging and mapped as well. Because the patterns of these KSD maps are similar to one another, only the KSD map of copper is given in Figure 8 as an example.
The locations of the sample points can easily be seen in Figure 8 by the centers of low KSD value. It is clear that the further a target point from the data point, the larger of the kriging standard deviation, suggesting that the significance of the spatial autocorrelation is negatively proportional to the distance, which can also be seen from the spherical models of variograms [6]. The high values of the kriging
'-,,,4
LEG
END
{mg/
l~g)
00
--3
0
30
--
36
36
--4
2
42--50
50--56
56
--6
2
62--70
70
--8
8
f,o �9
Fig
. 8
Kri
ging
sta
ndar
d de
viat
ion
map
for
the
kri
ged
map
of
copp
er.
KRIGING AND MAPPING OF COPPER, LEAD, AND MERCURY 17 1
standard deviation near margins of the map indicate the influence of so called 'border effect', which is simply due to the interpolation computation of blocks near the margins which were not based on data points all around them [12].
Discussion
According to the results of a geochemical survey on the trace elements in surface soil of the area using classical and multivariate analysis, the metal contents are controlled by the distribution of parent material [6]. The marine sand, granite and volcanic rocks in the area have generally low contents of copper, as do the soils derived from them. On the other hand, soils and their parent materials derived from marine clay and felsic rocks are rich in lead. Unlike most other trace elements, the geochemical distribution of mercury is unique and its abundance in paddy soil is well above the natural background level of the region [13].
By comparing the kriged maps shown in Figures 2, 3, and 4 with geological and geographical maps of the area [14], it is clear that the highest copper content can be found along west coast occupied by clay soil of marine origin, north to which, light soil deficient in copper is derived from marine sand. For the entire Shenzhen, the local areas with low abundance of copper are the places where either granite or felsic volcanic rocks can be found. Soils with high content of lead are located in an elongated area from east to west along the Yangtai, the Wuton, and the East Coastal Mountains dominated by felsic rocks. Northern Shenzhen area, on the other hand, is mainly occupied by sand stone and shells from which the soil with relatively low lead content was derived. The distribution pattern of mercury content is unique and has weak relation with soil parent material. Soils rich in mercury appear in two areas, the western coastal plain and the northeast plain, where most paddy fields of Shenzhen are located. The agricultural contamination by mercury-containing pesticides is believed to be the main reason altering the original distribution pattern of mercury in Shenzhen soil, which should be similar to other chalcophile elements such as lead according to Goldschmidt [15]. The phenomena has also been demonstrated by the isotropic nature of its variogram [5].
References
1. Krige, D. G.: 1966, J. South African Inst. Mining and Metallurgy 66, 13-38. 2. Matheron, G.: 1963, Economic Geology 58, 1246-1266. 3. Webster, R. and Burgess, T. M.: 1980, J. Soil Science 31, 505-524. 4. Webster, R. and McBratney A. B.: 1989, J. Sci. Food Agriculture 40, 493-496. 5. Tao, S.: 1995, Water, Air and Soil Pollut., 82, 583-591. 6. Tao, S.: 1995, Trace Element Contents in Soils from Shenzhen Area, Chines EPA Report,
75-60-01-01-33. 7. Burgess, T. T. and Webster, R.: 1980, J. Soil Science 31, 315-331. 8. Howarth, R. J. and Martin, L.: 1979, in 'Geophysics and Geochemistry in the Search for Metallic
Ores', Canadian Department of Mines and Tech. Survey, pp. 545-574.

172 SHUTAO
9. Webster, R. and Oliver, M. A.: 1990, Statistical Methods in Soils and Land Resource Survey, Oxford University Press.
10. Englund, E.: 1980, GEO-EAS, USEPA 600/4-88/033. 11. Howarth, R. J.: 1971, Mathematical Geology 3, 95-121. 12. David, M. and Dagbert, M.: 1979, in I. L. Elliott (ed.), Geochem. Explor., Elsevier Publ.,
Amsterdam, pp. 163-181. 13. Tao, S. and Chen, W. Y.: 1993, Chinese Environmental Science 13, 35-.40. 14. Guanzhou Institute of Geography: 1985, Atlas of Natural Resources and Economical Develop-
ment of Shenzhen, Scientific Press of China. 15. Goldschmidt, V. M.: 1954, Geochemistry, Oxford University Press.