kpi 2: number of people and social institutions with …...for the purpose of kpi 2, social...
TRANSCRIPT
Climate Change Compass helps the UK Government
monitor, evaluate and learn from UK International Climate Finance
Join the conversation at climatechangecompass.org 1
Number of people and social institutions
with improved access to clean energy
as a result of ICF
KPI 2 Methodology Note
November 2018
Climate Change Compass helps the UK Government
monitor, evaluate and learn from UK International Climate Finance
Join the conversation at climatechangecompass.org 2
Acronyms ........................................................................................................................................ 3
Rationale ......................................................................................................................................... 4
Summary table ............................................................................................................................... 4
Technical Definition ....................................................................................................................... 5
Methodological Summary .............................................................................................................. 5
Methodology ................................................................................................................................... 6
Worked Example ........................................................................................................................... 9
Data Management ........................................................................................................................ 10
Data Disaggregation ..................................................................................................................... 11
Annex 1: Further worked example ............................................................................................. 13
Annex 2: Comparability and synergies with other external indicators ................................... 13
Annex 3: Definitions of key methodological terms used across Methodology Notes ............ 14
Annex 4: Low Carbon Conversion Table from Gold Standard Foundation ........................... 15
*Click on page numbers above to navigate to specific sections
About Climate Change Compass
The UK government has committed to provide at least £5.8 billion of International Climate Finance between 2016 and
2020 to help developing countries respond to the challenges and opportunities of climate change.
Visit www.gov.uk/guidance/international-climate-finance to learn more about UK International Climate Finance, its
results and read case studies. Visit www.climatechangecompass.org to learn more about how Climate Change
Compass is supporting the UK Government to monitor, evaluate, and learn from the UK International Climate Finance
portfolio.

Climate Change Compass helps the UK Government
monitor, evaluate and learn from UK International Climate Finance
Join the conversation at climatechangecompass.org 3
Acronyms
DFID Department for International Development
gMJd Grams per megajoule delivered to the pot
g/min/L Grams per minute / litre
HH Household
HMG Her Majesty’s Government
ICF International Climate Finance
KPI Key Performance Indicator
KW Kilo Watt
M&E Monitoring & Evaluation
Mg/min Milligrams per minute
Mg/min/L Milligrams per minute / litre
MJ/min/L Megajoules per minute / litre
MtCO2 Metric Tonnes Carbon Dioxide
MW Mega Watt
PLF Plant Load Factor
SDGs Sustainable Development Goals
SE4All Sustainable Energy for All
SHS Solar Home System
SREP Scaling Up Renewable Energy Program in Low Income Countries
UNDP United Nations
Climate Change Compass helps the UK Government
monitor, evaluate and learn from UK International Climate Finance
Join the conversation at climatechangecompass.org 4
Number of people and social institutions with improved
access to clean energy as a result of ICF
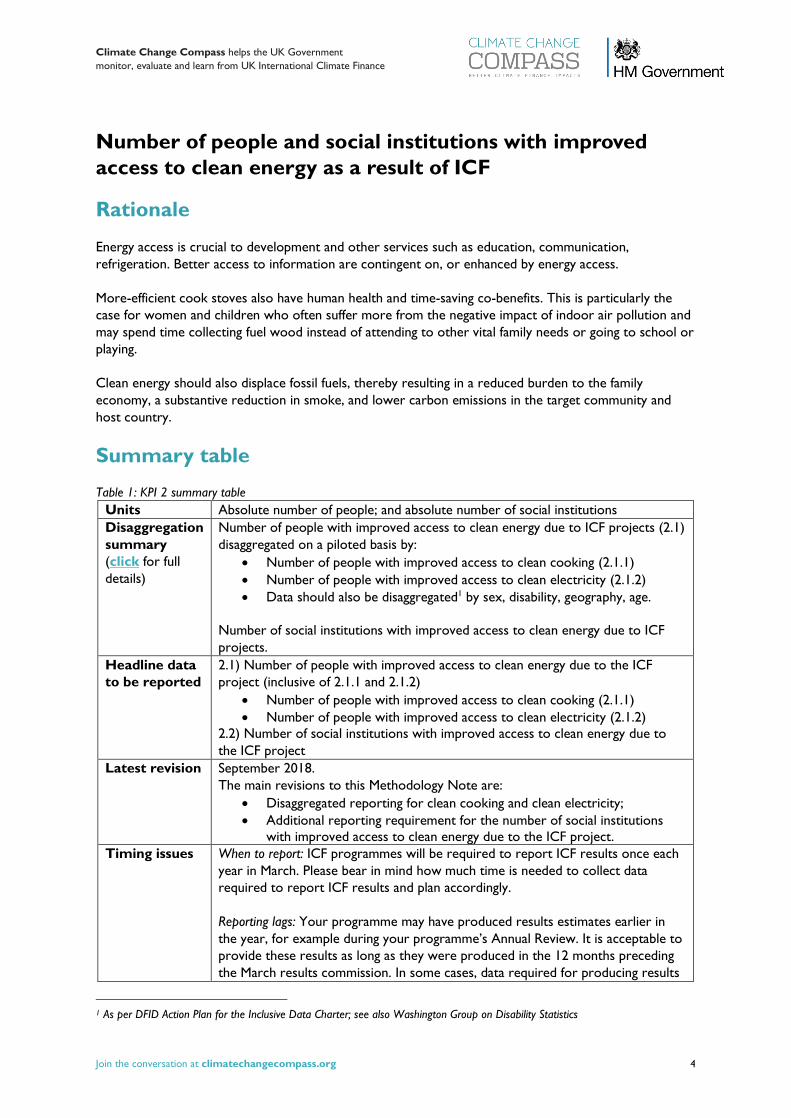
Rationale
Energy access is crucial to development and other services such as education, communication,
refrigeration. Better access to information are contingent on, or enhanced by energy access.
More-efficient cook stoves also have human health and time-saving co-benefits. This is particularly the
case for women and children who often suffer more from the negative impact of indoor air pollution and
may spend time collecting fuel wood instead of attending to other vital family needs or going to school or
playing.
Clean energy should also displace fossil fuels, thereby resulting in a reduced burden to the family
economy, a substantive reduction in smoke, and lower carbon emissions in the target community and
host country.
Summary table
Table 1: KPI 2 summary table
Units Absolute number of people; and absolute number of social institutions
Disaggregation
summary
(click for full
details)
Number of people with improved access to clean energy due to ICF projects (2.1)
disaggregated on a piloted basis by:
• Number of people with improved access to clean cooking (2.1.1)
• Number of people with improved access to clean electricity (2.1.2)
• Data should also be disaggregated1 by sex, disability, geography, age.
Number of social institutions with improved access to clean energy due to ICF
projects.
Headline data
to be reported
2.1) Number of people with improved access to clean energy due to the ICF
project (inclusive of 2.1.1 and 2.1.2)
• Number of people with improved access to clean cooking (2.1.1)
• Number of people with improved access to clean electricity (2.1.2)
2.2) Number of social institutions with improved access to clean energy due to
the ICF project
Latest revision September 2018.
The main revisions to this Methodology Note are:
• Disaggregated reporting for clean cooking and clean electricity;
• Additional reporting requirement for the number of social institutions
with improved access to clean energy due to the ICF project.
Timing issues When to report: ICF programmes will be required to report ICF results once each
year in March. Please bear in mind how much time is needed to collect data
required to report ICF results and plan accordingly.
Reporting lags: Your programme may have produced results estimates earlier in
the year, for example during your programme’s Annual Review. It is acceptable to
provide these results as long as they were produced in the 12 months preceding
the March results commission. In some cases, data required for producing results
1 As per DFID Action Plan for the Inclusive Data Charter; see also Washington Group on Disability Statistics

Climate Change Compass helps the UK Government
monitor, evaluate and learn from UK International Climate Finance
Join the conversation at climatechangecompass.org 5
estimates will be available after the results were achieved – if because of this,
results estimates are only available more than a year away from when results are
delivered, this should be noted in the results return.
Links across
the KPI
portfolio
There is a strong link with KPI 9 (Low Carbon Technologies disseminated) and
KPI 2 as all LCTs commercialised in KPI 9, as currently defined, will be for the
energy access market. There is transformational potential within KPI 2,
particularly with regards to the possible effect on market systems and the wider
effects of improved energy access (such as education), although success will only
be evident with a time lag. In this context, and as noted above, KPI 15 is
particularly important as a complement to KPI 2. There is a weaker link to KPI 5
(employment), which may be reported as a co-benefit at outcome level in
programmes, as well as KPI 11 and 12 (public/private finance leveraged) and KPI
14 (institutional knowledge).
Technical Definition
Clean energy access refers to:
• New household connections to off-grid renewable energy sources such as micro or mini-grids,
or solar home systems2
• Households that use more efficient cookstoves that materially improve energy efficiency of
essential services daily (e.g. air quality, reduced fuel consumption, fuel savings or improved family
income)
• Solar lamps and/or solar lanterns with or without chargers
Clean energy is generated from both combustible and non-combustible renewables. Non-combustible
renewables include: geothermal, solar, wind, hydro, tide and wave energy. Combustible renewables
include: biofuels (biogas, bioethanol, biodiesel); biomass products (fuelwood, vegetal waste, pulp and
paper waste, animal waste, bagasse); municipal waste (waste produced by the residential, commercial and
public service sectors that is collected by local authorities for disposal); and industrial waste.
Methodological Summary
Please report a total number of people at the household level with improved access to clean energy. This
should be the sum of the two sub-indicators3:
• # people with improved access to clean cooking (2.1.1)
• # people with improved access to clean electricity (2.1.2)
Note that an individual or household can be serviced twice (i.e. serviced for clean cooking and separately
for clean electricity) and should therefore be head-counted twice4.
Separately, the number of social institutions receiving improved access to clean energy should be
reported (2.2). For the purpose of KPI 2, Social Institutions are defined as: schools, universities, hospitals,
2 Note that on-grid access is not included in these figures because once energy access is on-grid, it is often difficult to
determine the energy source. However, where the on-grid energy source is known to be clean, we can report on clean
energy access based on the on-grid renewable energy sources. 3 Separate reporting on people with improved access to clean cooking and clean electricity will be piloted for a minimum of
one year before publishing. 4 This double counting is allowable to make the indicator easier to calculate (i.e. to enable adding 2.1.1 and 2.1.2 to get
2.1). It is very unlikely there will be instances where people will be served twice, in terms of both cooking and electricity.
Climate Change Compass helps the UK Government
monitor, evaluate and learn from UK International Climate Finance
Join the conversation at climatechangecompass.org 6
health centres, government institutions, state owned infrastructure (e.g. water pumps, state owned
business centres, etc.), and civil society organisations having physical infrastructure that benefits from
clean energy.
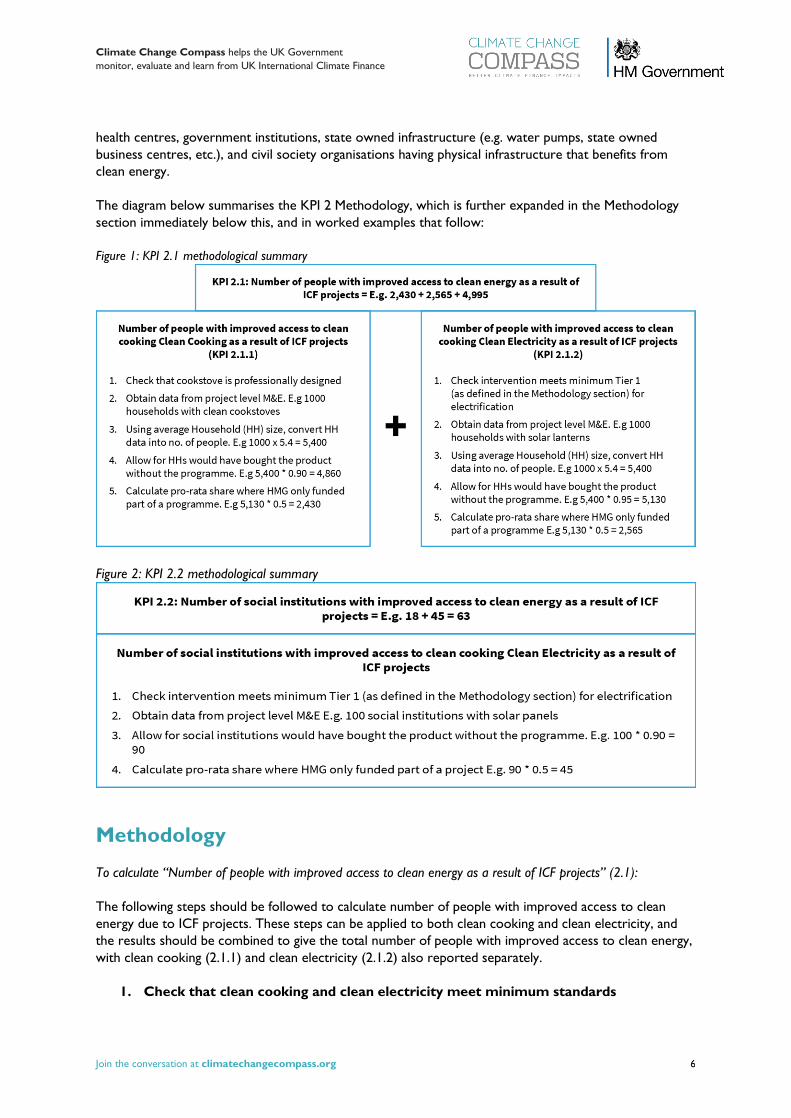
The diagram below summarises the KPI 2 Methodology, which is further expanded in the Methodology
section immediately below this, and in worked examples that follow:
Figure 1: KPI 2.1 methodological summary
Figure 2: KPI 2.2 methodological summary
Methodology
To calculate “Number of people with improved access to clean energy as a result of ICF projects” (2.1):
The following steps should be followed to calculate number of people with improved access to clean
energy due to ICF projects. These steps can be applied to both clean cooking and clean electricity, and
the results should be combined to give the total number of people with improved access to clean energy,
with clean cooking (2.1.1) and clean electricity (2.1.2) also reported separately.
1. Check that clean cooking and clean electricity meet minimum standards
Climate Change Compass helps the UK Government
monitor, evaluate and learn from UK International Climate Finance
Join the conversation at climatechangecompass.org 7
Check that cookstoves are professionally designed. This will serve as a proxy measure that they meet
minimum safety and emissions standards for cookstoves. Locally manufactured (‘artisanal’) cookstoves
that do not have a standardised design sometimes offer little or no improvement over a traditional (3-
stone) fire.
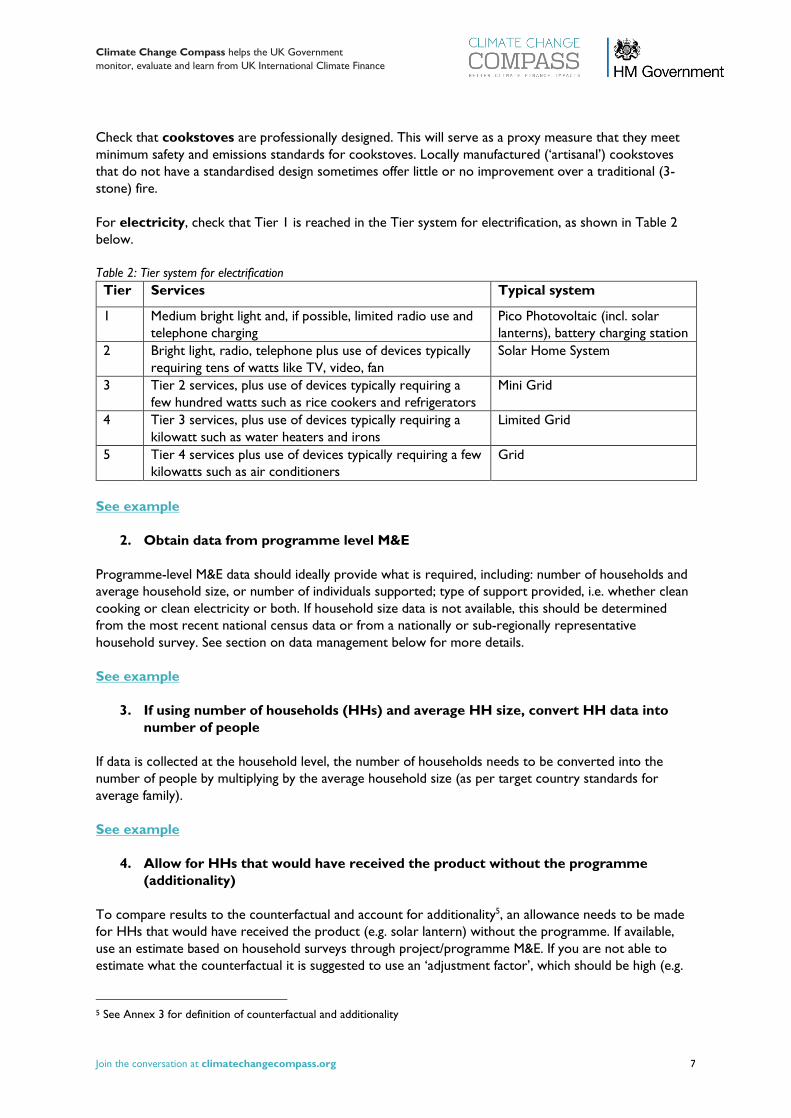
For electricity, check that Tier 1 is reached in the Tier system for electrification, as shown in Table 2
below.
Table 2: Tier system for electrification
Tier Services Typical system
1 Medium bright light and, if possible, limited radio use and
telephone charging
Pico Photovoltaic (incl. solar
lanterns), battery charging station
2 Bright light, radio, telephone plus use of devices typically
requiring tens of watts like TV, video, fan
Solar Home System
3 Tier 2 services, plus use of devices typically requiring a
few hundred watts such as rice cookers and refrigerators
Mini Grid
4 Tier 3 services, plus use of devices typically requiring a
kilowatt such as water heaters and irons
Limited Grid
5 Tier 4 services plus use of devices typically requiring a few
kilowatts such as air conditioners
Grid
See example
2. Obtain data from programme level M&E
Programme-level M&E data should ideally provide what is required, including: number of households and
average household size, or number of individuals supported; type of support provided, i.e. whether clean
cooking or clean electricity or both. If household size data is not available, this should be determined
from the most recent national census data or from a nationally or sub-regionally representative
household survey. See section on data management below for more details.
See example
3. If using number of households (HHs) and average HH size, convert HH data into
number of people
If data is collected at the household level, the number of households needs to be converted into the
number of people by multiplying by the average household size (as per target country standards for
average family).
See example
4. Allow for HHs that would have received the product without the programme
(additionality)
To compare results to the counterfactual and account for additionality5, an allowance needs to be made
for HHs that would have received the product (e.g. solar lantern) without the programme. If available,
use an estimate based on household surveys through project/programme M&E. If you are not able to
estimate what the counterfactual it is suggested to use an ‘adjustment factor’, which should be high (e.g.
5 See Annex 3 for definition of counterfactual and additionality

Climate Change Compass helps the UK Government
monitor, evaluate and learn from UK International Climate Finance
Join the conversation at climatechangecompass.org 8
95%) if you are confident your results are additional, and your data quality is good. A lower ‘adjustment
factor’ (e.g. 50%) should be used if you have a lot of uncertainty and there are other partners in the area
undertaking similar activities.
See example
5. Calculate pro-rata share where HMG only funded part of the programme
(attribution)
If HMG is the sole investor in a project or programme, it should assume all responsibility for any results
(where the results are assessed to be additional and where HMG has a causal role).
In many instances HMG may be acting alongside one or more other development partners or multilateral
bodies that also provide funding or support for projects or programmes – and where each partner has
played a role towards the results. In these cases, HMG should only claim responsibility for the portion of
results that can be attributed to its support.
If HMG is only funding part of a project/programme, reporters should calculate results as a pro-
rata attributable share based on the value of all public co-financing towards the project.
In instances where ICF programmes leverage (public or private) finance that helps to deliver programme
results, please contact your central ICF teams on how to address attribution of results delivered. See
methodology notes for KPI 11 and 12 for definitions (of public, private, and leveraged finance and co-
finance).
If HMG is contributing to a fund
‘First best’ approach: use project/programme level attribution (as above)
In this approach, reporters calculate results attributable to the UK for each project/programme
implemented by the fund using the project/programme level attribution approach, and then sum results
across all projects/programmes in the fund to reach total UK attributable results.
This approach allows for recognition of other co-finance contributions at the project/programme level.
However, this approach may be complicated or not always possible in practice as it relies on (i) full
information about project/programme level inputs, (ii) additional work to calculate results at the
project/programme level.
‘Second best’ approach: use fund-level attribution
Reporters apply fund-level attribution (i.e. at point of UK investment) for reporting results. I.e. results
should be shared across all donors that contribute to a fund. All results are attributable to the relevant
fund (e.g. CIFs, CP3, GAP) regardless of whether these funds blend with other sources of finance in
implementing projects at levels below the point of UK investment. This approach assumes that any
further finance towards the project is counted as leveraged. Where this is known to not be the case, a
more conservative approach to attribution may be appropriate, please contact your central ICF teams on
further guidance.
While this is the less preferred approach as it does not recognise additional contributions at the
project/programme level, it may be more practical to implement where full data on project/programme
level inputs is not available.
Note: The distinction between attribution at the project/programme level and at the fund level (or at
point of UK investment) is only an issue where the UK is investing in funds where there are multiple
investment levels.
See example
Climate Change Compass helps the UK Government
monitor, evaluate and learn from UK International Climate Finance
Join the conversation at climatechangecompass.org 9
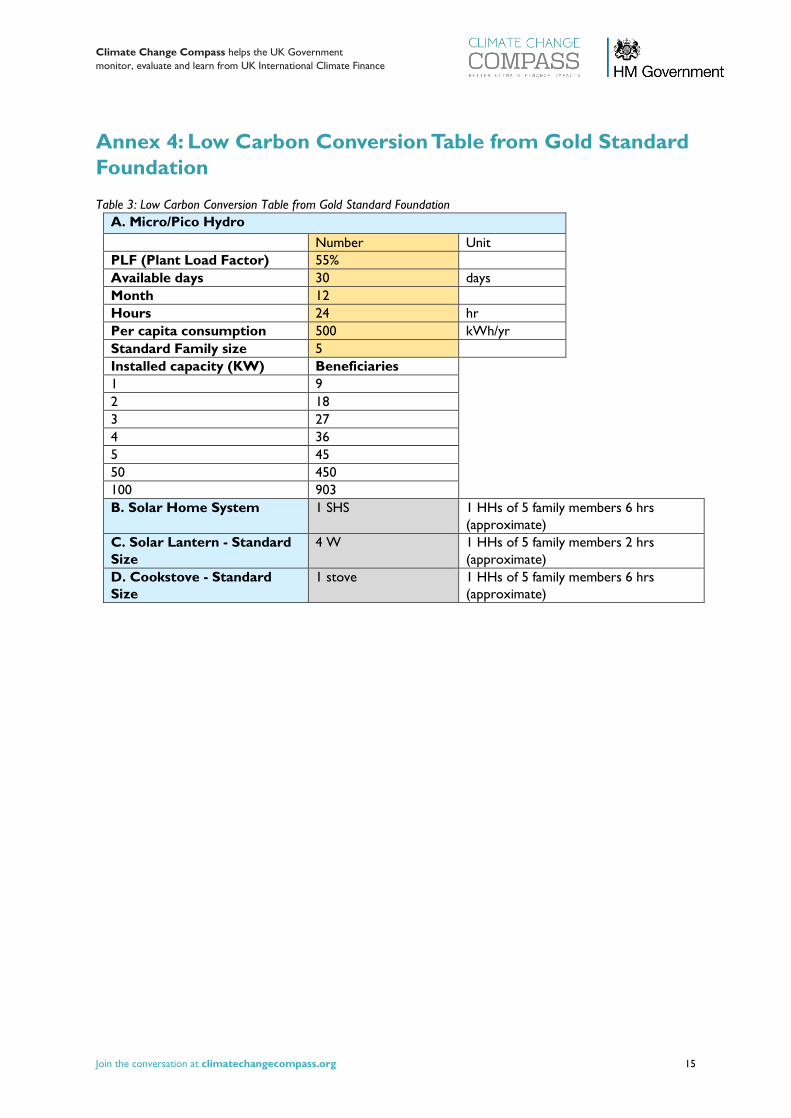
Alternative to above methodology: Converting KPI 9 into KPI 2
If only the absolute number of units of low carbon technologies installed are known and there is no
household data (i.e. just KPI 9 data available), then the Gold Standard Foundation’s Low Carbon
Conversion Table in Annex 4 can be used to estimate the number of beneficiaries for Micro/Pico Hydro,
Solar Home Systems, Solar Lanterns and Cookstoves. Steps 1, 4 and 5 referenced above still need to be
followed.
To calculate “Number of social institutions with improved access to clean energy as a result of ICF projects” (2.2):
The following steps should be used to calculate the number of social institutions with improved access to
clean energy as a result of ICF projects. These steps can be applied to both clean cooking and clean
electricity, and the results should be combined to give the total number of social institutions with
improved access to clean energy.
1. Check intervention meets minimum Tier 1 for electrification performance
See step 1 in “Number of people with improved access to clean energy as a result of ICF projects”
section above.
2. Obtain data from project level M&E
See step 2 in “Number of people with improved access to clean energy as a result of ICF projects”
section above.
3. Allow for social institutions that would have received the product without the
programme
See step 4 in “Number of people with improved access to clean energy as a result of ICF projects”
section above.
4. Calculate pro-rata share where HMG only funded part of the programme
See step 5 in “Number of people with improved access to clean energy as a result of ICF projects”
section above.
Worked Example
Worked example 1 (KPI 2.1)
Based on a fictitious programme where ICF co-financed a project to provide 1,000 households with solar
lanterns.
1. Check that clean cooking and clean electricity meet minimum standards
The solar lanterns fall within Tier 1 of electrification (see Table 2 above)
2. Obtain data from programme level M&E
Based on household surveys conducted through programme M&E, an estimate of 5% of these HHs would
have received solar lanterns anyway, so assume 95% of households were supported in addition to what
would have happened without the project/programme.

Climate Change Compass helps the UK Government
monitor, evaluate and learn from UK International Climate Finance
Join the conversation at climatechangecompass.org 10
3. If using number of households (HHs) and average HH size, convert HH data into
number of people
The average HH size is taken from national census data for the region and is found to be 5.4 (*where this
data does not exist, the project should seek to survey a large enough sample to establish average HH size, and to
enable disaggregation by income level).
Therefore, HH size converted into people is 1,000HH * 5.4 = 5,400
4. Allow for HHs that would have received the product without the programme
(additionality)
The number of people that have improved access to clean energy is: Number of households supported x
factor for additionality adjustment x average household size = 1,000HH * 0.95 * 5.4 = 5,130 people that
have improved access to clean energy.
5. Calculate pro-rata share where HMG only funded part of the programme
(attribution)
As DFID only funded 50% of the project, 2,565 beneficiaries can be attributed to the ICF.
*See Annex 1 for a worked example on the number of social institutions with improved access to clean energy as
a result of ICF projects
Data Management
Data sources
Some data will be available directly from programmes, for example from project-level M&E (e.g.
household surveys, project reporting). Data on household size should be determined from the most
recent national census data or from a nationally or sub-regionally representative household survey.
Ideally, the duty to collect data should be the responsibility of recipients of ICF funding, or a third-party
auditing entity. This information will need to be kept up to date by liaising with programme managers.
Most recent baseline
The reporting baseline should reflect pre-project status before ICF funding, and contain projections of
what would happen without the ICF. For long-running programmes, the baseline should be taken as 2015
unless otherwise stated. The baseline should align with the economic appraisal in the project design.
Quality assurance
All results estimates should be quality assured before they are submitted during the annual ICF results
return, ideally at each stage data is received or manipulated. For example, if data is provided by partners,
this data should be interrogated by the ICF programme team for accuracy, or at the very least data
should be sense checked for plausibility. When converting any provided data into KPI results data, quality
assurance should be undertaken by someone suitable and not directly involved in the reporting
programme. Suitable persons vary by department; this could be an analyst, a results / stats / climate and
environment adviser / economist.
Central ICF analysts will quality assure results that are submitted and this may lead to follow up requests
during this stage.

Climate Change Compass helps the UK Government
monitor, evaluate and learn from UK International Climate Finance
Join the conversation at climatechangecompass.org 11
To avoid inherent reporting biases, it is strongly recommended that, where possible, data collection is
undertaken by a third party that is not directly involved with implementing the project. Where not
possible, consider using independent evaluations or alternative means to periodically check the validity of
results claims.
Any concerns about data quality or other concerns should be raised with your departmental ICF analysts
and recorded in documentation related to your results return.
Additional points to note
On-grid electricity: It is generally not possible to disaggregate grid electricity by source (clean vs. fossil).
Furthermore, providing additional energy to the grid does not necessarily translate into improved energy
access, unless new connections were simultaneously established in the target populations. This KPI 2
indicator therefore excludes an assessment of on-grid energy access. Any measurements of energy access
are likely to be conservative and be a subset of results as improved access to the grid cannot be
measured directly.
Data Disaggregation
HMG is strongly committed to the principle that “every person counts and should be counted.” It has
endorsed the United Nations Global Partnership for Development Data, and is now operationalising this
commitment. HMG has prioritised four disaggregation axes, which are required for all programmes going
forward. While HMG encourages all programmes to disaggregate data by these four axes to the extent
that it is feasible, the requirement is not retroactive to programmes with logframes finalized prior to
publication of the July 2018 DFID Inclusive Data Charter Action Plan. Disaggregation should only apply to
direct beneficiaries.
Sex
Programmes should disaggregate by males/females. Disaggregation should be based on actual data, not
models or estimates.
• Report:
o # male direct beneficiaries
o # female direct beneficiaries
o Disaggregated data by sex is not feasible to collect
Disability
Programmes should incorporate the Washington Group “short set” of six disability questions to their
population surveys6. These questions and further guidance for them can be found at:
http://www.washingtongroup-disability.com/washington-group-question-sets/short-set-of-
disability-questions/. While all HMG programmes are expected to apply and track all six survey
questions in beneficiary surveys, at the KPI level HMG expects reporting towards two categories: disabled
and not disabled. Anyone who answers “a lot of difficulty” or “cannot do it all” to one or more of the six
questions should be counted as disabled.
• Report:
o # disabled direct beneficiaries
6 The Washington Group was established under the United Nations Statistical Commission in 2001 to address the need
for cross-nationally comparable population-based measures on disability. It is composed of representatives of National
Statistical Offices around the world.

Climate Change Compass helps the UK Government
monitor, evaluate and learn from UK International Climate Finance
Join the conversation at climatechangecompass.org 12
o # not disabled direct beneficiaries
o Disaggregated data by disability is not feasible to collect
o Programme is not required to report disaggregated data because logframe was finalised prior to
July 2018
Geography
At the KPI level, all programmes should report on whether beneficiaries are urban or rural.
• Report:
o # of urban direct beneficiaries
o # of rural direct beneficiaries
o Disaggregated data by geography is not feasible to collect
o Programme is not required to report disaggregated data because logframe finalised prior to July
2018
While the concepts of “urban” and “rural” are easily understood, in an era of migration and burgeoning
peri-urban populations, the distinctions may blur in many cases. Moreover, there are substantial
differences between how various countries approach this question, and there is no internationally-agreed
upon definition. For statistical purposes, HMG (and the United Nations) allows each country to define
urban and rural individually. You should follow the definitions set for your country by its National
Statistics Office (or equivalent agency).
Age
Whilst all programmes are expected to collect and analyse detailed data on the age of beneficiaries (see
DFID Guidance on Disaggregating Programme Data by Age), at the KPI level ICF-affiliated programmes
should report numbers consolidated into four categories: children, youth, adults, and elders.
• Report:
o # of child direct beneficiaries (age 0-14)
o # of youth direct beneficiaries (age 15-24)
o # of adult direct beneficiaries (age 25-64)
o # of elder direct beneficiaries (age 65+)
o Disaggregated data by age is not feasible to collect
o Programme is not required to report disaggregated data because logframe finalised prior to July 2018
Note: As of the August 2018 writing of this Disaggregation Guideline, HMG is prioritising these four data
disaggregation axes. However, it is committed to ultimately disaggregating data to the full suite of eight
axes (i.e., income, age, sex, race, ethnicity, migratory status, disability, and geography) as advocated by the
United Nations. As such, disaggregation guidance may be expanded in the coming years, probably
beginning with income.
Climate Change Compass helps the UK Government
monitor, evaluate and learn from UK International Climate Finance
Join the conversation at climatechangecompass.org 13
Annex 1: Further worked example
Worked example 2 (KPI 2.2)
Based on a fictitious programme where ICF co-financed a programme to provide 20 health centres with
solar-powered refrigerators.
To estimate results:
1. Check intervention meets minimum Tier 1 for electrification performance
DFID co-financed a programme to provide 20 health centres with solar-powered refrigerators, which fall
within Tier 3 of electrification (see Table 2).
2. Obtain data from project level M&E
Based on surveys through project M&E, an estimate of 5% of these social institutions would have received
solar-powered refrigerators anyway, so assume 95% of health centres were supported in addition to
what would have happened without the project/programme.
3. Allow for social institutions that would have received the product without the
programme
Therefore, the number of social institutions that have improved access to clean energy is: Number of
social institutions supported x [factor for additionality adjustment] = 20 *0.95 = 18 social institutions that
have improved access to clean energy.
4. Calculate pro-rata share where HMG only funded part of the programme
As DFID funded only 50% of the project, 9 social institutions can be attributed to the ICF.
Annex 2: Comparability and synergies with other external
indicators
KPI 2 directly relates to Sustainable Development Goal 7: “Ensure access to affordable, reliable,
sustainable and modern energy for all”. SDG 7 targets are:
• 7.1: By 2030, ensure universal access to affordable, reliable and modern energy services;
• 7.2: By 2030, increase substantially the share of renewable energy in the global energy mix;
• 7.3: By 2030, double the global rate of improvement in energy efficiency.
Note that SDG Target 7.1 does not include a ‘clean’ aspect, so while ICF initiatives (reporting to KPI 2)
clearly contribute to SDG Target 7.1, mitigation objectives have also been linked directly with the ICF
energy access agenda (i.e. ‘clean energy’, not just ‘energy’). By contrast, the SDG energy targets have
‘clean’ objectives falling separately under SDG 7.2 (Renewable Energy) and, to an indirect extent, 7.3
(Energy Efficiency).
ICF initiatives reporting against KPI 2 for the (clean, off-grid) subset of the proposed SDG Target 7.1 will
contribute directly to both 7.1 indicators:
Climate Change Compass helps the UK Government
monitor, evaluate and learn from UK International Climate Finance
Join the conversation at climatechangecompass.org 14
• Indicator 7.1.1: Percentage of population with access to electricity
• Indicator 7.1.2: Proportion of population with primary reliance on clean fuels and technology
KPI 2’s explicit link to KPI 6 (mitigation) results in there being minor inconsistency with SDG Targets7,
but KPI 2 results can be used directly as contributing to SDG 7 Indicators 7.1.1 and 7.1.2. Therefore, KPI
2 is well-aligned with the SDGs, and is likely to remain pertinent to climate and development until 2030.
Annex 3: Definitions of key methodological terms used
across Methodology Notes
As different HMG departments may use the same terminology to refer to different concepts, this section
sets out definitions for key terms used across Methodology Notes for ICF KPIs. The terms used in these
notes refer to the concepts as defined below, rather than to alternative, department-specific usages of
these terms.
Counterfactual: The situation one might expect to have prevailed at the point in time in which a
programme is providing results, under different conditions. Commonly, this is used to refer to a ‘business
as usual’ (BAU) counterfactual case that would have been observed if the ICF-supported intervention had
not taken place.
Additionality: Impacts or results are additional if they are beyond the results that would have occurred
in the absence of the ICF-supported intervention. That is, results are additional if they go beyond what
would have been expected under a BAU counterfactual.
Causality: Causality refers to the assessment that one or more actors bear responsibility for additional
results or impacts, because of funding provided though the ICF or actions taken under an ICF
programme. Multiple development partners may be assessed to have played a causal role in delivering
results.
Attribution: Attribution refers to allocating responsibility for impacts or results among all actors that
have played a causal role in programmes that deliver additional results. Results are commonly attributed
to causal actors based on their financial contributions to programmes (though there may be cases where
greater nuance is needed, as with KPI 11 and KPI 12).
7 That is, ICF requires ‘clean’ energy access, while SDGs require an increase in renewable energy, but could include fossil-
fuel energy access as a subset of Goal 7.
Climate Change Compass helps the UK Government
monitor, evaluate and learn from UK International Climate Finance
Join the conversation at climatechangecompass.org 15
Annex 4: Low Carbon Conversion Table from Gold Standard
Foundation
Table 3: Low Carbon Conversion Table from Gold Standard Foundation
A. Micro/Pico Hydro
Number Unit
PLF (Plant Load Factor) 55%
Available days 30 days
Month 12
Hours 24 hr
Per capita consumption 500 kWh/yr
Standard Family size 5
Installed capacity (KW) Beneficiaries
1 9
2 18
3 27
4 36
5 45
50 450
100 903
B. Solar Home System 1 SHS 1 HHs of 5 family members 6 hrs
(approximate)
C. Solar Lantern - Standard
Size
4 W 1 HHs of 5 family members 2 hrs
(approximate)
D. Cookstove - Standard
Size
1 stove 1 HHs of 5 family members 6 hrs
(approximate)
Climate Change Compass helps the UK Government
monitor, evaluate and learn from UK International Climate Finance
Join the conversation at climatechangecompass.org 16
Photo credits
Photos used in this KPI guidance note series were sourced from two websites, Climate Visuals and Unsplash (except the
photo for KPI 14 which belongs to IMC Worldwide). They are available for use under a Creative Commons license, which
enables organisations provided that photographers are credited. Photographers for this KPI guidance note series are
credited below.
KPI 1, Kenya. Georgina Smith / CIAT
KPI 2, Bhutan. Asian Development Bank.
KPI 4, Indonesia. Sigit Deni Sasmito/CIFOR.
KPI 5, Afghanistan. Asian Development Bank.
KPI 6 Roshni Sidapara.
KPI 7, Sri Lanka. Sansoni / World Bank. Photo ID: DSA0020SLA World Bank.
KPI 9, Abbie Trayler-Smith / Panos Pictures / Department for International Development.
KPI 11, Sri Lanka. Dominic Sansoni / World Bank. Photo ID: DSA0233SLA World Bank
KPI 12, Samuel Zeller. Solar panels.
KPI 13, Bangladesh. Sajid Chowdhury / Big Blue Communications. 2013
KPI 14, Rawpixel
KPI 15, Ryan Searle.
KPI 16 Alessandro Bianchi